

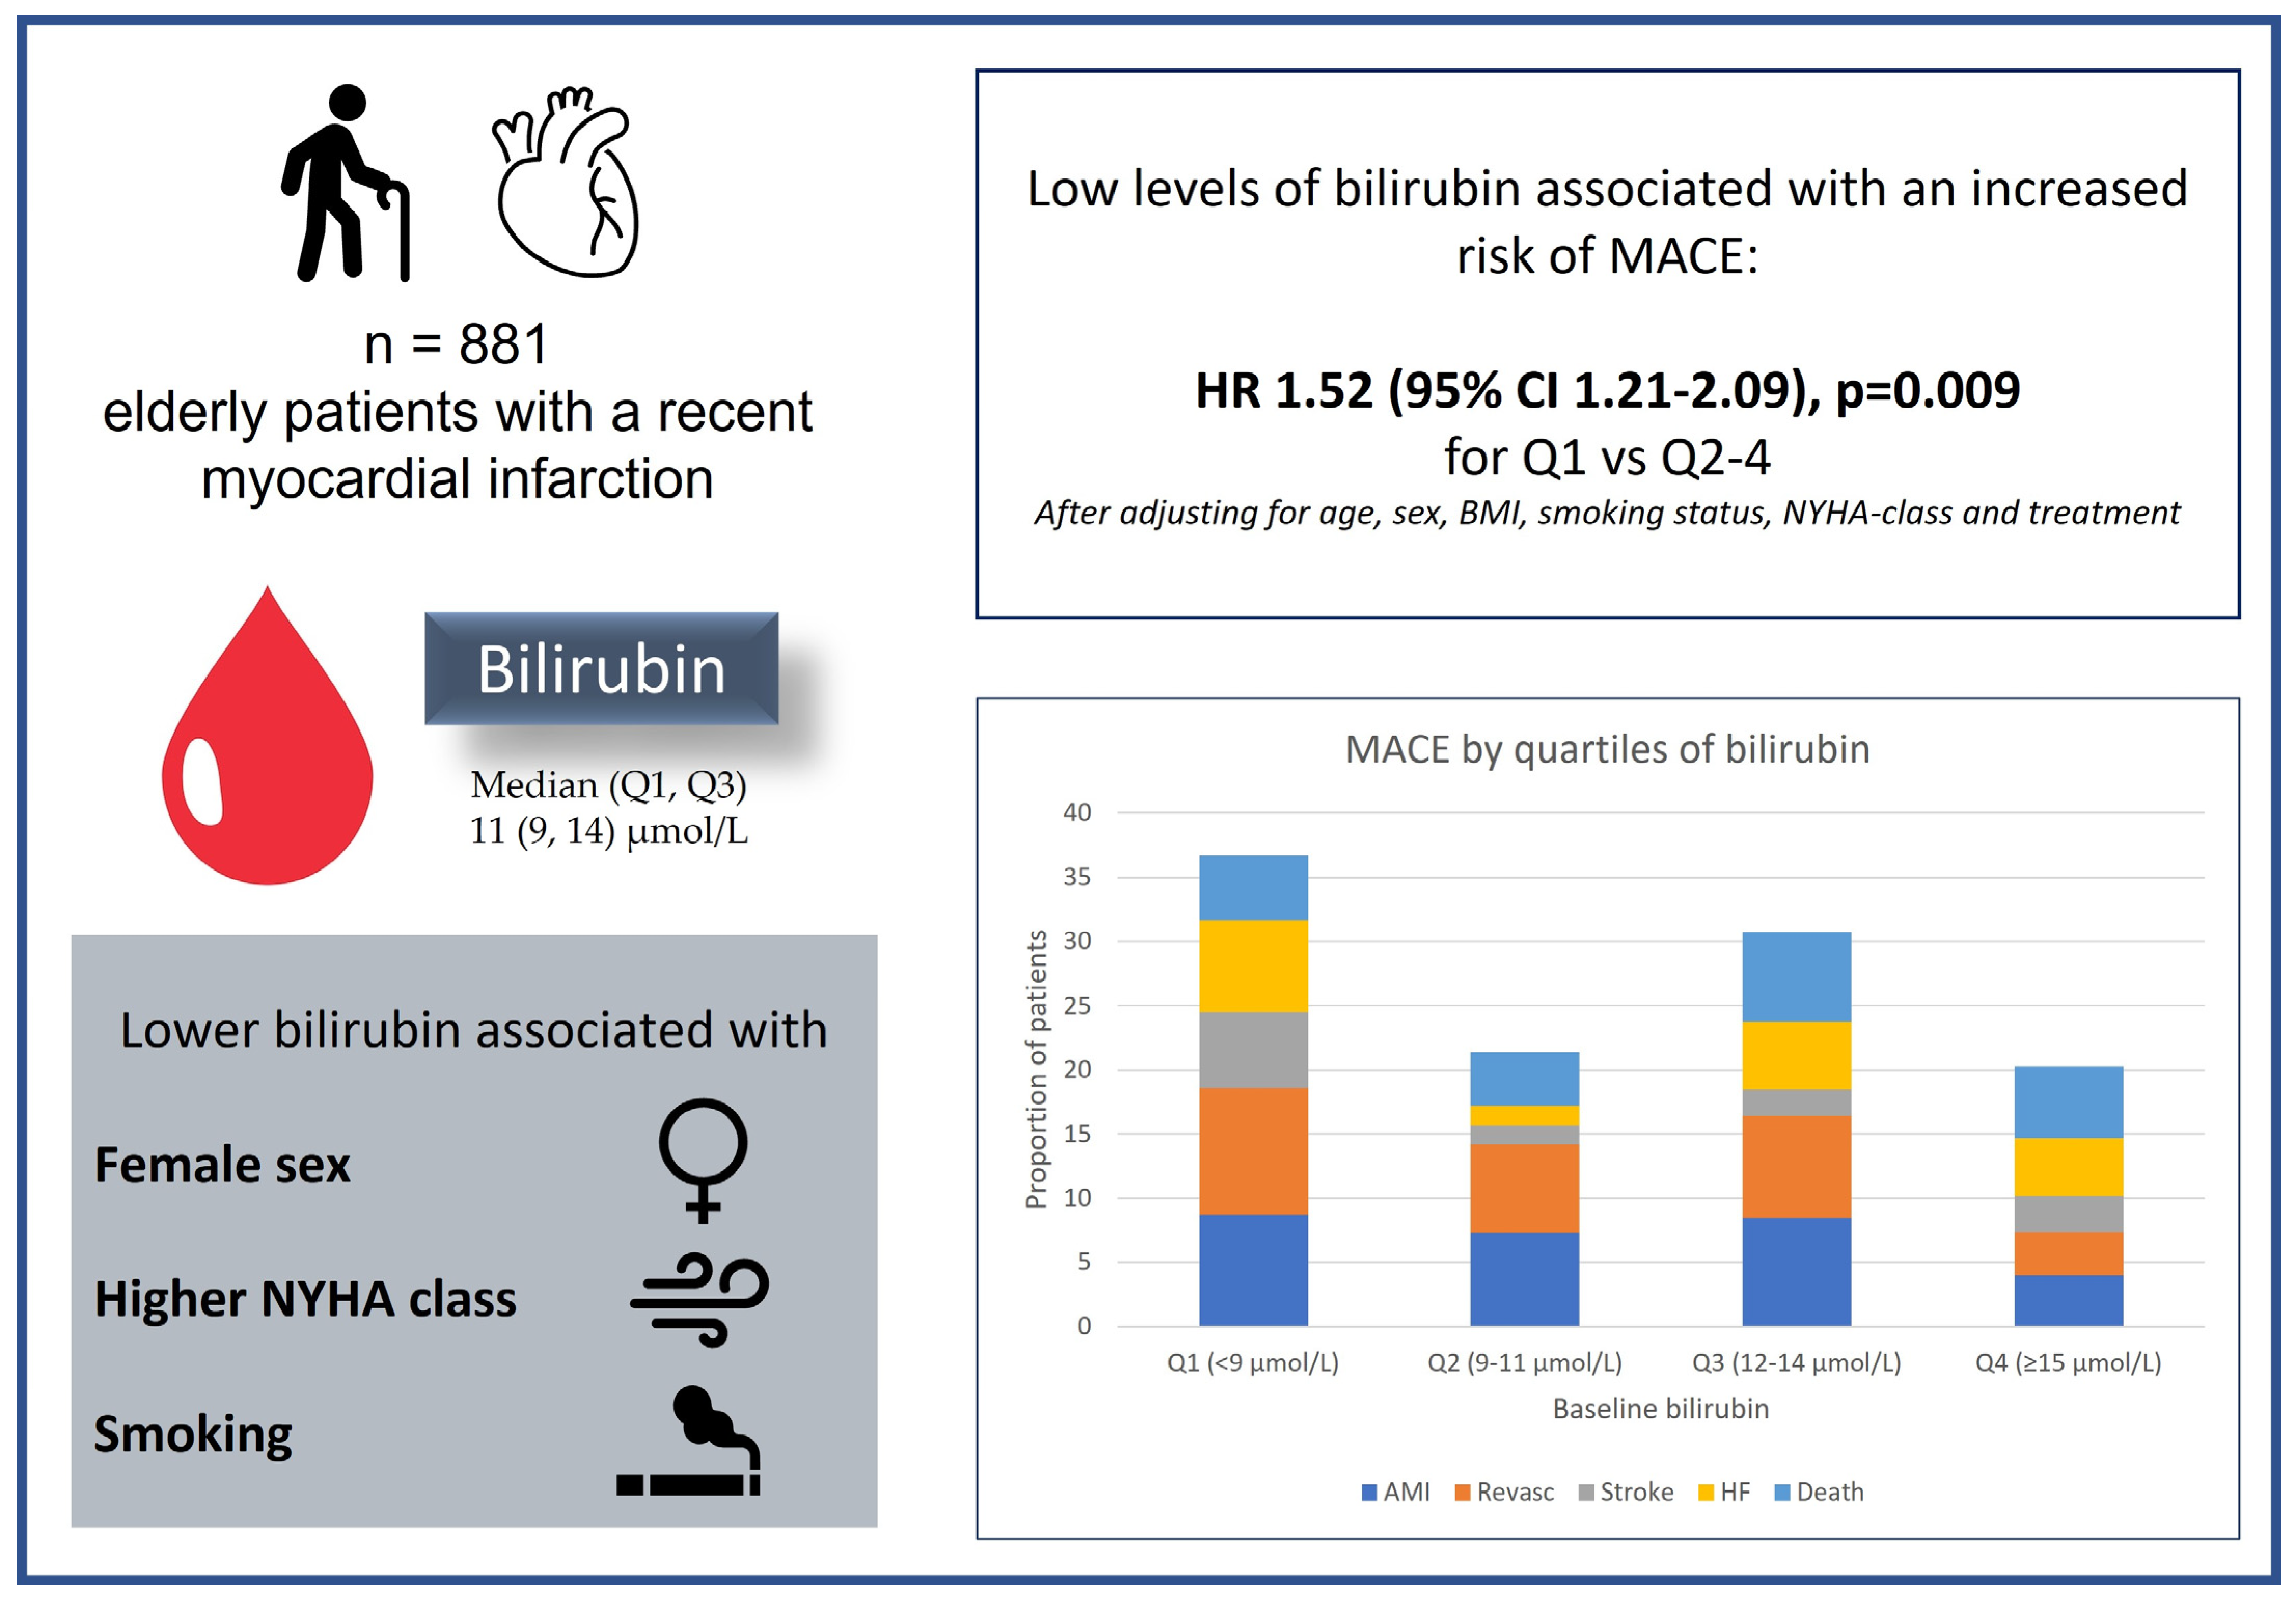
Total Bilirubin Yields Prognostic Information Following a Myocardial Infarction in the Elderly

 ,
,  ,
,
Abstract

1. Introduction
2. Methods
Statistics
3. Results
4. Discussion
5. Limitation
Author Contributions
Funding
Institutional Review Board Statement
Informed Consent Statement
Data Availability Statement
Acknowledgments
Conflicts of Interest
Steering Committee
Data and Safety Monitoring Board
References
- Kalakonda, A.; Jenkins, B.A.; John, S. Physiology, Bilirubin. In StatPearls; StatPearls Publishing: Treasure Island, FL, USA, 2022. [Google Scholar]
- Creeden, J.F.; Gordon, D.M.; Stec, D.E.; Hinds, T.D., Jr. Bilirubin as a metabolic hormone: The physiological relevance of low levels. Am. J. Physiol. Endocrinol. Metab. 2021, 320, E191–E207. [Google Scholar] [CrossRef] [PubMed]
- Stocker, R.; Yamamoto, Y.; McDonagh, A.F.; Glazer, A.N.; Ames, B.N. Bilirubin is an antioxidant of possible physiological importance. Science 1987, 235, 1043–1046. [Google Scholar] [CrossRef]
- Wu, T.-W.; Fung, K.P.; Wu, J.; Yang, C.-C.; Weisel, R.D. Antioxidation of human low density lipoprotein by unconjugated and conjugated bilirubins. Biochem. Pharmacol. 1996, 51, 859–862. [Google Scholar] [CrossRef] [PubMed]
- Bulmer, A.C.; Bakrania, B.; Du Toit, E.F.; Boon, A.-C.; Clark, P.J.; Powell, L.W.; Wagner, K.-H.; Hendrick, J.P. Bilirubin acts as a multipotent guardian of cardiovascular integrity: More than just a radical idea. Am. J. Physiol. Heart Circ. Physiol. 2018, 315, H429–H447. [Google Scholar] [CrossRef] [PubMed]
- Breimer, L.H.; Wannamethee, G.; Ebrahim, S.; Shaper, A.G. Serum bilirubin and risk of ischemic heart disease in middle-aged British men. Clin. Chem. 1995, 41, 1504–1508. [Google Scholar] [CrossRef]
- Troughton, J.A.; Woodside, J.V.; Young, I.S.; Arveiler, D.; Amouyel, P.; Ferrières, J.; Ducimètiere, P.; Patterson, C.C.; Kee, F.; Yarnell, J.W.G.; et al. Bilirubin and coronary heart disease risk in the Prospective Epidemiological Study of Myocardial Infarction (PRIME). Eur. J. Cardiovasc. Prev. Rehabil. 2007, 14, 79–84. [Google Scholar] [CrossRef]
- Zuo, L.; Huang, J.; Zhang, H.; Huang, B.; Wu, X.; Chen, L.; Xia, S.; Dong, X.; Hao, G. Dose-response association between bilirubin and cardiovascular disease: A systematic review and meta-analysis. Angiology 2022, 73, 911–919. [Google Scholar] [CrossRef]
- Novotny, L.; Vitek, L. Inverse relationship between serum bilirubin and atherosclerosis in men: A meta-analysis of published studies. Exp. Biol. Med. 2003, 228, 568–571. [Google Scholar] [CrossRef]
- Chen, S.-C.; Lin, C.-P.; Hsu, H.-C.; Shu, J.-H.; Liang, Y.; Hsu, P.-F.; Wang, Y.-J.; Ding, Y.-Z.; Liou, T.-L.; Wang, Y.-W.; et al. Serum bilirubin improves the risk predictions of cardiovascular and total death in diabetic patients. Clin. Chim. Acta 2019, 488, 1–6. [Google Scholar] [CrossRef]
- Horsfall, L.J.; Nazareth, I.; Petersen, I. Cardiovascular events as a function of serum bilirubin levels in a large, statin-treated cohort. Circulation 2012, 126, 2556–2564. [Google Scholar] [CrossRef]
- Cao, Y.-X.; Liu, H.-H.; Li, S.; Zhang, M.; Guo, Y.-L.; Wu, N.-Q.; Zhu, C.-G.; Dong, Q.; Qian, J.; Li, J.-J. Circulating total bilirubin and long-term prognosis in patients with previous myocardial infarction. JACC Asia 2023, 3, 242–251. [Google Scholar] [CrossRef] [PubMed]
- Boland, B.; Dong, M.H.; Bettencourt, R.; Barret-Connor, E.; Loomba, R. Association of serum bilirubin with aging and mortality. J. Clin. Exp. Hepatol. 2014, 4, 1–7. [Google Scholar] [CrossRef] [PubMed]
- Kalstad, A.; Myhre, P.L.; Laake, K.; Tveit, S.H.; Schmidt, E.B.; Smith, P.; Nilsen, D.W.T.; Tveit, A.; Fagerland, M.W.; Solheim, S.; et al. Effects of n-3 fatty acid supplements in elderly patients after myocardial infarction. A randomized controlled trial. Circulation 2021, 143, 528–539. [Google Scholar] [CrossRef] [PubMed]
- Laake, K.; Myhre, P.; Nordby, L.M.; Seljeflot, I.; Abdelnoor, M.; Smith, P.; Tveit, A.; Arnesen, H.; Solheim, S. Effects of ω3 supplementation in elderly patients with acute myocardial infarction: Design of a prospective randomized placebo controlled study. BMC Geriatr. 2014, 14, 74. [Google Scholar] [CrossRef]
- Zucker, S.D.; Horn, P.S.; Sherman, K.E. Serum bilirubin levels in the U.S. population: Gender effect and inverse correlation with colorectal cancer. Hepatology 2004, 40, 827–835. [Google Scholar] [CrossRef]
- Kipp, Z.A.; Xu, M.; Bates, E.A.; Lee, W.-H.; Kern, P.A.; Hinds, T.D., Jr. Bilirubin levels are negatively correlated with adiposity in obese men and women, and its catabolized product, urobilin, is positively associated with insulin resistance. Antioxidants 2023, 12, 170. [Google Scholar] [CrossRef]
- Xiong, Q.; Shuai, W.; Zhou, C.-l.; Dong, W. Circulating bilirubin level is determined by both erythrocyte amounts and the proportion of aged erythrocytes in ageing and cardiovascular diseases. Biomed. Pharmacother. 2020, 123, 109744. [Google Scholar] [CrossRef]
- Dullaart, R.P.F.; de Vries, R.; Lefrandt, J.D. Increased large VLDL and small LDL particles are related to lower bilirudin in Type 2 diabetes mellitus. Clin. Biochem. 2014, 47, 170–175. [Google Scholar] [CrossRef]
- Tapan, S.; Karadurmus, N.; Dogru, T.; Ercin, C.N.; Tasci, I.; Bilgi, C.; Kurt, I.; Erbil, M.K. Decreased small dense LDL levels in Gilbert’s syndrome. Clin. Biochem. 2011, 44, 300–303. [Google Scholar] [CrossRef]
- Stender, S.; Frikke-Schmidt, R.; Nordestgaard, B.G.; Grande, P.; Tybjærg-Hansen, A. Genetically elevated bilirubin and risk of ischaemic heart disease: Three Mendelian randomization studies and a meta-analysis. J. Intern. Med. 2013, 273, 59–68. [Google Scholar] [CrossRef]
- Vitek, L. The role of bilirubin in diabetes, metabolic syndrome, and cardiovascular disease. Front. Pharmacol. 2012, 3, 55. [Google Scholar] [CrossRef] [PubMed]
- Stec, D.E.; Trabbic, J.K.; Luniwal, A.; Hankins, M.W.; Baum, J.; Hinds, T.D., Jr. Bilirubin binding to PPARα inhibits lipid accumulation. PLoS ONE 2016, 11, e0153427. [Google Scholar] [CrossRef] [PubMed]
- Chiabrando, D.; Vinchi, F.; Florito, V.; Mercurio, S.; Tolosano, E. Heme in pathopysiology: A matter of scavenging, metabolism and trafficing across cell membranes. Front. Pharmacol. 2014, 5, 61. [Google Scholar] [CrossRef]
- Lavrovsky, Y.; Song, C.S.; Chatterjee, B.; Roy, A.K. Age-dependent increase of heme oxygenase-1 gene expression in the liver mediated by NF-κB. Mech. Ageing Dev. 2000, 114, 49–60. [Google Scholar] [CrossRef]
- Patriarca, S.; Furfaro, A.L.; Cosso, L.; Maineri, E.P.; Balbis, E.; Domenicotti, C.; Nitti, M.; Cottalasso, D.; Marinari, U.M.; Pronzato, M.A.; et al. Heme oxygenase 1 expression in rat liver during ageing and ethanol intoxication. Biogerontology 2007, 8, 365–372. [Google Scholar] [CrossRef] [PubMed]
- Exner, M.; Minar, E.; Wagner, O.; Schillinger, M. The role of heme oxygenase-1 promotor polymorphisms in human disease. Free Radic. Biol. Med. 2004, 37, 1097–1104. [Google Scholar] [CrossRef] [PubMed]
- Immenschuh, S.; Schrøder, H. Heme oxygenase-1 and cardiovascular disease. Histol. Histopathol. 2006, 21, 679–685. [Google Scholar] [PubMed]
- Stocker, R.; Perrella, M.A. Heme-Oxygenase-1. A novel drug target for athersclerotic diseases? Circulation 2006, 114, 2178–2179. [Google Scholar] [CrossRef]
- Bao, W.; Song, F.; Li, X.; Rong, S.; Yang, W.; Wang, D.; Xu, J.; Fu, J.; Zhao, Y.; Liu, L. Association between heme-oxygenase-1 gene promotor polymorphisms and type-2 diabetes mellitus: A HuGe review and meta-analysis. Am. J. Epidemiol. 2010, 172, 631–636. [Google Scholar] [CrossRef]
- Alam, J.; Igarashi, K.; Immenschuh, S.; Shibahara, S.; Tyrrell, R.M. Regulation of heme oxygenase-1 gene transcription: Recent advances and highlights from the International Conference (Uppsala, 2003) on Heme Oxygenase. Antioxid. Redox Signal. 2004, 6, 924–933. [Google Scholar] [CrossRef]
- Bigo, C.; Kaeding, J.; Husseini, D.E.; Rudkowska, I.; Verrault, M.; Vohl, M.C.; Barbier, O. PPARα: A master regulator of bilirubin homeostasis. PPAR Res. 2014, 2014, 747014. Available online: https://www.hindawi.com/journals/ppar/2014/747014/ (accessed on 2 March 2023). [CrossRef] [PubMed]
- Hamoud, A.R.; Weaver, L.; Stec, D.E.; Hinds, T.D., Jr. Bilirubin in the liver-gut signaling axis. Trends Endocrinol. Metab. 2018, 29, 140–150. [Google Scholar] [CrossRef] [PubMed]
- Seyed Khoei, N.; Grindel, A.; Wallner, M.; Molzer, C.; Doberer, D.; Marculescu, R.; Bulmer, A.; Wagner, K.H. Mild hyperbilirubinaemia as an endogenous mitigator of overweight and obesity: Implications for improved metabolic health. Atherosclerosis 2018, 269, 306–311. [Google Scholar] [CrossRef] [PubMed]
- Hinds, T.D., Jr.; Stec, D.E. Bilirubin, a cardiometabolic signaling molecule. Hypertension 2018, 72, 788–795. [Google Scholar] [CrossRef] [PubMed]
- Gordon, D.M.; Blomquist, T.M.; Miruzzi, S.A.; McCullumsmith, R.; Stec, D.E.; Hinds, T.D., Jr. RNA sequencing in human HepG2 hepatocytes reveals PPAR-α mediates transcriptome responsiveness of bilirubin. Physiol. Genom. 2019, 51, 234–240. [Google Scholar] [CrossRef]


| Range TBil µmol/L | Q1 <9 | Q2 9–11 | Q3 12–14 | Q4 ≥15 | p | |
|---|---|---|---|---|---|---|
| N = 253 | N = 262 | N = 189 | N = 177 | |||
| TBil, µmol/L | 6.7 ± 1.3 | 10.0 ± 0.8 | 12.9 ± 0.8 | 20.0 ± 6.2 | ||
| Age, years | 74.6 ± 3.5 | 74.6 ± 3.6 | 74.7 ± 3.7 | 74.9 ± 3.5 | 0.37 | |
| Females | 93 (36.8) | 79 (30.2) | 40 (21.2) | 39 (22.0) | < | 0.001 |
| Non-Caucasian | 1 (0.4) | 0 (0.0) | 0 (0.0) | 1 (0.6) | 0.83 | |
| Smoking | 0.026 | |||||
| Current | 47 (18.6) | 22 (8.4) | 14 (7.4) | 15 (8.5) | ||
| Previous | 118 (46.6) | 126 (48.1) | 91 (48.1) | 92 (52.0) | ||
| Never | 88 (34.8) | 114 (43.5) | 84 (44.4) | 70 (39.5) | ||
| BMI, kg/m2 | 26.1 ± 4.1 | 26.7 ± 3.9 | 27.3 ± 4.4 | 26.6 ± 3.9 | 0.08 | |
| SBP, mmHg | 136.1 ± 18.7 | 135.2 ± 21.2 | 137.7 ± 20.0 | 137.5 ± 16.9 | 0.28 | |
| LVEF, % | 49.3 ± 9.2 | 50.0 ± 7.8 | 49.1 ± 9.4 | 51.0 ± 7.5 | 0.25 | |
| NYHA | 0.008 | |||||
| 1 | 143 (56.7) | 171 (65.3) | 128 (68.1) | 121 (68.4) | ||
| 2 | 82 (32.5) | 73 (27.9) | 46 (24.5) | 43 (24.3) | ||
| 3 | 25 (9.9) | 17 (6.5) | 12 (6.4) | 13 (7.3) | ||
| 4 | 2 (0.8) | 1 (0.4) | 2 (1.1) | 0 (0.0) | ||
| Diabetes (any) | 61 (24.1) | 56 (21.4) | 35 (18.5) | 30 (16.9) | 0.049 | |
| Hyperlipaemia | 126 (49.8) | 119 (45.4) | 74 (39.2) | 79 (44.6) | 0.12 | |
| Hypertension | 149 (58.9) | 153 (58.4) | 111 (58.7) | 113 (63.8) | 0.35 | |
| Uremia | 22 (8.7) | 4 (1.5) | 6 (3.2) | 6 (3.4) | 0.012 | |
| COPD | 29 (11.5) | 20 (7.6) | 9 (4.8) | 10 (5.6) | 0.01 | |
| HF (pre) | 14 (5.5) | 15 (5.7) | 14 (7.4) | 12 (6.8) | 0.45 | |
| CVD (pre) | 124 (49.0) | 119 (45.4) | 78 (41.3) | 75 (42.4) | 0.10 | |
| Hgb, g/dL | 13.0 ± 1.5 | 13.5 ± 1.4 | 13.9 ± 1.4 | 14.2 ± 1.3 | < | 0.001 |
| Leukocytes | 7.3 ± 2.2 | 7.1 ± 2.3 | 7.2 ± 1.8 | 7.0 ± 2.0 | 0.24 | |
| Thrombocytes | 258.8 ± 73.5 | 237.3 ± 67.7 | 233.1 ± 67.6 | 220.2 ± 60.4 | < | 0.001 |
| Creat. µmol/L | 100.1 ± 58.9 | 91.5 ± 24.7 | 93.1 ± 25.2 | 89.7 ± 21.6 | 0.009 | |
| HbA1c, % | 6.2 ± 1.0 | 6.1 ± 0.9 | 6.0 ± 0.9 | 5.9 ± 0.8 | 0.021 | |
| LDLc, mmol/L | 2.1 ± 0.7 | 2.0 ± 0.7 | 2.0 ± 0.7 | 1.8 ± 0.6 | 0.003 | |
| HDLc, mmol/L | 1.3 ± 0.4 | 1.3 ± 0.4 | 1.3 ± 0.3 | 1.3 ± 0.4 | 0.47 | |
| Trigl., mmol/L | 1.3 ± 0.7 | 1.2 ± 0.6 | 1.2 ± 0.6 | 1.2 ± 0.5 | 0.03 | |
| AST, IU/L | 26.0 ± 9.6 | 27.7 ± 10.3 | 29.1 ± 14.9 | 33.2 ± 17.2 | < | 0.001 |
| ALT, IU/L | 30.0 ± 17.9 | 32.8 ± 18.2 | 34.0 ± 23.1 | 39.8 ± 30.2 | < | 0.001 |
| GGT, IU/L | 46.4 ± 55.2 | 42.0 ± 35.0 | 48.8 ± 55.9 | 72.8 ± 133.7 | < | 0.001 |
| ALP, IU/L | 83.9 ± 39.2 | 82.2 ± 32.9 | 84.6 ± 35.1 | 89.5 ± 68.8 | 0.19 | |
| Albumin, g/L | 41.8 ± 4.3 | 41.7 ± 3.8 | 42.5 ± 3.7 | 42.5 ± 3.4 | 0.011 |
| Q-1 | Q-2 | Q-3 | Q-4 | ||
|---|---|---|---|---|---|
| n = 253 | n = 262 | n = 189 | n = 177 | p-Values for Trend | |
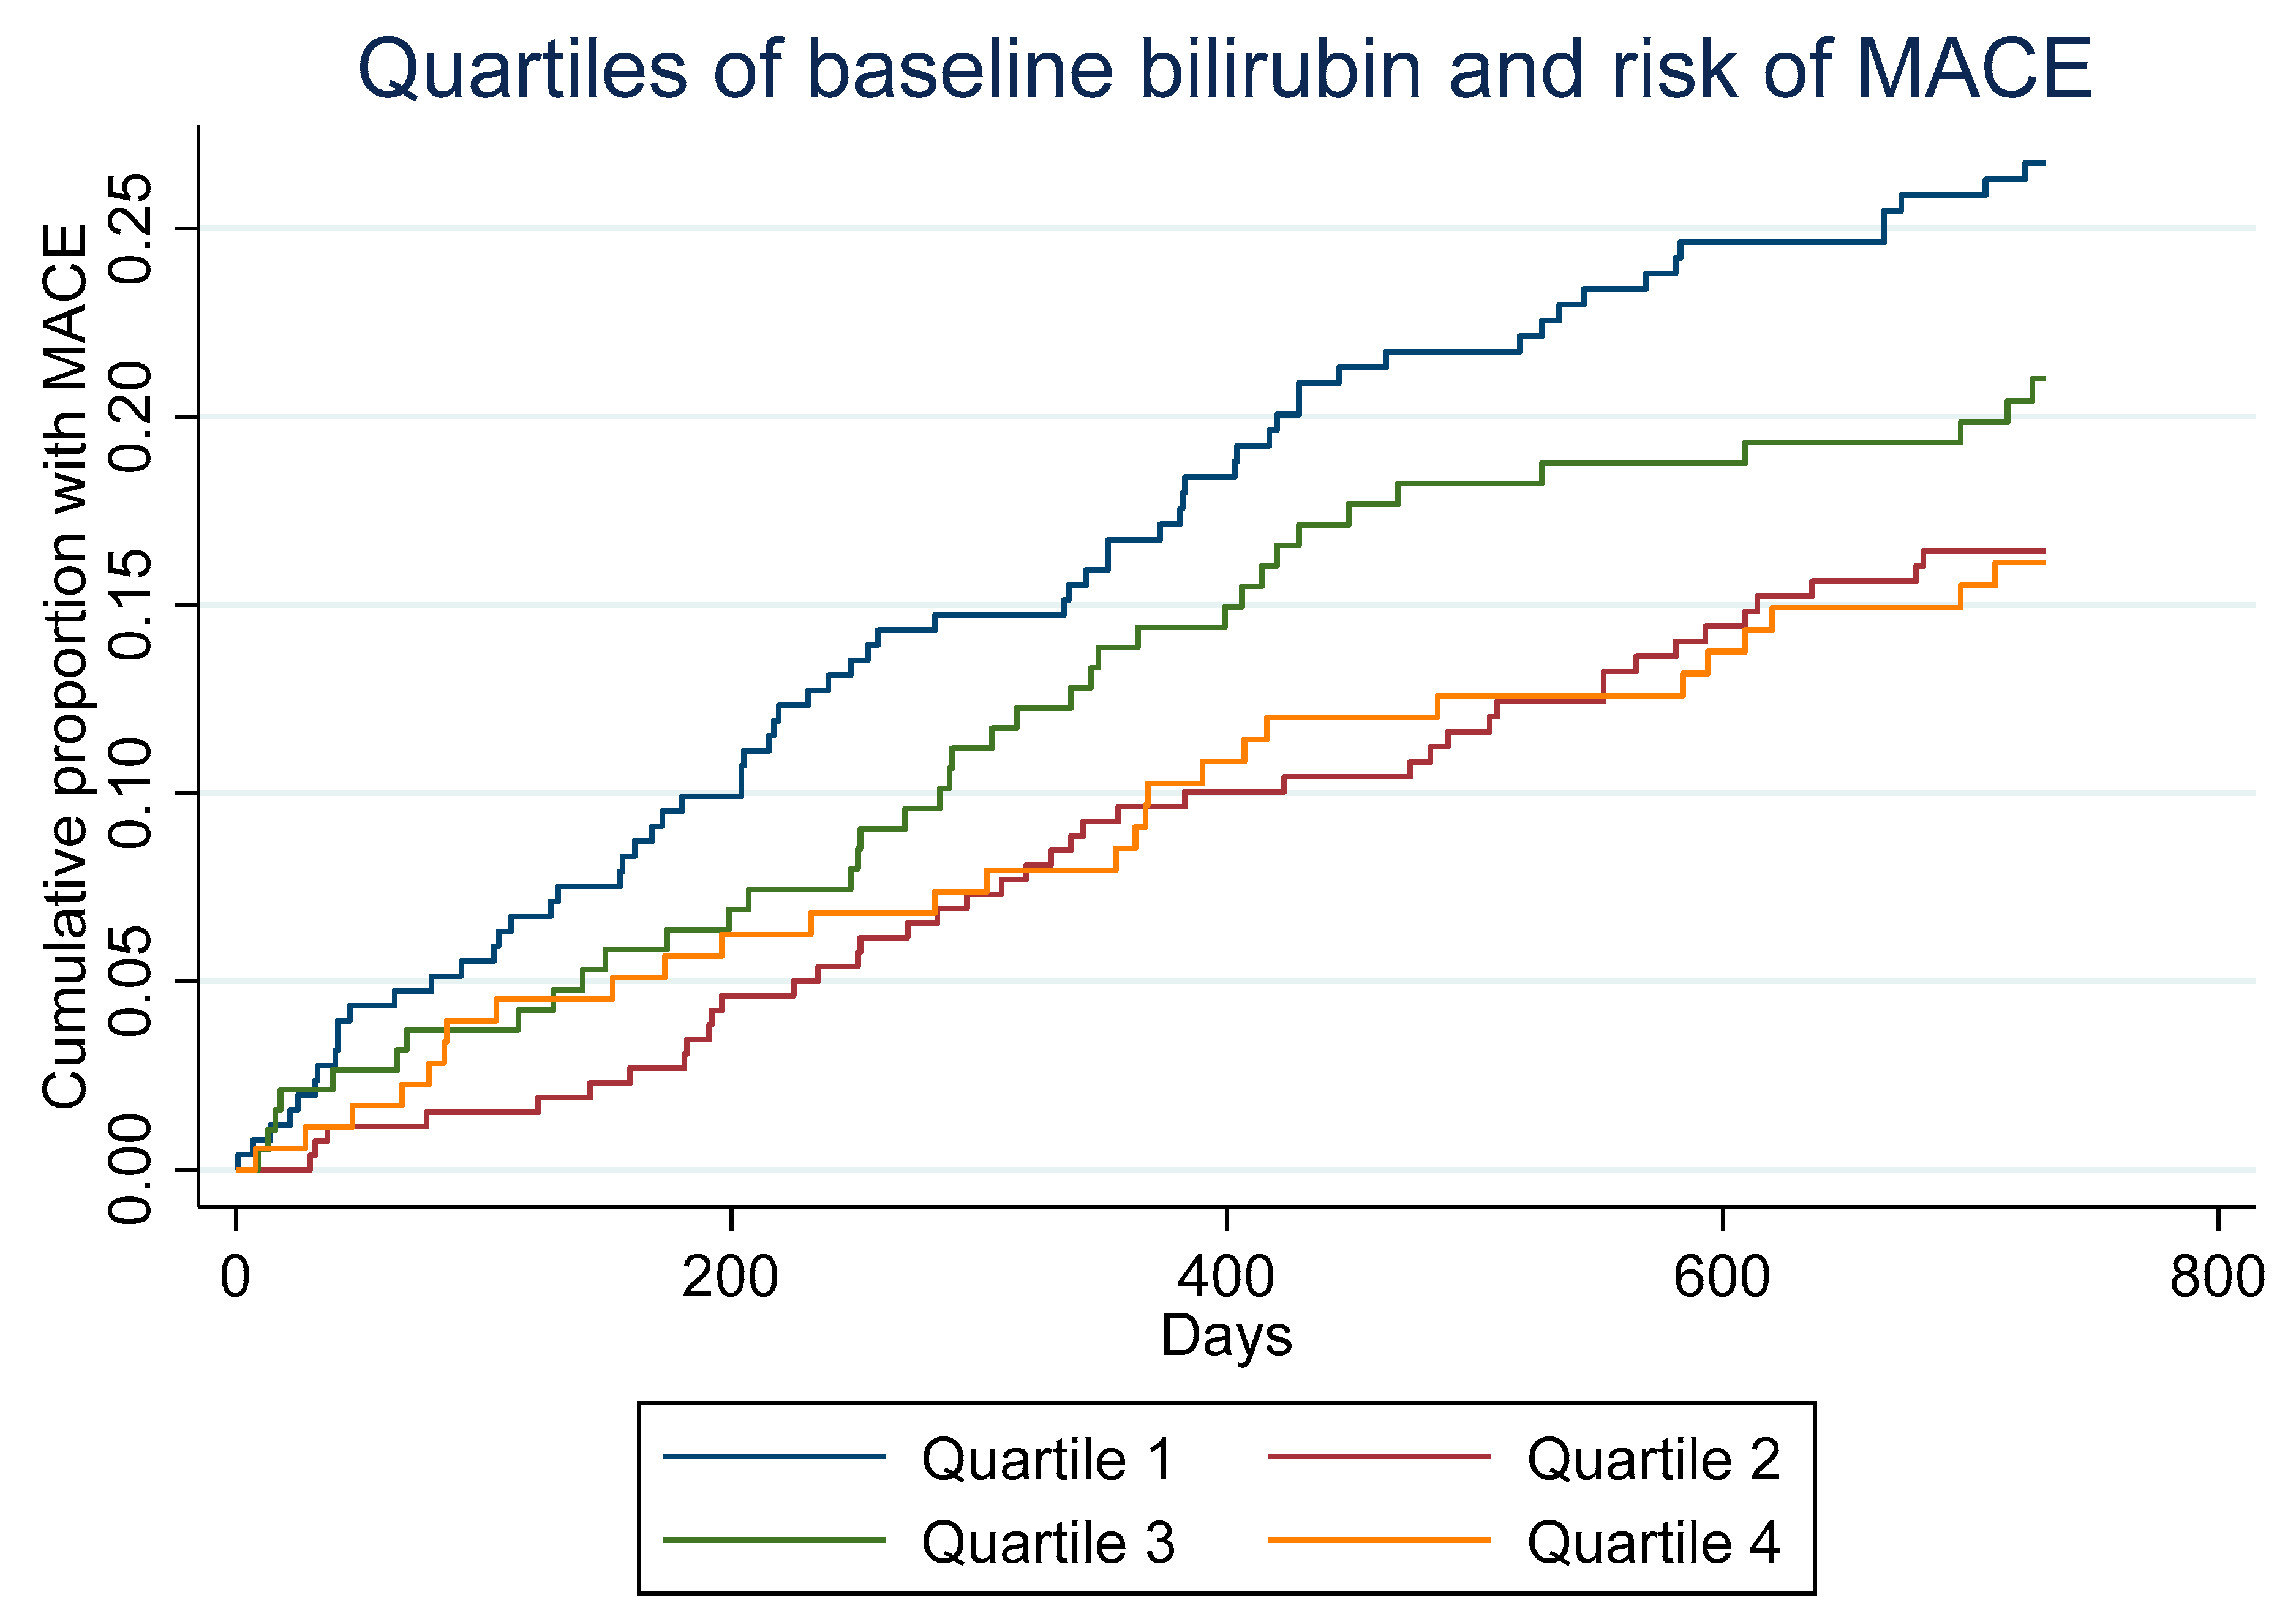
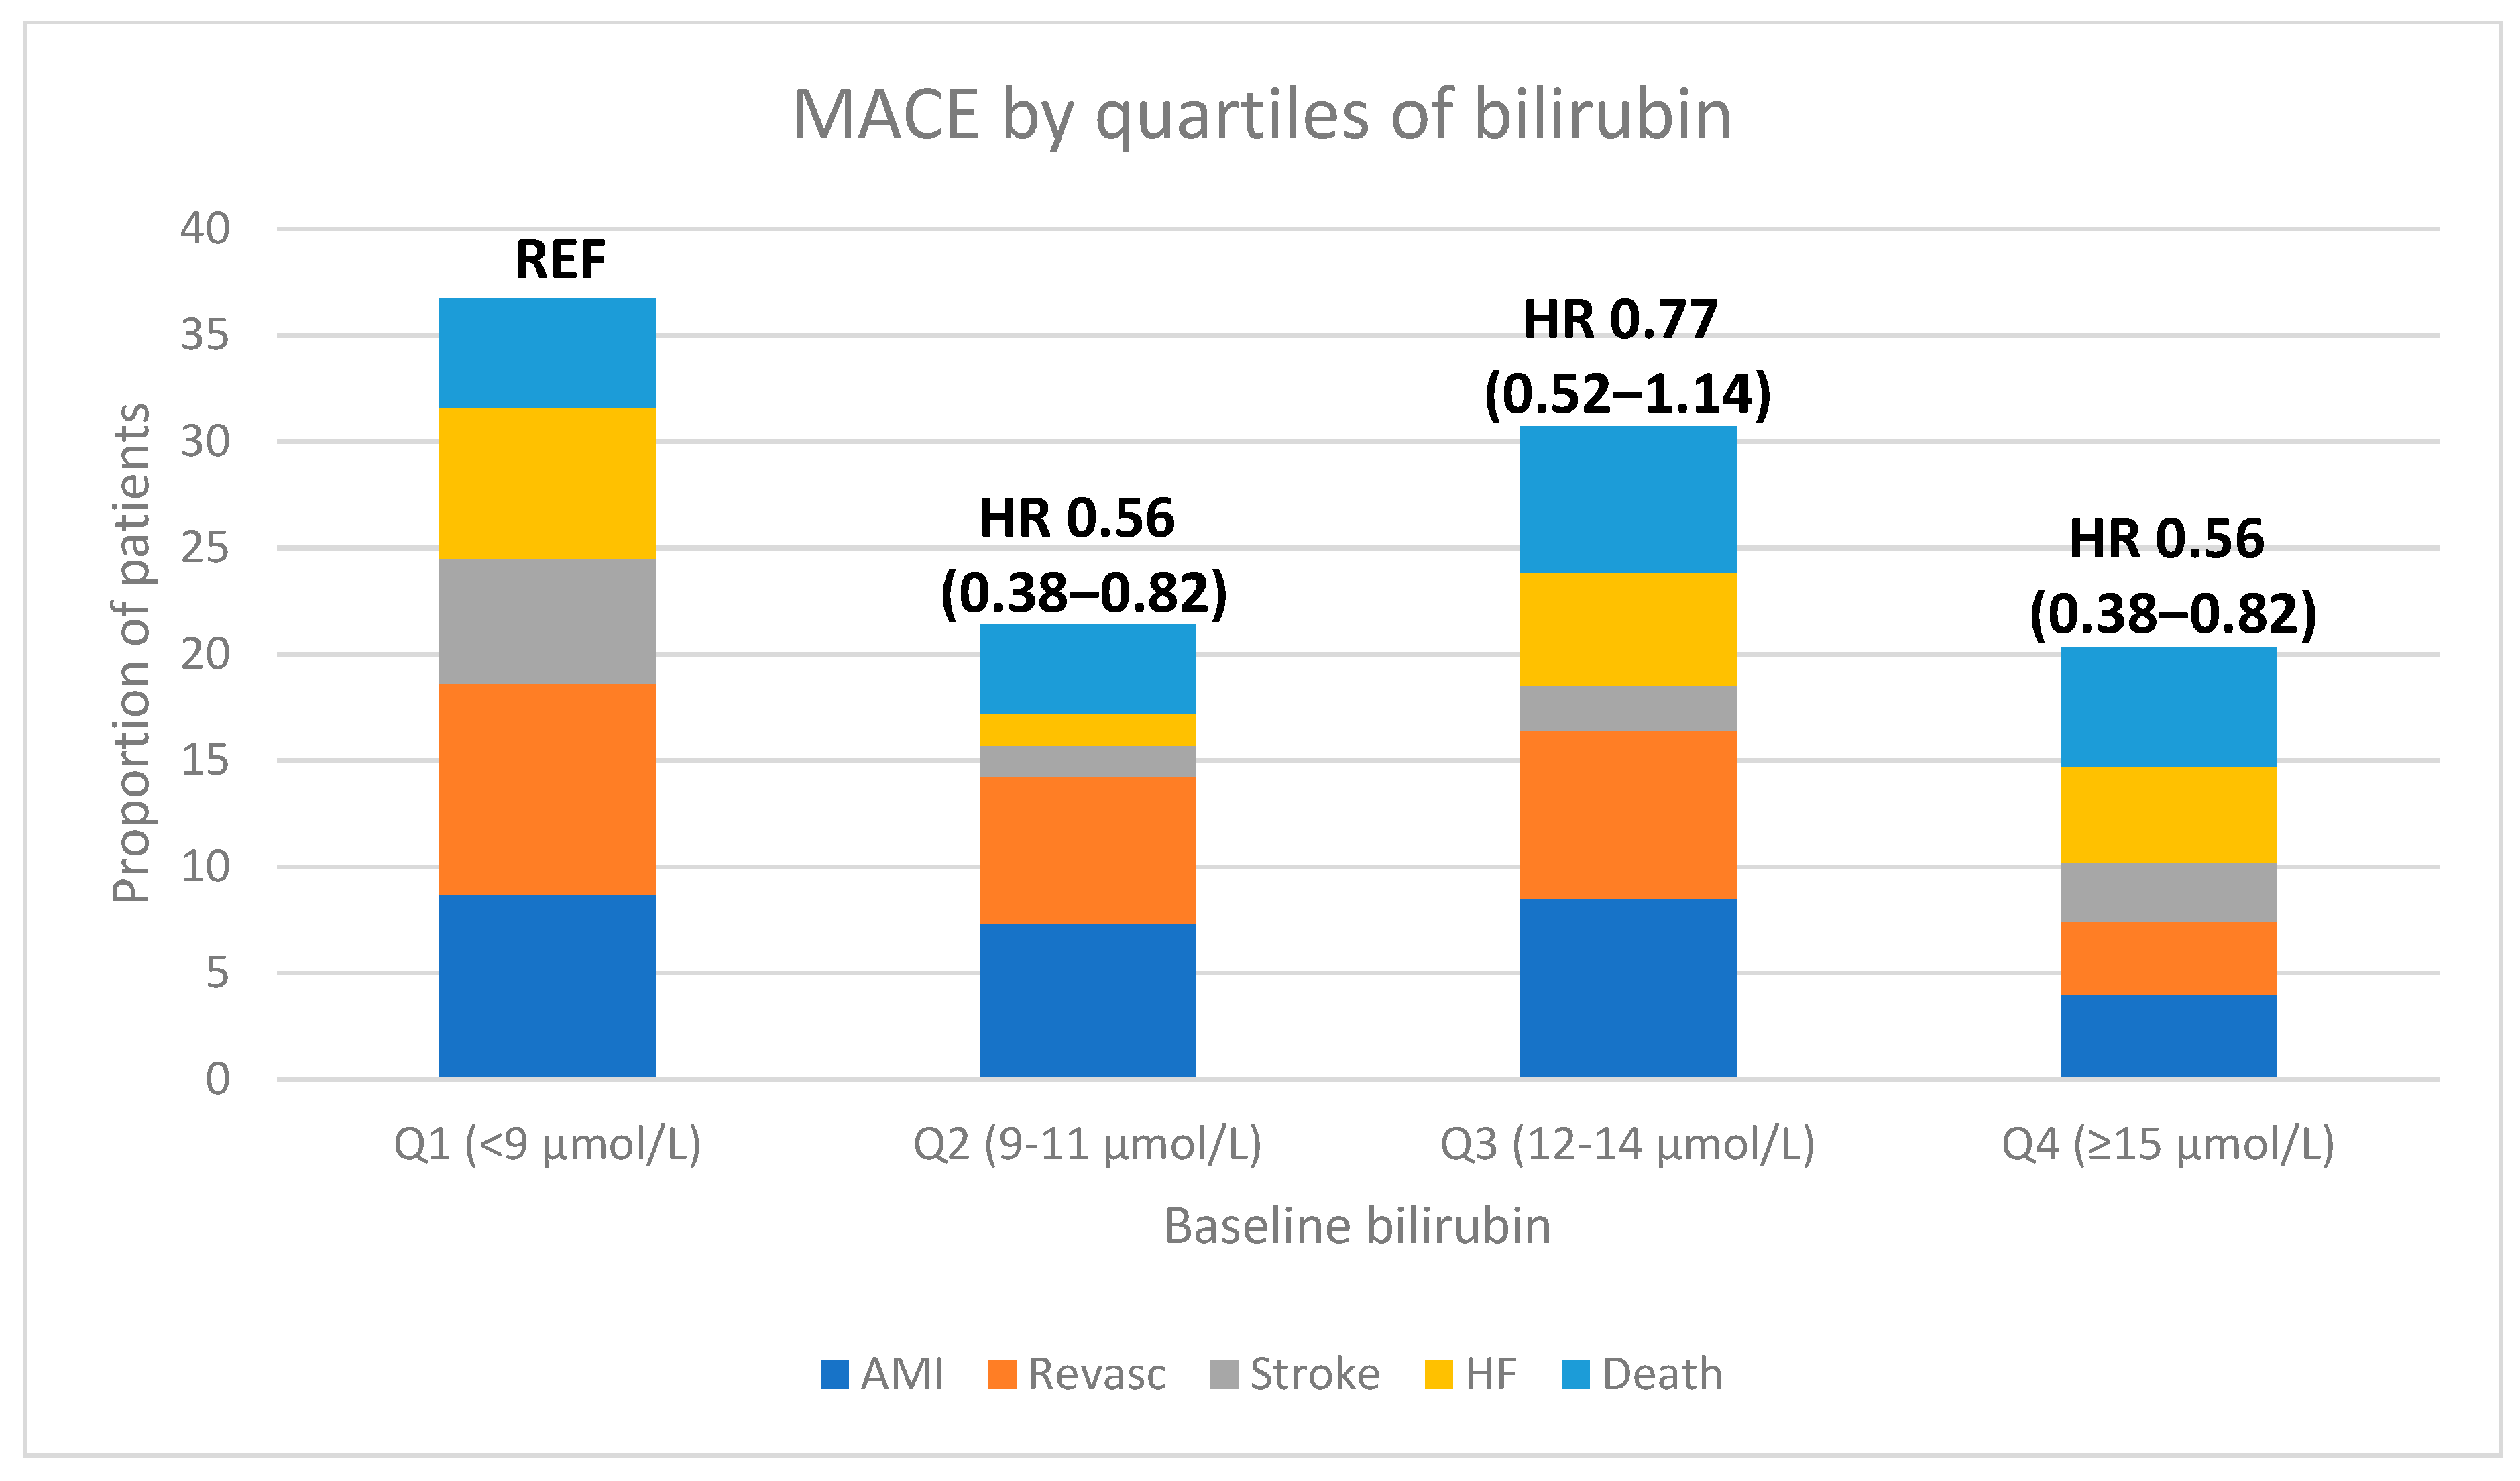
| MACE | 67 (26.5%) | 42 (16.0%) | 40 (21.2%) | 28 (15.8%) | 0.025 |
| AMI | 22 (8.7%) | 19 (7.3%) | 16 (8.5%) | 7 (4.0%) | 0.12 |
| REVASC | 25 (9.9%) | 18 (6.9%) | 15 (7.9%) | 6 (3.4%) | 0.024 |
| STROKE | 15 (5.9%) | 4 (1.5%) | 4 (2.1%) | 5 (2.8%) | 0.07 |
| HF | 18 (7.1%) | 4 (1.5%) | 10 (5.3%) | 8 (4.5%) | 0.45 |
| DEATH | 13 (5.1%) | 11 (4.2%) | 13 (6.9%) | 10 (5.6%) | 0.54 |
Disclaimer/Publisher’s Note: The statements, opinions and data contained in all publications are solely those of the individual author(s) and contributor(s) and not of MDPI and/or the editor(s). MDPI and/or the editor(s) disclaim responsibility for any injury to people or property resulting from any ideas, methods, instructions or products referred to in the content. |
© 2023 by the authors. Licensee MDPI, Basel, Switzerland. This article is an open access article distributed under the terms and conditions of the Creative Commons Attribution (CC BY) license (https://creativecommons.org/licenses/by/4.0/).
Share and Cite
Nilsen, D.W.T.; Myhre, P.L.; Solheim, S.; Tveit, S.H.; Kalstad, A.A.; Laake, K.; Tveit, A.; Seljeflot, I. Total Bilirubin Yields Prognostic Information Following a Myocardial Infarction in the Elderly. Antioxidants 2023, 12, 1157. https://doi.org/10.3390/antiox12061157
Nilsen DWT, Myhre PL, Solheim S, Tveit SH, Kalstad AA, Laake K, Tveit A, Seljeflot I. Total Bilirubin Yields Prognostic Information Following a Myocardial Infarction in the Elderly. Antioxidants. 2023; 12(6):1157. https://doi.org/10.3390/antiox12061157
Chicago/Turabian StyleNilsen, Dennis Winston T., Peder Langeland Myhre, Svein Solheim, Sjur Hansen Tveit, Are Annesønn Kalstad, Kristian Laake, Arnljot Tveit, and Ingebjørg Seljeflot. 2023. "Total Bilirubin Yields Prognostic Information Following a Myocardial Infarction in the Elderly" Antioxidants 12, no. 6: 1157. https://doi.org/10.3390/antiox12061157
APA StyleNilsen, D. W. T., Myhre, P. L., Solheim, S., Tveit, S. H., Kalstad, A. A., Laake, K., Tveit, A., & Seljeflot, I. (2023). Total Bilirubin Yields Prognostic Information Following a Myocardial Infarction in the Elderly. Antioxidants, 12(6), 1157. https://doi.org/10.3390/antiox12061157