Article

Quantification of Amino Acids, Phenolic Compounds Profiling from Nine Rice Varieties and Their Antioxidant Potential

1
Department of Food Science and Biotechnology, College of Agriculture and Life Sciences, Kangwon National University, Chuncheon 200-701, Korea
2
Agricultural and Life Science Research Institute, Kangwon National University, Chuncheon 24341, Korea
3
Department of Biological Environment, College of Agriculture and Life Sciences, Kangwon National University, Gangwon-do 24341, Korea
*
Author to whom correspondence should be addressed.
Antioxidants 2022, 11(5), 839; https://doi.org/10.3390/antiox11050839
Submission received: 29 March 2022 / Revised: 20 April 2022 / Accepted: 20 April 2022 / Published: 25 April 2022
(This article belongs to the Special Issue New Insights into Phytochemical Antioxidants in Food)

Abstract

:
In recent years, the health benefits of the pigmented rice varieties have been reported due to the richness of their bioactive compounds. Therefore, this study evaluated the antioxidant, total flavonoid, total phenolic, anthocyanin content, amino acid and individual phenolic compound quantification of nine Korean-grown rice varieties using spectrophotometric, HPLC-FLD-MS/MS and UHPLC Q-TOF-MS/MS methods. Our research found that the free fractions of DM29 (red rice) had the highest free radical scavenging ability of ABTS and DPPH. In contrast, the highest ferric reducing antioxidant power was observed in the 01708 brown rice variety. The majority of phenolic compounds such as quercetin, ferulic acid, p-coumaric acid, ascorbic acid, caffeic acid and genistein were found in the DM29 sample. The phenolic content of rice varies depending on its color, with DM29 red rice having the highest TPC, TFC and TAC levels. At the same time, the presence of the majority of amino acids was quantified in the 01708 and GR (Gangwon) brown rice varieties. According to this study, colored rice varieties are high in amino acids, phenolic compounds and antioxidants. This research would be beneficial in furthering our understanding of the nutritional value of different colors of rice and their high potential as a natural antioxidant.

1. Introduction

Rice (Oryza sativa L.) is a staple food for more than half of the world’s population, accounting for more than 20% of all calories consumed by all humans [1]. The majority of people worldwide consume white rice, but some Asian countries consume pigmented cultivars such as red, brown, black, reddish-brown and purple-black rice [2]. Pigmented rice is whole grain rice with an intact bran layer and various colored pericarps such as black/purple and red. White rice is a significant contributor to the caloric intake of the populations of Asia and Africa, but its nutritional quality is poor compared to pigmented rice varieties [3]. Nowadays, there has been a shift in consumer interest in pigmented rice varieties due to their potential health benefits, which are primarily attributed to the presence of nutritional and polyphenolic compounds. Rice-derived polyphenols, in particular, have been shown to have anti-inflammatory, antioxidant and chemo-preventative properties, implying that wholegrain colored rice may play a role as a potential functional food [4]. According to epidemiological studies, rice antioxidants may be responsible for the lower prevalence of chronic illnesses in rice-consuming countries. Numerous studies have been conducted to investigate the phytochemical content and antioxidant activity of various rice varieties, including the presence of gamma-aminobutyric acid (GABA), phenolic acids, oryzanol, tocotrienol and flavonoids [5,6].
Polyphenols ranging from simple phenolic acids to complex polyphenols such as anthocyanins and proanthocyanidins are found in pigmented rice varieties. Anthocyanin is one of the most important functional components of pigmented rice and its antioxidant properties are due to the presence and concentration of phenolic groups [7]. These phytochemicals are found in the endosperm and bran/embryo fractions of the rice grain and are free, soluble-conjugated and bound forms. Antioxidant therapy has been helpful in understanding the complex etiology of chronic illnesses and developing new treatments to mitigate the side effects of medication therapy [8,9]. Polyphenols derived from rice and their antioxidant properties in global rice cultivars have received considerable attention. However, there has been little research on the antioxidant capacity of rice cultivars grown in South Korea. Investigating the nutritional properties of different colored rice cultivars grown in Korean soil, such as amino acid content, phenolic content and antioxidant properties, may reveal their latent potential as a functional food and may support Korea in entering the global market.
Traditional rice production is practiced worldwide. As colored rice is becoming popular at present because of various health benefits, many different colored rice varieties are grown in different parts of South Korea. As a result, the ultimate goal of our research was to impart the knowledge required to assess the quality of phytochemical antioxidants in various present rice varieties to meet the needs of rice farmers and consumers. Our study’s specific goals were to (1) reveal the antioxidant activity, phenolic, flavonoids and anthocyanin content of nine Korean grown rice varieties, (2) detect and quantify amino acid contents in present rice varieties and (3) quantify some common phenolic compounds in nine current rice varieties.
Additionally, as per our knowledge, this is the first time when these nine varieties of rice from different regions of South Korea were compared for their nutritional, antioxidant and phenolic profiling human health benefits.

2. Experimental Research Materials and Methods

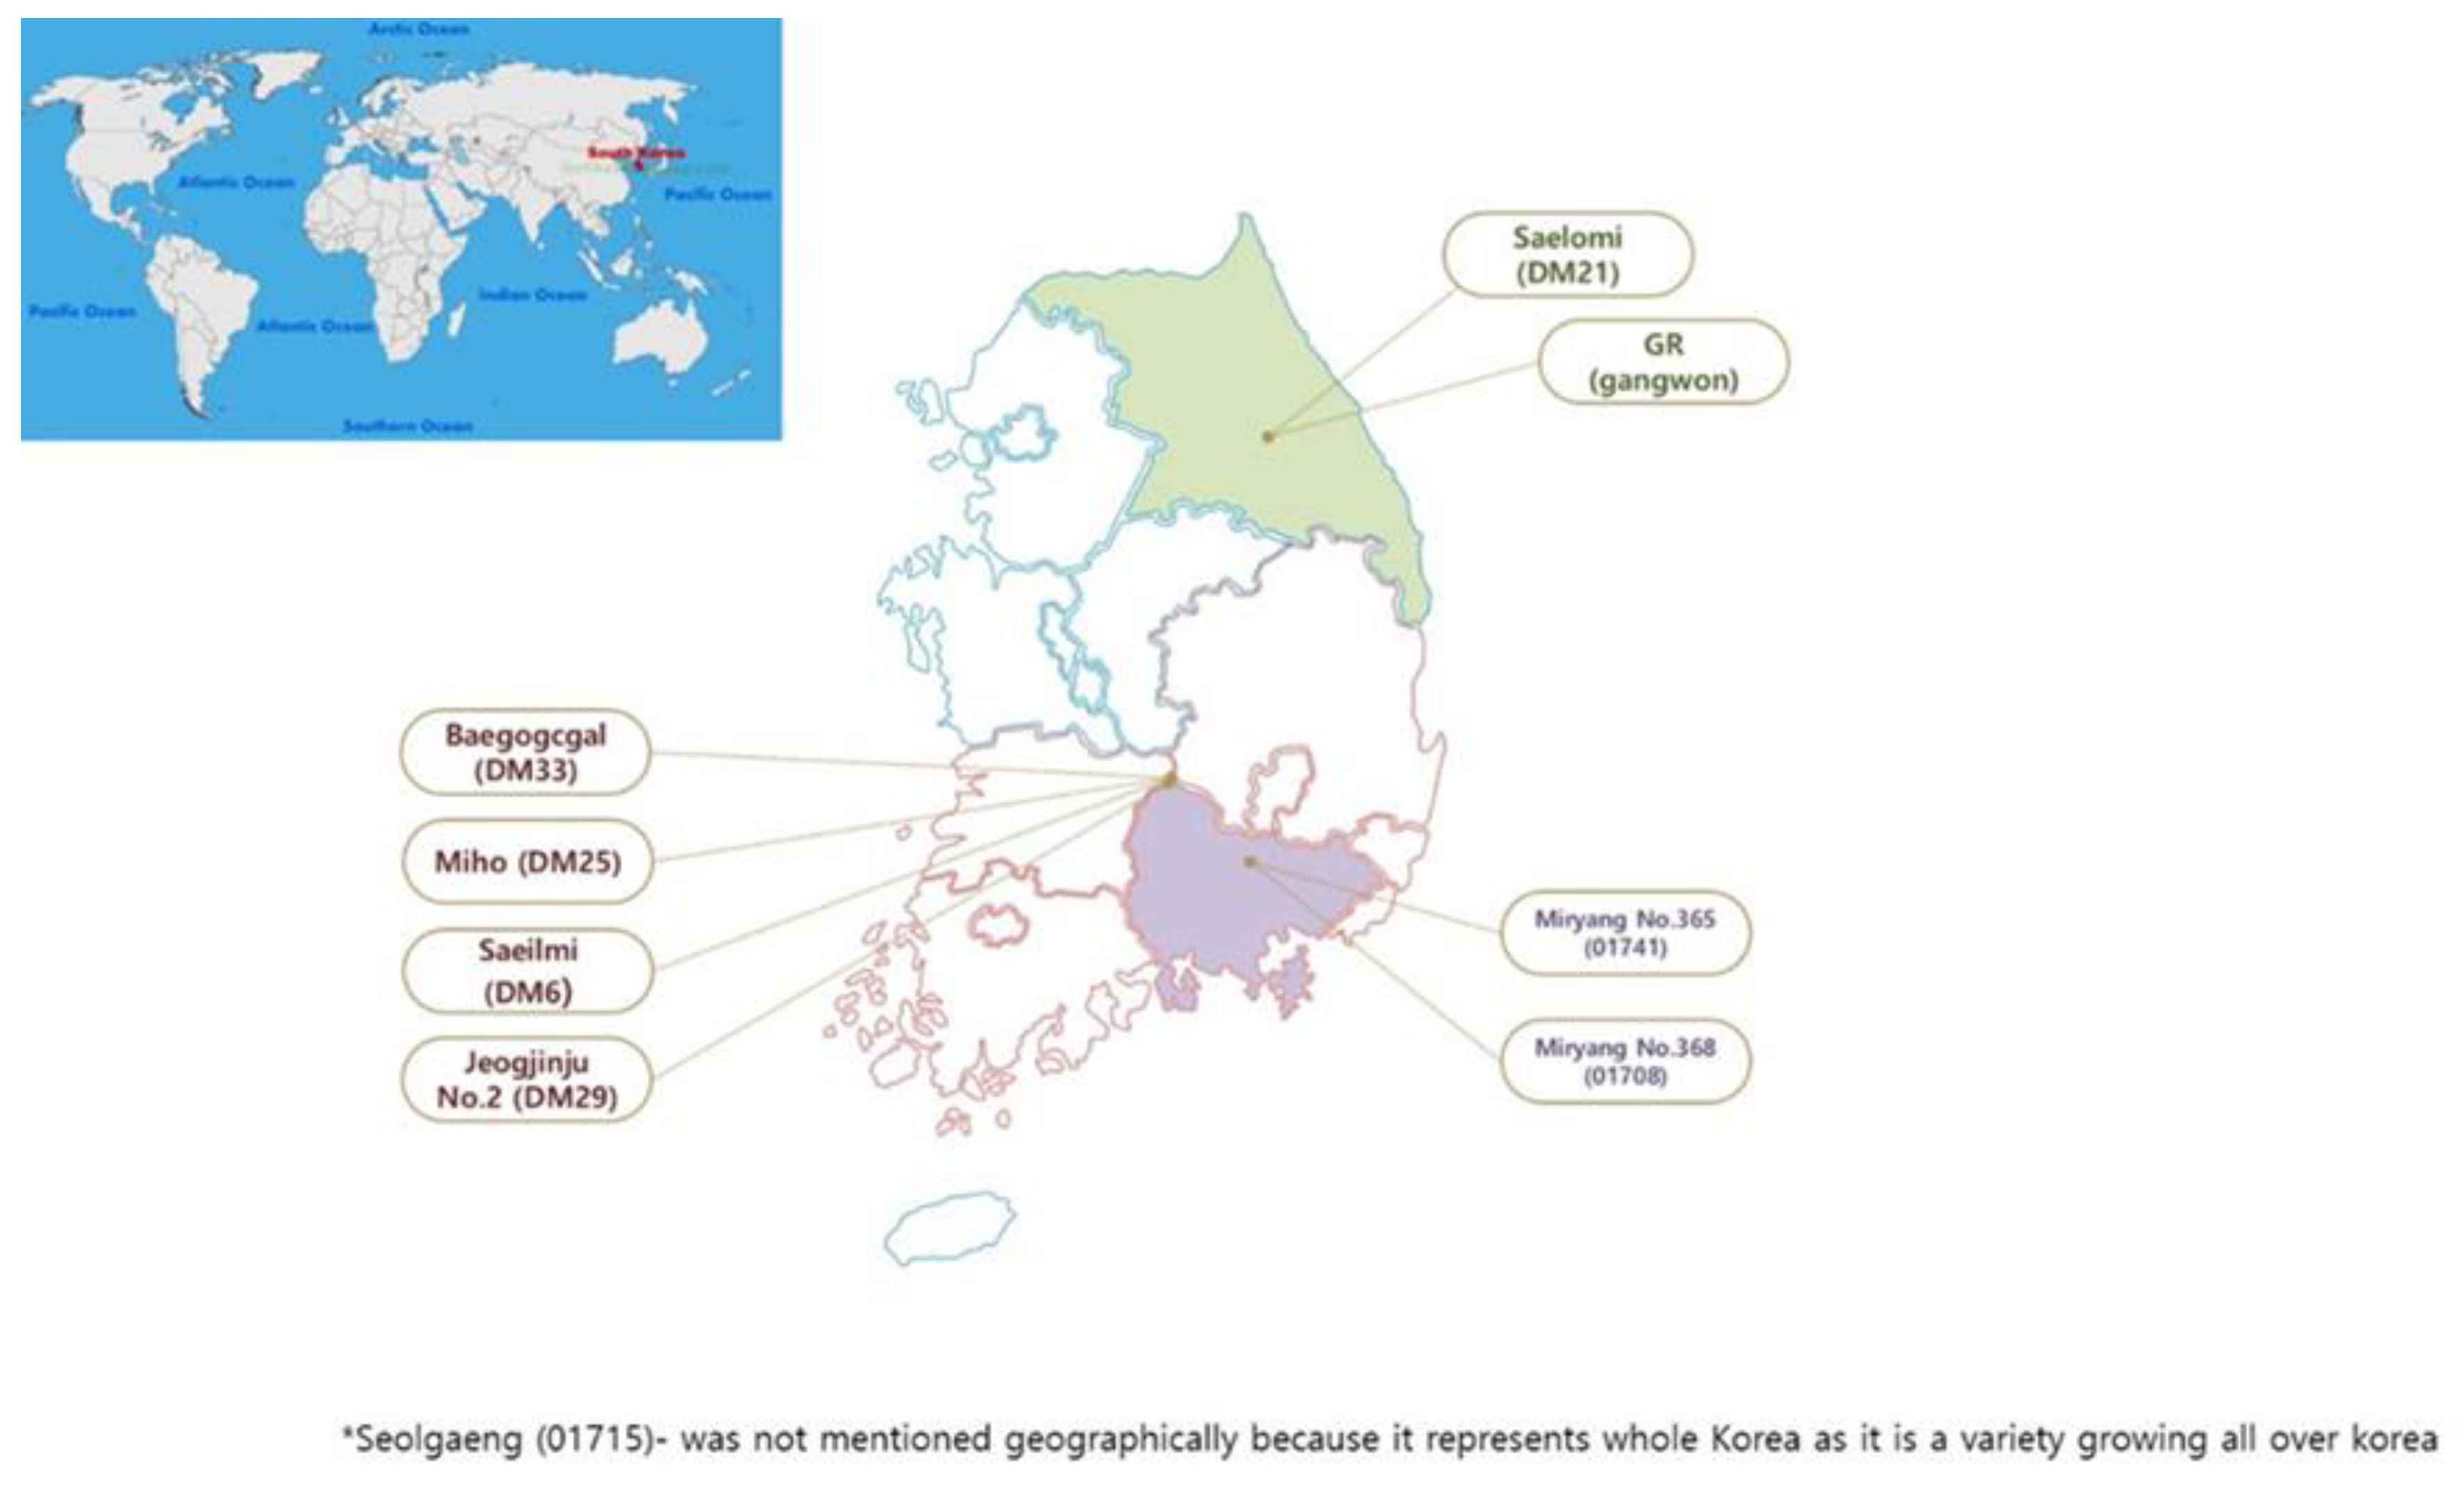
2.1. Research Samples

The current study employed nine Korean-grown varieties of rice (Oryza sativa L.), namely DM 33-Baegogcgal (brown rice), DM 25-Miho (brown rice), DM6- Saeilmi (brown rice), DM21- Saelomi (brown rice), 01715- Seolgaeng (brown rice), 01708- Miryang 368 (brown rice), 01741- Miryang 365 (brown rice), DM29- Jeogjinju 2 (Red rice) and GR- Gangwon rice (brown rice). DM numbers and names are given to different breeds based on their location for better understanding Figure 1. All samples for this study were obtained from the South Korean Rural Development Administration, National Institute of Crop Science (Supplementary Table S1). The samples were sieved through mesh size 40 to remove any remaining dust or debris after being crushed into a powder using an electric grinder. Before proceeding, the samples were retained at −20 °C.

2.2. Chemicals and Cultures

Chemical reagents of analytical grade were used in all experiments. Daejung Chemicals and Metals Co., Ltd., Gyeonggi-Do, South Korea, provided all HPLC and extraction organic solvents. Quercetin, caffeic acid, ferulic acid, 2,2-diphenyl-1-picrylhydrazyl (DPPH), genistein, ascorbic acid, ABTS, p-Coumaric acids and all other standards used in this study were supplied by Sigma, South Korea.

2.3. Sample Preparation

Preparation of Rice Samples Ethanolic Extracts

Our previous procedure was used for extraction [10] with some modifications. All rice varieties (50 g powder) were shaken in an electric shaker for around 4 h at a temperature of about 50 °C with 70% 100 mL ethanol (1:20 w/v). After that, the extracts were centrifuged (Hanil Science Industrial, Incheon, Korea) for approximately 10–15 min at 4000 g. The procedure was carried out three times. The supernatants ethanol content was evaporated at 50–55 °C and freeze-dried. The samples were then kept at −20 °C until they were needed again. The samples were made into a 1 mg/mL concentration stock solution. This is the inventory that will be used throughout the experiment.

2.4. Measurement of Total Anthocyanin Content (TAC)

After some modifications, the anthocyanins were determined using a previous methodology [11]. In a nutshell, 0.1 g of each freeze-dried sample was dissolved in 10 mL of 60% ethanol containing 1% citric acid, thoroughly mixed with a vortex, and the absorbance was measured at 535 nm with a spectrophotometer (Evolution 201, Thermo, Waltham, MA, USA). TAC was calculated using cyanidin 3-O-glucoside chloride (C3G) as a reference (mg C3G Equiv./100 g, dry weight (DW)).

2.5. Measurement of Total Phenolic Content (TPC)

TPC was calculated after a slight modification in the previously reported process [12]. In brief, the Folin-Ciocalteu (FC) reagent was mixed for 6 min with the rice extract or standard ferulic acid solution (100 μL). After that, 1 mL of Na2CO3 700 mM was added to the solution for alkalization. Then the plate was kept in the dark for approximately 90 min, and the absorbance was measured using a SpectraMax i3 plate reader (Molecular Devices Korea, LLC, Seoul, Korea). The TPC of the sample was calculated and represented as mg (GAE)gallic acid Equiv./100 g, DW as a result of the gallic acid standard curve.

2.6. Measurement of Total Flavonoid Content (TFC)

The assay for rice ethanol extracts was quantified using the 24-well microplate technique, modified slightly from the previously reported method [13]. In short, extracts of 200 μL each were mixed with distilled water (1 mL) and NaNO2 (75 μL; 50 g/L). After 5 min of incubation, AlCl3 (75 μL; 100 g/L) was added. Later, 600 μL of distilled water with 500 μL of 1 M NaOH were added together after waiting for 6 min. Absorbance was measured at 510 nm. Results were reported in mg catechin equivalent/100 g, DW (mg CE/100 g sample).

2.7. Estimation of Antioxidant Potential of Various Rice Varieties

2.7.1. 2,2-Diphenyl-1-picrylhydrazyl (DPPH) Radical Scavenging Activity

The assay was examined by the procedure mentioned previously [14] with slight alterations. Finally, in a 24-well microplate, 100 μL of the rice extract, or blank or standard (Trolox), was combined with 100 μL fresh solution of DPPH in a concentration of 500 μM (dissolved in 95% methanol) and maintained at RT (room temp.) for 30–40 min in triplicates. Later, absorbance was measured at 515 nm, and the baseline curve was drawn using Trolox. The equivalent mg Trolox (TE) for 100 g sample DW was reported as DPPH.

2.7.2. 2,2′-Azino-bis(3-ethylbenzothiazoline-6-sulfonic Acid) (ABTS) Radical Scavenging Activity

Our previous protocol was used for ABTS activity [6]. Results were articulated as the equivalent mg Trolox (TE) for 100 g sample DW

2.7.3. The Ferric Reducing Antioxidant Power (FRAP) Activity for Rice Varieties

The assay was carried out using the previously acknowledged approach [10]. To be brief, 0.1 mL rice extracts were mixed with 3.9 mL FRAP reagent made up of 50 mL buffer (pH 3.6, 0.3 M), 5 mL solution of tripyridyl triazine (TPTZ, 10 mmol/L in HCl concentration of 40 mmol/L) and 5 mL of FeCl36H2O concentration of 20 mmol/L. The FRAP reagent was formed and placed at 37 °C for 11–12 min. Results were stated as the equivalent mg Trolox (TE) for 100 g sample DW

2.8. HPLC-FLD-MS/MS and UHPLC Q-TOF-MS/MS for Identification and Quantification of Amino Acid and Phenolic Compounds in Rice Samples

2.8.1. Amino Acid Detection

The amino acids were separated using an HPLC system equipped with a binary pump and auto sampler (Agilent, Shelton, CT, USA). The protocol from our previous research was followed for further analysis as the same instrument was used in our earlier study [10].

2.8.2. Phenolic Compounds Detection in Nine Rice Varieties

To classify polyphenolic compounds, a UHPLCQ-TOF-MS/MS approach was used. The samples were filtered into LC-MS vials for analysis using 0.25 μm pore size syringe filters (Merck KGaA, Darmstadt, Germany). We followed the protocol from our previous study [10].

2.9. Statistical Analysis

The obtained data were analyzed using GraphPad Prisma 8.0. The one-way variance analysis (ANOVA) and the Tukey’s test at the significant level of at least p < 0.05 were considered statistically significant. Average Standard Deviation (SD) was used to explain the findings.
Multivariate statistical studies heat maps were carried out using the ClustVis software (http://biit.cs.ut.ee/clustvis/ accessed on 10 March 2022). The principal component analysis (PCA) method was employed using Origin 2021 software to compare the changes among rice samples. ClustVis and Origin were used to create Heat maps & PCA utilizing concentrations of samples.

3. Results and Discussion

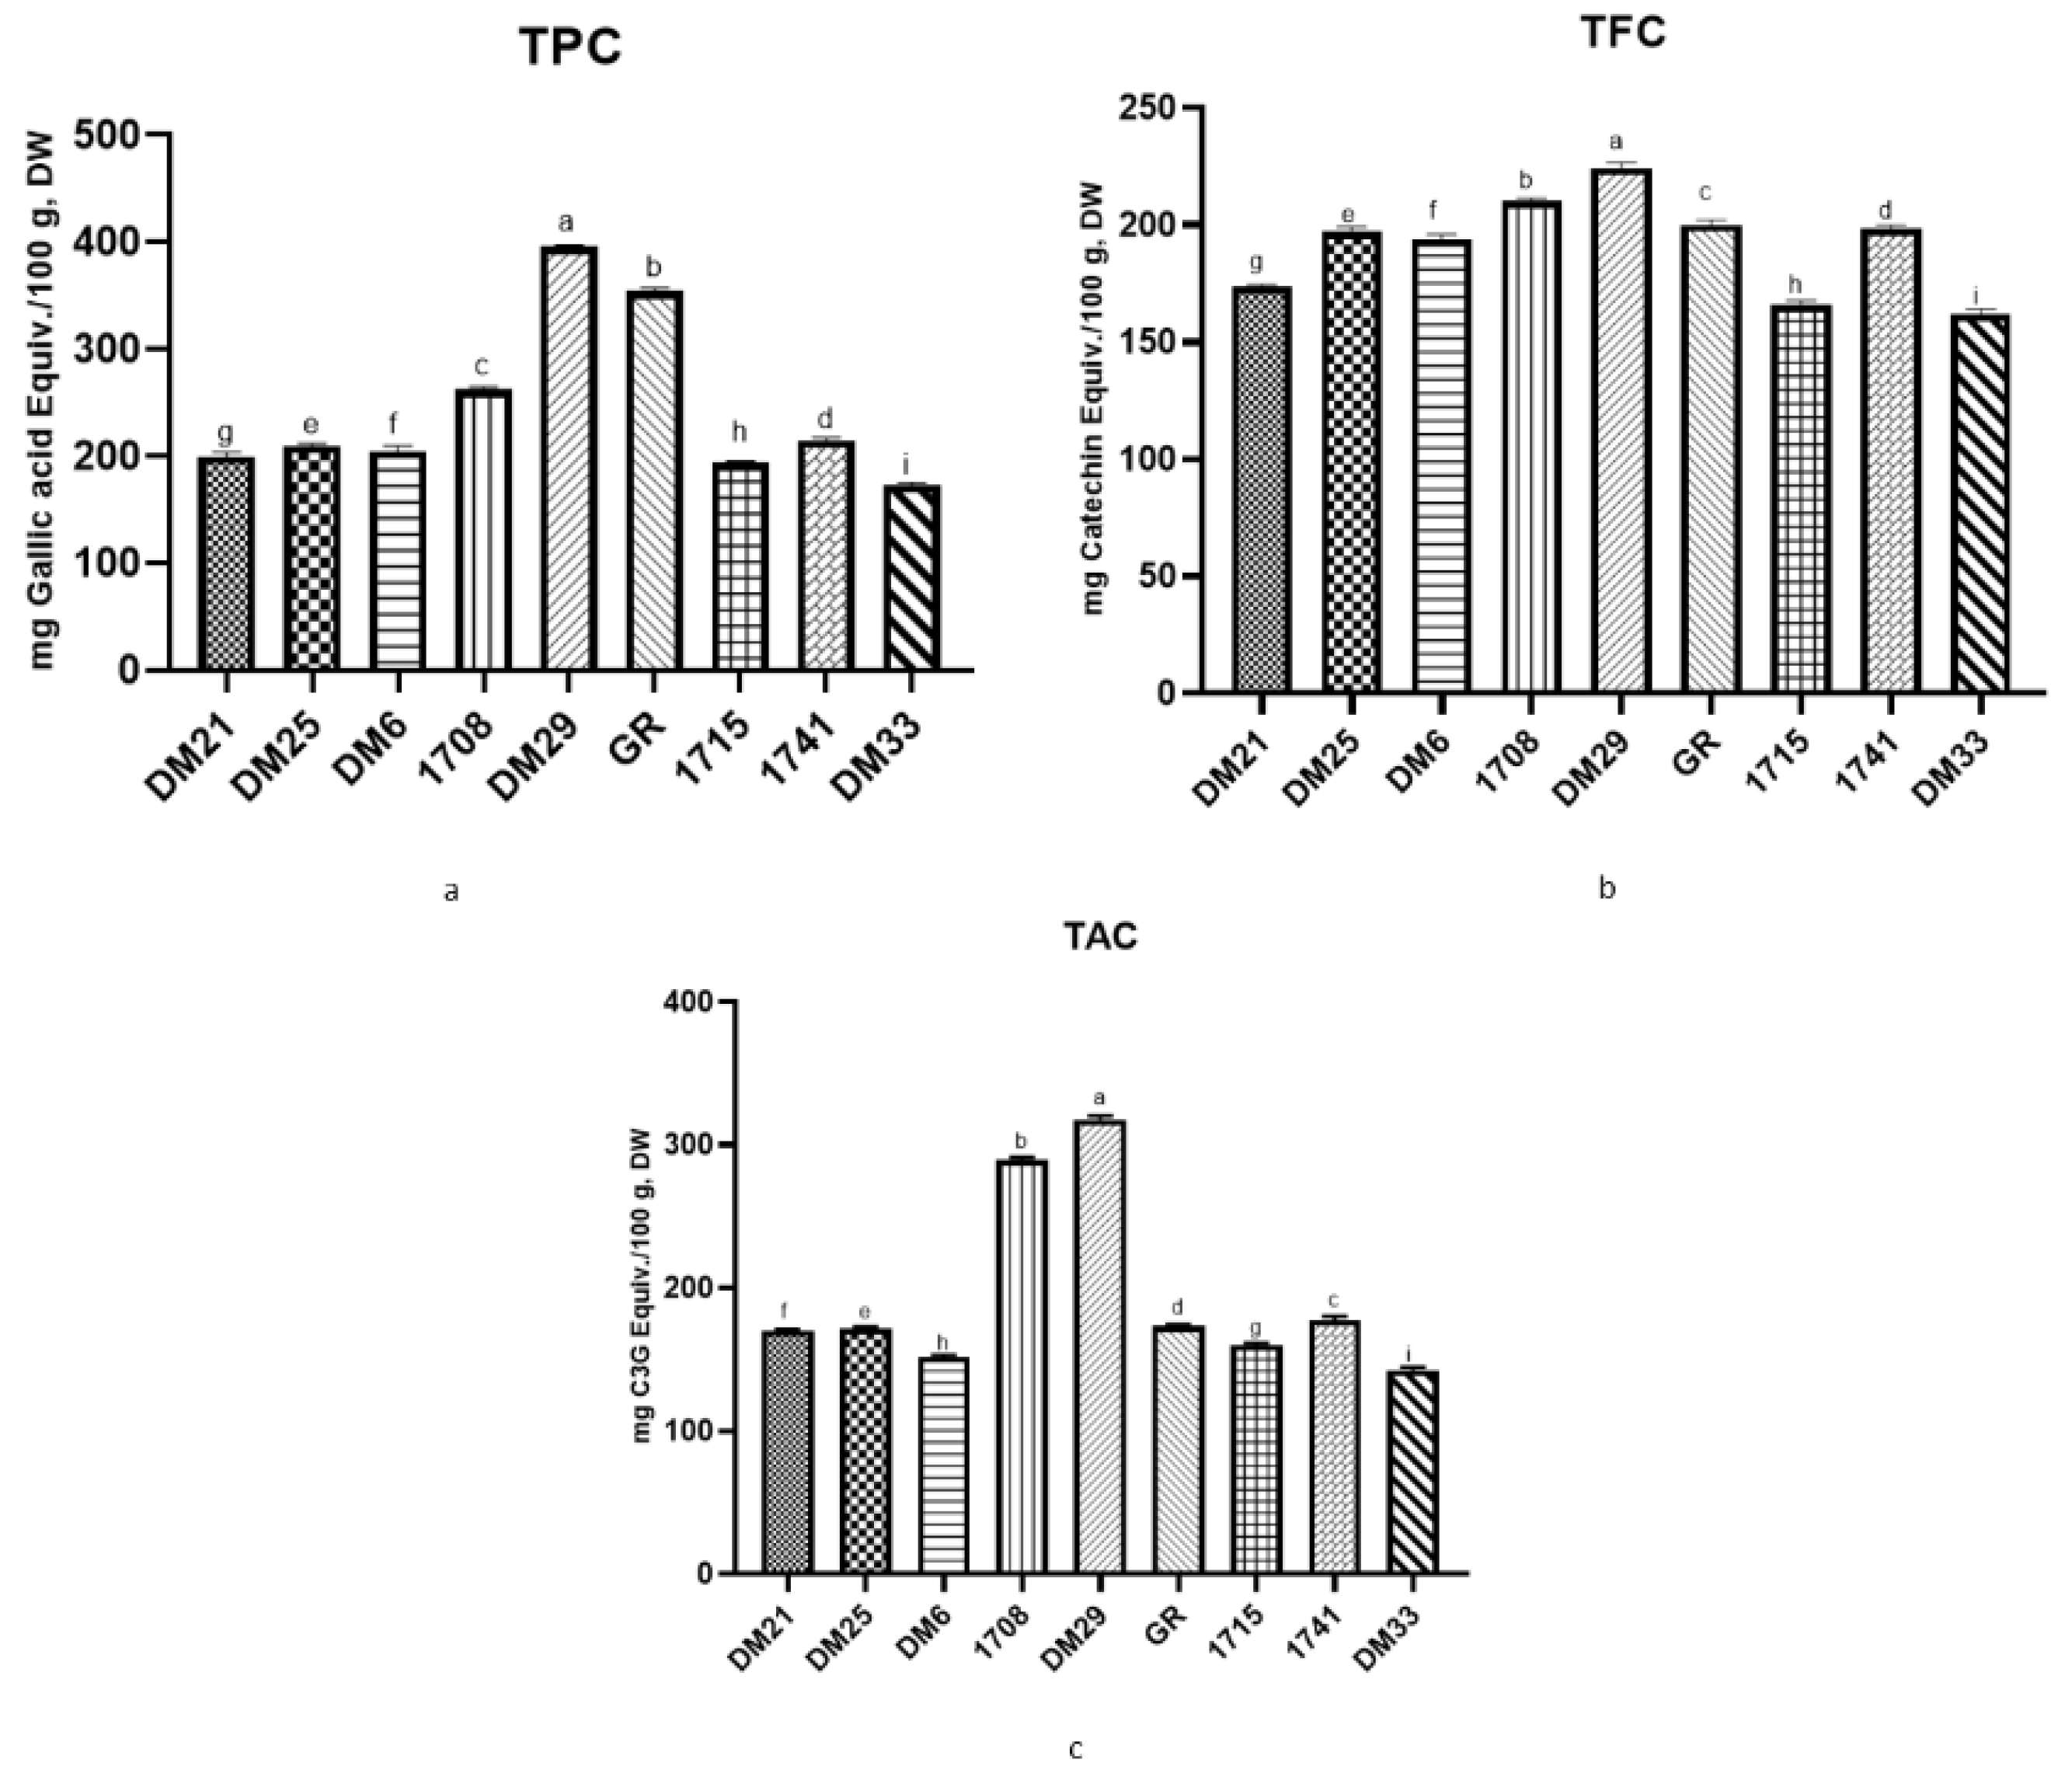
3.1. TPC, TFC, and TAC of Different Nine Rice Varieties

Figure 2, Supplementary Table S2 displays all rice varieties’ total phenolics, flavonoids and anthocyanin content. It is well understood that phenolics are a phytochemical containing one or more hydroxyl groups from aromatic rings, and their concentration has been linked to grain antioxidant properties [15]. When the total free phenolic content of nine rice varieties was assessed, the amount ranged between 173.59 ± 1.44 to 395.85 ± 1.23 mg GAE/100 g, DW. In our study, DM29 (395.85 ± 1.23 mg GAE/100 g, DW), a red rice variety, had significantly higher TPC among nine tested varieties, followed by GR (353.78 ± 2.60 mg GAE/100 g, DW) and 01708 (262.37 ± 1.62 mg GAE/100 g, DW) samples. Similar comparative studies with different colored pericarp rice varieties have found that red rice varieties have higher TPC than other colored rice [16,17].
According to a recent study, free phenolics contribute significantly to total TPCs in rice [18]. Red, brown and black rice phenolics were known to have a wide range of beneficial effects, including endothelial cell protection, antioxidant activity, inhibiting α-glucosidase and α-amylase activity and anti-inflammatory effects, as well as helping to prevent heart and cardiovascular diseases, type 2 diabetes, obesity, and hypertension [19].
Flavonoids are phenolic compounds with high antioxidant activity linked to a lower risk of chronic diseases. The TFC of different rice-free fractions ranged between 161.83 ± 1.62 and 224.14 ± 1.81 mg Catechin Equiv./100 g, DW. TFC levels were also observed to be highest in red rice (224.14 ± 1.81 mg Catechin Equiv./100 g, DW), followed by the 01708 and GR (210.08 ± 0.95 & 199.88 ± 1.57 mg Catechin Equiv./100 g, DW) rice samples, as shown in Figure 2, which was found to be identical to the findings in TPC. According to our results, red rice’s free phenolic and flavonoid content was higher than that of brown rice varieties.
Flavonoids and phenolics, as we know, are covalently linked to cell wall structures via ester linkages, which cannot be digested immediately but may withstand stomach processing and make it to the colon undamaged. Bacteria break them down in the colon, releasing the bound phenolics to perform beneficial biological actions locally. As a result, both bound and free phenolics and flavonoids are absorbed by the body and have positive effects. Furthermore, our findings are consistent with previous research in which cereals had higher free phenolics and flavonoid levels [16]; we also observed higher TFC than in previous studies. These differences in rice values between researchers could be attributed to changes in the growing meteorological conditions, landscape and genotypes. Furthermore, different extraction solvents and methods can significantly impact the phenolic content of cereals.
Anthocyanins are potent antioxidants and the most abundant hydrophilic flavonoids in cereal grains. In our research, the red rice variety (DM29) showed the highest anthocyanin content (317.29 ± 1.86 mg CG3 Equiv./100 g, DW), followed by the brown rice variety 01708 (289.38 ±1.21 mg CG3 Equiv./100 g, DW). This demonstrates that anthocyanin content is associated with the color of the rice and contains more substantial antioxidant properties (Figure 2, Supplementary Table S2). Furthermore, the current research found a link between anthocyanin concentration in rice and grain color. Anthocyanins are the primary determinant of pigmented versus non-pigmented varieties. Anthocyanin consumption has been linked to various health benefits, including neuroprotection, glycemic control, anticancer, anti-hypertension and immune response enhancement. According to our findings, our present colored rice contains more anthocyanin than previously reported [11,13].

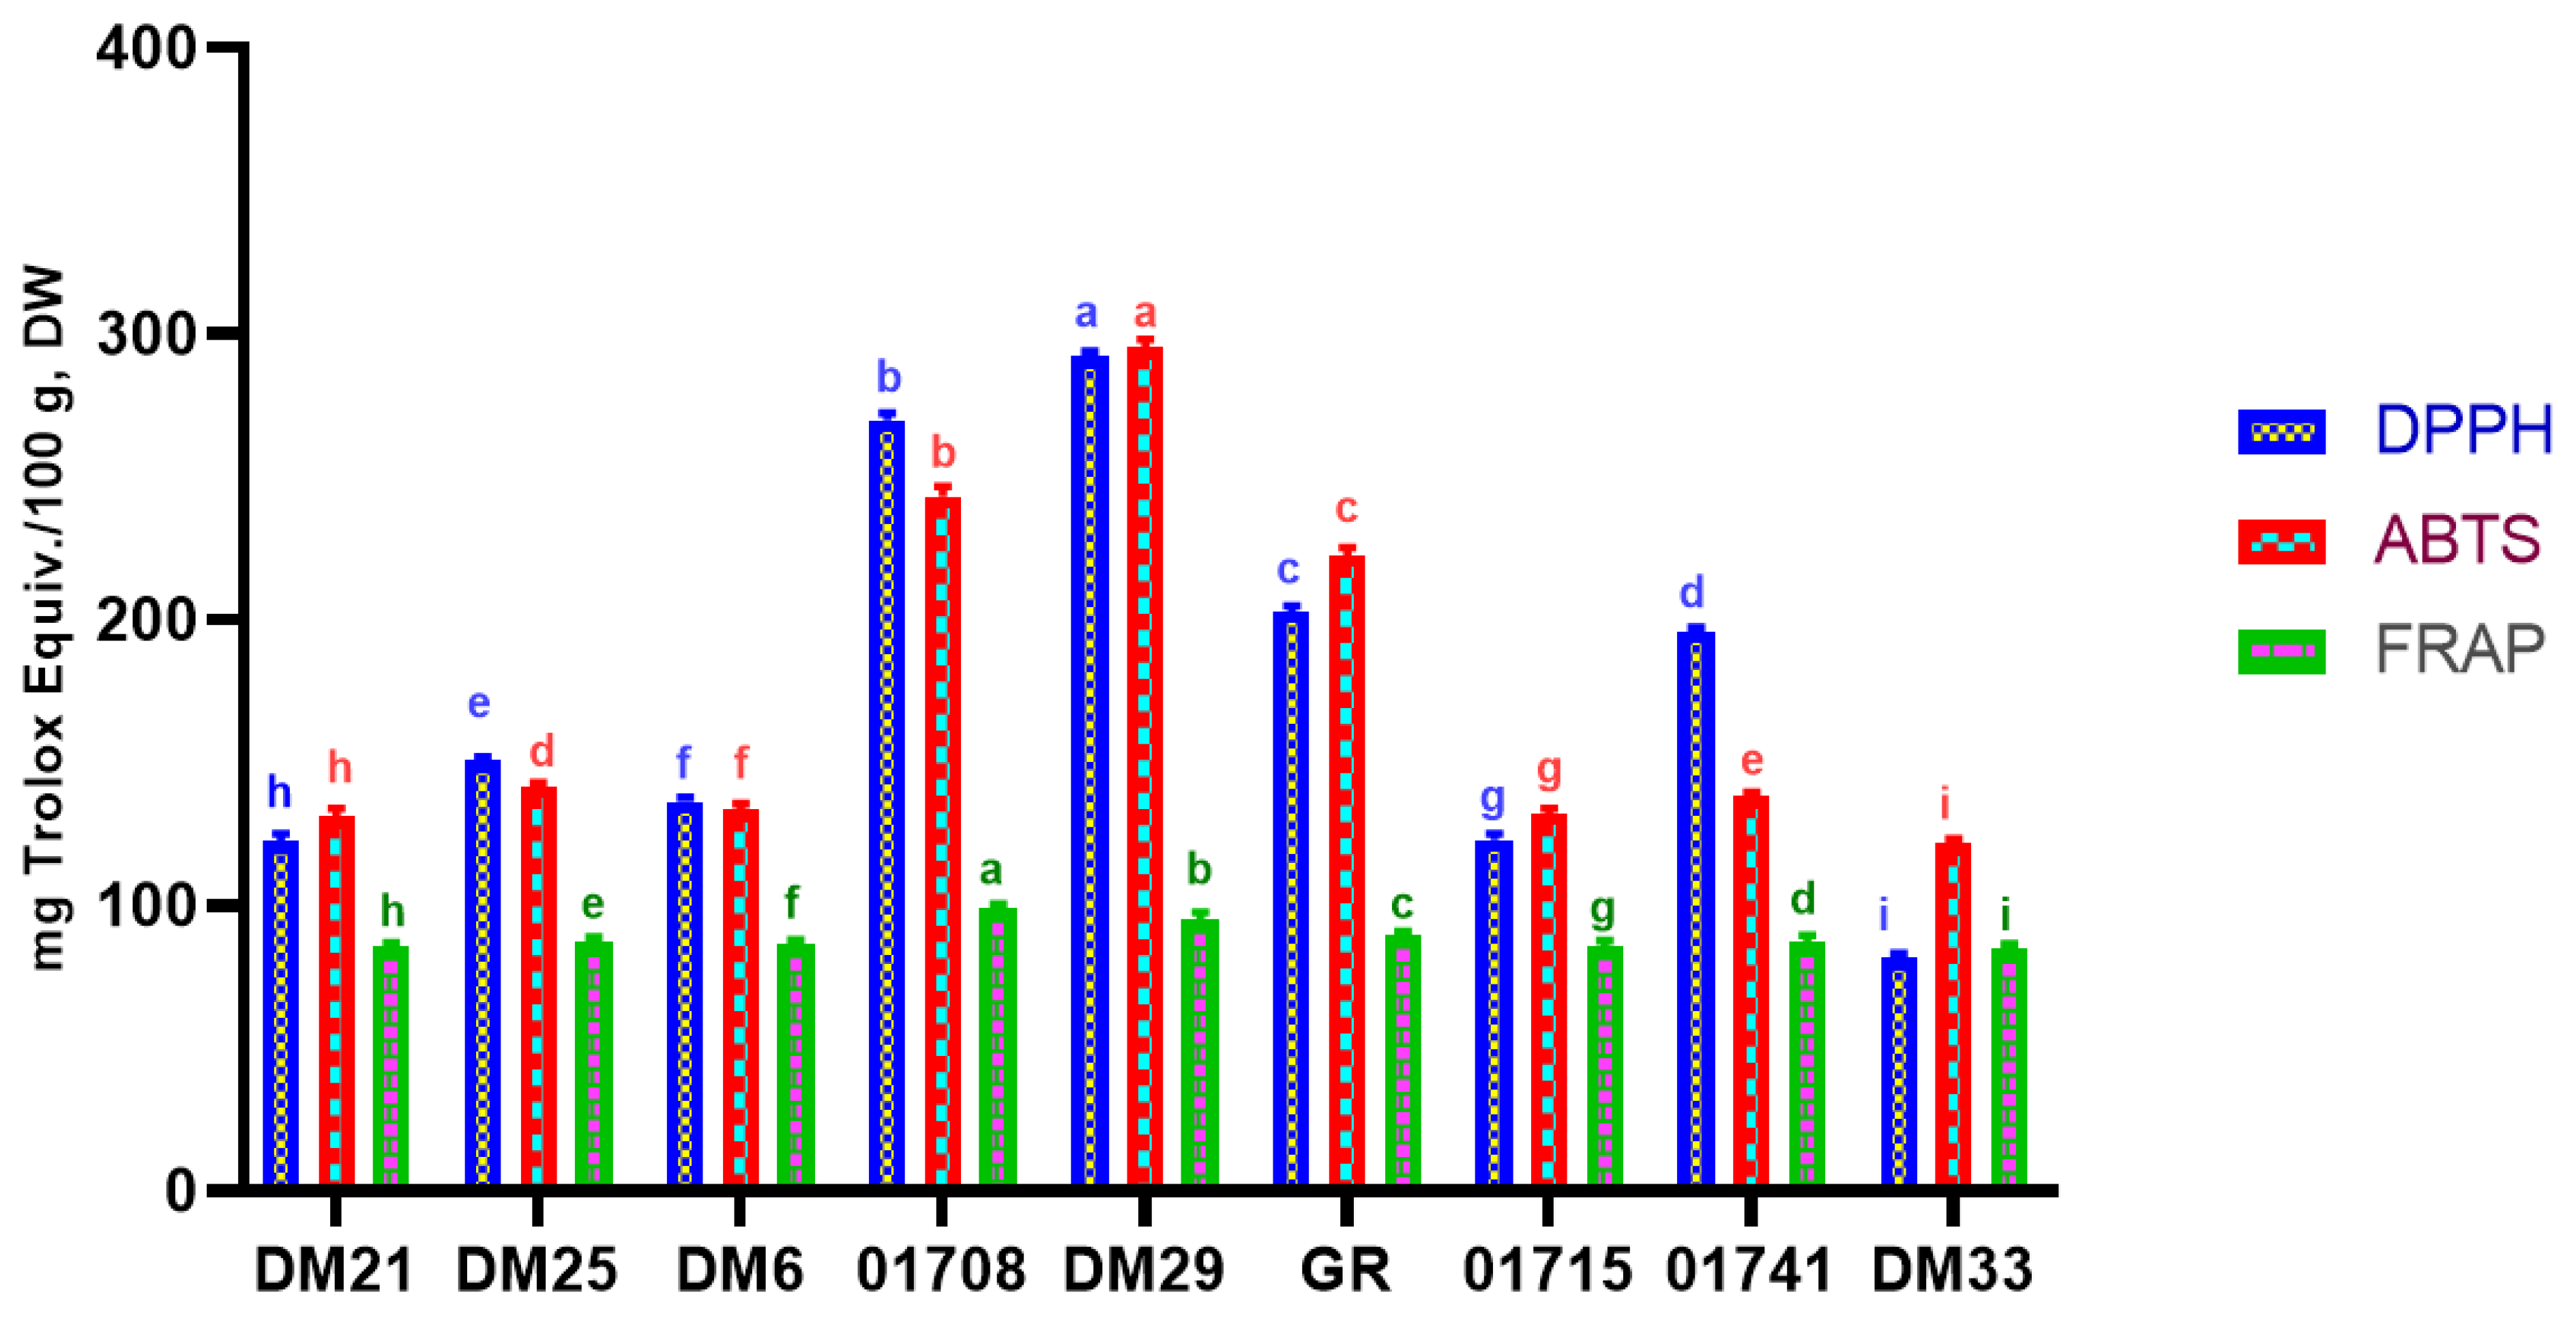
3.2. In-Vitro Antioxidant Analysis (DPPH, ABTS, & FRAP)

Because of their antioxidant activity, phenolic compounds are generally desirable components for human health. We chose the DPPH, ABTS, and FRAP tests because they examine different antioxidant mechanisms, with the former based on hydrogen and electron transfer reactions and the latter solely on electron transfer reactions. Rice extracts are effective antioxidants due to various processes, including metal ion chelation, reducing capacity, free radical scavenging, and lipid peroxidation prevention [20]. Figure 3, Supplementary Table S2, represents measured values of FRAP, DPPH and ABTS for different tested rice varieties.
The color of the rice was found to have a significant effect on DPPH activity (p < 0.05). Red rice extract DM29 (291.88 1.31 mg Trolox Equiv./100 g, DW) had the highest DPPH activity, followed by the 01708 and GR (269.93 1.61 and 202.84 1.38 mg Trolox Equiv./100 g, DW) samples, respectively. ABTS, like DPPH, yielded identical results in the ABTS assay. The highest ABTS activity was found in red rice DM29 (295.17 2.02 mg Trolox Equiv./100 g, DW). FRAP was highest in the 01708 brown rice variety, with 98.821.17 mg Trolox Equiv./100 g, DW, followed by the DM29 red rice and GR brown rice varieties. The antioxidant activity results from this study show significant differences between rice cultivars. Based on the current study results, we can conclude that some rice varieties had lower free radical scavenging ability than red rice and some brown rice varieties; this could be due to differences in growing conditions. Our findings support our TPC, TFC and TAC levels, with DM29 red rice having the highest antioxidant potential, followed by the 01708 and GR rice samples. Previous research has shown that rice grains’ total phenolics, flavonoids and anthocyanin content is positively related to their antioxidant activity [21]. Our findings were also higher than a few previous studies [22,23]. This implies that colored rice contains more antioxidants than white rice, which is more commonly consumed in our diet. More rice varieties have been developed as nutritious meals in recent years, and they are becoming increasingly popular among consumers. However, the lower antioxidant activity of white rice compared to colored rice may be due to the loss of the outer bran layer during milling, which has been found to contain higher levels of phenolic compounds with antioxidant properties.
We have also performed Pearson’s correlation coefficient (Supplementary Table S3 and Figure S1), which determines the likelihood of a link between TFC, TAC, TPC, ABTS, FRAP and DPPH radical scavenging activities. In our study, phenolics (TPC) had a significant positive correlation with flavonoids (r = 0.99209) and anthocyanin content (r = 0.97546). However, TPCs had a significant negative correlation with the radical assays ABTS (r = −0.58031), DPPH (r = −0.58287) and FRAP (r = −0.43893). TFC was also found to have a significant negative relationship with radical DPPH (r = −0.5386), FRAP (r = −0.38687) and ABTS (r = −0.53317). In addition, TAC, showed a similar trend of a significant negative relationship with the radicals DPPH (r = −0.67579), ABTS (r = −0.68322) and FRAP (r = −0.54529). DPPH radical scavenging activity, on the other hand, showed good linear correlations with FRAP & ABTS radicals of 0.94189 and 0.99711, respectively. To help understand the correlations, we have included a Supplementary Figure and table. In Supplementary Figure S1, blue represents strong positive correlations with values near +1, while red colored circles represent strong negative correlations with values near −1. Our findings corroborate previous research on antioxidant and phenolic effects in grains.

3.3. HPLC-FLD-MS/MS and UHPLC Q-TOF-MS/MS Identification and Quantification of Amino Acid and Phenolic Compounds in Different Rice Samples

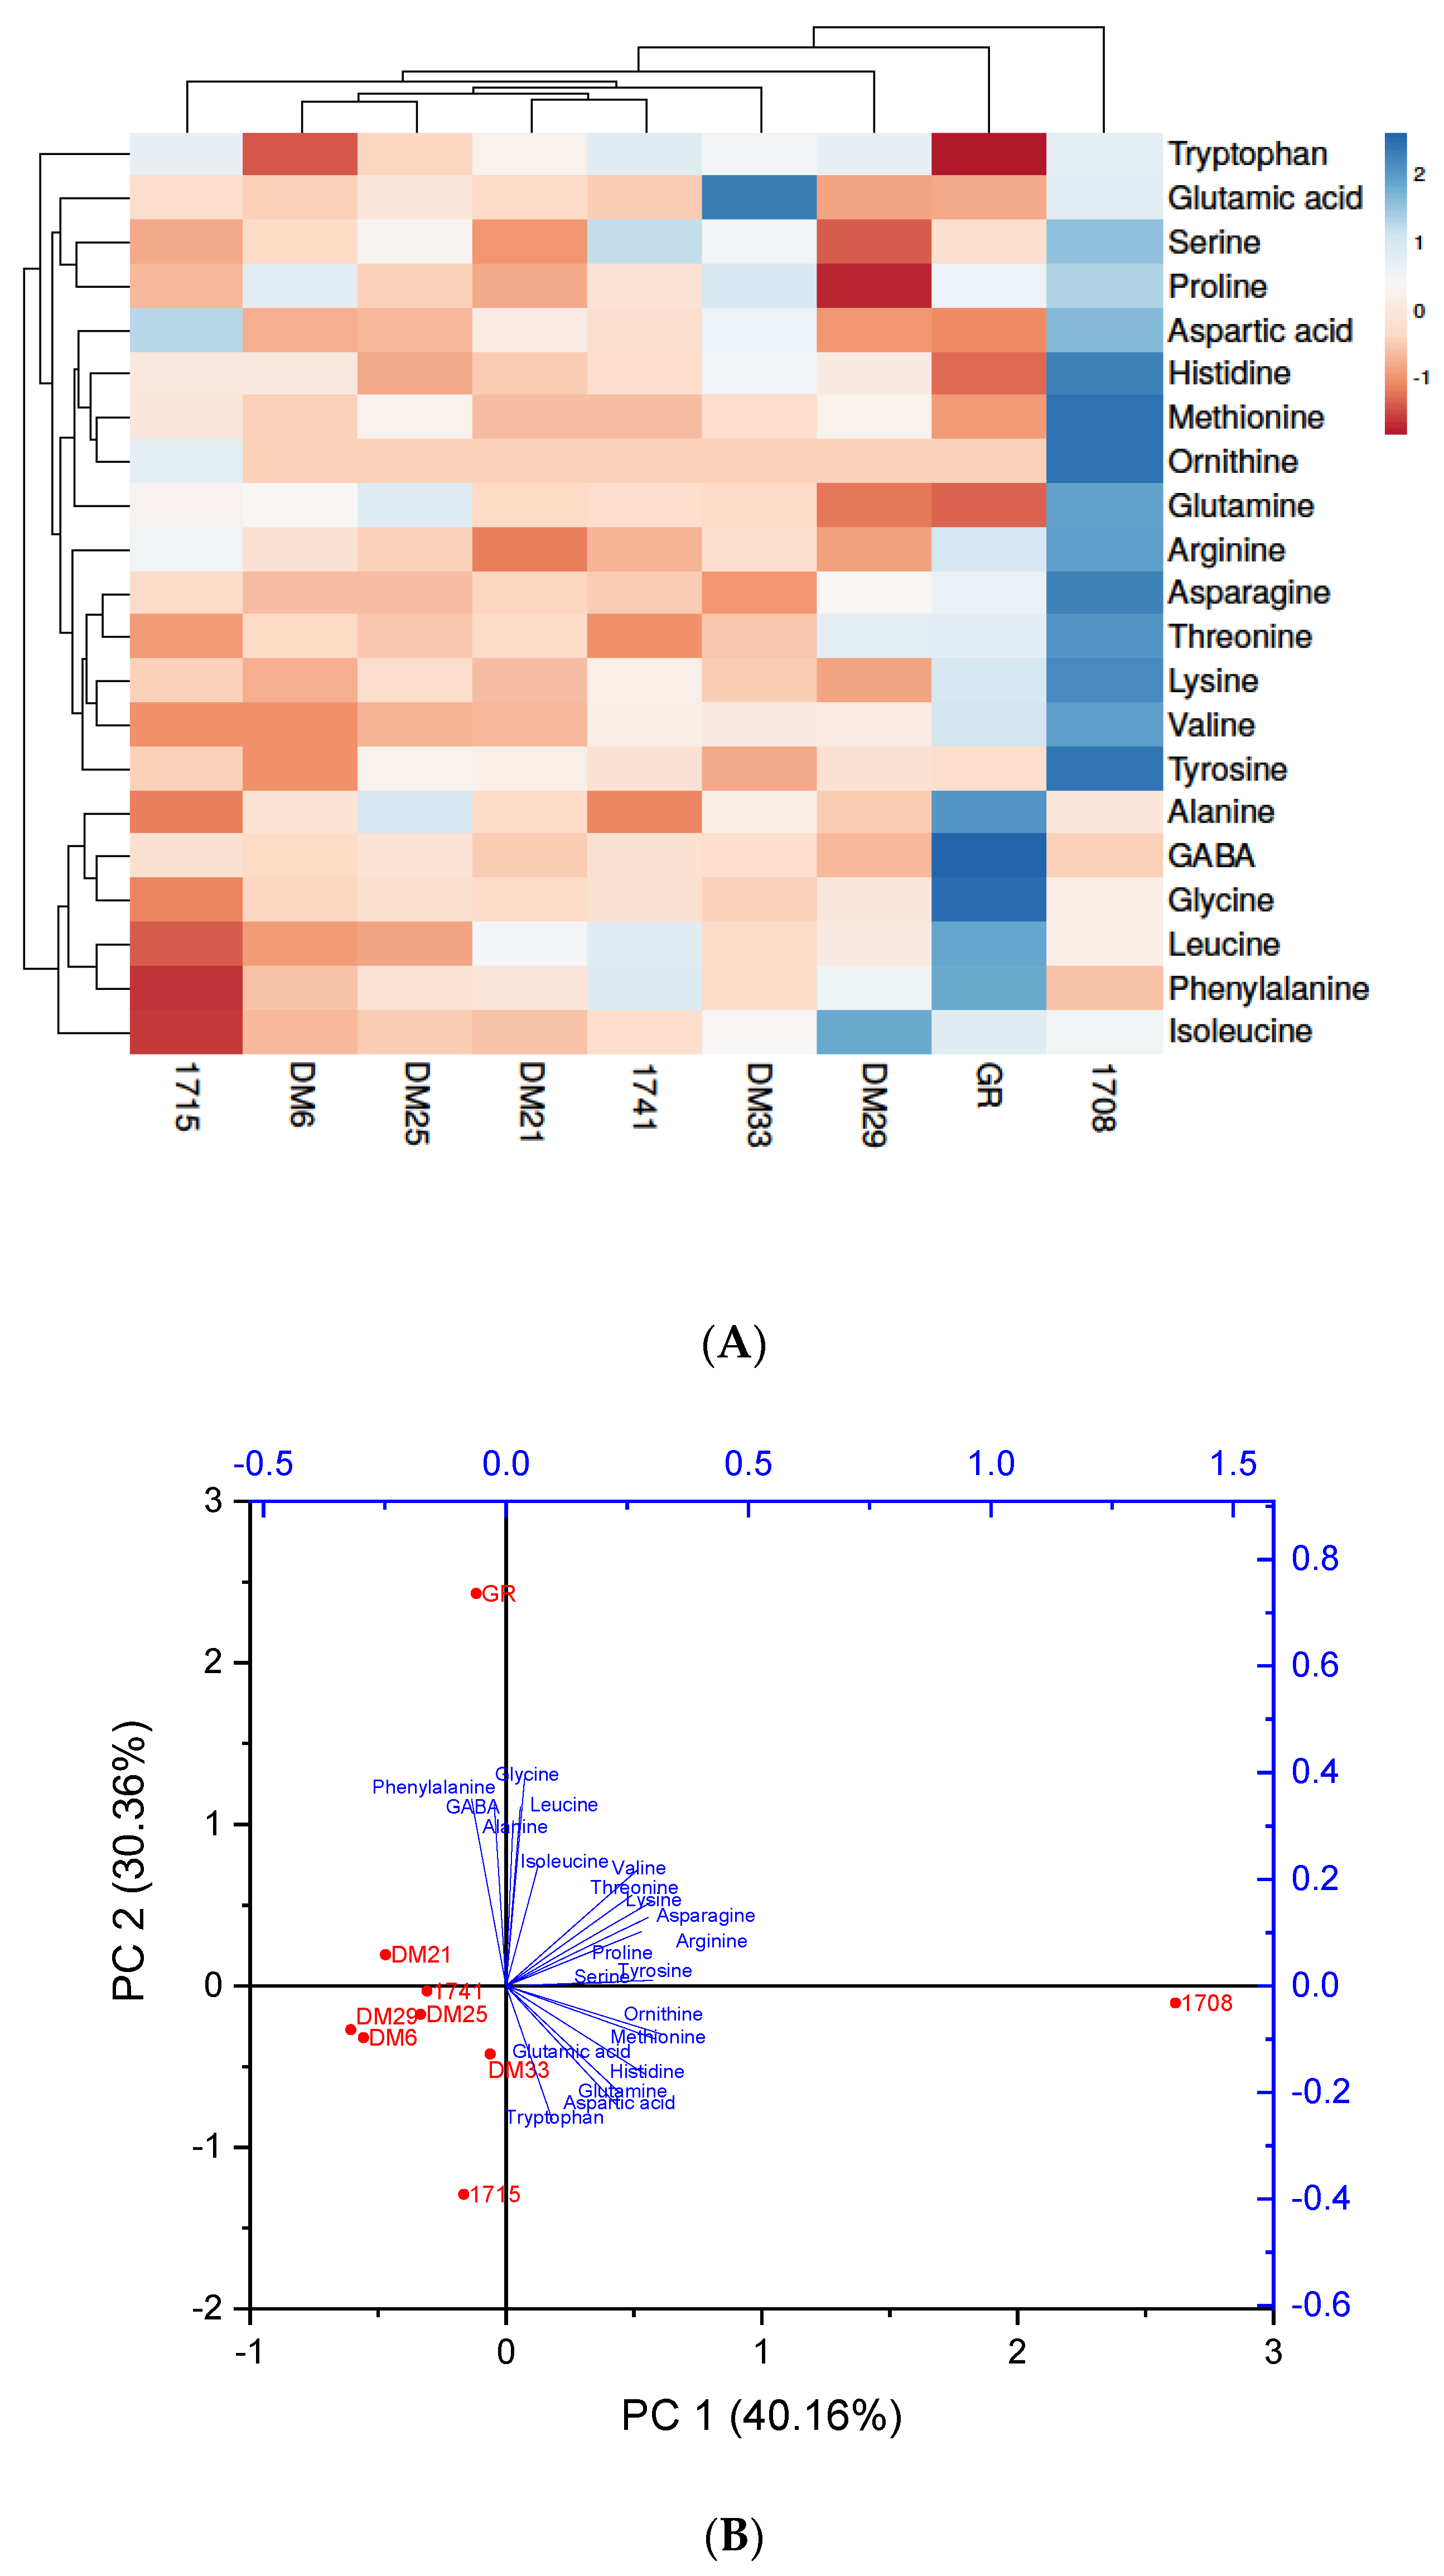
3.3.1. Amino Acid Detection in Different Colored Rice

Amino acids play an essential role in the growth and development of organisms and can help improve food taste. Rice protein has many applications, including a use as a functional food ingredient in infant formula and sports nutrition, because it is a hypoallergenic food with higher digestibility and biological value than other major cereals [24]. Rice proteins are well known for having a relatively good amino acid balance. In the present study, 21 amino acids were discovered (Table 1, Supplementary Figure S2). The heat map (Figure 4A) examined nine rice samples for amino acid concentrations. The color scheme progressed from blue to red, indicating a decrease in amino acid concentration. The highest amino acid level was detected in the 01708 and GR brown rice varieties.
In contrast, the lowest levels were found in the 01715 brown rice variety, where a low level may be due to more bound amino acids with parent molecules. Some essential amino acids, such as histidine, threonine, valine, methionine and lysine, were found in the highest concentrations in 1708 rice samples. At the same time, some of the essential amino acids found in lower concentrations in the 1708 sample were found in higher concentrations in the GR sample, which had the second-highest concentration of amino acids among different tested varieties. Furthermore, certain conditionally essential amino acids were also higher in the 01708 brown rice sample (serine, glutamine, arginine, tyrosine, ornithine and proline) Table 1. It was discovered that the amino acid content of rice varieties varies depending on rice genotype, growing environment and geographical origin [25]. The present findings also imply that the rice samples used in this study represented a high level of diversity. Because these rice varieties were grown in different locations and environments, the environmental effects could be considered in our study. The wide range of variability could be attributed to various rice genotypes, growth years and growth locations for samples. As a result, using colored rice in the human diet is expected to provide more protein and amino acids, which are essential for health and well-being.
PCA is an effective method for identifying primary metabolites in high-throughput profiles. As a result, PCA analysis was employed in our present study to screen the major metabolites and identify metabolic differences among nine rice varieties. Variable separation was investigated, and PCA was used to highlight the discriminative metabolites; PC1 & 2 principal components (PCs) explained 70.52 percent of the total data (PC1: 40.16 percent; PC2: 30.36 percent), indicating that the model correctly predicted the data. The well separation of all nine rice samples and amino acids was shown in the plot in Figure 4B. The amino acid profiles of 01708 and GR rice samples were divergent from all other rice samples, indicating that these two samples have a greater diversity of amino acids. On the other hand, other rice samples were more comparable. The PCA graph indicates a similar abundance of metabolites in the rice cultivars, as shown by the heat map.

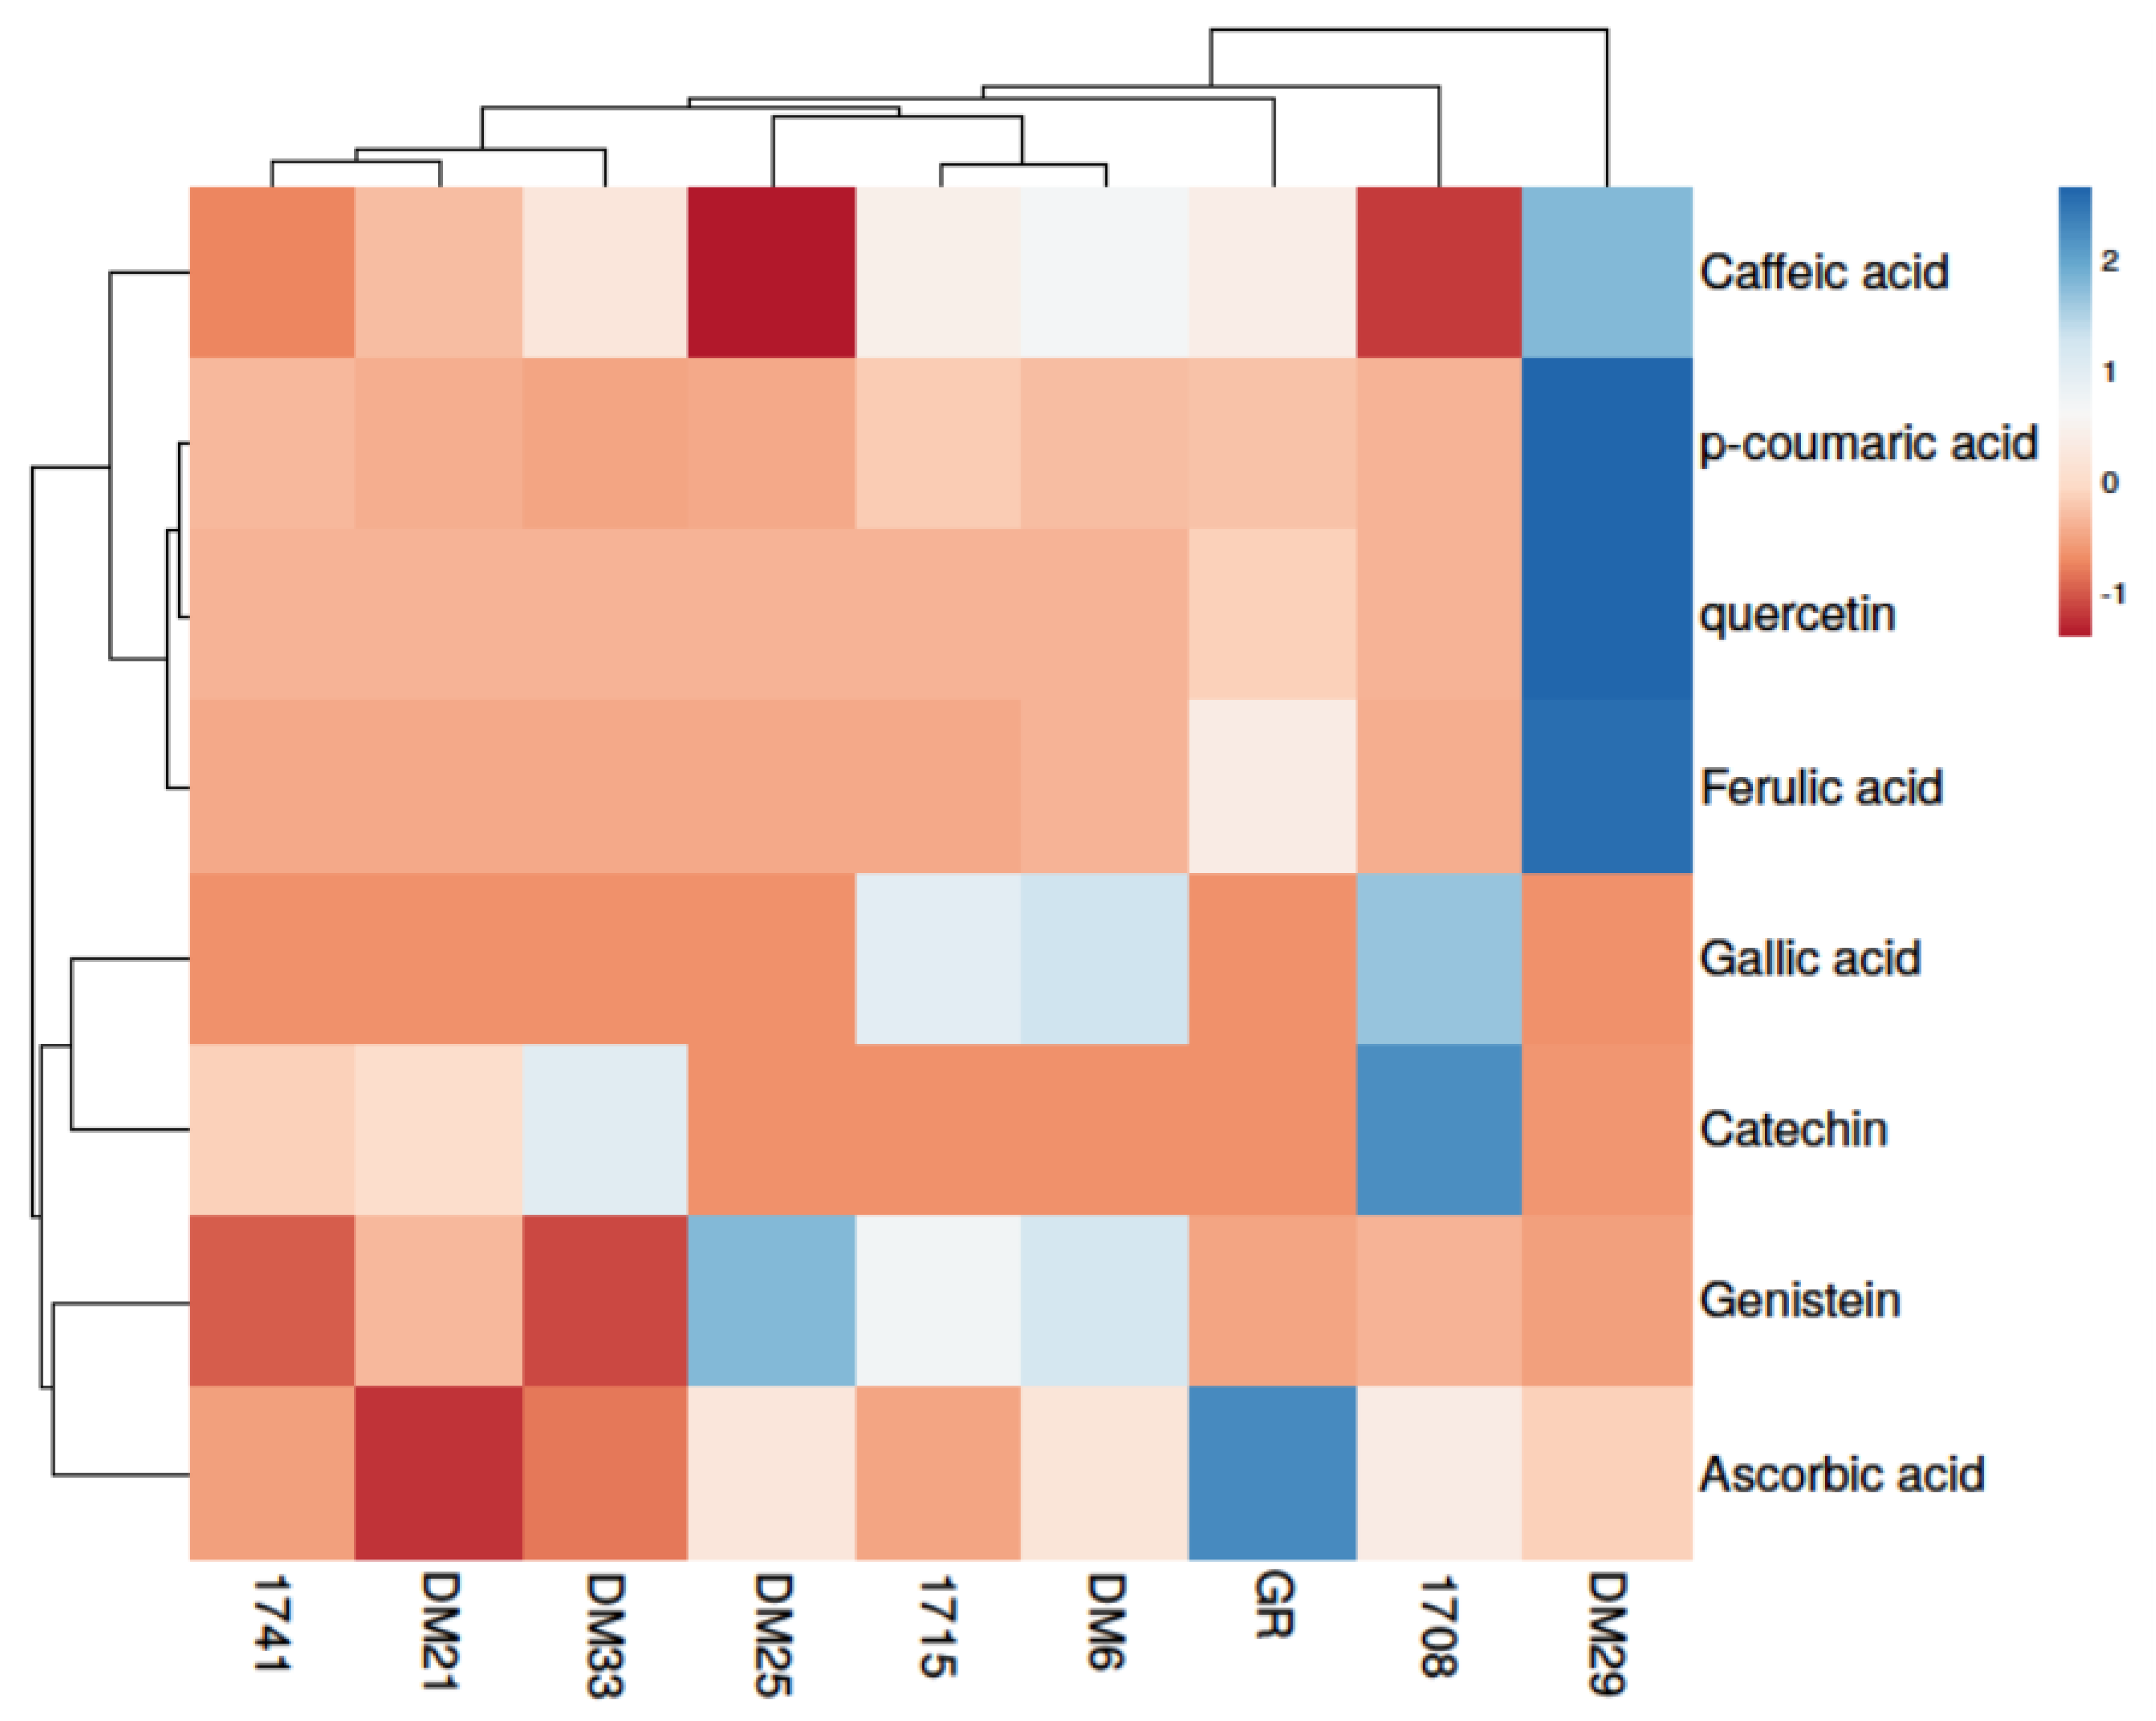
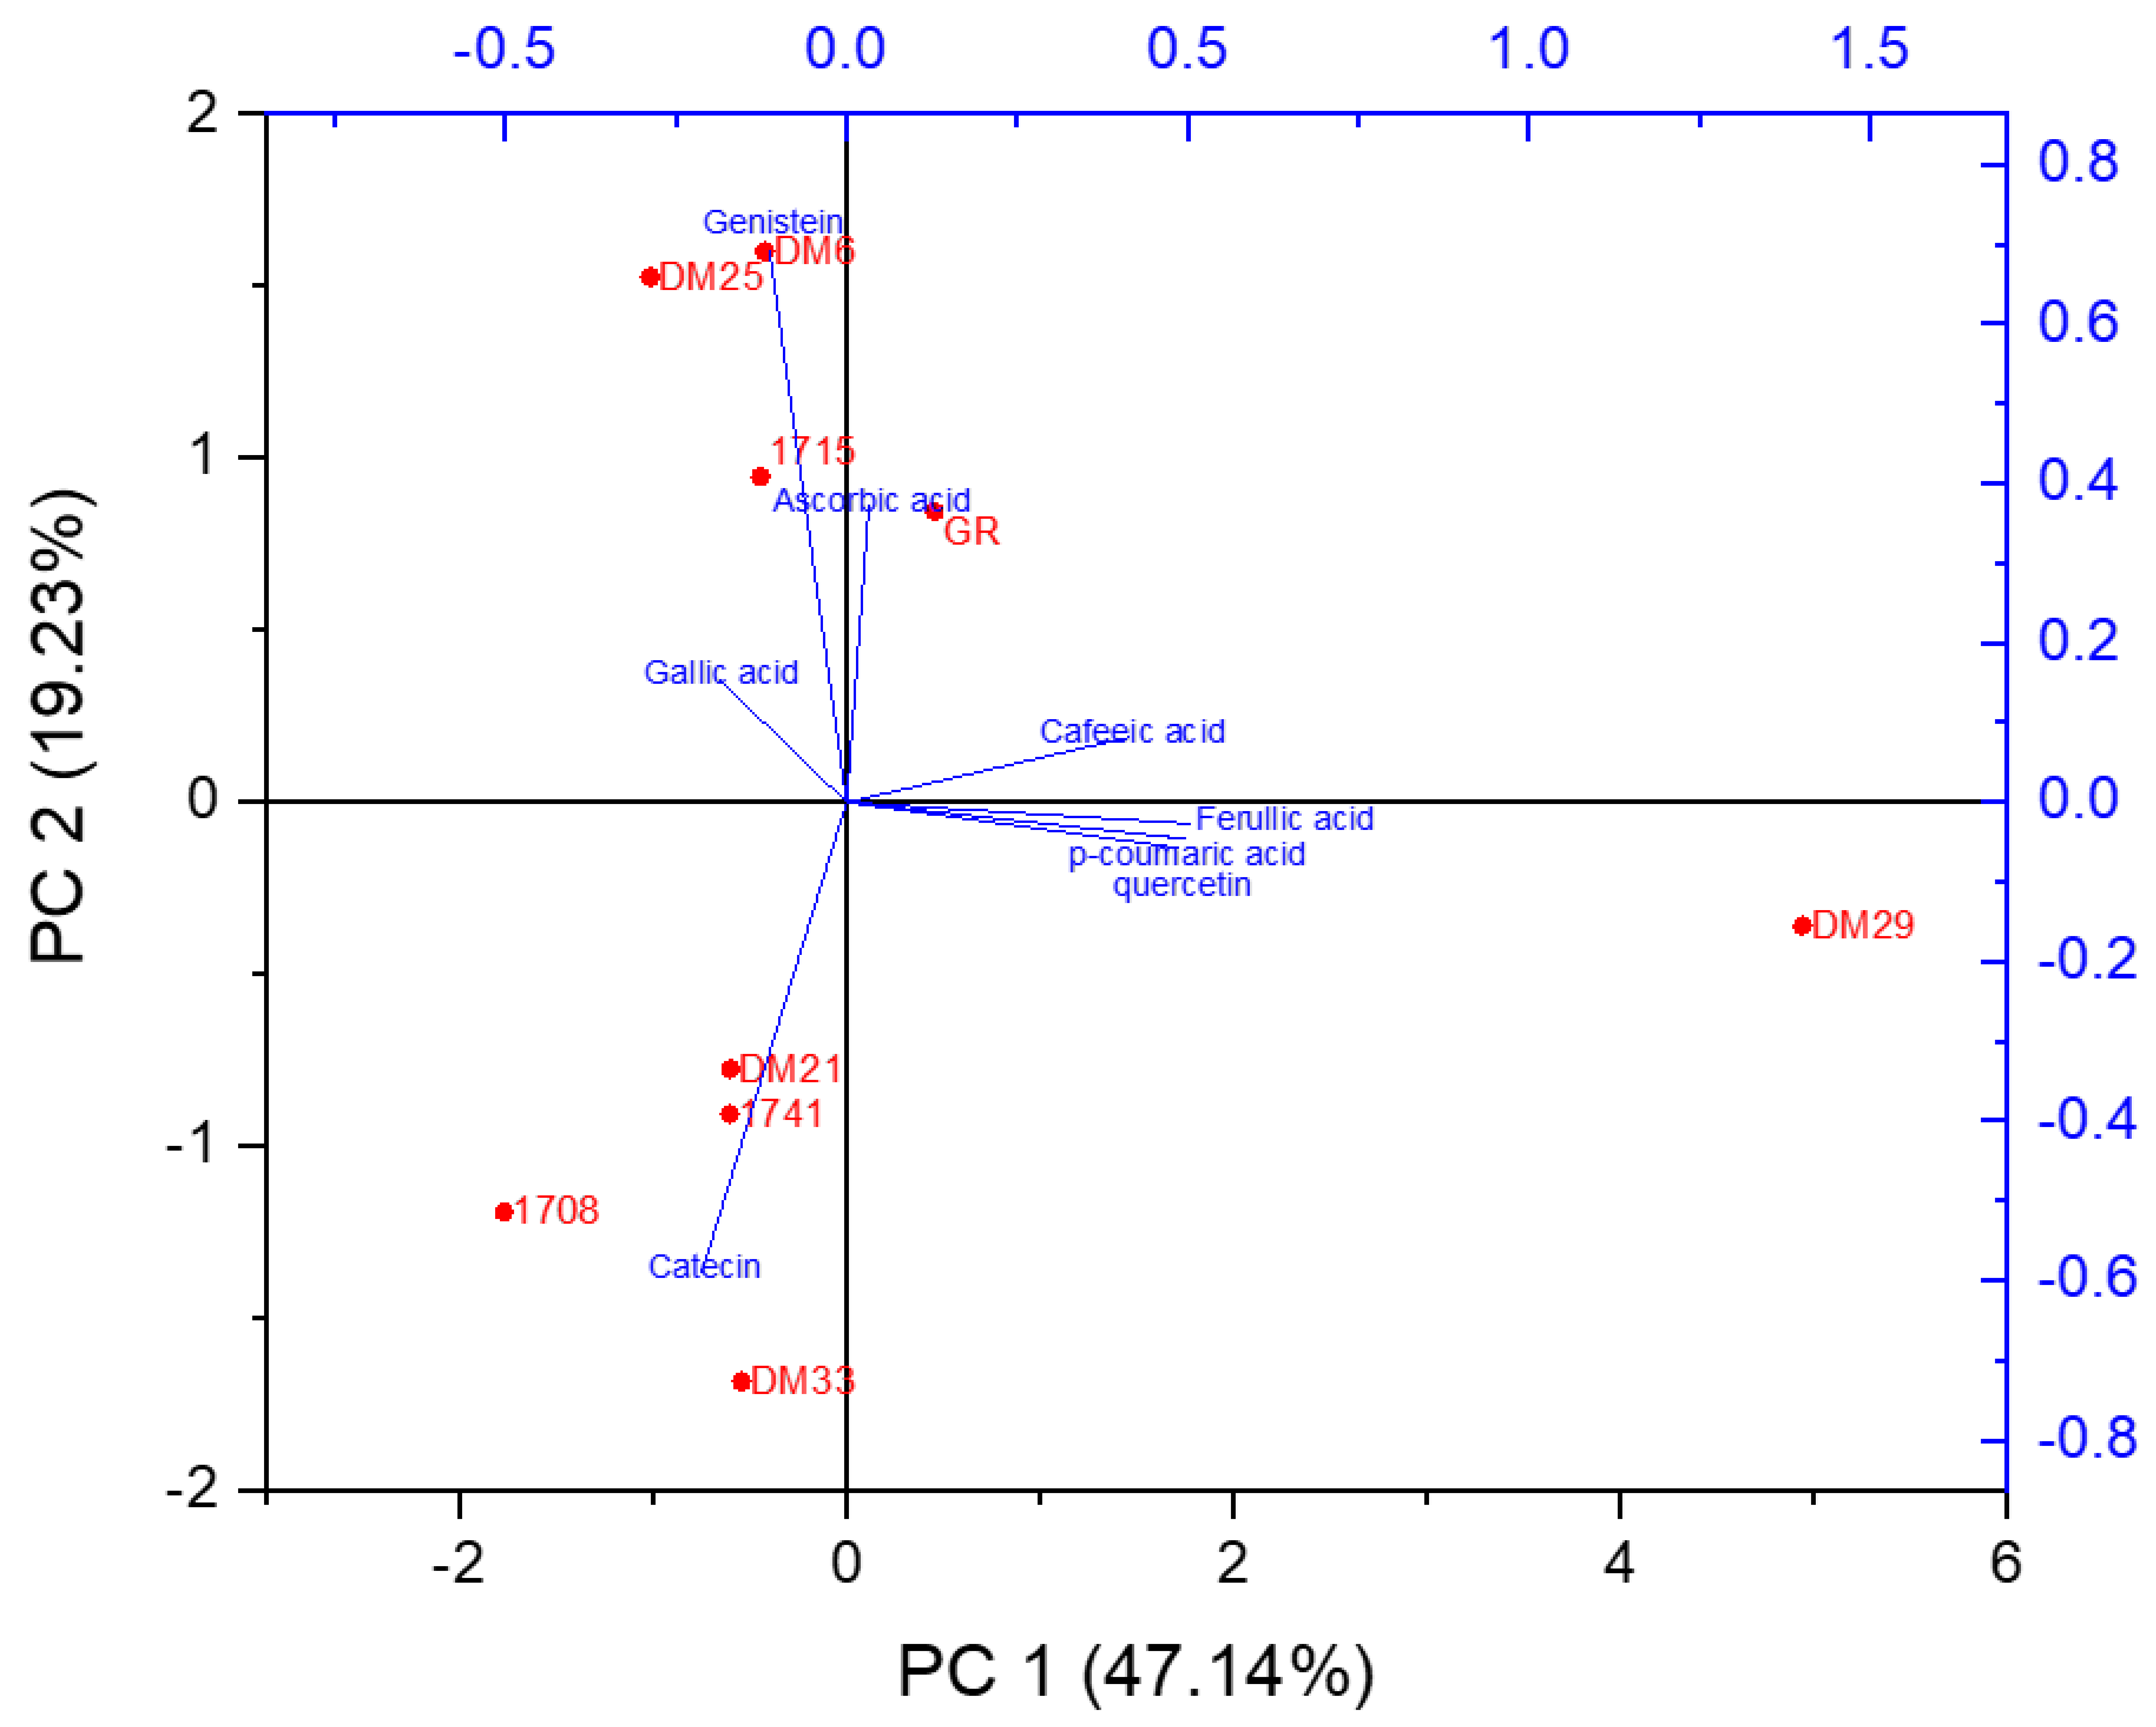
3.3.2. Phenolic Compounds Identification in Nine Different Colored Rice Varieties

The phenolic phytochemicals were quantified and categorized using the UHPLC-Q-TOF-MS/MS method, allowing rapid comparison with the standards (Supplementary Figure S3 and Table S2). The UHPLC-Q-TOF MS/MS approach is becoming a popular and dependable method for metabolite detection among researchers in various fields.
It has been proposed that phenolic chemicals are responsible for the health benefits of whole-grain rice consumption in preventing chronic infections. Dietary phenolics, found in various foods, fruits, cereals and beverages, are phytotherapy chemicals. They are bioactive components generally related to protective activity for maintaining good health when consumed regularly [26]. In our current study, eight authentic standards—genistein, gallic acid, caffeic acid, quercetin, catechin, ferulic acid, p-coumaric acid and ascorbic acid (Supplementary Figure S3 and Table S2)—were used to quantify their concentrations in current nine rice varieties. These common standards were used for quantification because previous research has shown their potential as a potent antioxidant [27,28,29,30]. Significant differences were discovered when the levels of phenolic compounds in each sample were compared; Table 2 represents the phenolic content in nine rice samples.
The highest concentrations of p-coumaric acid (11.67 µg/g), ferulic acid (71.53 µg/g), quercetin (1025.27 µg/g) and caffeic acid (1.78 µg/g) were found in the DM29 red rice variety. Gallic acid was found in only three rice varieties out of nine, with the most abundant being 01708 brown rice. 1708 was also high in catechin, with a 1.071 µg/g concentration. GR brown rice had the highest ascorbic acid content (180.64 µg/g), and DM25 was the highest in genistein content (0.84 µg/g) among all nine varieties. In the current study, the most prevalent phenolic acids in red and brown rice were ascorbic acid, ferulic acid, p-coumaric acid, quercetin and caffeic acid. Our findings show that the red rice variety has significantly higher phenolic content than brown rice, which correlates with antioxidant activity and anthocyanin content. As a result, the findings of this study are consistent with previous findings that phenolic compounds in grains were primarily responsible for rice grain antioxidants and other biological activities [15,31]. A heat map analysis was used to group rice varieties based on their phenolic concentrations. The color scheme progressed from red to blue, indicating increasing concentration (Figure 5A). The highest concentration of phenolics was found in a DM29 sample, followed by 01708 and GR brown rice samples. There were significant differences in the types and numbers of phenolic compounds found in nine rice varieties. The synthesis of phenolic compounds in cereals is affected by several factors, including harvesting and planting technology, growth conditions, varieties, the ripening process, storage and the extraction process, indicating that this could be one of the reasons for phenolic diversity in our research [32,33].
The KEGG databases were used to show the early metabolic pathways of some of the phenolic compounds identified in our study (https://www.genome.jp/kegg/pathway.html accessed on 10 March 2022) (Supplementary Figure S4). The flavone and flavonol biosynthesis pathways, vitamin digestion and absorption pathways, isoflavonoid biosynthesis and phenylpropanoid biosynthesis pathways are the few that govern the production of these phenolic compounds.
The phenylpropanoid biosynthesis pathway produced most of the phenol metabolites, cinnamic acid, p-coumaric acid, caffeic acid, ferulic acid, 5-hydroxyferulic acid, sikimic acid and quinic acid. Genistein and its derivatives were synthesized during the Isoflavonoid biosynthesis. Meanwhile, the flavonoid metabolic pathway produced catechin and its derivatives: epicatechin, (+)-catechin, epigallocatechin and gallocatechin. The flavone and flavonol biosynthesis pathways, on the other hand, produced quercetin and its derivatives. As a result, we discovered that variations in the amounts of phenolic compounds in rice varieties might be linked to differences in the transition of specific genes to critical sites in the metabolic pathway. Later, the metabolic pathways could be used to validate transformation genes responsible for triggering particular phytochemical genes and can provide recommendations for the selection and acquisition of unique variations.
PCA was used to improve interpretations and eliminate multicollinearity. Furthermore, according to the heat map interpretations, a similar tendency was seen in the PCA analysis of nine rice varieties for phenolic content (Figure 5B). The PC1 & PC2 components graph showed that the data from nine rice varieties were well separated into distinct clusters. The GR sample was rich in ascorbic acid; 01708 was abundant in catechin and gallic acid; DM25 was found richest in genistein; however, the significant abundance of identified phenolic compounds was seen in the DM29 red rice variety.

4. Conclusions

This study described nine rice varieties’ antioxidant activity, amino acid and phenolic phytochemical identification. The antioxidant activities (ABTS, DPPH and FRAP) and TPC, TFC and TAC concentrations in rice samples varied significantly. To the best of our knowledge, this is the first time these nine varieties from various regions of South Korea have been compared. According to this study, tested rice samples were high in amino acids and phenolic compounds and had high antioxidant activity. Twenty-one amino acids and eight authentic phenolic compounds were discovered in tested nine rice varieties. Furthermore, there were noticeable differences between the different rice colors. The highest levels of amino acids were found in 1708 brown rice, whereas phenolic content varied depending on rice color, with DM29 red rice having the highest phenolic content. A strong link was found in this study between phenolic components and antioxidant activity. These findings indicate that pigmented rice contains a high concentration of phenolics, anthocyanins and other phytochemicals that may benefit human health. This research would be helpful in furthering our understanding of the nutritional value of different colors of rice and its high potential as a natural antioxidant. These findings have important implications for improving human health through increased consumption of colored rice and its use in developing food products. In vivo research on the ability of colored rice to reduce oxidative stress-related illnesses, on the other hand, is required for further validation of its health-promoting properties and functional food development.

Supplementary Materials

The following supporting information can be downloaded at: https://www.mdpi.com/article/10.3390/antiox11050839/s1, Figure S1: Pearson correlation coefficients of total phenolic content, flavonoid content, anthocyanin and antioxidant capacities in nine rice varieties ethanol extracts; Figure S2: Amino acids Chromatograms for different rice samples to better understand the difference among nine rice samples; Figure S3: Phenolic compounds quantified in the ethanol extracts of nine rice varieties using UHPLC-Q-TOF-MS/MS; Figure S4: The preliminary metabolic or biosynthesis pathway of some of the phenolic compounds quantified in tested rice varieties; Table S1: Table showing names, area, color, and characteristics of nine different rice varieties; Table S2: Total antioxidants DPPH, ABTS, FRAP, TPC, TFC, and TAC measured values in samples of nine tested rice varieties; Table S3: Pearson correlation coefficients of total phenolic content, flavonoid content, anthocyanin content, and antioxidant capacity in ethanol extracts of nine rice varieties.

Author Contributions

Conceptualization, A.T. and D.-H.O.; Data curation, A.T., M.-J.L., Formal analysis; A.T., M.-J.L., N.-H.K., Funding acquisition, D.-H.O.; Investigation, A.T., M.-J.L. Methodology: A.T., M.-J.L. Software; F.E., H.-J.H., S.V., Supervision; D.-H.O. Roles/Writing-original draft; A.T., Writing-review & editing: A.T., M.-J.L., N.-H.K., K.B. All authors have read and agreed to the published version of the manuscript.

Funding

This research was funded by a grant from the fourth Brain Korea (BK) 21 Plus Project (Grant No.4299990913942), financed by the Korean Government, Republic of Korea.

Institutional Review Board Statement

Not applicable.

Informed Consent Statement

Not applicable.

Data Availability Statement

Data is contained in the article.

Acknowledgments

This study was made possible thanks to a grant from the fourth Brain Korea (BK) 21 Plus Project (Grant No.4299990913942), financed by the Korean Government, Republic of Korea.

Conflicts of Interest

The authors declare no conflict of interest. The funders had no role in study design, data collection, analysis, publishing decisions, or manuscript preparation.

References

  1. Ni, S.; Li, Z.; Ying, J.; Zhang, J.; Chen, H. Decreased Spikelets 4 encoding a novel tetratricopeptide repeat domain-containing protein is involved in DNA repair and spikelet number determination in rice. Genes 2019, 10, 214. [Google Scholar] [CrossRef] [PubMed] [Green Version]
  2. Samyor, D.; Das, A.B.; Deka, S.C. Pigmented rice a potential source of bioactive compounds: A review. Int. J. Food Sci. Technol. 2017, 52, 1073–1081. [Google Scholar] [CrossRef]
  3. Mbanjo, E.G.N.; Kretzschmar, T.; Jones, H.; Ereful, N.; Blanchard, C.; Boyd, L.A.; Sreenivasulu, N. The Genetic Basis and Nutritional Benefits of Pigmented Rice Grain. Front. Genet. 2020, 11, 229. [Google Scholar] [CrossRef] [Green Version]
  4. Deng, G.-F.; Xu, X.-R.; Zhang, Y.; Li, D.; Gan, R.-Y.; Li, H.-B. Phenolic compounds and bioactivities of pigmented rice. Crit. Rev. Food Sci. Nutr. 2013, 53, 296–306. [Google Scholar] [CrossRef] [PubMed]
  5. Tyagi, A.; Yeon, S.-J.; Daliri, E.B.-M.; Chen, X.; Chelliah, R.; Oh, D.-H. Untargeted Metabolomics of Korean Fermented Brown Rice Using UHPLC Q-TOF MS/MS Reveal an Abundance of Potential Dietary Antioxidative and Stress-Reducing Compounds. Antioxidants 2021, 10, 626. [Google Scholar] [CrossRef] [PubMed]
  6. Tyagi, A.; Shabbir, U.; Chelliah, R.; Daliri, E.B.-M.; Chen, X.; Oh, D.-H. Limosilactobacillus reuteri Fermented Brown Rice: A Product with Enhanced Bioactive Compounds and Antioxidant Potential. Antioxidants 2021, 10, 1077. [Google Scholar] [CrossRef] [PubMed]
  7. Goufo, P.; Trindade, H. Factors influencing antioxidant compounds in rice. Crit. Rev. Food Sci. Nutr. 2017, 57, 893–922. [Google Scholar] [CrossRef] [PubMed]
  8. García-Sánchez, A.; Miranda-Díaz, A.G.; Cardona-Muñoz, E.G. The role of oxidative stress in physiopathology and pharmacological treatment with pro-and antioxidant properties in chronic diseases. Oxidative Med. Cell. Longev. 2020, 2020, 2082145. [Google Scholar] [CrossRef] [PubMed]
  9. Dordevic, D.; Kushkevych, I.; Jancikova, S.; Zeljkovic, S.C.; Zdarsky, M.; Hodulova, L. Modeling the effect of heat treatment on fatty acid composition in home-made olive oil preparations. Open Life Sci. 2020, 15, 606–618. [Google Scholar] [CrossRef] [PubMed]
  10. Tyagi, A.; Chen, X.; Shabbir, U.; Chelliah, R.; Oh, D.H. Effect of slightly acidic electrolyzed water on amino acid and phenolic profiling of germinated brown rice sprouts and their antioxidant potential. LWT 2022, 157, 113119. [Google Scholar] [CrossRef]
  11. Rao, S.; Callcott, E.T.; Santhakumar, A.B.; Chinkwo, K.A.; Vanniasinkam, T.; Luo, J.; Blanchard, C.L. Profiling polyphenol composition and antioxidant activity in Australian-grown rice using UHPLC Online-ABTS system. J. Cereal Sci. 2018, 80, 174–179. [Google Scholar] [CrossRef]
  12. Zhang, S.; Ma, Q.; Dong, L.; Jia, X.; Liu, L.; Huang, F.; Liu, G.; Sun, Z.; Chi, J.; Zhang, M. Phenolic Profiles and Bioactivities of Different Milling Fractions of Rice Bran from Black Rice. Food Chem. 2022, 378, 132035. [Google Scholar] [CrossRef]
  13. Nayeem, S.; Sundararajan, S.; Ashok, A.K.; Abusaliya, A.; Ramalingam, S. Effects of cooking on phytochemical and antioxidant properties of pigmented and non-pigmented rare Indian rice landraces. Biocatal. Agric. Biotechnol. 2021, 32, 101928. [Google Scholar] [CrossRef]
  14. Ghasemzadeh, A.; Karbalaii, M.T.; Jaafar, H.Z.; Rahmat, A. Phytochemical constituents, antioxidant activity, and antiproliferative properties of black, red, and brown rice bran. Chem. Cent. J. 2018, 12, 1–13. [Google Scholar] [CrossRef] [PubMed] [Green Version]
  15. Van Hung, P. Phenolic compounds of cereals and their antioxidant capacity. Crit. Rev. Food Sci. Nutr. 2016, 56, 25–35. [Google Scholar] [CrossRef]
  16. Min, B.; Gu, L.; McClung, A.M.; Bergman, C.J.; Chen, M.-H. Free and bound total phenolic concentrations, antioxidant capacities, and profiles of proanthocyanidins and anthocyanins in whole grain rice (Oryza sativa L.) of different bran colours. Food Chem. 2012, 133, 715–722. [Google Scholar] [CrossRef]
  17. Chatthongpisut, R.; Schwartz, S.J.; Yongsawatdigul, J. Antioxidant activities and antiproliferative activity of Thai purple rice cooked by various methods on human colon cancer cells. Food Chem. 2015, 188, 99–105. [Google Scholar] [CrossRef] [PubMed]
  18. Gong, E.S.; Liu, C.; Li, B.; Zhou, W.; Chen, H.; Li, T.; Wu, J.; Zeng, Z.; Wang, Y.; Si, X.; et al. Phytochemical profiles of rice and their cellular antioxidant activity against ABAP induced oxidative stress in human hepatocellular carcinoma HepG2 cells. Food Chem. 2020, 318, 126484. [Google Scholar] [CrossRef]
  19. Ito, V.C.; Lacerda, L.G. Black rice (Oryza sativa L.): A review of its historical aspects, chemical composition, nutritional and functional properties, and applications and processing technologies. Food Chem. 2019, 301, 125304. [Google Scholar] [CrossRef] [PubMed]
  20. Ghasemzadeh, A.; Jaafar, H.Z.; Juraimi, A.S.; Tayebi-Meigooni, A. Comparative evaluation of different extraction techniques and solvents for the assay of phytochemicals and antioxidant activity of hashemi rice bran. Molecules 2015, 20, 10822–10838. [Google Scholar] [CrossRef] [PubMed] [Green Version]
  21. Ghasemzadeh, A.; Jaafar, H.Z.; Rahmat, A. Phytochemical constituents and biological activities of different extracts of Strobilanthes crispus (L.) Bremek leaves grown in different locations of Malaysia. BMC Complementary Altern. Med. 2015, 15, 422. [Google Scholar] [CrossRef] [Green Version]
  22. Devraj, L.; Panoth, A.; Kashampur, K.; Kumar, A.; Natarajan, V. Study on physicochemical, phytochemical, and antioxidant properties of selected traditional and white rice varieties. J. Food Process Eng. 2020, 43, e13330. [Google Scholar] [CrossRef]
  23. Chinprahast, N.; Tungsomboon, T.; Nagao, P. Antioxidant activities of T hai pigmented rice cultivars and application in sunflower oil. Int. J. Food Sci. Technol. 2016, 51, 46–53. [Google Scholar] [CrossRef]
  24. Amagliani, L.; O’Regan, J.; Kelly, A.L.; O’Mahony, J.A. The composition, extraction, functionality and applications of rice proteins: A review. Trends Food Sci. Technol. 2017, 64, 1–12. [Google Scholar] [CrossRef]
  25. Saleh, A.S.; Wang, P.; Wang, N.; Yang, L.; Xiao, Z. Brown rice versus white rice: Nutritional quality, potential health benefits, development of food products, and preservation technologies. Compr. Rev. Food Sci. Food Saf. 2019, 18, 1070–1096. [Google Scholar] [CrossRef] [PubMed] [Green Version]
  26. Okarter, N.; Liu, R.H. Health benefits of whole grain phytochemicals. Crit. Rev. Food Sci. Nutr. 2010, 50, 193–208. [Google Scholar] [CrossRef] [PubMed]
  27. Daroi, P.A.; Dhage, S.N.; Juvekar, A.R. p-Coumaric acid mitigates lipopolysaccharide induced brain damage via alleviating oxidative stress, inflammation and apoptosis. J. Pharm. Pharmacol. 2021, 74, 556–564. [Google Scholar] [CrossRef] [PubMed]
  28. Fuentes, J.; de Camargo, A.C.; Atala, E.; Gotteland, M.; Olea-Azar, C.; Speisky, H. Quercetin Oxidation Metabolite Present in Onion Peel Protects Caco-2 Cells against the Oxidative Stress, NF-kB Activation, and Loss of Epithelial Barrier Function Induced by NSAIDs. J. Agric. Food Chem. 2021, 69, 2157–2167. [Google Scholar] [CrossRef]
  29. Hathout, H.M.; Sobhy, H.M.; Abou-Ghanima, S.; El-Garawani, I.M. Ameliorative role of ascorbic acid on the oxidative stress and genotoxicity induced by acetamiprid in Nile tilapia (Oreochromis niloticus). Environ. Sci. Pollut. Res. 2021, 28, 55089–55101. [Google Scholar] [CrossRef] [PubMed]
  30. Rahman Mazumder, M.A.; Hongsprabhas, P. Genistein as antioxidant and antibrowning agents in in vivo and in vitro: A review. Biomed. Pharmacother. 2016, 82, 379–392. [Google Scholar] [CrossRef] [PubMed]
  31. Goffman, F.; Bergman, C. Rice kernel phenolic content and its relationship with antiradical efficiency. J. Sci. Food Agric. 2004, 84, 1235–1240. [Google Scholar] [CrossRef]
  32. Sumczynski, D.; Kotásková, E.; Družbíková, H.; Mlček, J. Determination of contents and antioxidant activity of free and bound phenolics compounds and in vitro digestibility of commercial black and red rice (Oryza sativa L.) varieties. Food Chem. 2016, 211, 339–346. [Google Scholar] [CrossRef] [PubMed]
  33. Min, B.; McClung, A.M.; Chen, M.H. Phytochemicals and antioxidant capacities in rice brans of different color. J. Food Sci. 2011, 76, C117–C126. [Google Scholar] [CrossRef]
Figure 1. The geographical location of tested rice varieties collected from different areas of South Korea.
Antioxidants 11 00839 g001
Figure 2. TPC, TFC, and TAC representation of nine tested rice varieties. Results were expressed as mean ± SD of triplicate analyses. Different alphabetical letters in each column represent statistically significant differences (Tukey and Duncan test p ≤ 0.05) DW, dry weight sample, TPC (a), TFC (b), and TAC (c).
Antioxidants 11 00839 g002
Figure 3. Antioxidant activities (DPPH, ABTS and FRAP) of nine rice varieties. Results were expressed as mean ± SD of triplicate analyses. Different alphabetical letters in each column represent statistically significant differences (Tukey and Duncan test p ≤ 0.05) DW, dry weight sample.
Antioxidants 11 00839 g003
Figure 4. Different colored rice varieties have different amino acid levels. (A) The heat map depicts varying levels of amino acid, with blue indicating a higher level of amino acid and red indicating a lower level of amino acid. (B) By comparing PC 1 and PC2, the principal component analysis (PCA) of rice varieties was demonstrated.
Antioxidants 11 00839 g004
Figure 5. Different colored rice varieties have different phenolic phytochemicals levels. (A) The heat map depicts varying levels of phenolics, with blue indicating a higher level and red indicating a lower level of phenolics. (B) By comparing PC 1 and PC2, the principal component analysis (PCA) of rice varieties was demonstrated.
Antioxidants 11 00839 g005aAntioxidants 11 00839 g005b
Table 1. Amino acids detected in the free fractions of nine rice varieties (01708, 01715, 01741, DM6, DM21, DM25, DM29, DM33 & GR) by HPLC-FLD-MS/MS.
Amino AcidSample NameRetention Time (min)Area
LU * min
Detected Concentration (µg/g)Relative Area %Height
LU
Aspartic acid017082.030.564.2012.175.07
017152.040.534.0017.314.90
017412.050.413.11140.023.68
DM62.040.372.8012.863.41
DM292.040.362.6812.103.29
DM252.050.382.8512.303.46
DM212.040.443.3115.214.09
DM332.040.483.5714.514.35
GR2.050.352.649.493.26
Glutamic acid017083.540.766.7116.495.05
017153.540.665.8121.284.28
017413.540.645.6221.504.18
DM63.530.645.6622.024.29
DM293.540.605.3420.444.02
DM253.540.686.0021.934.55
DM213.540.655.7722.474.35
DM333.540.918.0527.676.06
GR3.540.615.3616.344.06
Asparagine017087.071.278.9327.629.64
017157.080.493.4215.763.64
017417.080.422.9614.263.18
DM67.070.392.7513.463.01
DM297.070.694.8423.365.21
DM257.070.392.7212.522.97
DM217.070.453.1315.373.39
DM337.070.281.958.422.11
GR7.070.775.4020.735.87
Serine017087.670.251.315.461.81
017157.680.160.825.091.13
017417.680.241.248.001.72
DM67.670.180.926.031.28
DM297.670.130.704.550.98
DM257.670.201.056.511.46
DM217.680.150.795.171.09
DM337.670.211.096.361.53
GR7.670.180.944.861.32
Glutamine017088.700.211.604.511.61
017158.700.131.004.211.00
017418.710.110.823.590.81
DM68.700.131.034.601.03
DM298.700.060.472.080.49
DM258.700.161.215.091.24
DM218.700.100.783.500.81
DM338.690.100.793.130.80
GR8.690.050.411.450.42
Histidine017089.250.050.741.090.37
017159.250.030.430.960.20
017419.260.030.390.910.19
DM69.250.030.431.020.21
DM299.250.030.441.010.19
DM259.240.020.320.710.15
DM219.250.020.370.860.18
DM339.240.030.491.020.25
GR9.240.020.260.470.13
Glycine017089.720.110.392.430.81
017159.710.080.292.640.59
017419.720.100.363.500.76
DM69.720.100.343.380.71
DM299.710.110.383.640.79
DM259.720.100.363.330.75
DM219.720.100.353.470.73
DM339.710.100.342.970.73
GR9.710.170.594.511.22
Threonine017089.970.090.511.910.59
017159.970.050.311.730.37
017419.970.050.301.770.37
DM69.970.060.352.070.39
DM299.970.070.422.450.47
DM259.970.060.341.870.39
DM219.970.060.352.090.40
DM339.960.060.341.770.41
GR9.960.070.421.960.48
Arginine0170810.740.231.694.981.78
0171510.740.151.104.851.17
0174110.750.090.632.880.63
DM610.750.110.843.950.91
DM2110.740.080.562.560.60
DM2510.740.100.743.260.77
DM2910.740.060.452.080.48
DM3310.740.110.823.400.88
GR10.740.181.324.841.35
Alanine0170811.850.261.105.731.96
0171511.840.170.715.521.26
0174111.860.180.745.951.31
DM611.860.261.088.861.92
DM2911.840.220.947.611.68
DM2511.860.351.4511.222.56
DM2111.850.241.018.321.82
DM3311.840.281.168.462.08
GR11.840.441.8211.773.30
GABA0170812.460.040.190.860.30
0171512.450.060.281.890.43
0174112.470.060.271.920.43
DM612.470.050.231.620.35
DM2912.450.030.130.900.21
DM2512.470.060.302.000.45
DM2112.460.040.181.270.28
DM3312.450.050.261.630.40
GR12.460.231.136.321.75
Tyrosine0170813.510.040.350.940.33
0171513.510.030.210.860.19
0174113.520.030.220.950.21
DM613.520.020.180.800.18
DM2913.510.030.220.950.21
DM2513.520.030.240.990.22
DM2113.510.030.241.040.22
DM3313.500.020.200.750.18
GR13.510.030.220.740.21
Valine0170816.410.090.442.010.64
0171516.410.060.271.870.40
0174116.410.070.332.400.46
DM616.420.060.271.990.40
DM2916.420.070.332.400.48
DM2516.420.060.291.980.43
DM2116.410.060.292.120.43
DM3316.410.070.332.130.49
GR16.420.080.392.230.58
Methionine0170816.710.030.150.560.16
0171516.720.010.080.420.07
0174116.710.010.060.340.06
DM616.710.010.060.380.06
DM2916.710.010.080.490.08
DM2516.710.010.080.460.08
DM2116.710.010.060.340.06
DM3316.710.010.070.370.07
GR16.720.010.050.230.05
Tryptophan0170817.860.280.886.181.40
0171517.870.280.879.181.26
0174117.860.290.909.691.30
DM617.880.240.398.151.14
DM2917.870.280.869.581.27
DM2517.870.260.638.411.15
DM2117.860.270.779.421.31
DM3317.860.280.838.491.32
GR17.870.230.306.161.04
Phenylalanine0170818.510.010.100.320.10
0171518.510.010.070.340.08
0174118.500.020.140.700.14
DM618.520.010.100.510.10
DM2918.510.020.130.650.13
DM2518.510.020.110.530.11
DM2118.510.020.110.580.12
DM3318.500.020.100.480.11
GR18.510.020.160.660.17
Isoleucine0170818.830.030.160.700.21
0171518.830.020.090.590.12
0174118.830.030.140.920.18
DM618.840.020.120.840.15
DM2918.830.040.211.410.27
DM2518.840.030.130.830.15
DM2118.830.030.130.870.16
DM3318.830.030.160.950.20
GR18.830.030.170.930.23
Ornitnine0170819.400.010.290.280.08
0171519.390.010.120.170.04
01741NDNDNDNDND
DM6NDNDNDNDND
DM29NDNDNDNDND
DM25NDNDNDNDND
DM21NDNDNDNDND
DM33NDNDNDNDND
GRNDNDNDNDND
Leucine0170819.750.030.170.730.22
0171519.750.020.110.740.15
0174119.740.040.191.290.25
DM619.760.030.130.890.17
DM2919.750.030.161.110.22
DM2519.760.030.130.860.18
DM2119.750.040.181.230.24
DM3319.740.030.150.920.21
GR19.750.050.231.230.30
Lysine0170820.420.030.360.540.15
0171520.420.010.220.490.10
0174120.420.020.250.590.10
DM620.430.010.200.470.09
DM2920.420.010.190.450.09
DM2520.430.020.230.510.10
DM2120.420.010.210.490.08
DM3320.420.010.210.450.09
GR20.420.020.290.550.13
Proline0170824.610.211.304.480.90
0171524.610.100.653.360.45
0174124.610.130.814.380.57
DM624.610.181.126.110.78
DM2924.620.050.291.590.21
DM2524.620.110.723.700.49
DM2124.610.100.603.3.00.42
DM3324.610.191.185.690.82
GR24.610.171.064.540.74
ND-Not detected, LU * min-logical unit/min.
Table 2. Quantification of phenolic compounds identified in nine tested rice varieties (01708, 01715, 01741, DM6, DM21, DM25, DM29, DM33 & GR) by UHPLC-Q-TOF-MS/MS.
Phenolic CompoundSample NameRetention Time (min)Precursor MassConcentration (µg/g)Formula
Ascorbic acid017410.81175.025101.381C6H8O6
017150.80175.025118.182
017080.78175.025137.831
DM60.80175.025134.043
DM290.82175.025125.843
DM250.74175.025134.974
DM210.81175.025117.102
DM330.72175.025110.336
GR0.78175.025180.642
p-coumaric acid0174110.68163.0400.627C9H8O3
0171510.66163.0401.401
0170810.66163.0400.713
DM610.68163.0401.058
DM2910.68163.04011.67
DM2510.69163.0400.401
DM2110.67163.0400.870
DM3310.65163.0400.212
GR10.65163.0401.181
Ferulic acid0174112.94193.0510.174C10H10O4
0171512.93193.0510.857
0170812.93193.0511.621
DM612.94193.0512.816
DM2912.95193.05171.539
DM2512.94193.0510.064
DM2112.92193.0510.541
DM3312.94193.0510.804
GR12.92193.05119.527
Catechin017414.97289.0720.253C15H14O6
01715NDNDND
017085.25289.0721.071
DM6NDNDND
DM295.60289.0720.023
DM25NDNDND
DM215.27289.0720.197
DM335.65289.0720.626
GRNDNDND
Quercetin0174117.71301.0351.721C15H10O7
0171517.73301.0350.784
0170817.72301.0350.290
DM617.71301.0351.010
DM2917.71301.0351025.277
DM2517.73301.0350.978
DM2117.73301.0350.613
DM3317.73301.0350.163
GR17.72301.03584.211
Caffeic acid017416.92179.0350.615C9H8O4
017156.87179.0351.024
017086.89179.0350.12
DM66.96179.0351.174
DM296.88179.0351.785
DM25NDNDND
DM216.90179.0350.384
DM336.88179.0350.911
GR6.86179.0351.015
Gallic acid01741NDNDNDC7H6O5
017151.34169.0140.576
017081.28169.0140.811
DM61.48169.0140.679
DM21NDNDND
DM25NDNDND
DM29NDNDND
DM33NDNDND
GRNDNDND
Genistein0174117.97269.0460.294C15H10O5
017151.34269.0460.576
0170817.97269.0460.292
DM617.97269.0460.70
DM2917.97269.0460.248
DM2517.99269.0460.845
DM2117.98269.0460.128
DM3317.98269.0460.10
GR17.97269.0460.257
ND-Not detected.
Publisher’s Note: MDPI stays neutral with regard to jurisdictional claims in published maps and institutional affiliations.

