Article

P2X7 Receptor Augments LPS-Induced Nitrosative Stress by Regulating Nrf2 and GSH Levels in the Mouse Hippocampus

Department of Anatomy and Neurobiology, Institute of Epilepsy Research, College of Medicine, Hallym University, Chuncheon 24252, Korea
*
Author to whom correspondence should be addressed.
Antioxidants 2022, 11(4), 778; https://doi.org/10.3390/antiox11040778
Submission received: 23 March 2022 / Revised: 11 April 2022 / Accepted: 12 April 2022 / Published: 13 April 2022

Abstract

:
P2X7 receptor (P2X7R) regulates inducible nitric oxide synthase (iNOS) expression/activity in response to various harmful insults. Since P2X7R deletion paradoxically decreases the basal glutathione (GSH) level in the mouse hippocampus, it is likely that P2X7R may increase the demand for GSH for the maintenance of the intracellular redox state or affect other antioxidant defense systems. Therefore, the present study was designed to elucidate whether P2X7R affects nuclear factor-erythroid 2-related factor 2 (Nrf2) activity/expression and GSH synthesis under nitrosative stress in response to lipopolysaccharide (LPS)-induced neuroinflammation. In the present study, P2X7R deletion attenuated iNOS upregulation and Nrf2 degradation induced by LPS. Compatible with iNOS induction, P2X7R deletion decreased S-nitrosylated (SNO)-cysteine production under physiological and post-LPS treated conditions. P2X7R deletion also ameliorated the decreases in GSH, glutathione synthetase, GS and ASCT2 levels concomitant with the reduced S-nitrosylations of GS and ASCT2 following LPS treatment. Furthermore, LPS upregulated cystine:glutamate transporter (xCT) and glutaminase in P2X7R+/+ mice, which were abrogated by P2X7R deletion. LPS did not affect GCLC level in both P2X7R+/+ and P2X7R−/− mice. Therefore, our findings indicate that P2X7R may augment LPS-induced neuroinflammation by leading to Nrf2 degradation, aberrant glutamate-glutamine cycle and impaired cystine/cysteine uptake, which would inhibit GSH biosynthesis. Therefore, we suggest that the targeting of P2X7R, which would exert nitrosative stress with iNOS in a positive feedback manner, may be one of the important therapeutic strategies of nitrosative stress under pathophysiological conditions.

Graphical Abstract

1. Introduction

P2X7 receptor (P2X7R) is one of the cation-permeable ATP ligand-gated ion channels. P2X7R activation is involved in neuronal excitability, neuroinflammation and functions of astrocytes, as well as microglia [1,2,3,4]. P2X7R also regulates the generation of reactive oxygens species (ROS) and nitric oxide (NO) in response to various harmful insults [5,6]. Indeed, P2X7R activation enhances lipopolysaccharide (LPS)-induced inducible NO synthase (iNOS) expression [7,8,9]. NO can alter protein structure and function and exert biological effects directly by binding to free thiol groups on cysteine residues of target proteins forming S-nitrosylated (SNO)-proteins (known as S-nitrosylation) [10]. Furthermore, we have recently reported that S-nitrosylation of P2X7R facilitates its trafficking on the cell membrane [11]. Therefore, it is plausible that P2X7R may augment nitrosative stress with iNOS in a positive feedback manner, which would play an important role in the pathogenesis of various neurological diseases related to inflammations.
Glutathione (GSH) is an endogenous tripeptide (glutamate-cysteine-glycine) antioxidant. GSH is synthesized via several steps. Glutamate cysteine ligase (GCLC) is the rate-limiting enzyme that converts glutamate and cysteine (mostly derived from cystine; the oxidized dimer form of cysteine) to γ-glutamylcysteine. GSH synthetase (GSHS) adds glycine (derived from exogenous glycine or serine) to γ-glutamylcysteine for generating GSH in an ATP-driven reaction. Glutaminase (GLS) and glutamine synthase (GS) are also involved in GSH synthesis by regulating the glutamate-glutamine cycle [12]. In addition, some membrane transporters mediate GSH synthesis to supply neutral amino acids. Solute carrier 1 (SLC1) A4 and A5 known as ASCT1 and ASCT2, respectively, preferentially transfer the substrates alanine, serine and cysteine (term ASC) [13]. Cystine:glutamate transporter (xCT or SLC7a11) exchanges cystine for glutamate (or cysteine) with a molar ratio of 1:1 by the substrate gradients across the plasma membrane under physiological conditions [14,15]. Interestingly, P2X7R activation decreases glutamate uptake and GS activity in astrocytes, although P2X7R cannot affect the release of GSH. Furthermore, P2X7R activation regulates xCT-mediated glutamate and ASCT2-mediated D-serine releases from astrocytes [4,14,15,16,17]. Therefore, it is plausible that P2X7R activity would negatively regulate GSH levels in the brain. However, we have recently reported that P2X7R deletion paradoxically decreases the basal GSH level in the mouse hippocampus, although it does not influence GCLC, GSHS and GLS expression levels [18]. Considering P2X7R-mediated generations of ROS and NO [5,6], it is likely that P2X7R deletion may reduce the demand of GSH for maintenance of the intracellular redox state or affect other antioxidant defense systems, which has been elusive.
Nuclear factor-erythroid 2-related factor 2 (Nrf2), a redox-sensitive transcription factor, regulates antioxidant-response element (ARE)-dependent transcription and the expression of antioxidant enzymes, which contributes to a broad spectrum of cellular functions, such as redox balance, cell cycle, cell death, immunity, metabolism, selective protein degradation, development, aging and carcinogenesis [19,20]. Under physiological conditions, a cytoplasmic repressor Kelch-like erythroid cell-derived protein with CNC homology (ECH)-associated protein 1 (Keap1) binds to Nrf2, which prevents nuclear Nrf2 translocation and mediates Nrf2 polyubiquitinylation and subsequent proteasomal degradation through the cullin-3 (Cul3)-based E3 ubiquitin ligase complex [21,22,23]. Oxidation and S-nitrosylation of SH-groups in Keap1 lead to the liberation of Nrf2 from Keap1 binding and increase Nrf2-mediated transactivation of multiple ARE-bearing genes, such as GSH synthetic enzymes [21,22,23]. Since LPS administration decreases GSH levels in the brain [24], it is presumable that P2X7R-mediated nitrosative stress may affect Nrf2 activity, which regulates GSH synthesis. Indeed, P2X7R deletion prevents the diminished efficacy of N-acetylcysteine (NAC, a GSH precursor) in GSH synthesis following SIN-1 (500 μM, a generator of nitric oxide, superoxide and peroxynitrite) treatment [18]. Furthermore, glutamine regulates both GSHS and Nrf2 levels [25]. However, it is unknown whether P2X7R-mediated nitrosative stress affects Nrf2 activity/expression and GSH synthesis in response to LPS-induced neuroinflammation.
Here, we demonstrate, for the first time, that P2X7R augmented nitrosative stress by Nrf2 degradation, impaired GSH synthesis, aberrant glutamate-glutamine cycle and dysfunctions of cysteine transporter following LPS treatment. Therefore, we suggest that P2X7R may be responsible for nitrosative stress in inflammatory conditions.

2. Materials and Methods

2.1. Experimental Animals, Chemicals and LPS Treatment

We used male C57BL/6J (P2X7R+/+, WT) and P2X7R/ (KO) mice (60- to 90-day-old, 25–30 g, The Jackson Laboratory, USA) in the present study. Animals were given a commercial diet and water ad libitum under controlled conditions (22 °C ± 2 °C, 55% ± 5% humidity, and 12-h light/12-h dark cycle). All experimental protocols described below were approved by the Institutional Animal Care and Use Committee of Hallym University (Chuncheon, South Korea, Code number: Hallym 2018-3, approval date: 30 April 2018 and Hallym 2021-30, approval date: 17 May 2021). Every effort was made to reduce the number of animals employed and to minimize animal discomfort. All reagents were obtained from Sigma-Aldrich (St. Louis, MO, USA), except as noted. Animals were treated with LPS (5 mg/kg i.p.). Control animals received an equal volume of normal saline instead of LPS. Three days after LPS injection, animals were used for GSH assay, immunohistochemistry, Western blot and measurements of S-nitrosylation.

2.2. GSH Assay

Animals were sacrificed by decapitation. Hippocampal tissues were rapidly removed and sonicated with 0.5 mL of 5% sulfosalicylic acid and centrifuged at 10,000× g for 10 min at 4 °C. The supernatant was mixed with 1 mL of dithiobis-2-nitrobenzoic acid and 1 mL EDTA in 100 mL sodium phosphate buffer, pH 7.5, and 1 mL NADPH and 200 U/mL of glutathione reductase was added. GSH standards were treated identically, and optical absorbance of samples and standards was measured at 405 nm. Values were normalized to protein content as determined with a BCA protein assay kit (Thermo Scientific, Waltham, MA, USA) [18].

2.3. Immunohistochemistry

Animals were anesthetized with urethane anesthesia (1.5 g/kg, i.p.) and perfused transcardially with 4% paraformaldehyde in 0.1 M phosphate buffer (PB, pH 7.4). Brains were post-fixed in the same fixative overnight. Brain tissues were cryoprotected by infiltration with 30% sucrose overnight. Thereafter, Brains were cryosectioned at 30 μm. Free-floating sections were washed 3 times in PBS (0.1 M, pH 7.3) and incubated with 3% bovine serum albumin in PBS for 30 min at room temperature. Later, sections were incubated with a cocktail solution containing primary antibodies (Table 1) in PBS containing 0.3% Triton X-100 overnight at room temperature. Thereafter, sections were visualized with appropriate Cy2- and Cy3-conjugated secondary antibodies. Some tissues were incubated in biotinylated IgG and avidin-peroxidate complex and developed in 3,3′-diaminobenzidine in 0.1 M Tris buffer. Immunoreaction was observed using an Axio Scope microscope (Carl Zeiss Korea, Seoul, South Korea). To establish the specificity of the immunostaining, a negative control test was carried out with preimmune serum instead of the primary antibody. All experimental procedures in this study were performed under the same conditions and in parallel. To measure fluorescent intensity, five areas/animals (300 μm2/area) were randomly selected within the hippocampus (5 sections from each animal, n = 7 in each group). Thereafter, the mean intensity of each section was measured by using AxioVision Rel. 4.8 and ImageJ software. Intensity measurements were represented as the number of a 256 grayscale. The intensity of each section was standardized by setting the threshold level (mean background intensity obtained from five image inputs). Manipulation of the images was restricted to threshold and brightness adjustments to the whole image.

2.4. Western Blot

Animals were decapitated under urethane anesthesia (1.5 g/kg, i.p.). The hippocampus was rapidly dissected out and homogenized in lysis buffer. The protein concentration in the supernatant was determined using a Micro BCA Protein Assay Kit (Pierce Chemical, Dallas, TX, USA). Thereafter, Western blot was performed by the standard protocol (n = 7 in each group). The primary antibodies used in the present study are listed in Table 1. The bands were detected and quantified on an ImageQuant LAS4000 system (GE Healthcare Korea, Seoul, South Korea). As an internal reference, rabbit anti-β-actin primary antibody (1:5000) was used. The values of each sample were normalized with the corresponding amount of β-actin.

2.5. Measurement of S-Nitrosylation on GS and ASCT2

Modified biotin switch assay was performed with the S-nitrosylation Western Blot Kit (ThermoFisher) according to the manufacturer’s protocol. Briefly, lysates were reacted with ascorbate in HENS buffer for specific labeling with iodoTMTzero reagents with MMT pretreatment. Protein labeling can be confirmed by Western blot using TMT antibodies. Thereafter, TMT-labeled proteins were purified by Anti-TMT Resin, eluted by TMT elution buffer, and identified by Western blot according to standard procedures. For technical controls, we omitted ascorbate for each sample. The ratio of SNO-protein to total protein was described as S-nitrosylation levels [11].

2.6. Data Analysis

Quantitative data are expressed as mean ± standard error of the mean. After the Shapiro–Wilk W-test was used to evaluate the values on normality, data were analyzed by the Student t-test, paired Student t-test, or one-way analysis of variance (ANOVA) followed by Newman–Keuls posthoc test. A p < 0.05 is considered to be statistically different.

3. Results

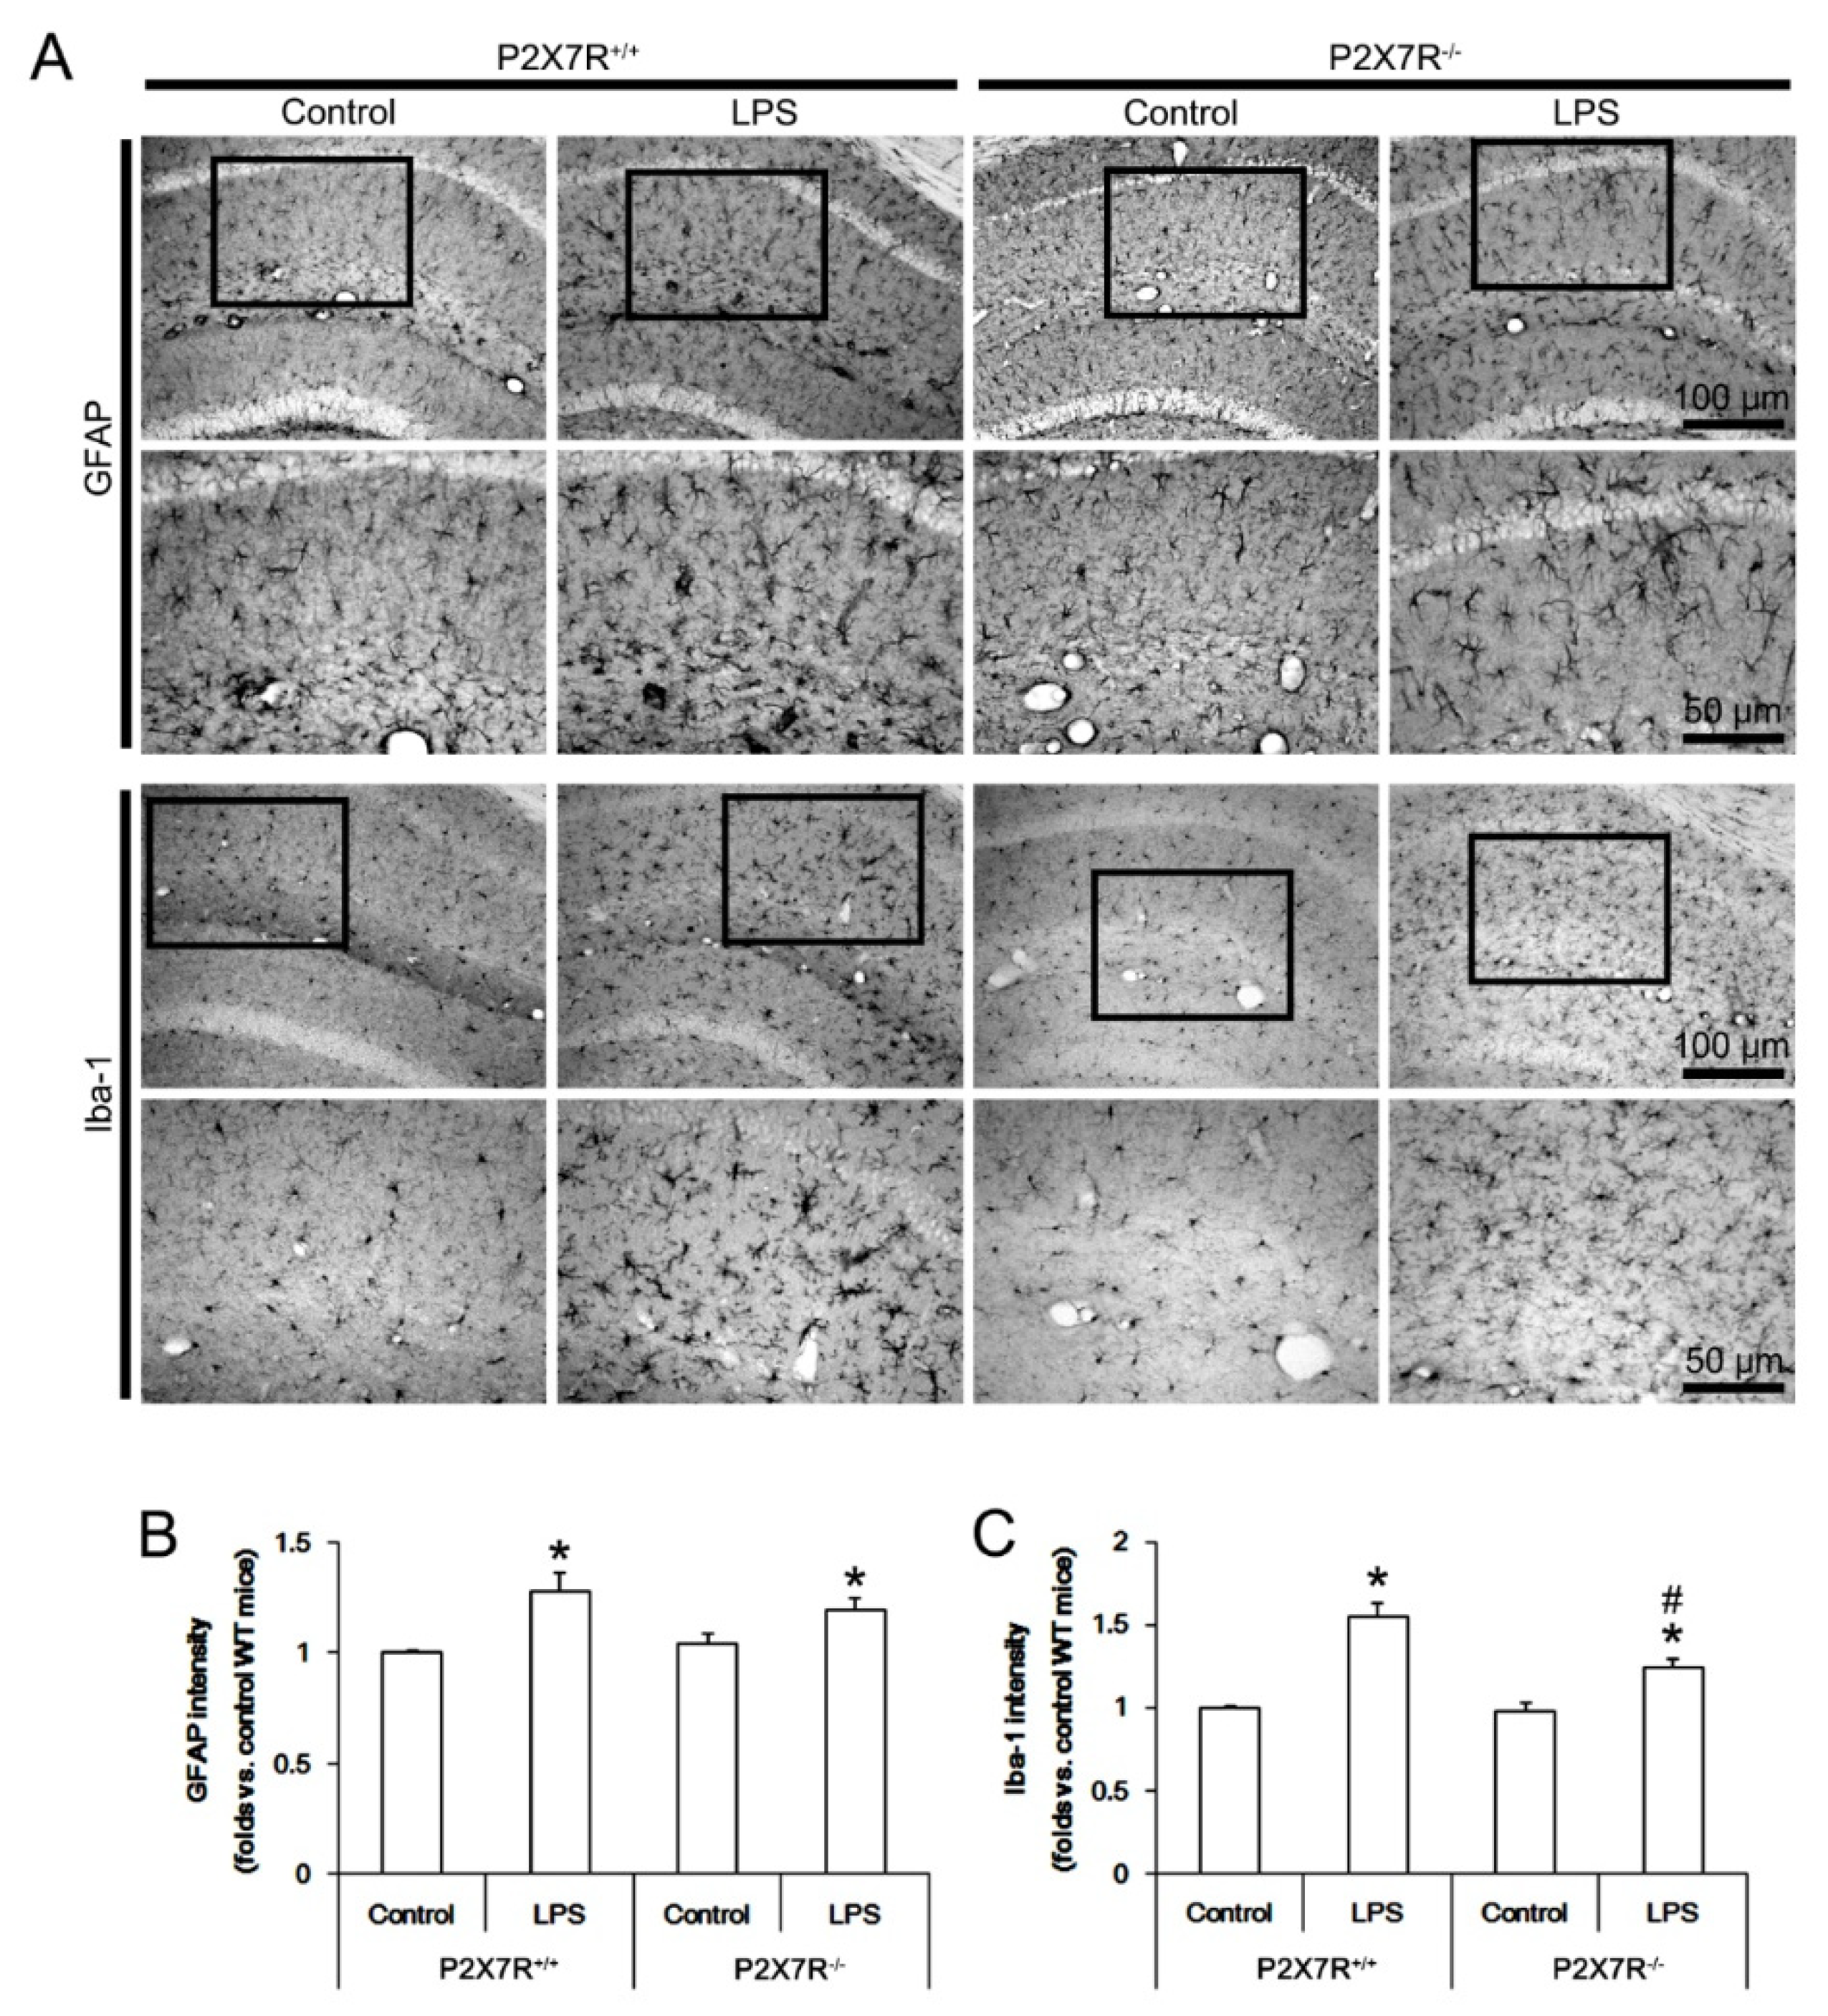
3.1. P2X7R Deletion Ameliorates Microglial Activation, but Not Reactive Astrogliosis in Response to LPS

First, we evaluated the role of P2X7R in glial responses to LPS in the mouse hippocampus in vivo. In P2X7R+/+ mice, LPS increased glial fibrillary acidic protein (GFAP, an astroglial marker) (F(1,12) = 36.75, p < 0.001, one-way ANOVA, n = 7, respectively) and ionized calcium-binding adapter molecule-1 (Iba-1, a microglial marker) (F(1,12) = 60.0, p < 0.001, one-way ANOVA, n = 7, respectively) intensities indicating reactive astrogliosis and microgliosis, respectively (Figure 1A–C). P2X7R deletion did not affect GFAP and Iba-1 intensities under physiological condition (Figure 1A–C) but attenuated the increased Iba-1 (F(1,12) = 44.17, p < 0.001, one-way ANOVA, n = 7, respectively), but not GFAP, intensity induced by LPS (Figure 1A–C). These findings indicate that P2X7R may play an important role in microglial activation rather than reactive astrogliosis following LPS treatment.

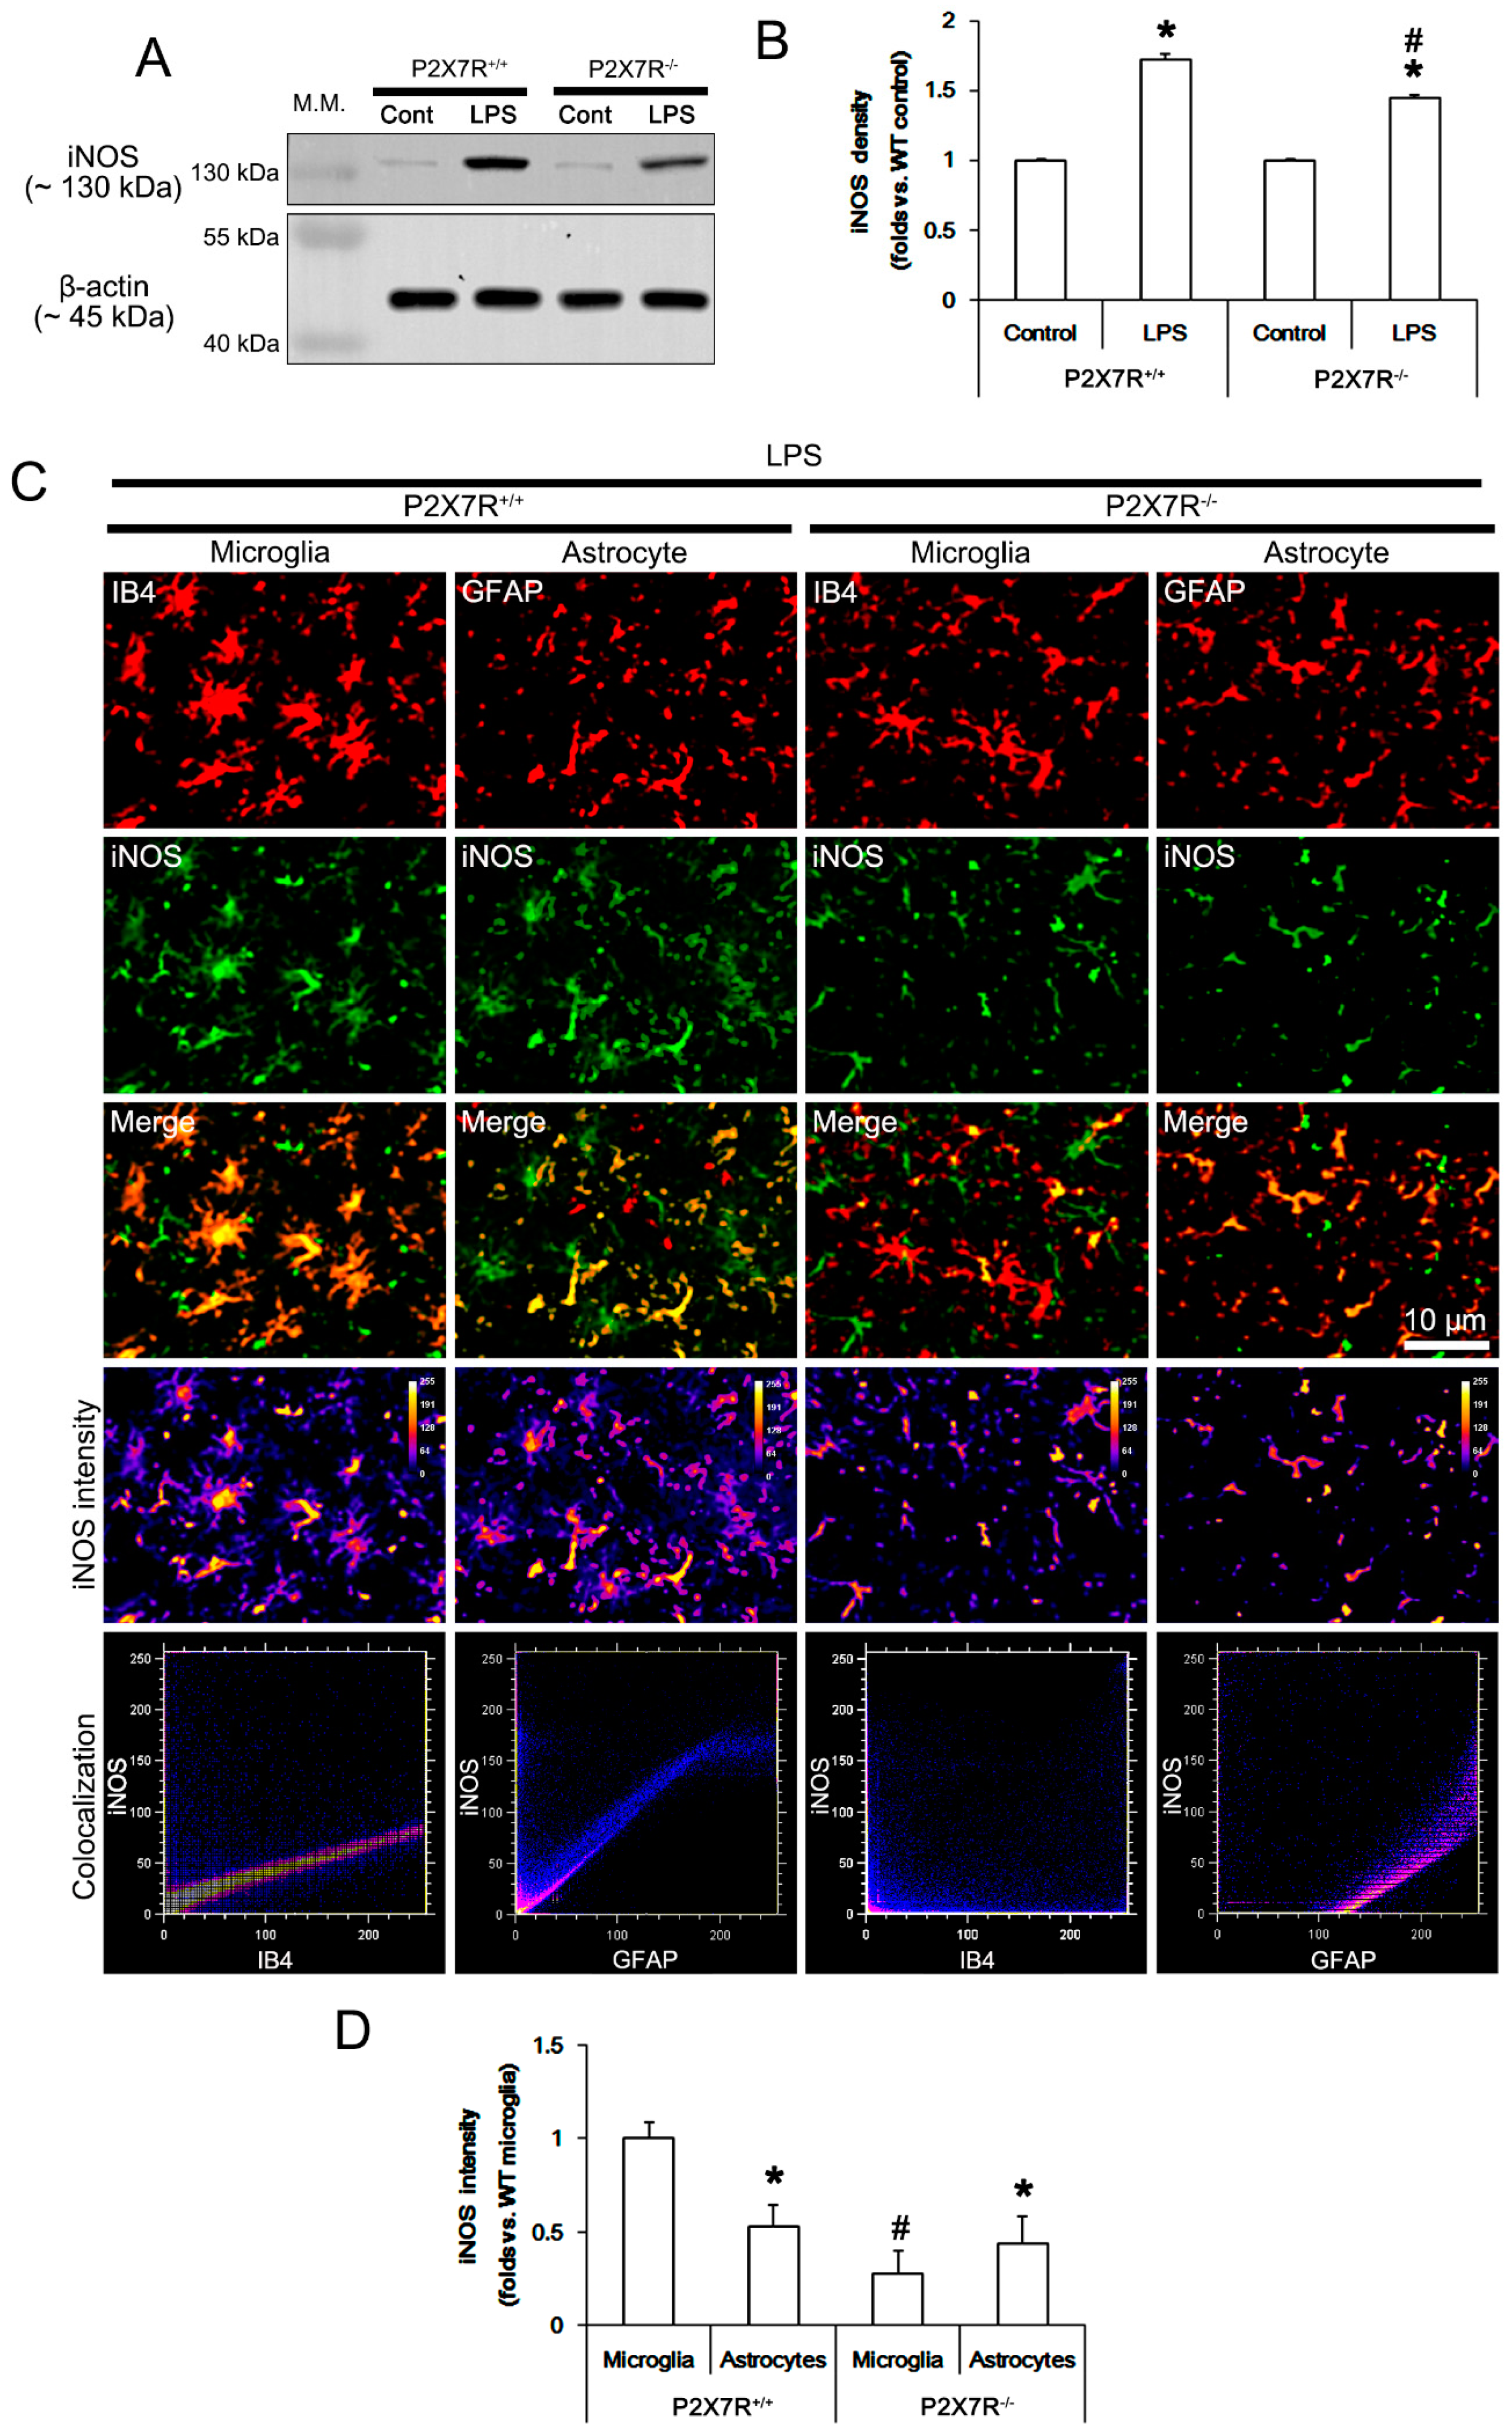
3.2. P2X7R Deletion Attenuates LPS-Induced iNOS Induction in Microglia Rather Than Astrocytes

P2X7R activation increases NO production in response to LPS [7], while oxidized ATP (OxATP, a P2X7R antagonist) blocks LPS-induced NO production in vitro [26]. Therefore, we investigated the effect of P2X7R deletion on iNOS induction in responses to LPS in vivo. Under physiological conditions, no difference in iNOS protein levels between P2X7R+/+ and P2X7R−/− mice (Figure 2A,B). LPS increased iNOS expression to 1.72- and 1.45-fold of control level in P2X7R+/+ and P2X7R−/− mice, respectively (F(3,24) = 163.7, p < 0.001, one-way ANOVA, n = 7, respectively; Figure 2A,B). LPS-induced iNOS induction was lower in P2X7R−/− mice than that in P2X7R+/+ mice (F(1,12) = 27.3, p < 0.001, one-way ANOVA, n = 7, respectively; Figure 2A,B). An immunohistochemical study revealed that LPS led to iNOS induction in microglia and astrocytes in P2X7R+/+ mice (Figure 2C). LPS-induced iNOS upregulation was higher in microglia than that in astrocytes (t(6) = 12.7, p < 0.001, paired Student t-test, n = 7, respectively; Figure 2C,D). In P2X7R−/− mice, LPS-induced iNOS expression in microglia was 0.28-fold of P2X7R+/+ mice level (F(1,12) = 170.5, p < 0.001, one-way ANOVA, n = 7, respectively; Figure 2C,D). Astroglial iNOS level in P2X7R−/− mice was similar to that in P2X7R+/+ mice. Thus, iNOS level was higher in astrocytes than that in microglia unlike P2X7R+/+ mice (t(6) = 3.27, p = 0.02, paired Student t-test, n = 7, respectively; Figure 2C,D). These findings indicate that P2X7R may enhance iNOS induction in microglia more than astrocytes following LPS treatment.

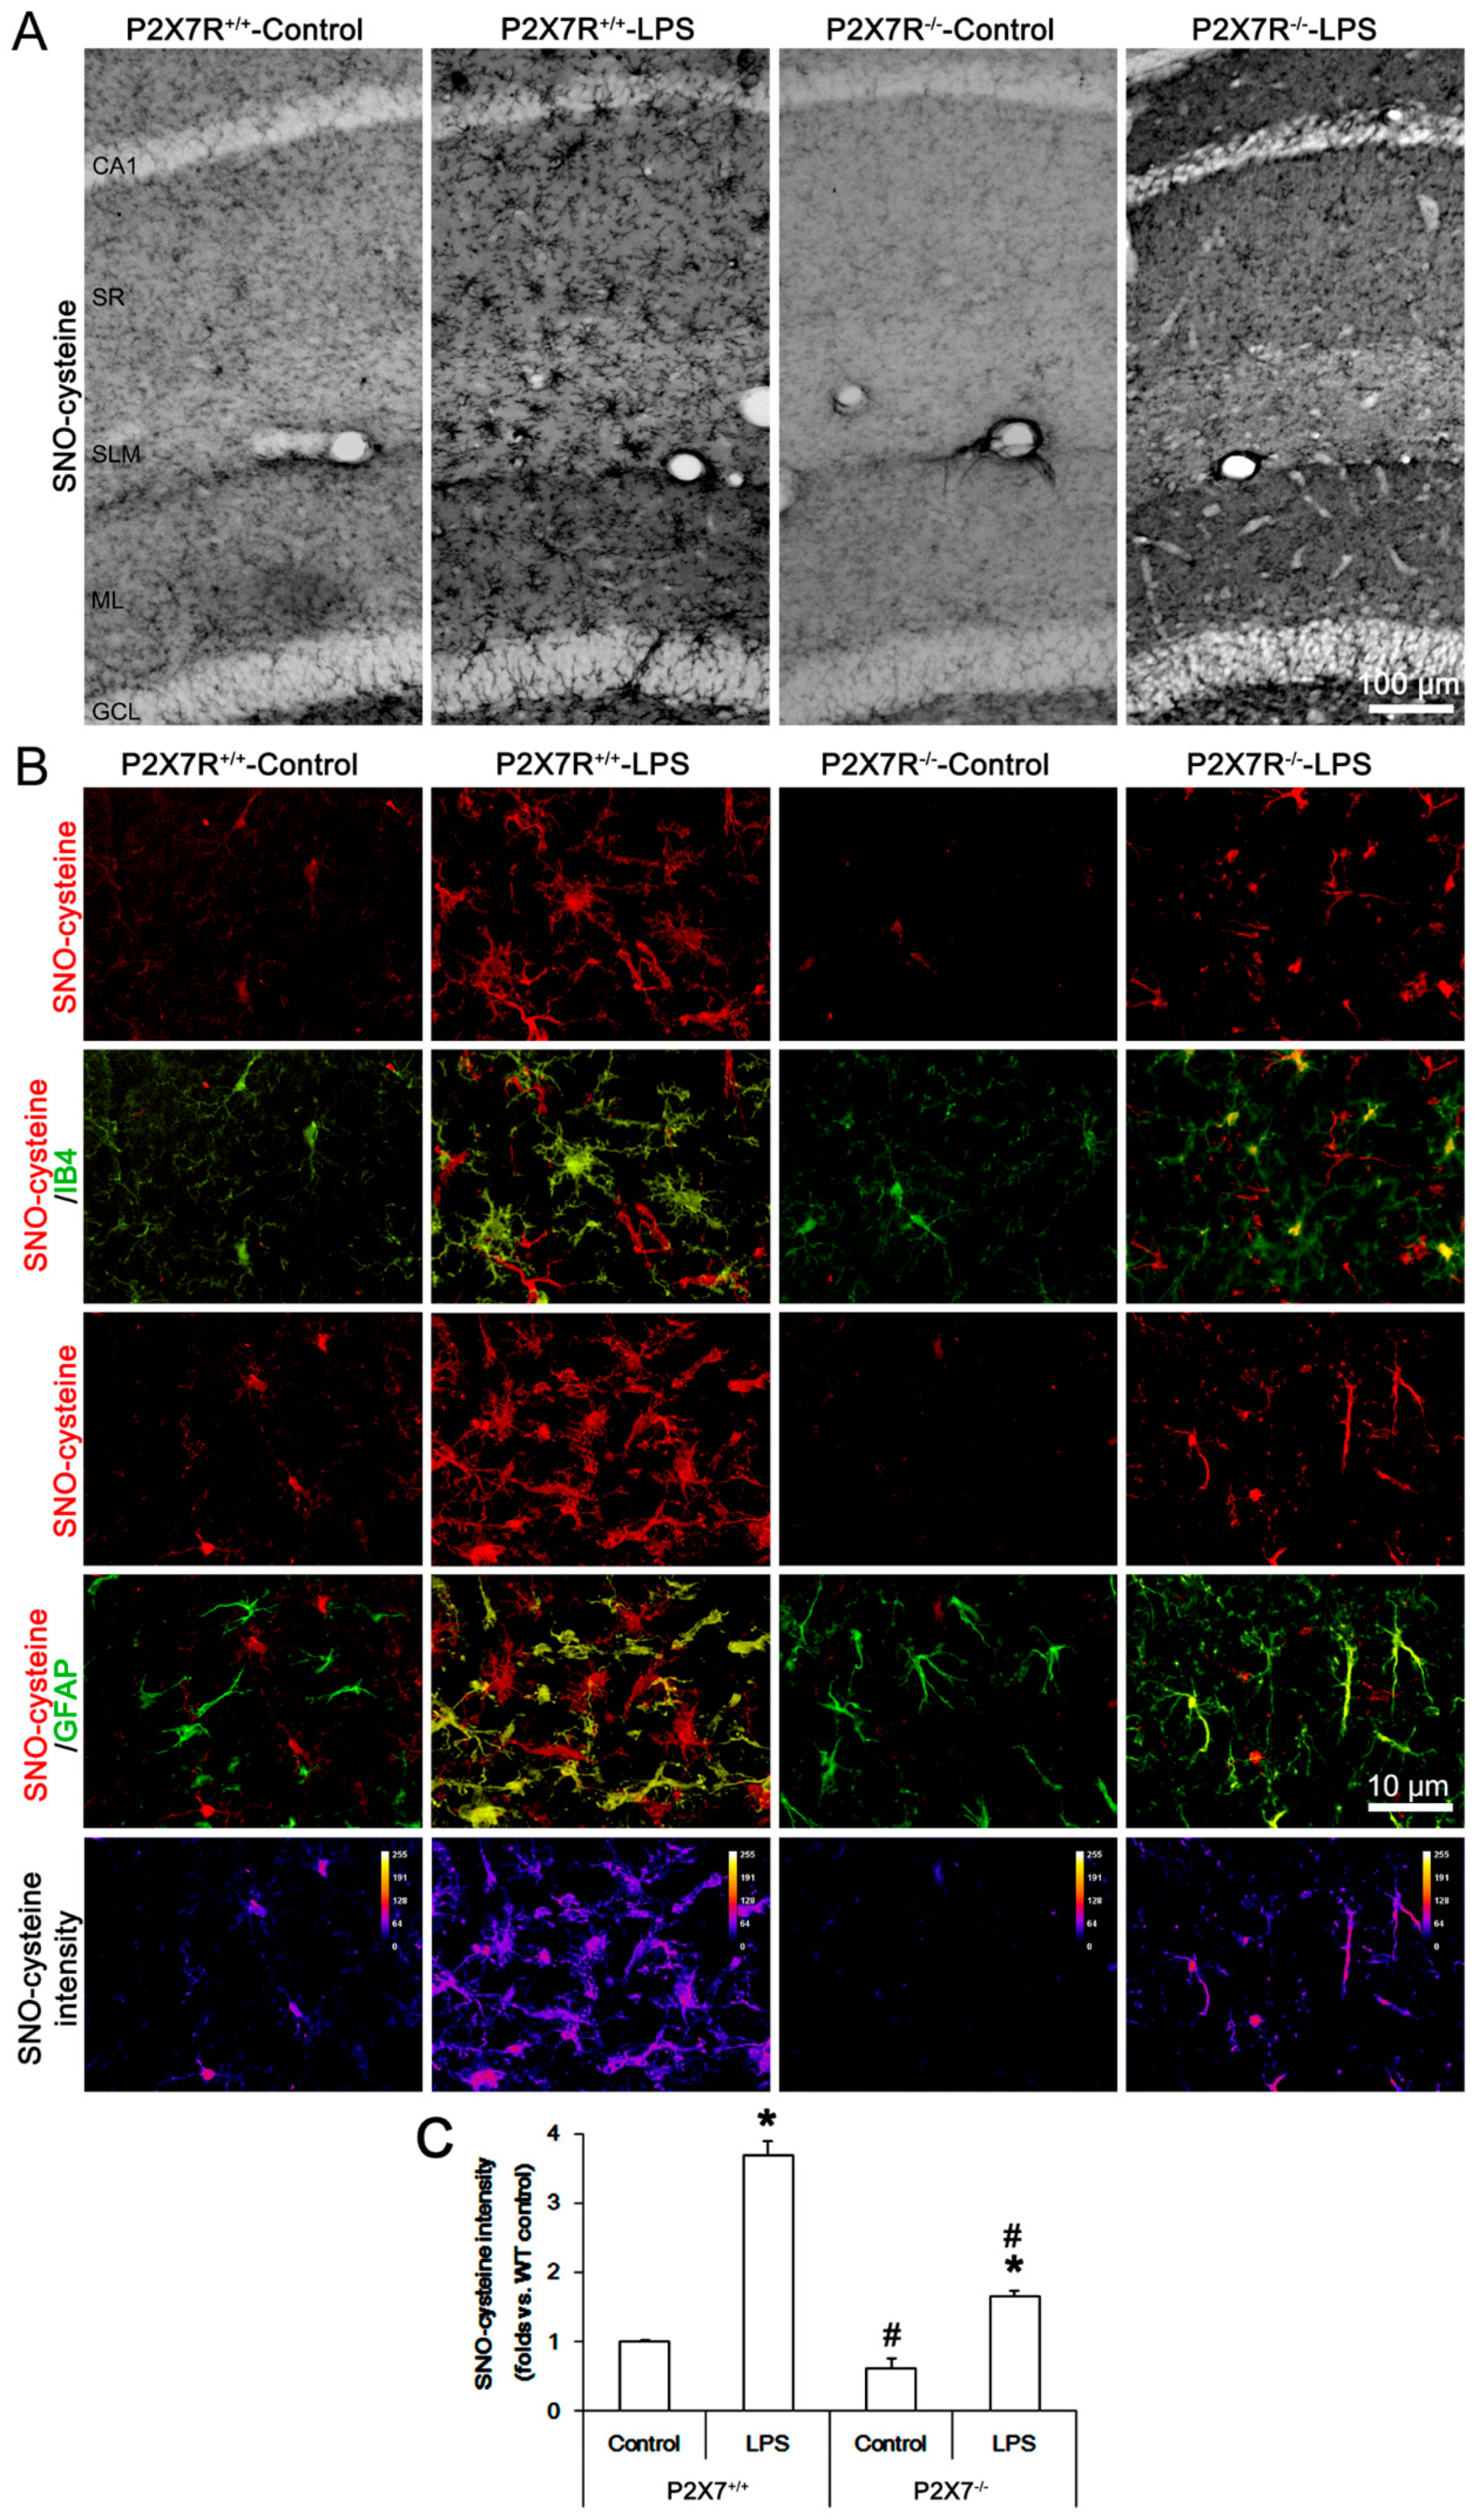
3.3. P2X7R Deletion Attenuates LPS-Induced SNO-Cysteine Production in Microglia and Astrocytes

To confirm the effects of P2X7R deletion on iNOS-mediated NO synthesis, we performed the immunohistochemical study using an antibody detecting SNO-cysteine in vivo. Under physiological conditions, SNO-cysteine level in the hippocampus was higher in P2X7R+/+ mice than that in P2X7R−/− mice (Figure 3A). Double immunofluorescent data demonstrated that SNO-cysteine signal was mainly detected in microglia in P2X7R+/+ mice, while it was weakly observed in P2X7R−/−mice (Figure 3B). Following LPS treatment, SNO-cysteine levels were increased in microglia and astrocytes in P2X7R+/+ and P2X7R−/− mice (Figure 3B,C). LPS increased SNO-cysteine production to 3.7- and 1.65-fold of control level in P2X7R+/+ and P2X7R−/− mice, respectively (F(3,24) = 109.1, p < 0.001, one-way ANOVA, n = 7, respectively; Figure 3B,C), indicating that LPS-induced SNO-cysteine production was significantly lower in P2X7R−/− mice than that in P2X7R+/+ mice (F(1,12) = 65.6, p < 0.001, one-way ANOVA, n = 7, respectively; Figure 3B,C). These findings indicate that P2X7R may reinforce LPS-induced iNOS upregulation that would increase SNO-cysteine production.

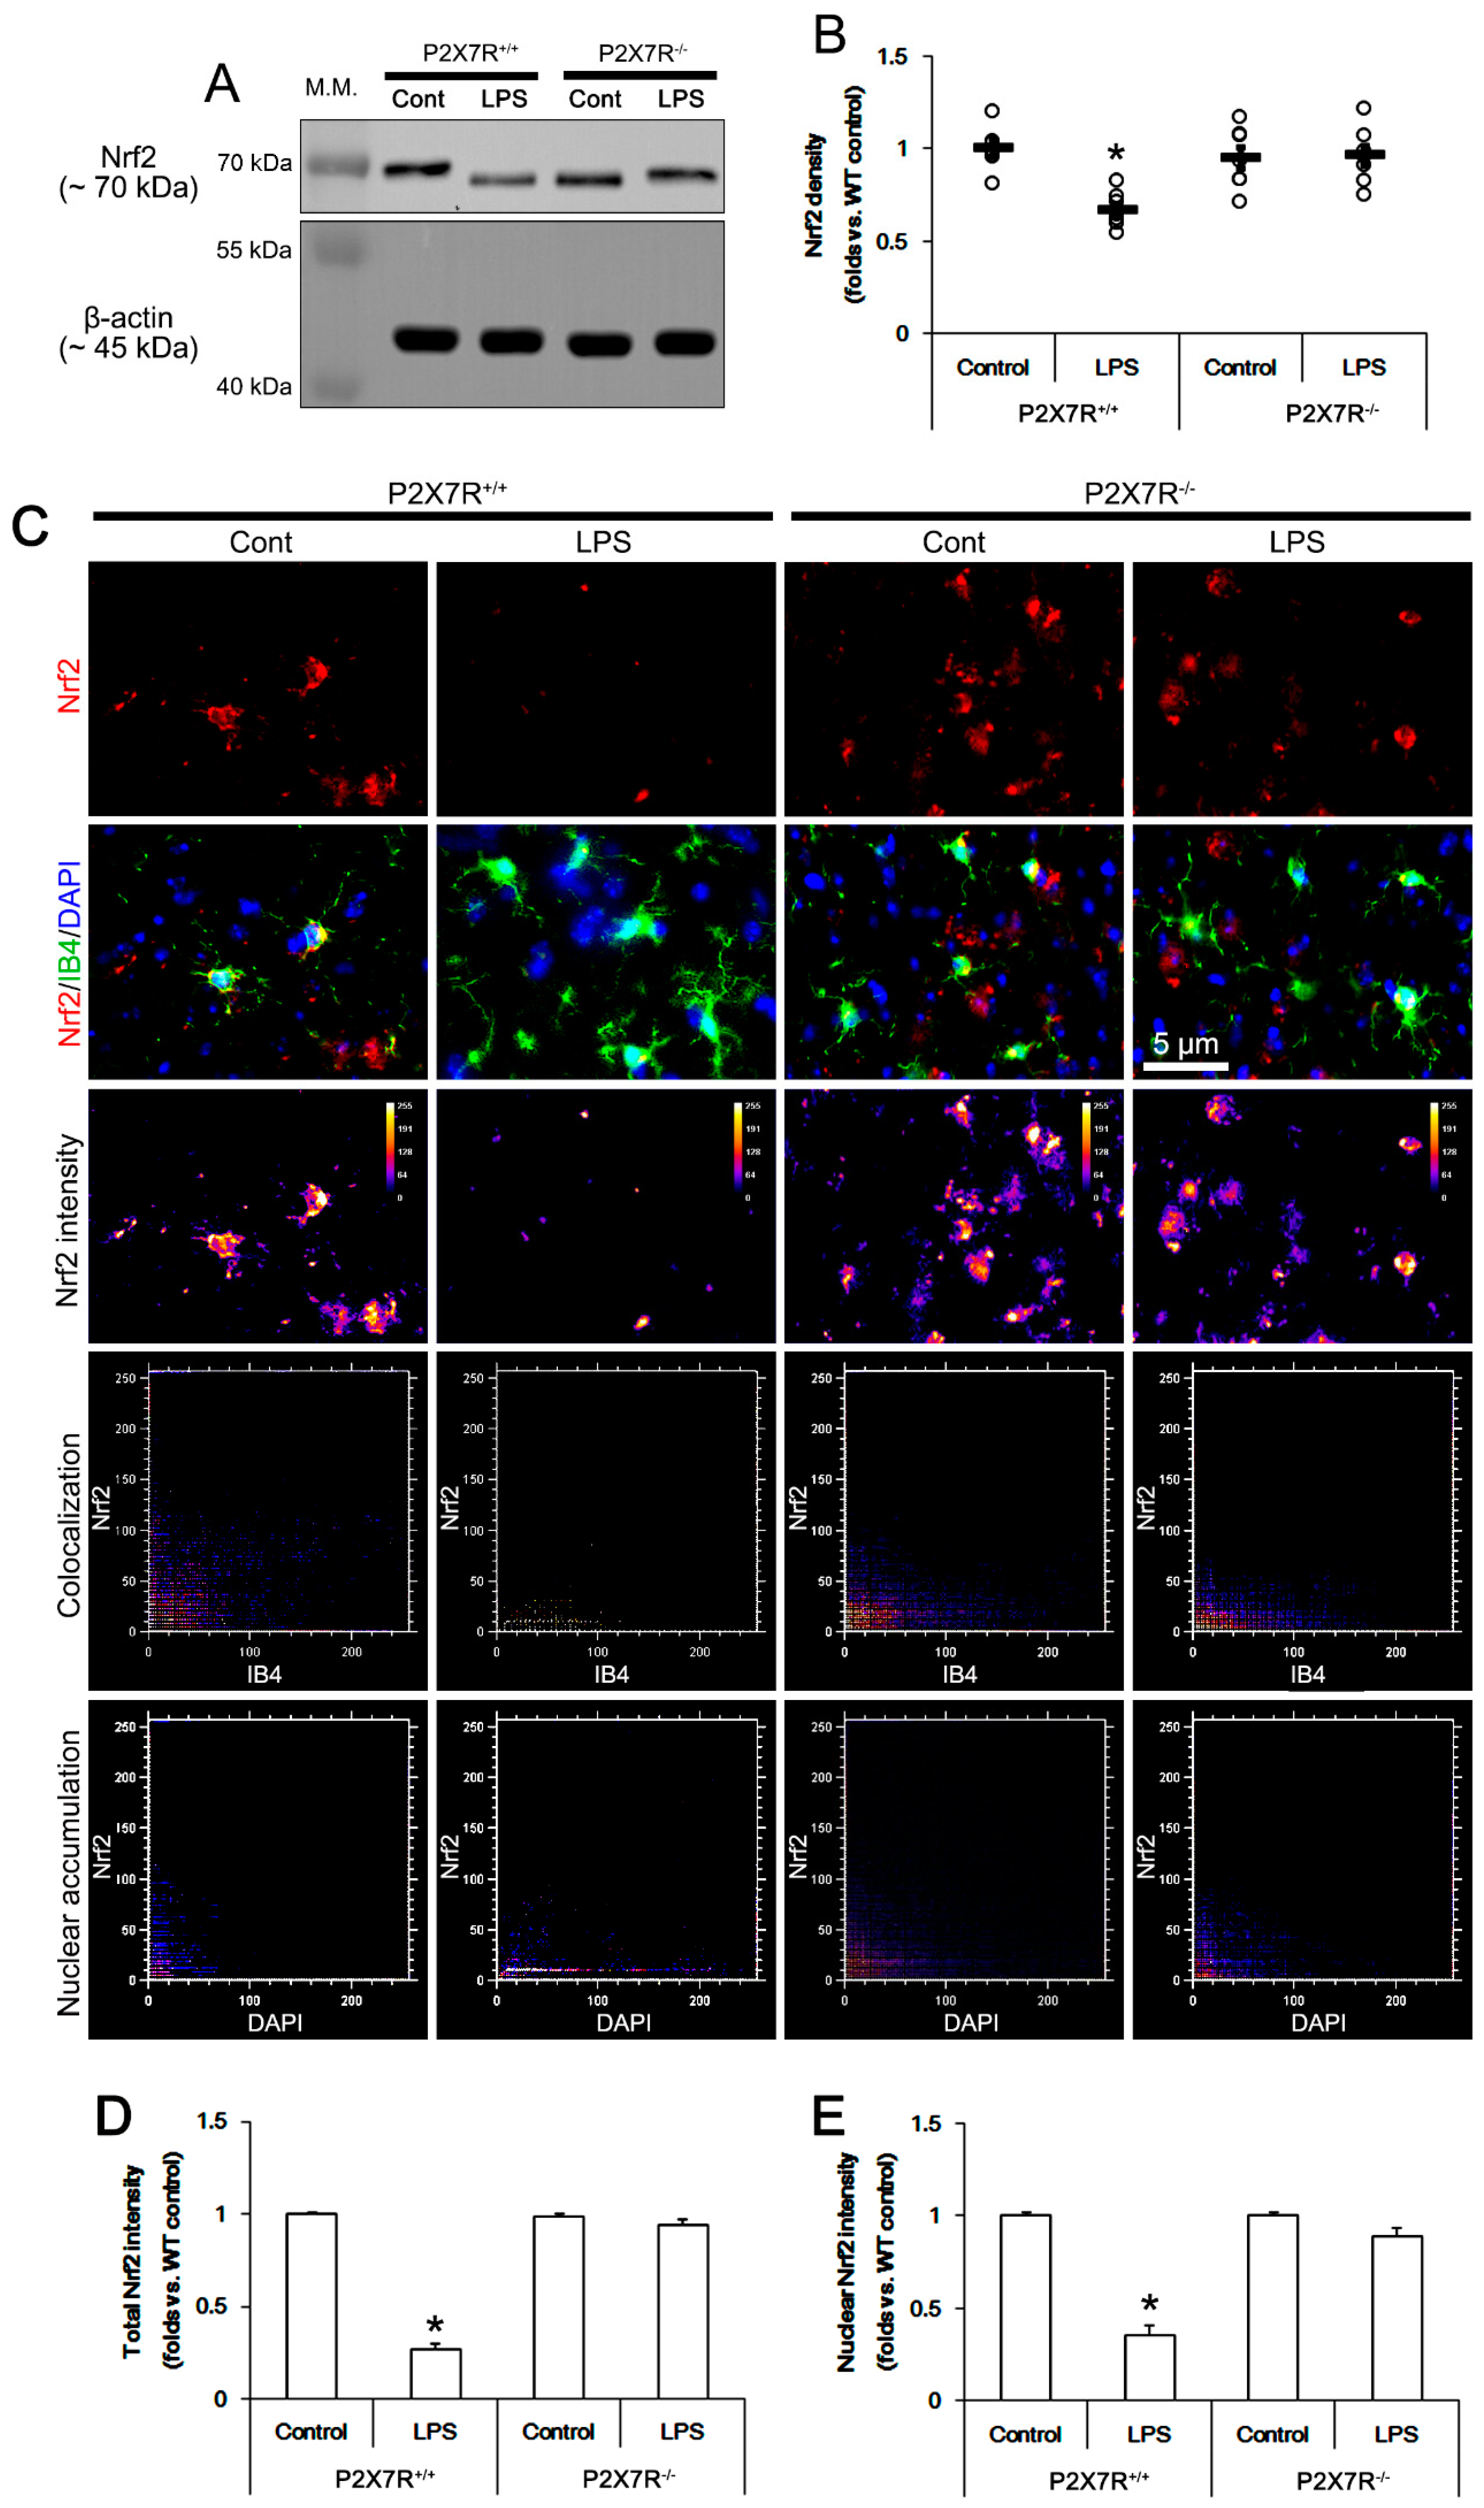
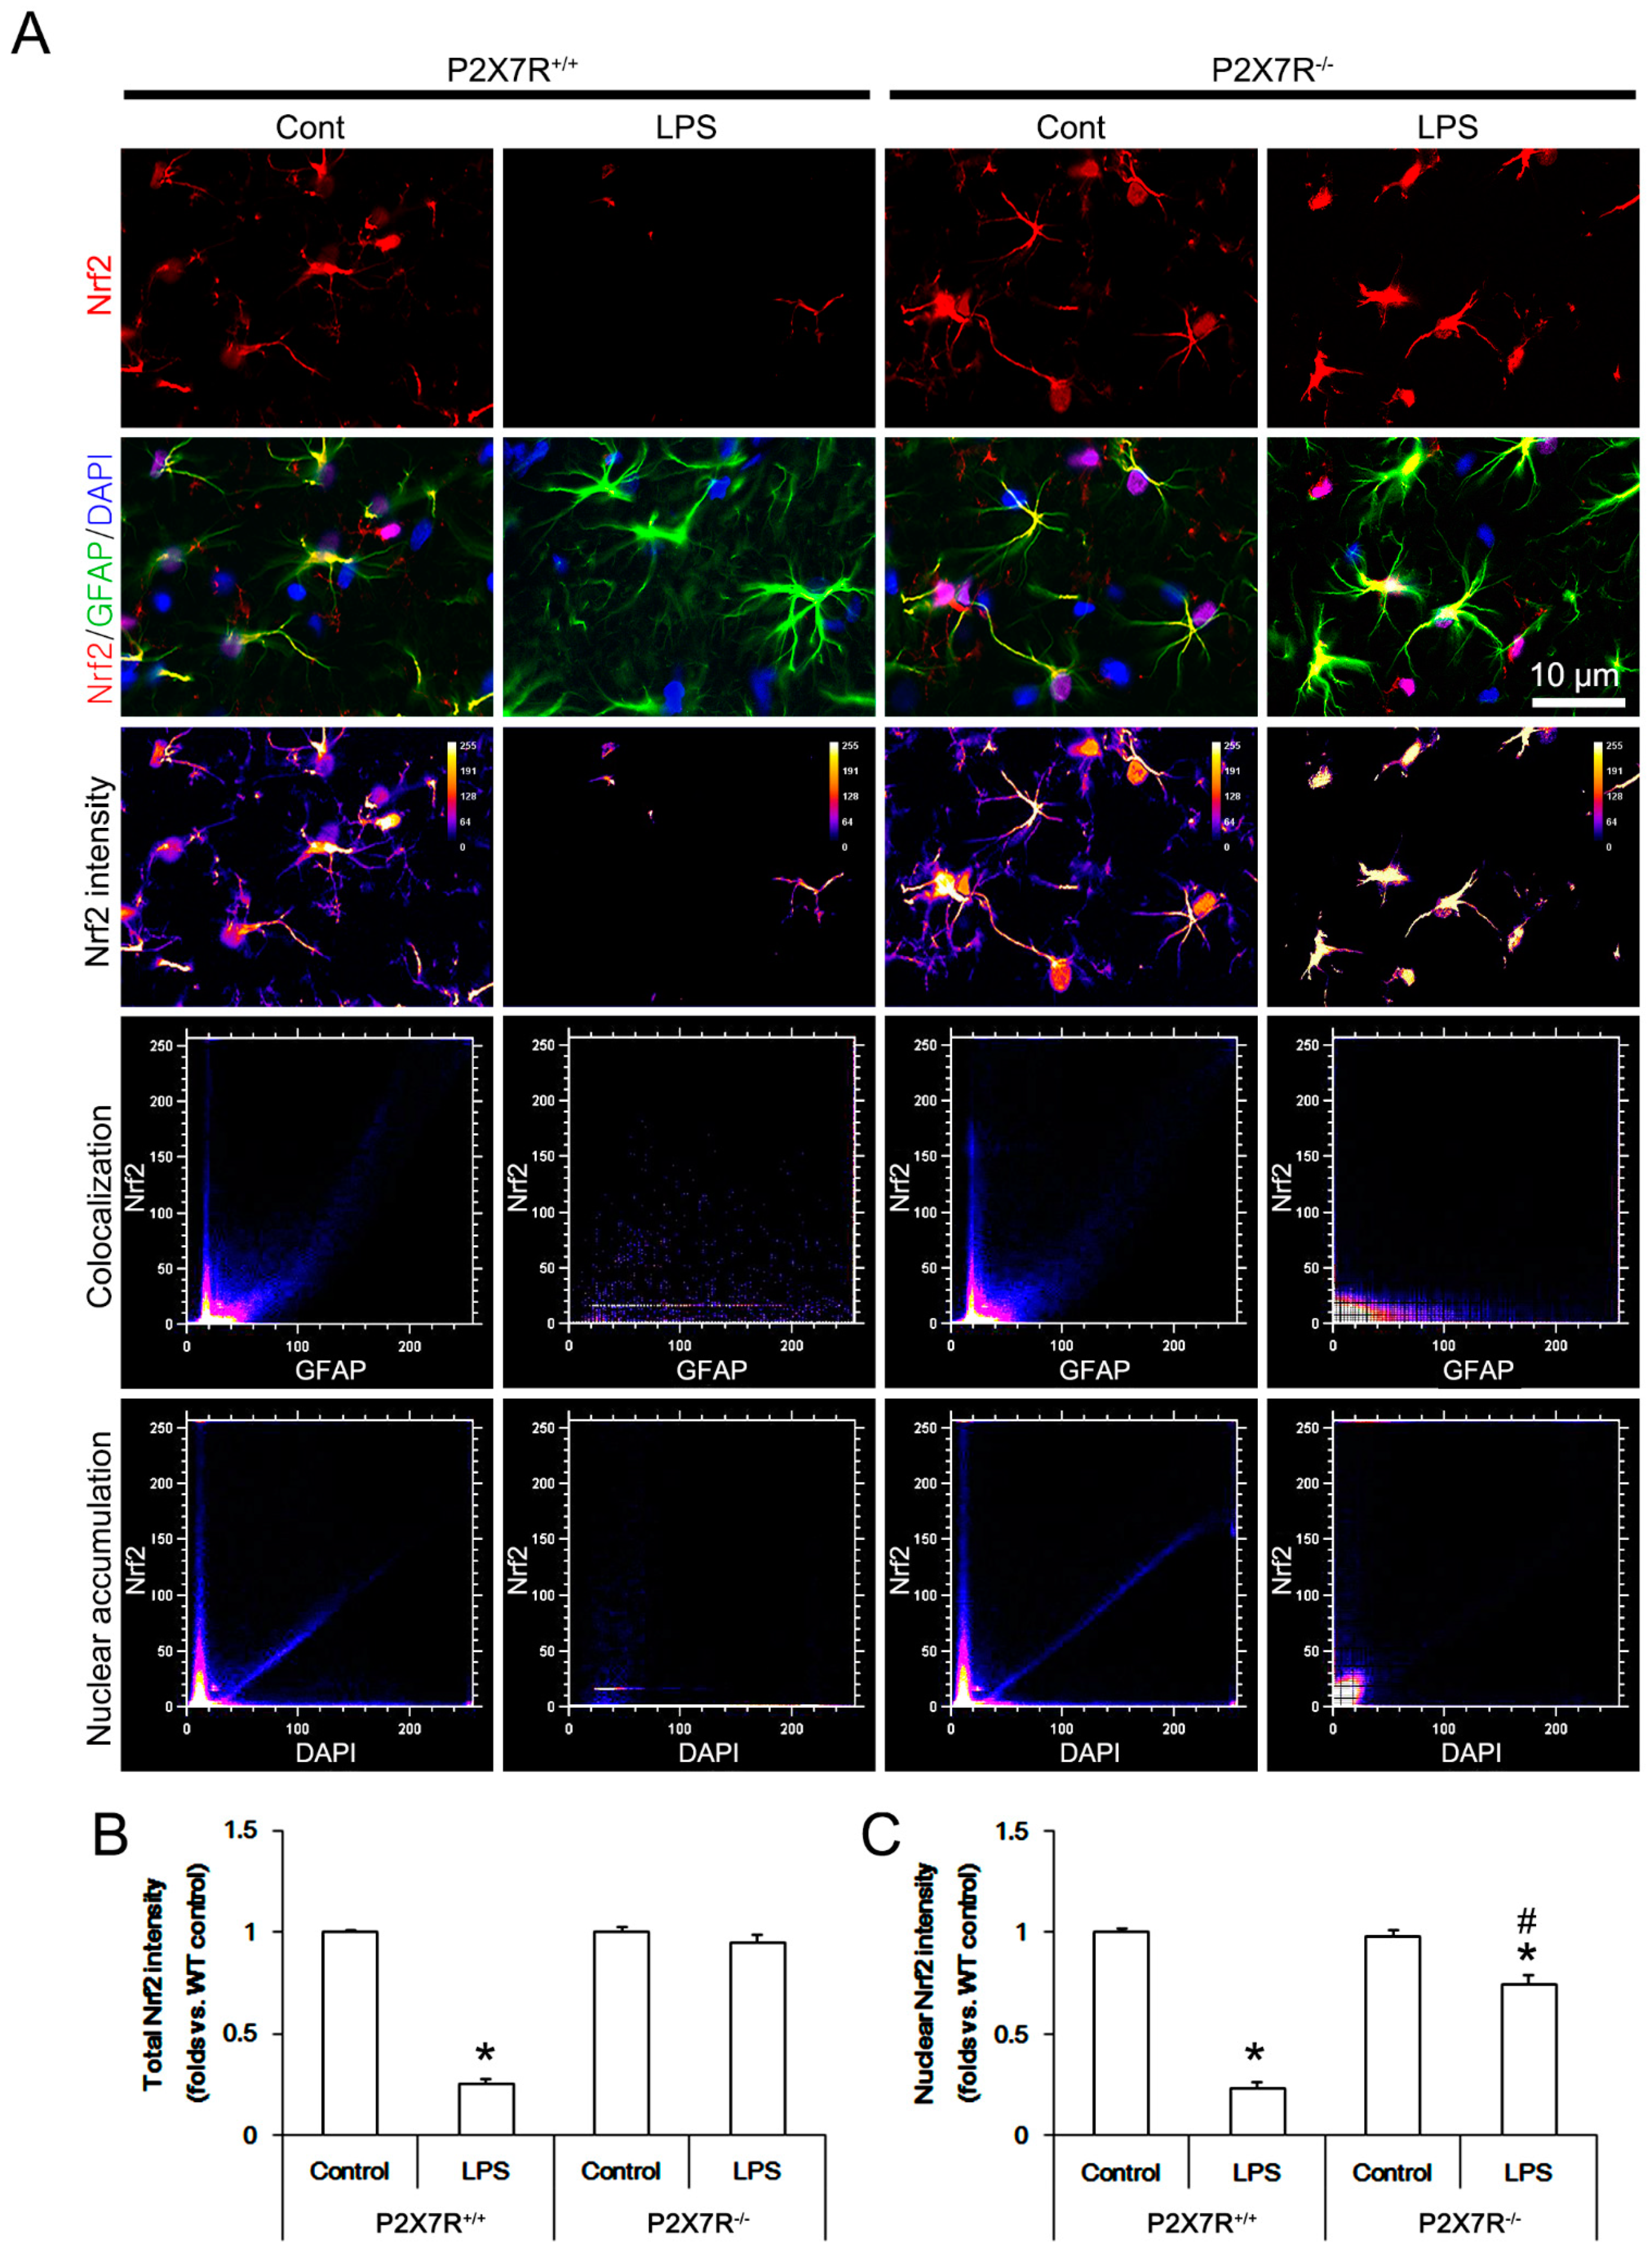
3.4. P2X7R Deletion Ameliorates LPS-Induced Nrf2 Downregulation

LPS elevates ROS level [27,28], which subsequently decreases Nrf2 level [29]. Furthermore, Nrf2 activation (nuclear accumulation) effectively inhibits LPS-induced iNOS upregulation [30,31]. Therefore, it is likely that P2X7R may facilitate LPS-induced iNOS expression via Nrf2 downregulation, which has been unknown. Thus, we validated Nrf2 protein level in the hippocampi of P2X7R+/+ and P2X7R−/− mice following LPS treatment. Under physiological condition, there was no difference in Nrf2 protein level between P2X7R+/+ and P2X7R−/− mice (F(1,12) = 0.463, p = 0.51, one-way ANOVA, n = 7, respectively; Figure 4A,B). LPS decreased total Nrf2 protein level to 0.74-fold of control level in P2X7R+/+ mice (F(1,12) = 33.177, p < 0.001, one-way ANOVA, n = 7, respectively; Figure 4A,B), but not P2X7R−/− mice (F(1,12) = 0.025, p = 0.878, one-way ANOVA, n = 7, respectively; Figure 4A,B). LPS decreased total Nrf2 level and its nuclear accumulation in microglia to 0.27- and 0.35-fold of control level in P2X7R+/+ mice, respectively, (F(1,12) = 318.7 and 84.2, p < 0.001, respectively, one-way ANOVA, n = 7, respectively; Figure 4C–E) but not in P2X7R−/− mice (Figure 4C–E). LPS also reduced total Nrf2 level and its nuclear accumulation in astrocytes to 0.25- and 0.23-fold of control level in P2X7R+/+ mice, respectively (F(1,12) = 461.8 and 428.6, p < 0.001, respectively, one-way ANOVA, n = 7, respectively; Figure 5A–C). In P2X7R−/− mice, LPS declined nuclear Nrf2 accumulation in astrocytes to 0.74-fold of control level without altering total Nrf2 level (F(1,12) = 15.2, p = 0.002, one-way ANOVA, n = 7, respectively; Figure 5A–C). These findings indicate that P2X7R may facilitate the decreases in total Nrf2 level and its nuclear accumulation in microglia and astrocytes following LPS treatment.

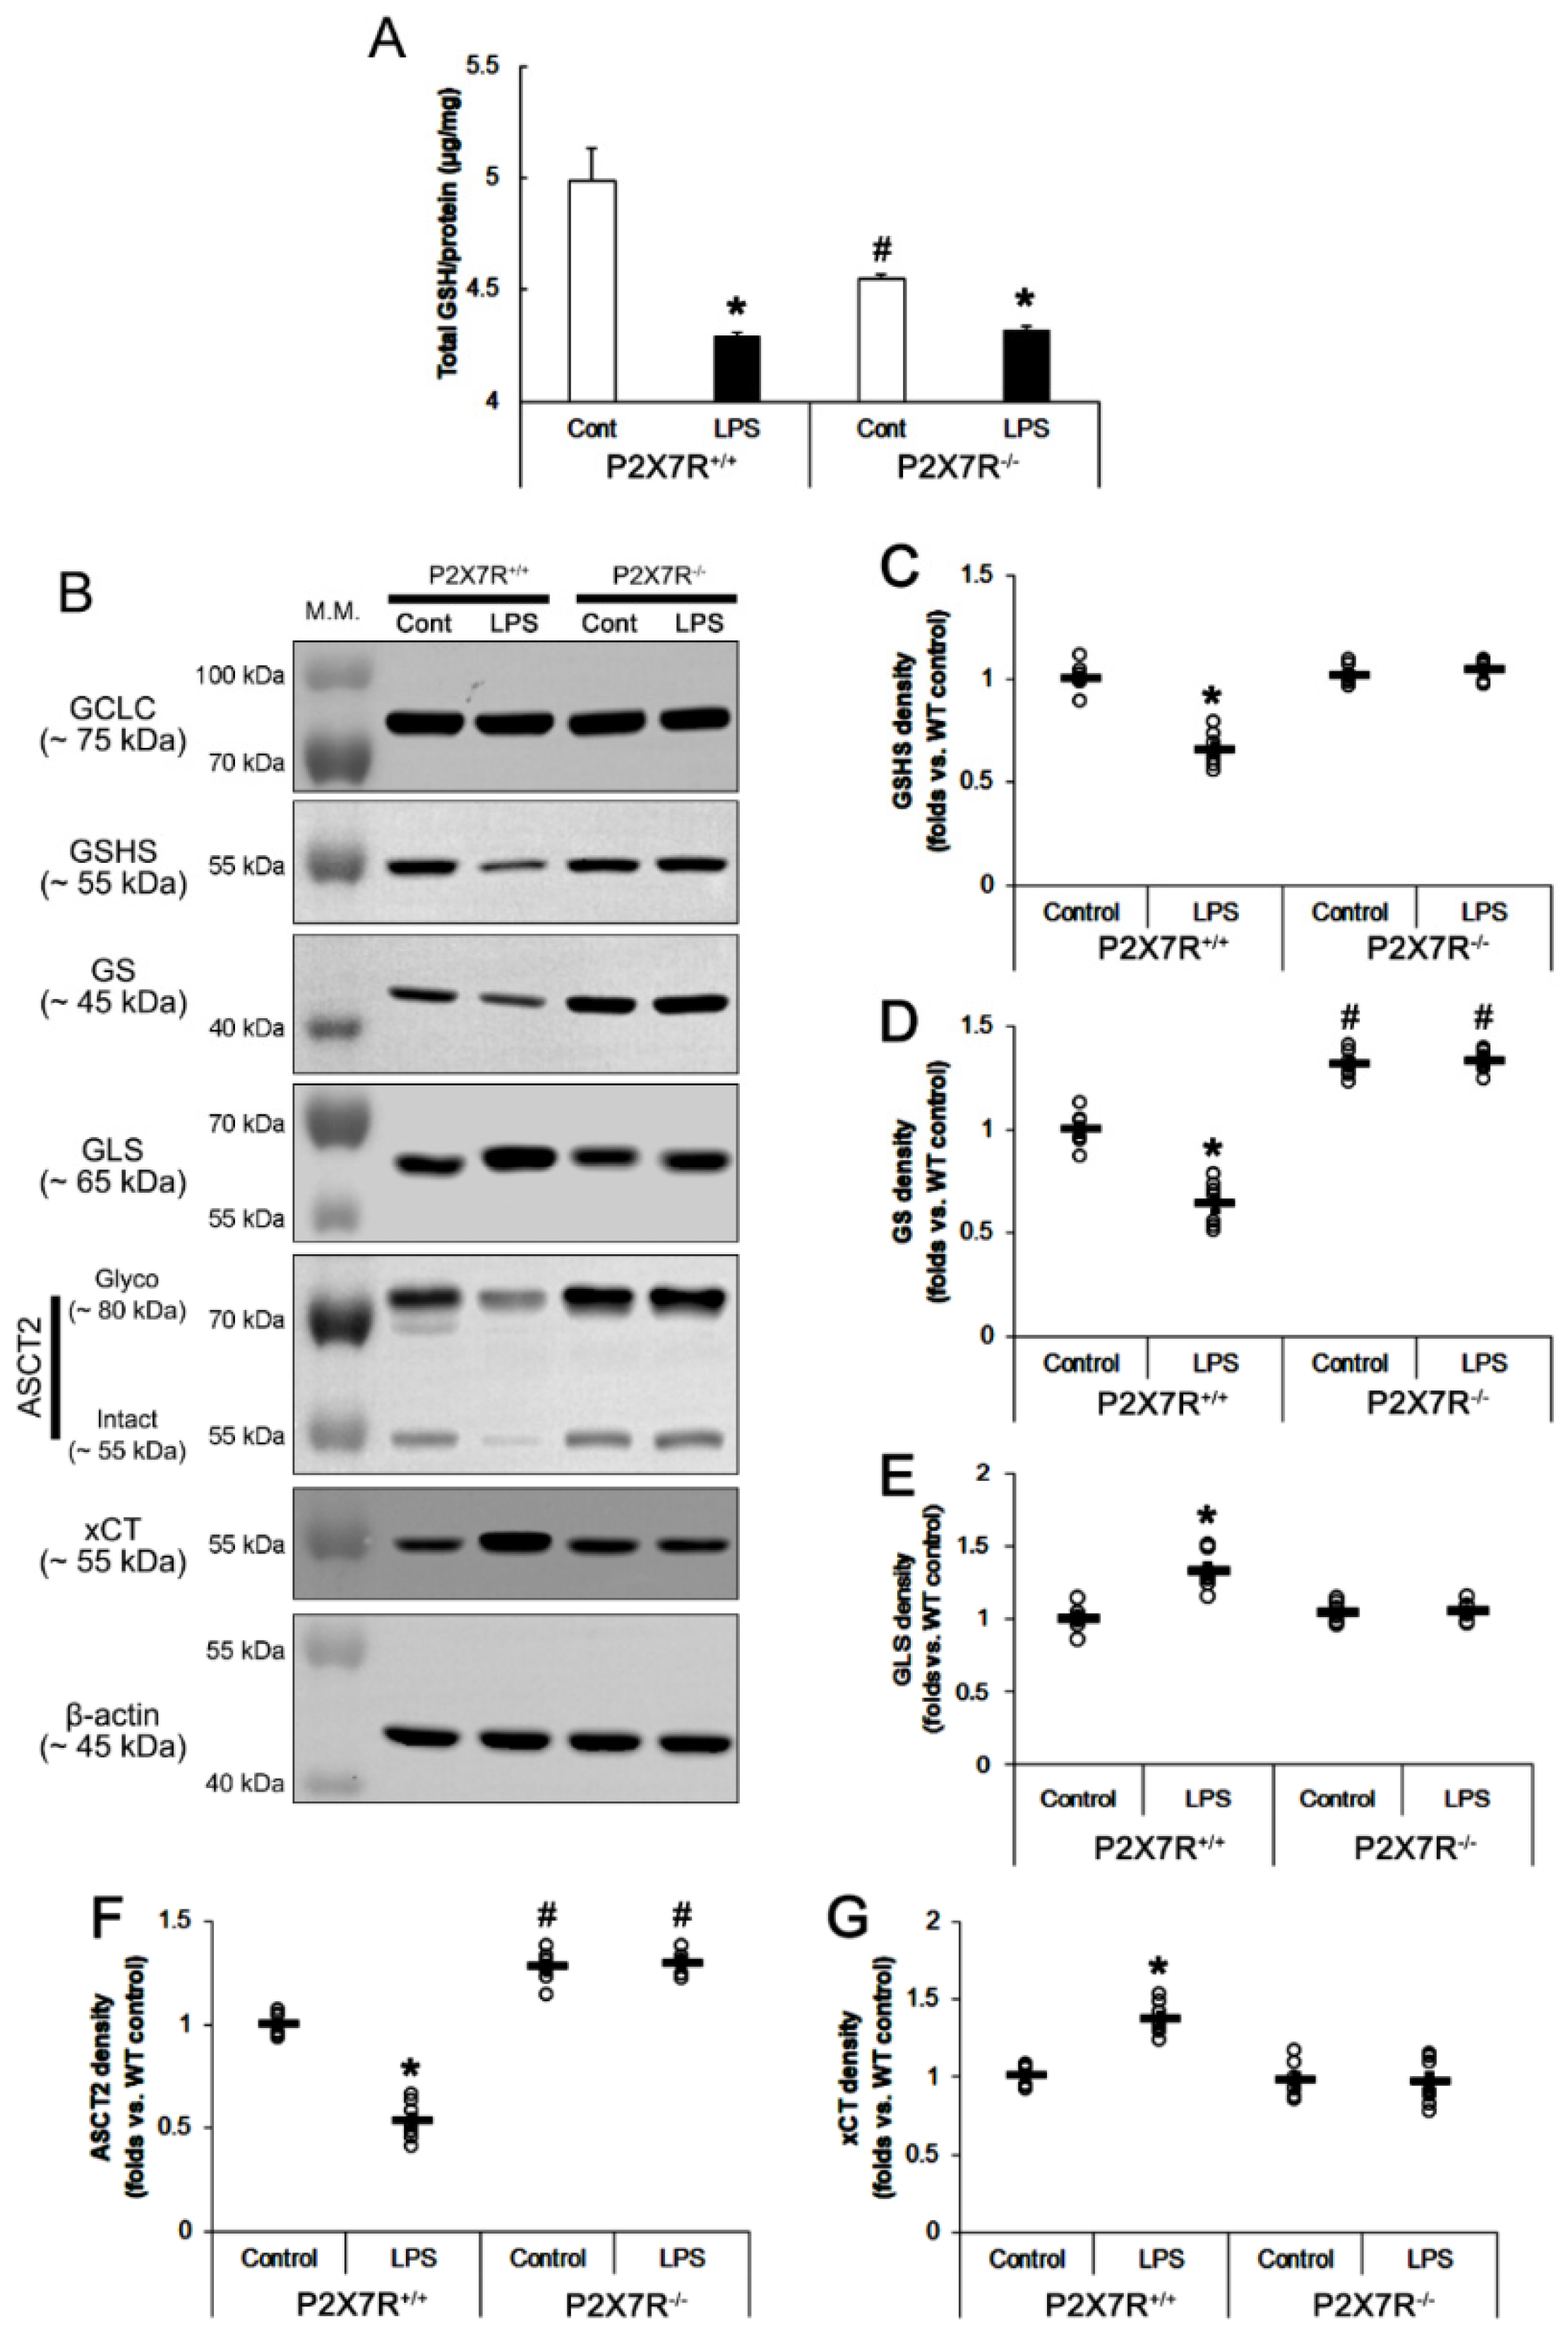
3.5. P2X7R Aggravates the Decreased GSH Concentration Induced by LPS

Recently, we have reported that P2X7R deletion reduces the total GSH level in the hippocampus by regulating the glutamate-glutamine cycle and neutral amino acid transports under physiological conditions, which may be a consequent response to the absence of P2X7R-mediated oxidative or nitrosative stresses [18]. Since Nrf2 plays a key role in the regulation of GSH synthesis [32], it is likely that P2X7R-mediated Nrf2 downregulation may influence GSH levels following LPS injection. Consistent with our previous study [18], the present data showed that total GSH level in P2X7R−/− mice (4.55 ± 0.02 μg/mg protein) was lower than that in P2X7R+/+ mice (5 ± 0.14 μg/mg protein; F(1,12) = 21.361, p < 0.001; one-way ANOVA, n = 7, respectively; Figure 6A). LPS decreased total GSH concentration in P2X7R+/+ mice (4.29 ± 0.02 μg/mg protein, 86% of control level; F(1,12) = 11.618, p = 0.005, n = 7, respectively) more than P2X7R−/− mice (4.31 ± 0.02 μg/mg protein, 95% of control level; F(1,12) = 19.835, p < 0.001, n = 7, respectively). Thus, there was no difference in total GSH level in both groups following LPS treatment (Figure 6A). Considering GSH decreases LPS-induced NO production by inhibiting iNOS expression [33], our findings indicate that LPS-induced nitrosative stress may be more severe in P2X7R+/+ mice and lead to the higher GSH consumption than those in P2X7R−/− mice.

3.6. P2X7R Downregulates GSHS, but Not GCLC Expression following LPS Treatment

Next, we explored if P2X7R deletion would also influence GSH production. GCLC is the rate-limiting enzyme in GSH biosynthesis [34]. Thus, we investigated whether P2X7R deletion and/or LPS affect GCLC expression in the mouse hippocampus. Under physiological conditions, GCLC expression level was similarly observed in P2X7R+/+ and P2X7R−/− mice. Consistent with previous studies [35,36], LPS did not affect GCLC expression levels in both P2X7R+/+ and P2X7R−/− mice (F(3,24) = 0.12, p = 0.95, one-way ANOVA, n = 7, respectively; Figure 6B).
GSHS catalyzes γ-glutamylcysteine and glycine to GSH. The present data showed that P2X7R deletion did not affect GSHS expression under physiological conditions. Consistent with a previous study demonstrating a marked reduction in GSHS expression induced by LPS [37], P2X7R+/+ mice showed the decreased GSHS expression (66% of control level) in the hippocampus following LPS treatment, while P2X7R−/− mice did not (F(3,24) = 55.67, p < 0.001, one-way ANOVA, n = 7, respectively; Figure 6B,C). These findings indicate that P2X7R deletion may attenuate the decreased GSH concentration by maintaining GSHS expression following LPS treatment.

3.7. P2X7R Downregulates GS, but Increases GLS Expression following LPS Treatment

Glutamate and glutamine are equally used as precursors for GSH synthesis in astrocytes, which is regulated by Nrf2 [32]. GS catalyzes the conversion of glutamate and ammonia to glutamine and plays a major role in ammonia detoxification, interorgan nitrogen flux, acid–base regulation, cell proliferation and protection from apoptotic stimuli [38]. Recently, we have reported that GS expression is higher in P2X7R−/− mice than P2X7R+/+ mice under physiological conditions [18]. Thus, we investigated whether LPS distinctly influences GS expression between P2X7R+/+ and P2X7R−/− mice. Consistent with our previous studies [18], GS expression in P2X7R−/− mice was 1.31-fold higher than that in P2X7R+/+ mice under physiological condition (t(12) = 7.871, p < 0.001, Student t-test, n = 7, respectively; Figure 6B,D). LPS decreased GS protein level to 0.66-fold of control level in P2X7R+/+ mice, but not P2X7R−/− mice (F(3,24) = 115.13, p < 0.001, one-way ANOVA, n = 7, respectively; Figure 6B,D). These findings indicate that LPS may reduce GS protein levels, which may be abrogated by P2X7R deletion.
Astrocytes use glutamine as a precursor for GSH synthesis via the glutamate-glutamine cycle mediated by GLS and GS [39]. Since LPS activates GLS activity/expression [40], we also validated the effect of LPS on GLS protein levels in P2X7R+/+ and P2X7R−/− mice. Under physiological conditions, there was no difference in GLS expression between P2X7R+/+ and P2X7R−/− mice (Figure 6B,E). LPS increased GLS protein level in P2X7R+/+, but not P2X7R−/− mice (F(3,24) = 19.16, p < 0.001, one-way ANOVA, n = 7, respectively; Figure 6B,E). Together with the altered GS expression, our findings suggest that P2X7R deletion may inhibit the changed glutamate-glutamine cycle induced by LPS.

3.8. P2X7R Upregulates xCT, but Decreases ASCT2 Expression following LPS Treatment

The increased GS expression and glutamine concentration potentially facilitate glutamine efflux from astrocytes by inducing the trafficking of ASCT2 [41,42]. Since P2X7R deletion increases ASCT2 expression [18], we investigated whether P2X7R affects ASCT2 expression following LPS treatment. In the present study, ASCT2 expression in P2X7R−/− mice was 1.33-fold higher than that in P2X7R+/+ mice under physiological condition (t(12) = 7.71, p < 0.001, Student t-test, n = 7, respectively; Figure 6B,F). LPS decreased ASCT2 protein expression to 0.53-fold of control level in P2X7R+/+ mice, but not P2X7R−/− mice (F(3,24) = 171.12, p < 0.001, one-way ANOVA, n = 7, respectively; Figure 6B,F). These findings indicate that P2X7R may inhibit ASCT2-mediated cysteine uptake and glutamine efflux.
xCT also influences GSH synthesis to supply neutral amino acids [14,15]. Thus, we explored whether LPS affects xCT protein levels in P2X7R+/+ and P2X7R−/− mice. Under physiological conditions, xCT expression level was similarly detected in P2X7R+/+ and P2X7R−/− mice (Figure 6B,G). However, LPS increased xCT expression levels in P2X7R+/+ (137% of control level), but not P2X7R−/− mice (F(3,24) = 20, p < 0.001, one-way ANOVA, n = 7, respectively; Figure 6B,G). Considering the changed ASCT2 expression, our findings indicate that P2X7R may inhibit GSH synthesis via dysfunction of cysteine uptake as well as aberrant glutamate-glutamine cycle following LPS treatment.

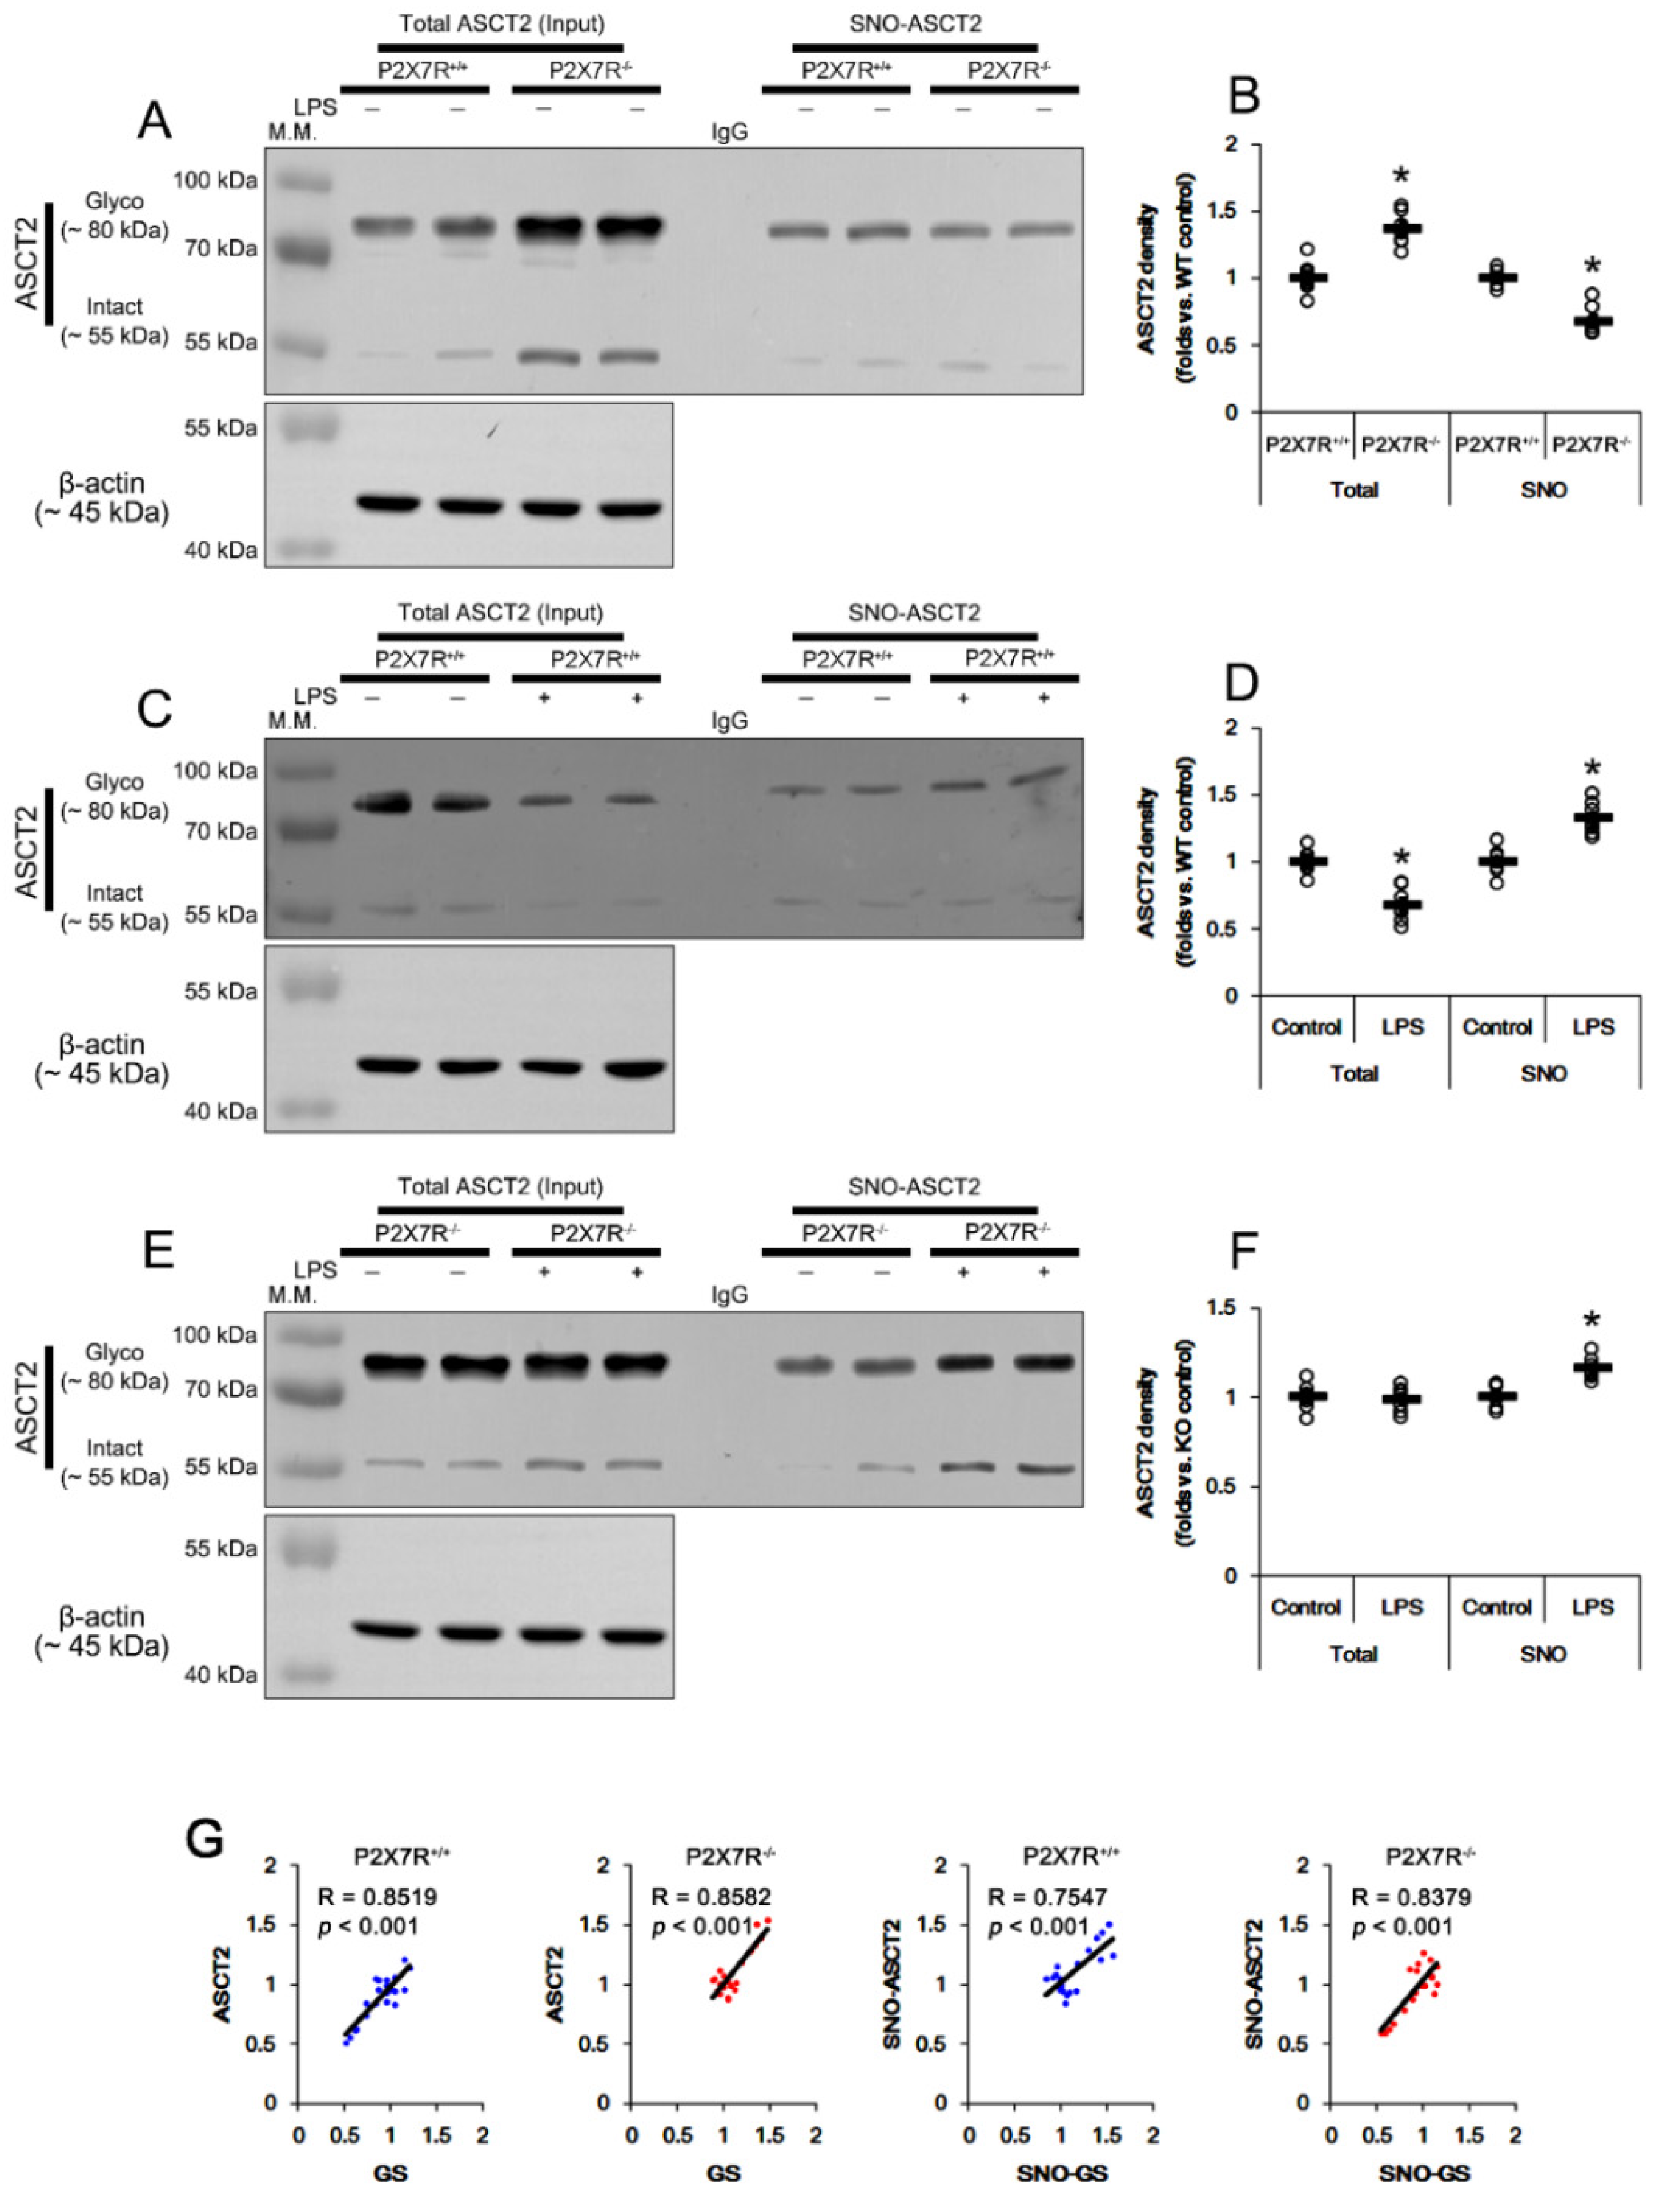
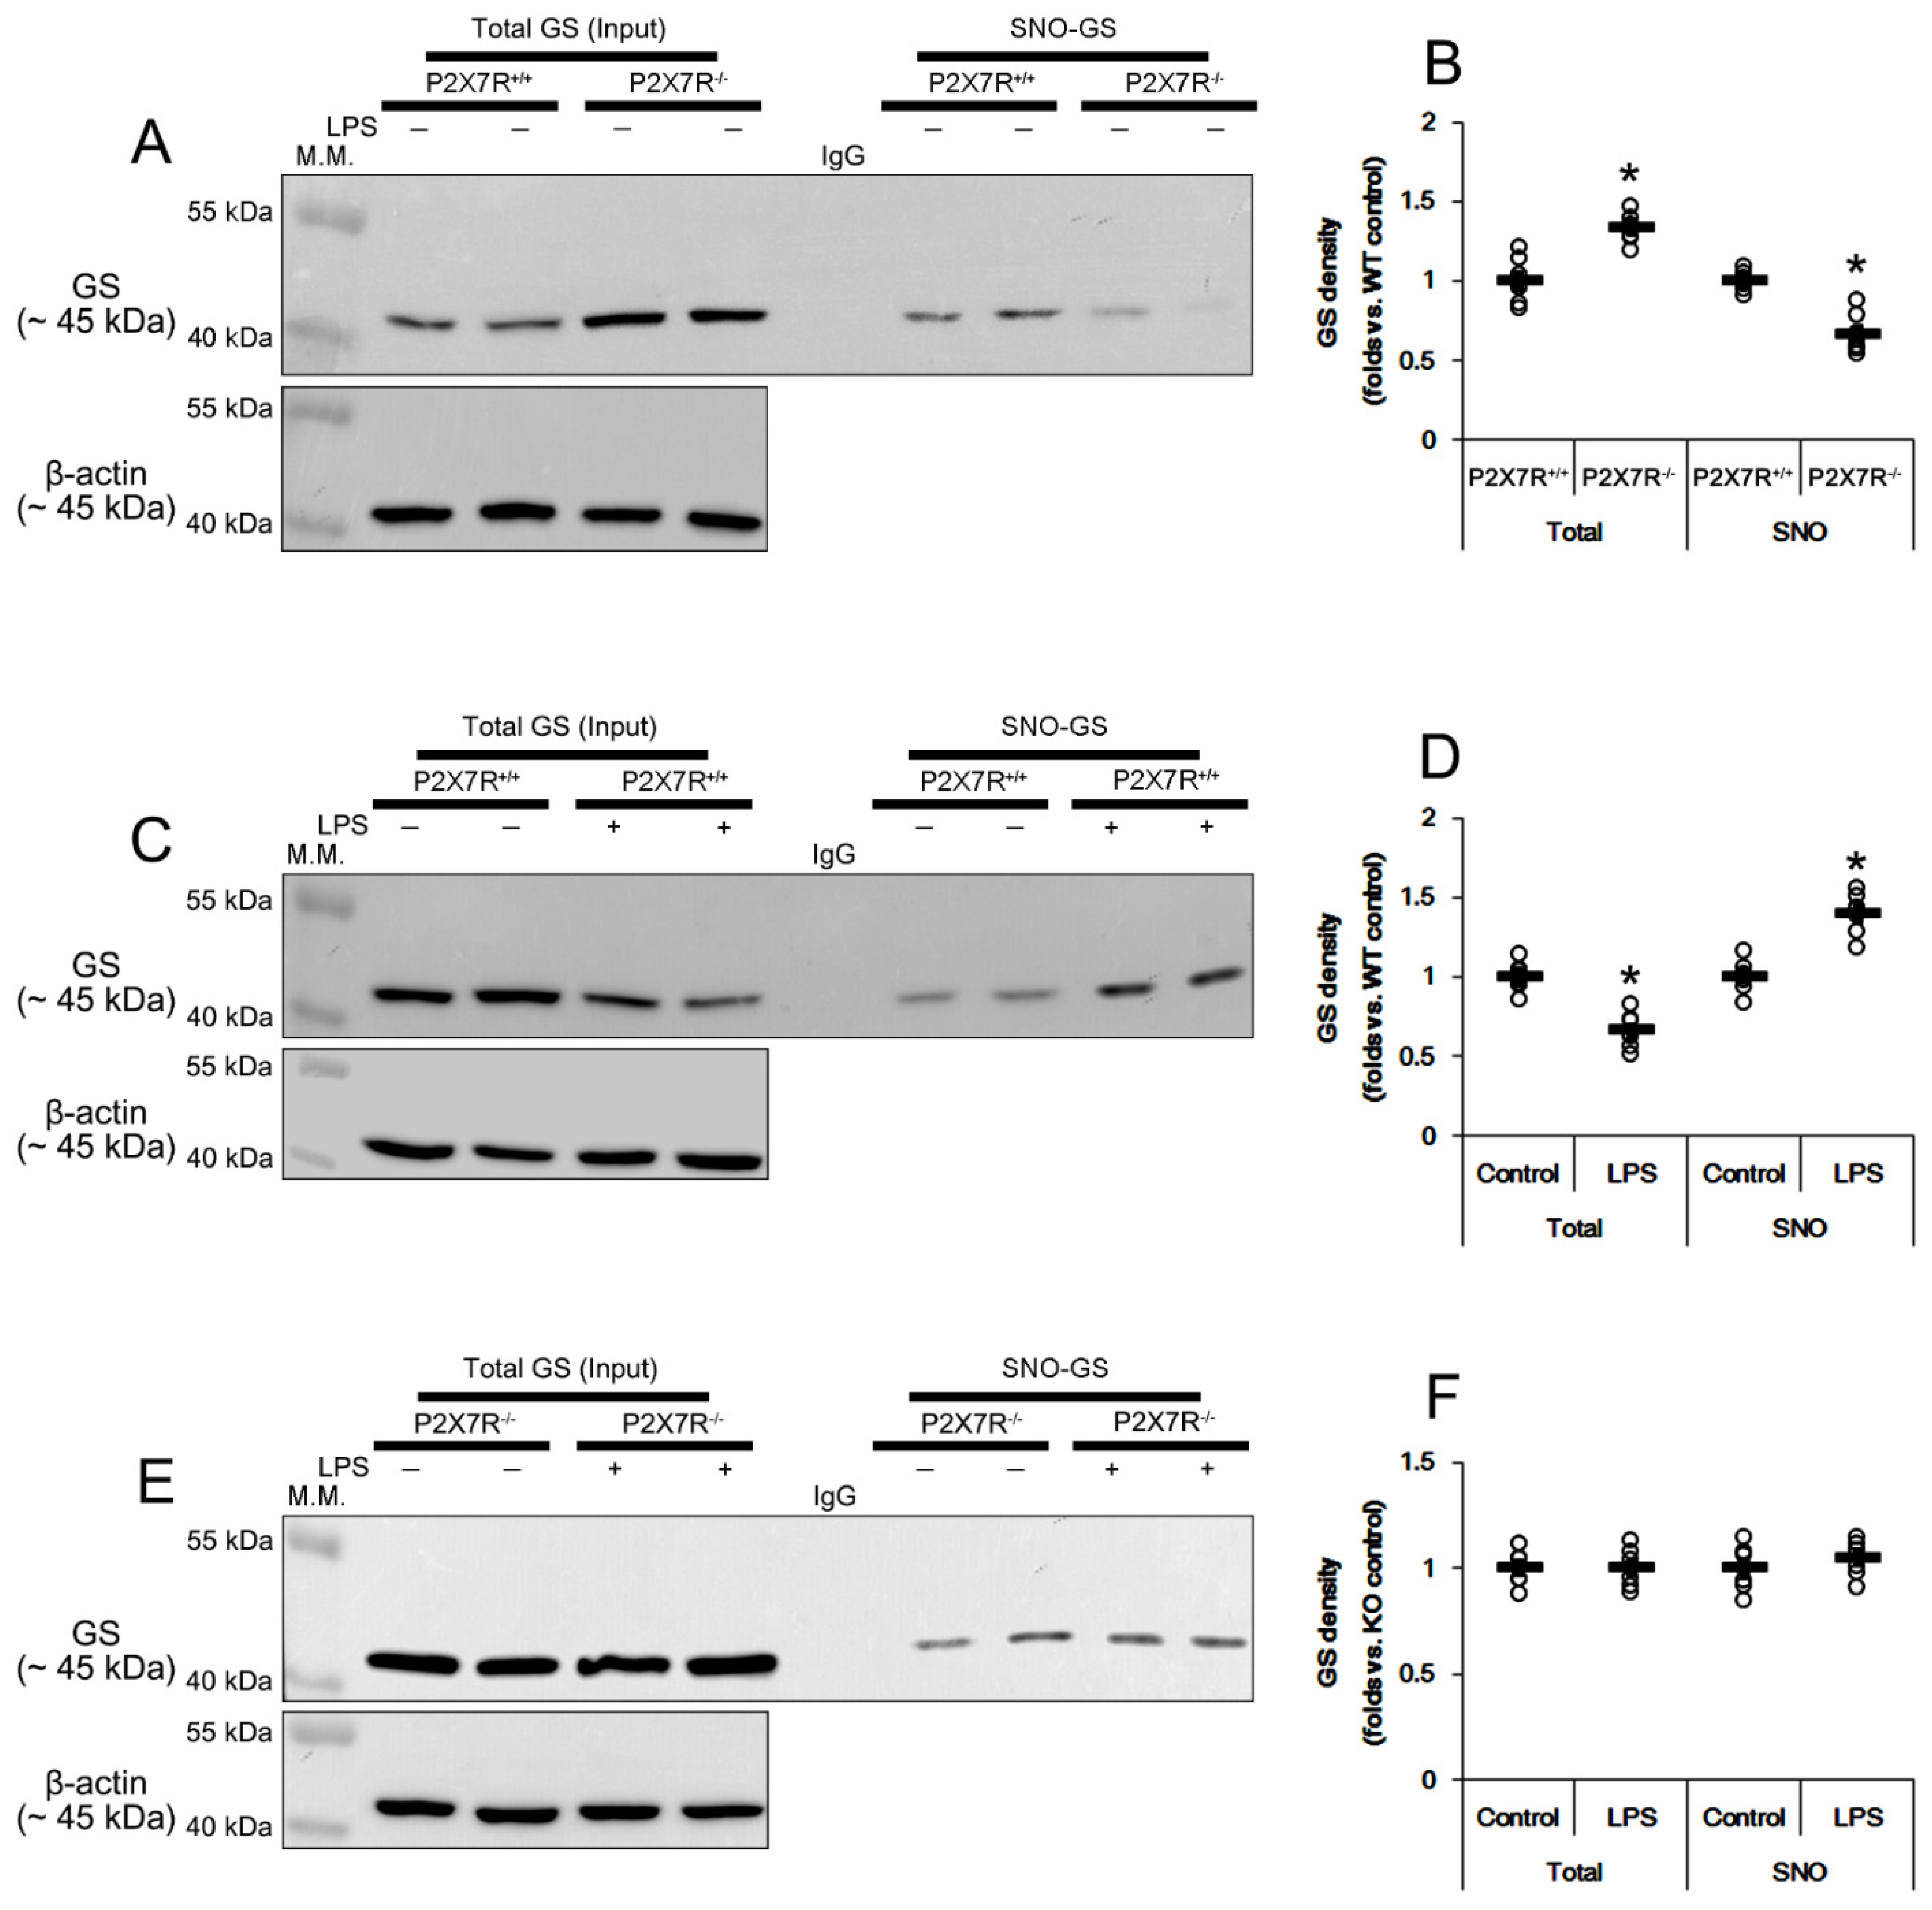
3.9. P2X7R Regulates S-Nitrosylation of GS and ASCT2 under Physiological and Post-LPS Treated Condition

NO can deplete GSH levels by S-nitrosylation of GSH metabolic enzymes [43]. Furthermore, four cysteine residues of GS are S-nitrosylated by NO: cysteine 99, 183, 269 and 346 [44]. Indeed, GS activity is highly susceptible to reactive nitrogen and oxygen species, and the inhibition of NO synthesis increases GS activity in rat brain and cultured rat astrocytes [45,46]. On the other hand, NO inhibits ASCT2 transporter activity by oxidation of cysteine residues [47]. To compensate NO-mediated ASCT2 inhibition, NO upregulates ASCT2 protein via de novo synthesis in vitro [48]. Thus, we also explored whether P2X7R deletion affects S-nitrosylation of GS and ASCT2 induced by LPS. Under physiological conditions, SNO-GS level in P2X7R−/− mice was 0.67-fold of P2X7R+/+ mice level (t(12) = 6.352, p < 0.001, Student t-test, n = 7, respectively; Figure 7A,B). LPS increased SNO-GS level to 1.4-fold of control level in P2X7R+/+ mice (t(12) = 6.48, p < 0.001, Student t-test, n = 7, respectively; Figure 7C,D), but not P2X7R−/− mice (t(12) = 0.98, p = 0.346, Student t-test, n = 7, respectively; Figure 7E,F). These findings indicate that P2X7R deletion may ameliorate S-nitrosylation of GS under physiological- and post-LPS conditions. Similar to the S-nitrosylation of GS, SNO-ASCT2 level in P2X7R−/− mice was 0.68-fold of P2X7R+/+ mice level under physiological condition (t(12) = 6.475, p < 0.001, Student t-test, n = 7, respectively; Figure 8A,B). However, LPS increased SNO-ASCT2 level to 1.32- and 1.16-fold of control level in P2X7R+/+ (t(12) = 5.349, p < 0.001, Student t-test, n = 7, respectively; Figure 8C,D) and P2X7R−/− mice (t(12) = 5.16, p < 0.001, Student t-test, n = 7, respectively; Figure 8E,F), respectively. Thus, P2X7R deletion attenuated increased SNO-ASCT2 production induced by LPS (F(1,12) = 9.338, p = 0.01, one-way ANOVA, n = 7, respectively; Figure 8E,F).
Considering that the increased GS expression induces ASCT2 trafficking [41,42], we also analyzed the correlations of expression/S-nitrosylation level between GS and ASCT2. Linear regression analysis showed a direct proportional relationship between GS and ASCT2 levels with linear correlation coefficients of 0.8519 (t(19) = 7.09, p < 0.001, n = 21, respectively; Figure 8G) and 0.8582 (t(19) = 7.28, p < 0.001, n = 21, respectively; Figure 8G) in P2X7R+/+ and P2X7R−/− mice, respectively. The SNO-GS level also showed a direct proportional relationship with SNO-ASCT2 level in P2X7R+/+ (linear correlation coefficients, 0.7547; t(19) = 5.01, p < 0.001, n = 21, respectively; Figure 8G) and P2X7R−/− mice (linear correlation coefficients, 0.8379; t(19) = 6.69, p < 0.001; Figure 8G), respectively. These findings indicate that P2X7R may be involved in GS-mediated ASCT2 regulation under physiological and post-LPS treated conditions.

4. Discussion

LPS is a gram-negative bacterial cell surface proteoglycan, which triggers neuroinflammation via toll-like receptor 4 (TLR4)-mediated microglial and astroglial activation in the brain [49]. After exposure to LPS, P2X7R augments iNOS expression and production of NO in microglia and astrocytes [26,50]. Therefore, P2X7R is one of the modulators of neuroinflammatory responses. In the present study, SNO-cysteine level in the hippocampus was higher in P2X7R+/+ mice than that in P2X7R−/− mice under physiological conditions. Furthermore, LPS led to microglial activation and reactive astrogliosis in P2X7R+/+ mice concomitant with increases in iNOS expression and SNO-cysteine production, which were attenuated by P2X7R deletion. These findings indicate that P2X7R may regulate nitrosative stress in the brain under physiological and inflammatory conditions. Interestingly, S-nitrosylation facilitates the trafficking of P2X7R, which promotes microglial activation and astroglial dysfunction following status epilepticus (a sustained seizure activity) [11]. Therefore, our findings suggest that P2X7R and iNOS may exert nitrosative stress in a positive feedback manner under inflammatory conditions.
Nrf2 plays a role in the regulation of cellular redox homeostasis [32]. Under nitrosative stress, Nrf2 sequestered by Keap1 is transported to the nucleus and promotes ARE-related gene expressions. However, excessive nitrosative stress leads to Nrf2 proteasomal degradation [51,52]. Indeed, a low dose of LPS (0.5 mg/kg) increases Nrf2 expression accompanied by the upregulated heme oxygenase-1 (HO-1, one of the downstream genes of Nrf2) at 4 h after treatment [53]. However, a high dose of LPS (1 mg/kg/day) leads to Nrf2 downregulation 6 days after administration [54]. Furthermore, a high dose of LPS (1 mg/kg) decreases Nrf2 expression and is coupled with reduced HO-1 expression and the upregulations of interleukin-6 that are regulated by Nrf2 [54]. In the present study, LPS (5 mg/kg) decreased the total Nrf2 protein level and its nuclear accumulation in microglia and astrocytes 3 days after treatment, which are ameliorated by P2X7R deletion. Considering these previous studies and the present data, it is plausible that Nrf2 upregulation may be an adaptive response against oxidative and/or nitrosative stress in response to a low dose of LPS at the early time window. In contrast, a high dose of LPS would lead to Nrf2 downregulation (or degradation), and in turn a decreased Nrf2 capacity for defending against oxidative- or nitrosative stress would contribute to LPS-induced neuroinflammation at the late time window. Since Nrf2 inhibits iNOS upregulation and attenuates the formation of SNO-proteins induced by LPS [10,30,31]; therefore, our findings suggest that P2X7R may reinforce iNOS-mediated nitrosative stress by facilitating Nrf2 degradation following LPS treatment.
Recently, we have reported that P2X7R deletion reduces the total GSH level in the hippocampus under physiological conditions, as an adaptive response to the absence of oxidative or nitrosative stresses mediated by P2X7R [18]. Consistent with this report, the present data show that the total GSH level in P2X7R−/− mice was lower than that in P2X7R+/+ mice. Furthermore, LPS decreased total GSH concentration to 86% and 95% of control levels in P2X7R+/+ and P2X7R−/− mice, respectively. Regarding that Nrf2 activates GSH biosynthesis [55,56] and P2X7R deletion prevented LPS-induced GSHS downregulation in the present study, our findings indicate that P2X7R may aggravate LPS-induced nitrosative stress, which would increase GSH consumption or reduce GSH synthesis.
On the other hand, Nrf2 activates GCLC and xCT which maintain intracellular GSH levels by regulating the rate-limiting steps for GSH synthesis. Furthermore, GSH depletion increases the transcription of Nrf2 and xCT [55,56,57]. Therefore, GSH concentration and the Nrf2 system may be reciprocally regulated by each other. In the present study, P2X7R deletion did not affect Nrf2, xCT and GCLC levels under physiological conditions. Unexpectedly, LPS increased Nrf2 degradation and xCT expression, which were abrogated by P2X7R deletion. Furthermore, LPS did not affect GCLC levels in both P2X7R+/+ and P2X7R−/− mice. Considering the xCT-mediated cystine-glutamate shuttle [58], it is likely that xCT upregulation with unaltered GCLC expression may be an Nrf2 independent compensatory response to GSH depletion induced by LPS. Indeed, Nrf2−/− mice show no genotypic difference in xCT level [59]. γ-Tocopheryl quinone (a powerful chemotherapeutic agent as an oxidative metabolite of γ-tocopherol) can increase cellular GSH levels without any considerable change in GCLC but facilitates the availability of cystine through Nrf2-independent xCT induction [60]. xCT level in astrocytes is also upregulated by intracellular GSH depletion, independent of Nrf2 [61]. However, xCT constitutes a cystine-cysteine shuttle whereby cystine uptake drives cysteine release, and extracellular cysteine provided by this shuttle is necessary for the transfer of NO equivalents [62]. Therefore, our findings provide the possibility that LPS-induced xCT upregulation may participate in the clearance of SNO-proteins against P2X7R-mediated nitrosative stress but may exacerbate GSH depletion by excessive cysteine efflux. Further studies are needed to elucidate the role of xCT upregulation under neuroinflammatory conditions.
Glutamate and glutamine are equally required for GSH biosynthesis through the glutamate-glutamine cycle that is regulated by GLS and GS [32]. LPS activates GLS accompanied by increased NO production [40,63]. The present data also demonstrate that LPS increased GLS protein level in P2X7R+/+, but not P2X7R−/− mice, although P2X7R deletion did not affect GLS expression under physiological conditions. Since xCT exchanges glutamate for cystine influx [14,15], GLS upregulation may increase glutamate gradients to facilitate xCT-mediated cystine uptake for GSH synthesis. Indeed, GLS hyperactivation increases glutamate release and xCT upregulation amplifies glutamate efflux [64,65]. In contrast, LPS reduces GS expression, which enhances the release of inflammatory mediators and leads to perturbation of the redox balance [66,67]. Consistent with our previous study [18], the present study shows that P2X7R deletion increased GS expression, but reduced SNO-GS levels under physiological conditions. LPS decreased GS expression, accompanied by the increased SNO-GS level in P2X7R+/+ mice, while it did not affect them in P2X7R−/− mice. Since S-nitrosylation of GS leads to its degradation by the 20S proteasome [68], our findings indicate that P2X7R may decrease GS level by accelerating S-nitrosylation-mediated GS degradation under physiological- and post-LPS conditions. Considering that GS converts glutamate to glutamine [38], this GS downregulation may contribute to an increase in intracellular glutamate concentration representing an aberrant glutamate-glutamine cycle under inflammatory conditions. Interestingly, glutamine enhances Nrf2 and GSHS activities [25]. Therefore, it is likely that GS upregulation in P2X7R−/− mice may also play an important role in the preservation of Nrf2 and GSHS levels following LPS treatment. Taken together, our findings suggest that P2X7R may modulate LPS-induce neuroinflammation by regulating the glutamate-glutamine cycle.
ASCT2 is a glutamine:cysteine exchanger that participates in GSH biosynthesis [41,42]. S-nitrosylation inhibits ASCT2 activity [47] and leads to ASCT2 upregulation as an adaptive response [48]. In the present study, P2X7R deletion increased ASCT2 expression, but reduced SNO-ASCT2 level under physiological conditions. LPS decreased ASCT2 expression, accompanied by the increased SNO-ASCT2 level in P2X7R+/+ mice, while it enhanced only SNO-ASCT2 level in P2X7R−/− mice. The present data also reveal that GS and SNO-GS levels had direct proportional relationships to ASCT2 and SNO-ASCT2 levels, respectively, in both P2X7R+/+ and P2X7R−/− mice, indicating that GS activity/expression may regulate ASCT2 expression independent of P2X7R. Compatible with the reduced GS expression; therefore, our findings suggest that P2X7R may inhibit ASCT2-mediated glutamine:cysteine exchange under neuroinflammatory conditions, which would reduce GSH biosynthesis.
In the present study, P2X7R deletion relieved, not completely inhibited, the upregulations of iNOS expression and SNO-cysteine level induced by LPS. However, SNO-GS level was unaffected by LPS in P2X7R−/− mice. Although we cannot provide the underlying mechanisms of this phenomenon, the possibility would considerable. In contrast to the case of SNO-GS level, the present data show the increased SNO-ASCT2 level induced by LPS in both P2X7R+/+ and P2X7R−/− mice. Therefore, it is likely that NO generated from iNOS may lead to S-nitrosylation of ASCT2 rather than GS due to the distinct affinity of NO bindings between ASCT2 and GS. The affinity test for NO binding to target proteins would be useful to understand the underlying mechanisms of nitrosative stress under neuroinflammatory conditions.

5. Conclusions

In the present study, we demonstrate that P2X7R deletion (1) attenuated iNOS upregulation and Nrf2 degradation induced by LPS, (2) decreased SNO-cysteine production under physiological and post-LPS treated conditions, (3) ameliorated the LPS-induced decreases in GSH, GSHS, GS and ASCT2 levels without altering GCLC level, (4) inhibited LPS-induced xCT and GLS upregulation, and (5) reduced S-nitrosylations of GS and ASCT2. These findings indicate that P2X7R may augment LPS-induced neuroinflammation by inducing Nrf2 degradation, aberrant glutamate-glutamine cycle and impaired cystine/cysteine uptake, which would inhibit GSH biosynthesis. Therefore, we suggest the targeting of P2X7R, which would exert nitrosative stress with iNOS in a positive feedback manner, and may be one of the important therapeutic strategies of nitrosative stress under pathophysiological conditions.

Supplementary Materials

The following supporting information can be downloaded at: https://www.mdpi.com/article/10.3390/antiox11040778/s1, Figure S1: Full-length gel images of Western blot data in Figure 2A; Figure S2: Full-length gel images of Western blot data in Figure 4A; Figure S3: Full-length gel images of Western blot data in Figure 6B; Figure S4: Full-length gel images of Western blot data in Figure 7; Figure S5: Full-length gel images of Western blot data in Figure 8.

Author Contributions

J.-E.K. designed and supervised the project. D.-S.L. and J.-E.K. performed the experiments described in the manuscript with J.-E.K. and analyzed the data. D.-S.L. and J.-E.K. wrote the manuscript. All authors have read and agreed to the published version of the manuscript.

Funding

This study was supported by a grant of National Research Foundation of Korea (NRF) grant (No. 2021R1A2C4002003).

Institutional Review Board Statement

All experimental protocols were approved by the Institutional Animal Care and Use Committee of Hallym University (Chuncheon, South Korea, Code number: Hallym 2018-3, approval date: 30 April 2018 and Hallym 2021-30, approval date: 17 May 2021).

Informed Consent Statement

Not applicable.

Data Availability Statement

The data presented in this study are available in the article and Supplementary Materials.

Conflicts of Interest

The authors declare no conflict of interest. The funders had no role in the design of the study; in the collection, analyses, or interpretation of data; in the writing of the manuscript, or in the decision to publish the results.

References

  1. Kim, J.E.; Ko, A.R.; Hyun, H.W.; Min, S.J.; Kang, T.C. P2RX7-MAPK1/2-SP1 axis inhibits MTOR independent HSPB1-mediated astroglial autophagy. Cell Death Dis. 2018, 9, 546. [Google Scholar] [CrossRef] [PubMed]
  2. Kim, J.E.; Kang, T.C. The P2X7 receptor-pannexin-1 complex decreases muscarinic acetylcholine receptor-mediated seizure susceptibility in mice. J. Clin. Investig. 2011, 121, 2037–2047. [Google Scholar] [CrossRef] [PubMed] [Green Version]
  3. Kim, J.E.; Ryu, H.J.; Yeo, S.I.; Kang, T.C. P2X7 receptor regulates leukocyte infiltrations in rat frontoparietal cortex following status epilepticus. J. Neuroinflamm. 2010, 7, 65. [Google Scholar] [CrossRef] [PubMed] [Green Version]
  4. Lo, J.C.; Huang, W.C.; Chou, Y.C.; Tseng, C.H.; Lee, W.L.; Sun, S.H. Activation of P2X(7) receptors decreases glutamate uptake and glutamine synthetase activity in RBA-2 astrocytes via distinct mechanisms. J. Neurochem. 2008, 105, 151–164. [Google Scholar] [CrossRef] [PubMed]
  5. Codocedo, J.F.; Godoy, J.A.; Poblete, M.I.; Inestrosa, N.C.; Huidobro-Toro, J.P. ATP induces NO production in hippocampal neurons by P2X(7) receptor activation independent of glutamate signaling. PLoS ONE 2013, 8, e57626. [Google Scholar] [CrossRef] [Green Version]
  6. Ficker, C.; Rozmer, K.; Kató, E.; Andó, R.D.; Schumann, L.; Krügel, U.; Franke, H.; Sperlágh, B.; Riedel, T.; Illes, P. Astrocyte-neuron interaction in the substantia gelatinosa of the spinal cord dorsal horn via P2X7 receptor-mediated release of glutamate and reactive oxygen species. Glia 2014, 62, 1671–1686. [Google Scholar] [CrossRef] [Green Version]
  7. Sperlágh, B.; Haskó, G.; Németh, Z.; Vizi, E.S. ATP released by LPS increases nitric oxide production in raw 264.7 macrophage cell line via P2Z/P2X7 receptors. Neurochem. Int. 1998, 33, 209–215. [Google Scholar] [CrossRef]
  8. Hu, Y.; Fisette, P.L.; Denlinger, L.C.; Guadarrama, A.G.; Sommer, J.A.; Proctor, R.A.; Bertics, P.J. Purinergic receptor modulation of lipopolysaccharide signaling and inducible nitric-oxide synthase expression in RAW 264.7 macrophages. J. Biol. Chem. 1998, 273, 27170–27175. [Google Scholar] [CrossRef] [Green Version]
  9. Choi, H.B.; Ryu, J.K.; Kim, S.U.; McLarnon, J.G. Modulation of the purinergic P2X7 receptor attenuates lipopolysaccharide-mediated microglial activation and neuronal damage in inflamed brain. J. Neurosci. 2007, 27, 4957–4968. [Google Scholar] [CrossRef] [Green Version]
  10. Qu, Z.; Meng, F.; Zhou, H.; Li, J.; Wang, Q.; Wei, F.; Cheng, J.; Greenlief, M.C.; Lubahn, B.M.; Sun, Y.G.; et al. NitroDIGE analysis reveals inhibition of protein S-nitrosylation by epigallocatechin gallates in lipopolysaccharide-stimulated microglial cells. J. Neuroinflamm. 2014, 11, 17. [Google Scholar] [CrossRef] [Green Version]
  11. Lee, D.S.; Kim, J.E. Protein disulfide isomerase-mediated S-nitrosylation facilitates surface expression of P2X7 receptor following status epilepticus. J. Neuroinflamm. 2021, 18, 14. [Google Scholar] [CrossRef] [PubMed]
  12. Dringen, R.; Brandmann, M.; Hohnholt, M.C.; Blumrich, E.M. Glutathione-dependent detoxification processes in astrocytes. Neurochem. Res. 2015, 40, 2570–2582. [Google Scholar] [CrossRef] [PubMed]
  13. Utsunomiya-Tate, N.; Endou, H.; Kanai, Y. Cloning and functional characterization of a system ASC-like Na+-dependent neutral amino acid transporter. J. Biol. Chem. 1996, 271, 14883–14890. [Google Scholar] [CrossRef] [PubMed] [Green Version]
  14. Kalivas, P.W. The glutamate homeostasis hypothesis of addiction. Nat. Rev. Neurosci. 2009, 10, 561–572. [Google Scholar] [CrossRef] [PubMed]
  15. Van Liefferinge, J.; Bentea, E.; Demuyser, T.; Albertini, G.; Follin-Arbelet, V.; Holmseth, S.; Merckx, E.; Sato, H.; Aerts, J.L.; Smolders, I.; et al. Comparative analysis of antibodies to xCT (Slc7a11): Forewarned is forearmed. J. Comp. Neurol. 2016, 524, 1015–1032. [Google Scholar] [CrossRef] [PubMed]
  16. Fu, W.; Ruangkittisakul, A.; MacTavish, D.; Baker, G.B.; Ballanyi, K.; Jhamandas, J.H. Activity and metabolism-related Ca2+ and mitochondrial dynamics in co-cultured human fetal cortical neurons and astrocytes. Neuroscience 2013, 250, 520–535. [Google Scholar] [CrossRef]
  17. Pan, H.C.; Chou, Y.C.; Sun, S.H. P2X7 R-mediated Ca(2+)-independent d-serine release via pannexin-1 of the P2X7 R-pannexin-1 complex in astrocytes. Glia 2015, 63, 877–893. [Google Scholar] [CrossRef]
  18. Park, H.; Kim, J.E. Deletion of P2X7 receptor decreases basal glutathione level by changing glutamate-glutamine cycle and neutral amino acid transporters. Cells 2020, 9, 995. [Google Scholar] [CrossRef]
  19. Ishii, T.; Itoh, K.; Takahashi, S.; Sato, H.; Yanagawa, T.; Katoh, Y.; Bannai, S.; Yamamoto, M. Transcription factor Nrf2 coordinately regulates a group of oxidative stress-inducible genes in macrophages. J. Biol Chem. 2000, 275, 16023–16029. [Google Scholar] [CrossRef] [Green Version]
  20. Shih, A.Y.; Johnson, D.A.; Wong, G.; Kraft, A.D.; Jiang, L.; Erb, H.; Johnson, J.A.; Murphy, T.H. Coordinate regulation of glutathione biosynthesis and release by Nrf2-expressing glia potently protects neurons from oxidative stress. J. Neurosci. 2003, 23, 3394–3406. [Google Scholar] [CrossRef]
  21. Itoh, K.; Wakabayashi, N.; Katoh, Y.; Ishii, T.; Igarashi, K.; Engel, J.D.; Yamamoto, M. Keap1 represses nuclear activation of antioxidant responsive elements by Nrf2 through binding to the amino-terminal Neh2 domain. Genes Dev. 1999, 13, 76–86. [Google Scholar] [CrossRef] [PubMed] [Green Version]
  22. McMahon, M.; Itoh, K.; Yamamoto, M.; Hayes, J.D. Keap1-dependent proteasomal degradation of transcription factor Nrf2 contributes to the negative regulation of antioxidant response element-driven gene expression. J. Biol. Chem. 2003, 278, 21592–21600. [Google Scholar] [CrossRef] [PubMed] [Green Version]
  23. Kobayashi, A.; Ohta, T.; Yamamoto, M. Unique function of the Nrf2-Keap1 pathway in the inducible expression of antioxidant and detoxifying enzymes. Methods Enzymol. 2004, 378, 273–286. [Google Scholar] [PubMed]
  24. Noh, H.; Jeon, J.; Seo, H. Systemic injection of LPS induces region-specific neuroinflammation and mitochondrial dysfunction in normal mouse brain. Neurochem. Int. 2014, 69, 35–40. [Google Scholar] [CrossRef]
  25. Venoji, R.; Amirtharaj, G.J.; Kini, A.; Vanaparthi, S.; Venkatraman, A.; Ramachandran, A. Enteral glutamine differentially regulates Nrf 2 along the villus-crypt axis of the intestine to enhance glutathione levels. J. Gastroenterol. Hepatol. 2015, 30, 1740–1747. [Google Scholar] [CrossRef]
  26. Guerra, A.N.; Fisette, P.L.; Pfeiffer, Z.A.; Quinchia-Rios, B.H.; Prabhu, U.; Aga, M.; Denlinger, L.C.; Gaudarrama, A.G.; Abozeid, S.; Sommer, J.A.; et al. Purinergic receptor regulation of LPS-induced signaling and pathophysiology. J. Endotoxin Res. 2003, 9, 256–263. [Google Scholar] [CrossRef] [Green Version]
  27. Muhammad, T.; Ikram, M.; Ullah, R.; Rehman, S.U.; Kim, M.O. Hesperetin, a citrus flavonoid, attenuates LPS-induced neuroinflammation, apoptosis and memory impairments by modulating TLR4/NF-kappaB signaling. Nutrients 2019, 11, 648. [Google Scholar] [CrossRef] [Green Version]
  28. Noworyta-Sokolowska, K.; Gorska, A.; Golembiowska, K. LPS-induced oxidative stress and inflammatory reaction in the rat striatum. Pharmacol. Rep. 2013, 65, 863–869. [Google Scholar] [CrossRef]
  29. Shah, S.A.; Khan, M.; Jo, M.H.; Jo, M.G.; Amin, F.U.; Kim, M.O. Melatonin stimulates the SIRT1/Nrf2 signaling pathway counteracting lipopolysaccharide (LPS)-induced oxidative stress to rescue postnatal rat brain. CNS Neurosci. Ther. 2017, 23, 33–44. [Google Scholar] [CrossRef]
  30. Townsend, B.E.; Johnson, R.W. Sulforaphane induces Nrf2 target genes and attenuates inflammatory gene expression in microglia from brain of young adult and aged mice. Exp. Gerontol. 2016, 73, 42–48. [Google Scholar] [CrossRef] [Green Version]
  31. Lee, D.S.; Kwon, K.H.; Cheong, S.H. Taurine chloramine suppresses LPS-induced neuroinflammatory responses through Nrf2-mediated heme oxygenase-1 expression in mouse BV2 microglial cells. Adv. Exp. Med. Biol. 2017, 975, 131–143. [Google Scholar] [PubMed]
  32. Sun, X.; Erb, H.; Murphy, T.H. Coordinate regulation of glutathione metabolism in astrocytes by Nrf2. Biochem. Biophys. Res. Commun. 2005, 326, 371–377. [Google Scholar] [CrossRef] [PubMed]
  33. Erickson, A.M.; Nevarea, Z.; Gipp, J.J.; Mulcahy, R.T. Identification of a variant antioxidant response element in the promoter of the human glutamate-cysteine ligase modifier subunit gene. Revision of the ARE consensus sequence. J. Biol. Chem. 2002, 277, 30730–30737. [Google Scholar] [CrossRef] [PubMed] [Green Version]
  34. McElroy, P.B.; Sri Hari, A.; Day, B.J.; Patel, M. Post-translational activation of glutamate cysteine ligase with dimercaprol: A novel mechanism of inhibiting neuroinflammation in vitro. J. Biol. Chem. 2017, 292, 5532–5545. [Google Scholar] [CrossRef] [Green Version]
  35. Chen, J.; Yin, W.; Tu, Y.; Wang, S.; Yang, X.; Chen, Q.; Zhang, X.; Han, Y.; Pi, R. L-F001, a novel multifunctional ROCK inhibitor, suppresses neuroinflammation in vitro and in vivo: Involvement of NF-κB inhibition and Nrf2 pathway activation. Eur. J. Pharmacol. 2017, 806, 1–9. [Google Scholar] [CrossRef]
  36. Wu, P.S.; Ding, H.Y.; Yen, J.H.; Chen, S.F.; Lee, K.H.; Wu, M.J. Anti-inflammatory activity of 8-hydroxydaidzein in LPS-stimulated BV2 microglial cells via activation of Nrf2-antioxidant and attenuation of Akt/NF-κB-inflammatory signaling pathways, as well as inhibition of COX-2 activity. J. Agric. Food Chem. 2018, 66, 5790–5801. [Google Scholar] [CrossRef]
  37. Ko, K.; Yang, H.; Noureddin, M.; Iglesia-Ara, A.; Xia, M.; Wagner, C.; Luka, Z.; Mato, J.M.; Lu, S.C. Changes in S-adenosylmethionine and GSH homeostasis during endotoxemia in mice. Lab. Investig. 2008, 88, 1121–1129. [Google Scholar] [CrossRef] [Green Version]
  38. Häberle, J.; Görg, B.; Toutain, A.; Rutsch, F.; Benoist, J.F.; Gelot, A.; Suc, A.-L.; Koch, H.G.; Schliess, F.; Häussinger, D. Inborn error of amino acid synthesis: Human glutamine synthetase deficiency. J. Inherit. Metab. Dis. 2006, 29, 352–358. [Google Scholar] [CrossRef]
  39. Hayashi, M.K. Structure-function relationship of transporters in the glutamate-glutamine cycle of the central nervous system. Int. J. Mol. Sci. 2018, 19, 1177. [Google Scholar] [CrossRef] [Green Version]
  40. Gao, G.; Zhao, S.; Xia, X.; Li, C.; Li, C.; Ji, C.; Sheng, S.; Tang, Y.; Zhu, J.; Wang, Y.; et al. Glutaminase C regulates microglial activation and pro-inflammatory exosome release: Relevance to the pathogenesis of Alzheimer’s disease. Front. Cell. Neurosci. 2019, 13, 264. [Google Scholar] [CrossRef]
  41. Gegelashvili, M.; Rodriguez-Kern, A.; Pirozhkova, I.; Zhang, J.; Sung, L.; Gegelashvili, G. High-affinity glutamate transporter GLAST/EAAT1 regulates cell surface expression of glutamine/neutral amino acid transporter ASCT2 in human fetal astrocytes. Neurochem. Int. 2006, 48, 611–615. [Google Scholar] [CrossRef] [PubMed]
  42. Bröer, A.; Brookes, N.; Ganapathy, V.; Dimmer, K.S.; Wagner, C.A.; Lang, F.; Bröer, S. The astroglial ASCT2 amino acid transporter as a mediator of glutamine efflux. J. Neurochem. 1999, 73, 2184–2194. [Google Scholar] [PubMed]
  43. Asahi, M.; Fujii, J.; Suzuki, K.; Seo, H.G.; Kuzuya, T.; Hori, M.; Tada, M.; Fujii, S.; Taniguchi, N. Inactivation of glutathione peroxidase by nitric oxide. Implication for cytotoxicity. J. Biol. Chem. 1995, 270, 21035–21039. [Google Scholar] [CrossRef] [PubMed] [Green Version]
  44. Raju, K.; Doulias, P.T.; Evans, P.; Krizman, E.N.; Jackson, J.G.; Horyn, O.; Daikhin, Y.; Nissim, I.; Yudkoff, M.; Nissim, I.; et al. Regulation of brain glutamate metabolism by nitric oxide and S-nitrosylation. Sci. Signal. 2015, 8, ra68. [Google Scholar] [CrossRef] [Green Version]
  45. Miñana, M.D.; Kosenko, E.; Marcaida, G.; Hermenegildo, C.; Montoliu, C.; Grisolía, S.; Felipo, V. Modulation of glutamine synthesis in cultured astrocytes by nitric oxide. Cell. Mol. Neurobiol. 1997, 17, 433–445. [Google Scholar] [CrossRef]
  46. Kosenko, E.; Llansola, M.; Montoliu, C.; Monfort, P.; Rodrigo, R.; Hernandez-Viadel, M.; Erceg, S.; Sánchez-Perez, A.M.; Felipo, V. Glutamine synthetase activity and glutamine content in brain: Modulation by NMDA receptors and nitric oxide. Neurochem. Int. 2003, 43, 493–499. [Google Scholar] [CrossRef]
  47. Scalise, M.; Pochini, L.; Console, L.; Pappacoda, G.; Pingitore, P.; Hedfalk, K.; Indiveri, C. Cys site-directed mutagenesis of the human SLC1A5 (ASCT2) transporter: Structure/function relationships and crucial role of Cys467 for redox sensing and glutamine transport. Int. J. Mol. Sci. 2018, 19, 648. [Google Scholar] [CrossRef] [Green Version]
  48. Uchiyama, T.; Matsuda, Y.; Wada, M.; Takahashi, S.; Fujita, T. Functional regulation of Na+-dependent neutral amino acid transporter ASCT2 by S-nitrosothiols and nitric oxide in Caco-2 cells. FEBS Lett. 2005, 579, 2499–2506. [Google Scholar] [CrossRef] [Green Version]
  49. Barbierato, M.; Facci, L.; Argentini, C.; Marinelli, C.; Skaper, S.D.; Giusti, P. Astrocyte-microglia cooperation in the expression of a pro-inflammatory phenotype. CNS Neurol. Disord. Drug Targets 2013, 12, 608–618. [Google Scholar] [CrossRef]
  50. Aga, M.; Watters, J.J.; Pfeiffer, Z.A.; Wiepz, G.J.; Sommer, J.A.; Bertics, P.J. Evidence for nucleotide receptor modulation of cross talk between MAP kinase and NF-kappa B signaling pathways in murine RAW 264.7 macrophages. Am. J. Physiol. Cell Physiol. 2004, 286, 923–930. [Google Scholar] [CrossRef]
  51. Mann, G.E. Nrf2-mediated redox signalling in vascular health and disease. Free Radic. Biol. Med. 2014, 75, S1. [Google Scholar] [CrossRef] [PubMed]
  52. Owuor, E.D.; Kong, A.N. Antioxidants and oxidants regulated signal transduction pathways. Biochem. Pharmacol. 2002, 64, 765–770. [Google Scholar] [CrossRef]
  53. Leite, J.A.; Isaksen, T.J.; Heuck, A.; Scavone, C.; Lykke-Hartmann, K. The α2 Na+/K+-ATPase isoform mediates LPS-induced neuroinflammation. Sci. Rep. 2020, 10, 14180. [Google Scholar] [CrossRef] [PubMed]
  54. Ali, T.; Rahman, S.U.; Hao, Q.; Li, W.; Liu, Z.; Ali Shah, F.; Murtaza, I.; Zhang, Z.; Yang, X.; Liu, G.; et al. Melatonin prevents neuroinflammation and relieves depression by attenuating autophagy impairment through FOXO3a regulation. J. Pineal Res. 2020, 69, e12667. [Google Scholar] [CrossRef] [PubMed]
  55. Steele, M.L.; Fuller, S.; Patel, M.; Kersaitis, C.; Ooi, L.; Münch, G. Effect of Nrf2 activators on release of glutathione, cysteinylglycine and homocysteine by human U373 astroglial cells. Redox Biol. 2013, 1, 441–445. [Google Scholar] [CrossRef] [PubMed]
  56. Ishii, T.; Mann, G.E. Redox status in mammalian cells and stem cells during culture in vitro: Critical roles of Nrf2 and cystine transporter activity in the maintenance of redox balance. Redox Biol. 2014, 2, 786–794. [Google Scholar] [CrossRef] [Green Version]
  57. Valdovinos-Flores, C.; Limón-Pacheco, J.H.; León-Rodríguez, R.; Petrosyan, P.; Garza-Lombó, C.; Gonsebatt, M.E. Systemic L-buthionine-S-R-sulfoximine treatment increases plasma NGF and upregulates L-cys/L-cys2 transporter and γ-glutamylcysteine ligase mRNAs through the NGF/TrkA/Akt/Nrf2 pathway in the striatum. Front. Cell. Neurosci. 2019, 13, 325. [Google Scholar] [CrossRef] [Green Version]
  58. Taguchi, K.; Tamba, M.; Bannai, S.; Sato, H. Induction of cystine/glutamate transporter in bacterial lipopolysaccharide induced endotoxemia in mice. J. Inflamm. 2007, 4, 20. [Google Scholar] [CrossRef] [Green Version]
  59. Pacchioni, A.M.; Vallone, J.; Melendez, R.I.; Shih, A.; Murphy, T.H.; Kalivas, P.W. Nrf2 gene deletion fails to alter psychostimulant-induced behavior or neurotoxicity. Brain Res. 2007, 1127, 26–35. [Google Scholar] [CrossRef] [Green Version]
  60. Ogawa, Y.; Saito, Y.; Nishio, K.; Yoshida, Y.; Ashida, H.; Niki, E. Gamma-tocopheryl quinone, not alpha-tocopheryl quinone, induces adaptive response through up-regulation of cellular glutathione and cysteine availability via activation of ATF4. Free Radic. Res. 2008, 42, 674–687. [Google Scholar] [CrossRef]
  61. Seib, T.M.; Patel, S.A.; Bridges, R.J. Regulation of the system x(C)-cystine/glutamate exchanger by intracellular glutathione levels in rat astrocyte primary cultures. Glia 2011, 59, 1387–1401. [Google Scholar] [CrossRef] [PubMed]
  62. Zhu, J.; Li, S.; Marshall, Z.M.; Whorton, A.R. A cystine-cysteine shuttle mediated by xCT facilitates cellular responses to S-nitrosoalbumin. Am. J. Physiol. Cell. Physiol. 2008, 294, C1012–C1020. [Google Scholar] [CrossRef] [PubMed] [Green Version]
  63. Hollinger, K.R.; Zhu, X.; Khoury, E.S.; Thomas, A.G.; Liaw, K.; Tallon, C.; Ying, W.; Prchalova, E.; Atsushi, K.; Camilo, R.; et al. Glutamine antagonist JHU-083 normalizes aberrant hippocampal glutaminase activity and improves cognition in APOE4 mice. J. Alzheimers Dis. 2020, 77, 437–447. [Google Scholar] [CrossRef]
  64. Thomas, A.G.; O’Driscoll, C.M.; Bressler, J.; Kaufmann, W.; Rojas, C.J.; Slusher, B.S. Small molecule glutaminase inhibitors block glutamate release from stimulated microglia. Biochem. Biophys. Res. Commun. 2014, 443, 32–36. [Google Scholar] [CrossRef] [PubMed] [Green Version]
  65. Fan, Z.; Wirth, A.K.; Chen, D.; Wruck, C.J.; Rauh, M.; Buchfelder, M.; Savaskan, N. Nrf2-Keap1 pathway promotes cell proliferation and diminishes ferroptosis. Oncogenesis 2017, 6, e371. [Google Scholar] [CrossRef] [Green Version]
  66. Palmieri, E.M.; Menga, A.; Lebrun, A.; Hooper, D.C.; Butterfield, D.A.; Mazzone, M.; Castegna, A. Blockade of glutamine synthetase enhances inflammatory response in microglial cells. Antioxid. Redox Signal. 2017, 26, 351–363. [Google Scholar] [CrossRef]
  67. Wang, S.; Zhang, H.; Geng, B.; Xie, Q.; Li, W.; Deng, Y.; Shi, W.; Pan, Y.; Kang, X.; Wang, J. 2-arachidonyl glycerol modulates astrocytic glutamine synthetase via p38 and ERK1/2 pathways. J. Neuroinflamm. 2018, 15, 220. [Google Scholar] [CrossRef]
  68. Görg, B.; Qvartskhava, N.; Voss, P.; Grune, T.; Häussinger, D.; Schliess, F. Reversible inhibition of mammalian glutamine synthetase by tyrosine nitration. FEBS Lett. 2007, 581, 84–90. [Google Scholar] [CrossRef] [Green Version]
Figure 1. Effects of P2X7R deletion on microglial and astroglial responses to LPS. P2X7R deletion attenuates microglial activation, but not reactive astrogliosis induced by LPS. (A) Representative images for GFAP (an astroglial marker) and Iba-1 (a microglial marker) positive cells. Low panels are high magnification photos of boxes in upper panels. (B,C) Quantification of effects of P2X7R on GFAP and Iba-1 intensities following LPS treatment. Error bars indicate S.E.M. (*,# p < 0.05 vs. control and WT mice, n = 7, respectively).
Antioxidants 11 00778 g001
Figure 2. Effects of P2X7R deletion on LPS-induced iNOS induction in microglia and astrocytes. P2X7R deletion ameliorates iNOS induction in microglia rather than astrocytes following LPS injection. (A) Representative Western blot of iNOS in the whole hippocampus. (B) Quantification of iNOS protein level based on Western blot data. Error bars indicate S.E.M. (*,# p < 0.05 vs. control and WT mice, n = 7, respectively). (C) Representative photos of iNOS expression, intensity and the degree of colocalization in IB4 (a microglial marker) and GFAP (an astroglial marker) positive cells. (D) Quantification of iNOS induction in microglia and astrocytes. Error bars indicate S.E.M. (*,# p < 0.05 vs. control and WT mice, n = 7, respectively). Full-length gel images of Western blot data in (A) could be found in Supplementary Figure S1.
Antioxidants 11 00778 g002
Figure 3. Effects of P2X7R deletion on LPS-induced SNO-cysteine production in microglia and astrocytes. Under physiological conditions, SNO-cysteine level in the hippocampus is higher in P2X7R+/+ mice than that in P2X7R−/− mice. LPS increases SNO-cysteine production in microglia and astrocytes within the hippocampus of P2X7R+/+ more than P2X7R−/− mice. In P2X7R−/− mice, SNO-cysteine level is lower in microglia than that in astrocytes. (A) Representative images for SNO-cysteine in the hippocampus. (B) Representative photos of SO-cysteine production in IB4 (a microglial marker) and GFAP (an astroglial marker) positive cells. (C) Quantification of SNO-cysteine production in the hippocampus. Error bars indicate S.E.M. (*,# p < 0.05 vs. control and WT mice, n = 7, respectively).
Antioxidants 11 00778 g003
Figure 4. Effects of P2X7R deletion on LPS-induced Nrf2 downregulation in microglia. LPS decreases Nrf2 protein level in the hippocampus of P2X7R+/+ mice, but not P2X7R−/− mice, since total Nrf2 level and its nuclear accumulation are reduced in microglia. (A) Representative Western blot of Nrf2 in the whole hippocampus. (B) Quantification of iNOS protein level based on Western blot data. Open circles indicate each individual value. Horizontal and error bars indicate the mean value and S.E.M., respectively (*,# p < 0.05 vs. control and WT mice, n = 7, respectively). (C) Representative photos of Nrf2 expression, intensity and the degree of colocalization in IB4 (a microglial marker) positive cells and DAPI (a nuclear marker). (D,E) Quantification of total and nuclear Nrf2 intensity in microglial. Error bars indicate S.E.M. (* p < 0.05 vs. control and WT mice, n = 7, respectively). Full-length gel images of Western blot data in this figure could be found in Supplementary Figure S2.
Antioxidants 11 00778 g004
Figure 5. Effects of P2X7R deletion on LPS-induced Nrf2 downregulation in astrocytes. LPS decreases total Nrf2 protein level in astrocytes of P2X7R+/+ mice, while it does not in astrocytes of P2X7R−/− mice. LPS also diminishes nuclear Nrf2 protein level in astrocytes of P2X7R+/+ mice. LPS-induced Nrf2 downregulation in astrocytes is attenuated in P2X7R−/− mice. (A) Representative photos of Nrf2 expression, intensity and the degree of colocalization in GFAP (an astroglial marker) positive cells and DAPI (a nuclear marker). (B,C) Quantification of total and nuclear Nrf2 intensity in astrocytes. Error bars indicate S.E.M. (*,# p < 0.05 vs. control and WT mice, n = 7, respectively).
Antioxidants 11 00778 g005
Figure 6. Effects of P2X7R deletion on GSH concentration and expressions of GCLC, GSHS, GS, GLS, ASCT2 and xCT following LPS injection. Under physiological condition, P2X7R deletion reduces GSH level in the hippocampus. However, P2X7R deletion increases GS and ASCT2 levels. LPS declines GSH concentration in P2X7R+/+ mice more than in P2X7R−/− mice. LPS decreases GSHS, GS and ASCT2 levels, but increases GLS and xCT levels only in the P2X7R+/+ mice. (A) Total GSH level in the hippocampus under physiological and post-LPS treated conditions. (B) Representative Western blot of GCLC, GSHS, GS, GLS, ASCT2 and xCT in the whole hippocampi of that P2X7R+/+ and P2X7R−/− mice. (CG) Quantification of GSHS, GS, GLS, ASCT2 and xCT levels based on Western blot data. Open circles indicate each individual value. Horizontal and error bars indicate the mean value and S.E.M., respectively (*,# p < 0.05 vs. control and WT mice, n = 7, respectively). Full-length gel images of Western blot data in (B) could be found in Supplementary Figure S3.
Antioxidants 11 00778 g006
Figure 7. Effects of P2X7R deletion on S-nitrosylation of GS following LPS injection. Under physiological conditions, total GS level in P2X7R−/− mice is higher than that of P2X7R+/+ mice. However, the SNO-GS level in P2X7R−/− mice is lower than that of P2X7R+/+ mice. LPS decreases total GS level but increases SNO-GS level in P2X7R+/+ mice. LPS does not affect them in P2X7R−/− mice. (A) Representative Western blot of total- and SNO-GS in the whole hippocampi of that P2X7R+/+ and P2X7R−/− mice. (B) Quantification of the total- and SNO-GS level based on Western blot data. Open circles indicate each individual value. Horizontal and error bars indicate the mean value and S.E.M., respectively (* p < 0.05 vs. WT mice, n = 7, respectively). (C) Representative Western blot of total- and SNO-GS in the whole hippocampi of that P2X7R+/+ mice following LPS treatment. (D) Quantification of total- and SNO-GS level based on Western blot data (* p < 0.05 vs. control mice, n = 7, respectively). (E) Representative Western blot of total- and SNO-GS in the whole hippocampi of that P2X7R−/− mice following LPS treatment. (F) Quantification of total- and SNO-GS level based on Western blot data. Horizontal and error bars indicate the mean value and S.E.M., respectively (n = 7, respectively). Full-length gel images of Western blot data in this figure could be found in Supplementary Figure S4.
Antioxidants 11 00778 g007
Figure 8. Effects of P2X7R deletion on ASCT2 expression and its S-nitrosylation following LPS injection. Under physiological conditions, total ASCT2 level in P2X7R−/− mice is higher than that of P2X7R+/+ mice. However, SNO-ASCT2 level in P2X7R−/− mice is lower than that of P2X7R+/+ mice. LPS decreases total ASCT2 level but increases SNO-ASCT2 level in P2X7R+/+ mice. LPS also increases SNO-ASCT2 level in P2X7R−/− mice without affecting total ASCT2 level. Total- and SNO-ASCT2 levels show a direct proportional relationship with Total- and SNO-GS levels in P2X7R+/+ and P2X7R−/− mice, respectively. (A) Representative Western blot of total- and SNO- ASCT2 in the whole hippocampi of that P2X7R+/+ and P2X7R−/− mice. (B) Quantification of total- and SNO-ASCT2 level based on Western blot data. Open circles indicate each individual value. Horizontal and error bars indicate the mean value and S.E.M., respectively (* p < 0.05 vs. WT mice, n = 7, respectively). (C) Representative Western blot of total- and SNO-ASCT2 in the whole hippocampi of that P2X7R+/+ mice following LPS treatment. (D) Quantification of total- and SNO-ASCT2 level based on Western blot data (* p < 0.05 vs. control mice, n = 7, respectively). (E) Representative Western blot of total- and SNO-ASCT2 in the whole hippocampi of that P2X7R−/− mice following LPS treatment. (F) Quantification of total- and SNO-ASCT2 level based on Western blot data (* p < 0.05 vs. control mice, n = 7, respectively). (G) Linear regression analyses of total- and SNO proteins between ASCT2 and GS in P2X7R+/+ and P2X7R−/− mice. Full-length gel images of Western blot data in this figure could be found in Supplementary Figure S5.
Antioxidants 11 00778 g008
Table 1. Primary antibodies and lectin used in the present study.
AntigenHostManufacturer (Catalog Number)Dilution Used
ASCT2RabbitAlomone labs (Jerusalem, Israel) (#ANT-082)1:500 (WB)
GCLCRabbitAbcam (Waltham, MA, USA) (#ab190685)1:2000 (WB)
GFAPMouseMillipore ( Burlington, MS, USA) (#MAB3402)1:2000 (IH)
GLSRabbitAbcam (#ab93434)1:1000 (WB)
GSMouseMillipore (#MAB302)1:1000 (WB)
GSHSRabbitAbcam (#ab133592)1:2000 (WB)
IB4 Vector (Los Altos, CA, USA) (#B-1205)1:200 (histochemistry)
SNO-cysteineRabbitAbcam (#ab94930)1:1000 (IH)
iNOSRabbitNovus Biologicals (Centennial, CO, USA)
(#NB300-605)
1:100 (IH)
1:500 (WB)
Iba-1RabbitBiocare Medical (Pacheco, CA, USA) (#CP 290)1:500 (IH)
Nrf2RabbitAbcam (#ab137550)1:200 (IH)
1:1000 (IH)
xCTRabbitAbcam (#ab175186)1:1000 (WB)
β-actinMouseSigma (#A5316)1:5000 (WB)
IH: Immunohistochemistry; WB: Western blot.
Publisher’s Note: MDPI stays neutral with regard to jurisdictional claims in published maps and institutional affiliations.

