Article

Histone Methyltransferase MLL1 Mediates Oxidative Stress and Apoptosis upon Deoxynivalenol Exposure in the Intestinal Porcine Epithelial Cells

1
Key Laboratory for Animal Genetics, Breeding, Reproduction and Molecular Design of Jiangsu Province, College of Animal Science and Technology, Yangzhou University, Yangzhou 225009, China
2
Joint International Research Laboratory of Agriculture & Agri-Product Safety, Yangzhou University, Yangzhou 225009, China
*
Authors to whom correspondence should be addressed.
These authors contributed equally to this work.
Antioxidants 2022, 11(10), 2006; https://doi.org/10.3390/antiox11102006
Submission received: 21 August 2022 / Revised: 2 October 2022 / Accepted: 4 October 2022 / Published: 11 October 2022
(This article belongs to the Special Issue Oxidative Stress in Livestock and Poultry)

Abstract

:
Deoxynivalenol (DON), as a secondary metabolite of fungi, is continually detected in livestock feed and has a high risk to animals and humans. Moreover, pigs are very sensitive to DON. Recently, the role of histone modification has drawn people’s attention; however, few studies have elucidated how histone modification participates in the cytotoxicity or genotoxicity induced by mycotoxins. In this study, we used intestinal porcine epithelial cells (IPEC-J2 cells) as a model to DON exposure in vitro. Mixed lineage leukemia 1 (MLL1) regulates gene expression by exerting the role of methyltransferase. Our studies demonstrated that H3K4me3 enrichment was enhanced and MLL1 was highly upregulated upon 1 μg/mL DON exposure in IPEC-J2 cells. We found that the silencing of MLL1 resulted in increasing the apoptosis rate, arresting the cell cycle, and activating the mitogen-activated protein kinases (MAPKs) pathway. An RNA-sequencing analysis proved that differentially expressed genes (DEGs) were enriched in the cell cycle, apoptosis, and tumor necrosis factor (TNF) signaling pathway between the knockdown of MLL1 and negative control groups, which were associated with cytotoxicity induced by DON. In summary, these current results might provide new insight into how MLL1 regulates cytotoxic effects induced by DON via an epigenetic mechanism.

1. Introduction

Deoxynivalenol (DON), also known as vomitoxin, belongs to the Trichothecene group, which is mainly Fusarium graminearum, F. culmorum and F. crookwellense, and has one of the highest contamination ratio and detection rates among mycotoxins [1]. DON contaminates wheat, barley, maize, and oats, etc. Moreover, DON is hard to be degraded even in the condition of high temperature and strong acid due to its stable chemical structure [2]. DON can be “modified” to produce more derivatives, such as 3-acetyl-DON, 15-acetyl-DON, deoxynivalenol-3-beta-D-glucopyranoside (D3G), de-epoxy DON (DOM-1), 3-epi-DON, and 3-keto-DON [3]. Pigs are very susceptible to DON, especially the intestine of pigs, which is the primary target of DON attacks [4]. In China, the National Standard GB 2761-2017 has stipulated that the standard limit of DON in cereals and grain products (including corn, barley, wheat, cereal, and wheat flour) should be 1000 µg/kg. In vivo, chronic DON exposure not only led to decreased feed intake and body weight in animals, but also affected their susceptibility to diseases and vaccination efficiency. For instance, a previous study suggested that low-dose DON exposure influenced the replication of porcine epidemic diarrhea virus (PEDV), increased diarrhea rates, and exacerbated the gut barrier injury [5]. Moreover, the exposure of pigs to DON for 4 weeks reduced the efficiency of vaccination against porcine reproductive and respiratory virus (PRRSV) [6]. In vitro or in vivo, acute or chronic DON both alters the expression of tight junction proteins thereby disrupting the intestinal barrier [7,8]. Mechanically, DON inhibits protein and nuclei acid synthesis by binding to the 60 S ribosome [9]. Previous studies have shown that DON caused accumulation levels of reactive oxygen species (ROS) in the mitochondria which could active the oxidative stress response and induce apoptosis and immune dysfunction [10].
Epigenetics aims to explain the regulation of gene expression by altering transcriptional activity and chromosomal structure [11]. Recently many studies have shown that epigenetic regulation can be involved in a variety of biological processes, including cytotoxicity induced by mycotoxin. For instance, our previous study indicated that the genome-wide methylation levels significantly changed and found 3030 differentially methylated regions (DMRs) after the IPEC-J2 cells were treated with 1 μg/mL DON for 48 h, then combined with RNA-sequencing analysis; the promotor region methylation of 29 genes was negatively correlated with gene expression [12]. DON exposure may play an important role in DNA methylation, but the underlying mechanism remains to be clarified. Histone methylation is a highly dynamic modification regulated by histone methyltransferases and demethylases in vitro and in vivo, which can result in the activation or suppression of gene expression, depending on the specific methylation site [13]. Lysine 4 (K4) methylation on histone 3 (H3) is a wide spectrum of modification and conservatively plays a crucial role in gene expression. The trimethylation of Lysine 4 on histone 3 (H3K4me3) generally marks the transcriptional activating of genes, whilst the trimethylation of histone 3 lysine 27 is usually related to silence gene expression [14].
Mixed lineage leukemia 1 (MLL1), also known as KMT2A, was initially uncovered in the research of cancer and the translocation and rearrangement of the MLL1 gene sequence results in the leukemia [15]. Subsequently, other studies discovered that MLL1 could specifically catalyze the H3K4 to undergo methylation modification [16]. MLL1 plays an important role in stem cell proliferation and differentiation, and regulates the expression of homeobox (HOX) gene clusters which are the major regulators during early embryonic development [17].
In the past several years, MLL1 was deeply investigated in the regulation of leukemogenesis, but few studies were performed regarding its own role under mycotoxins [18]. In the present study, the intestinal porcine epithelial cells (IPEC-J2 cells) were used as an in vitro model to explore the potential mechanism regulation of MLL1 upon DON stimulation. We uncovered that H3K4me3 modification enrichment was enhanced and the levels of MLL1 mRNA and MLL1 protein were highly expressed, upon IPEC-J2 cells exposure to 1 μg/mL DON. Silencing the MLL1 increased the rate of apoptosis and the level of ROS, the cell cycle was also arrested, and the MAPKs pathway was activated. Combined with the RNA-seq, TNF receptor superfamily member 1A (TNFRSF1A) is probably the potential target of MLL1 to participate in the regulation of DON.

2. Materials and Methods

2.1. Cell Culture and Treatment

The porcine small intestinal epithelial cell line (IPEC-J2), was purchased from the American Type Culture Collection (ATCC), cultured in Dulbecco’s modified Eagle medium (DMEM, Invitrogen Corporation, Carlsbad, CA, USA) with 10% (v/v) fetal bovine serum (FBS, bio-channel, Nanjing, China) and 1% penicillin-streptomycin (solarbio, Beijing, China). All cells were placed in a 37 °C incubator with 5% CO2. As our previous study demonstrated, IPEC-J2 cells were treated with 1 μg/mL DON (C15H20O6; Sigma-Aldrich, St. Louis, MO, USA) for 48 h and a concentration of dimethyl sulfoxide (DMSO) <0.1% [12].

2.2. Cell Viability

To determine whether the cell growth was affected by DON, the cell viability assay was conducted using a Cell Counting Kit-8 (Yeasen Biotechnology (Shanghai) Co., Ltd., Shanghai, China) according to the protocols provided from the manufacturer. Briefly, IPEC-J2 cells (4000 cells/well) were put into 96-well culture plates. After cell confluence of approximately 50%, DON was added to the medium at a final concentration of 1 μg/mL. The cells were incubated with no FBS medium containing 10% reagent for 2 h at 37 °C. The absorbance was monitored using the Tecan Infinite 200 microplate reader (Sunrise, Tecan, Switzerland) at a wavelength of 450 nm. All experiments were performed in triplicate.

2.3. Immunofluorescence

The IPEC-J2 cells were seeded on the glass slide in a 12-well plate and exposed with 1 μg/mL DON for 48 h or not. The cells were fixed with 4% paraformaldehyde for 30 min, then permeabilized with 0.5% Triton X-100 for 15 min and blocked with 5% BSA for 2 h at 37 °C incubator. Afterwards, anti-alpha-tubulin (ab7291, Abcam, Cambridge, UK) was incubated with cells overnight at 4 °C, followed by the cells being washed in PBST thrice and stained with secondary antibodies for 1h at 37 °C incubator. DAPI (Invitrogen) was used to counterstain the nucleus. The cells were photographed with an inverted microscope (Olympus, Japan).

2.4. RNA Extraction and Real Time Polymerase Chain Reaction (RT-PCR)

Total RNA was extracted from cells after treatment using RNAiso (Takara, Dalian, China) following the instructions from the manufacturer. Next, 1 μg RNA was reversely transcribed into complementary DNA (cDNA) using a cDNA synthesis kit (Vazyme Biotech Co., Ltd., Nanjing, China). Briefly, the reactions were performed in an ABI StepONEPlus Real-Time PCR System (Applied Biosystems, Foster City, CA, USA) with a 10 μL mixture system following the instructions. All the primers used are shown in Table S2. GAPDH and β-ACTIN were chosen for normalizing the other gene levels. 2−∆∆Ct method was used to calculate the relative gene expression [19].

2.5. Analysis Cell Cycle and Apoptosis using Flow Cytometry

Cell apoptosis was evaluated using Annexin V-fluorescein isothiocyanate (FITC)/propidium iodide (PI) kit (Solarbio, Beijing, China). IPEC-J2 cells were transfected with si-MLL1-NC or si-MLL1, si-TNFRSF1A-NC or si-TNFRSF1A, and then treated with 1 μg/mL DON for 48 h in a 6-well plate when the cell fusion reached 50%. There are several different groups including si-MLL1-NC + DON, si-MLL1 + DON, si-TNFRSF1A-NC and si-TNFRSF1A. After treatments, the samples were performed as described previously [20]. Cell apoptosis and cell cycle were detected using flow cytometry (Beckman Coulter, Brea, CA, USA), and then analyzed by CytExpert 2.3 and FlowJo 7.6. Each measurement was performed three times using a total of 10,000 events per sample.

2.6. Western Blot

After treatments, cells were collected and lysed with radioimmunoprecipitation assay (RIPA) buffer supplemented with protease inhibitor and phosphatase inhibitor on ice. Total protein was extracted and the concentration was measured by BCA protein assay kit (Beyotime Institute of Biotechnology, Jiangsu, China). The protein samples were diluted in 5X SDS-PAGE buffer and denatured by heating at 95 °C for 10 min. Each lane was loaded equal mass sample (20 μg). Samples were separated by 12.5% sodium dodecyl sulfate polyacrylamide gel electrophoresis, then transferred to polyvinylidene difluoride (PVDF) membranes (Immobilon, Darmstadt, Germany). Next, the membranes were blocked for 2 h at room temperature with TBST buffer containing 5% skim milk, followed by being incubated overnight at 4 °C with specific primary antibodies and then incubated for 1 h at RT with secondary antibodies (goat anti-mouse IgG HRP, goat anti-rabbit IgG HRP; CWBIO, Beijing, China). Finally, the membrane was detected by ECL and the relative intensities were analyzed by ImageJ software.
Anti-H3K4me3 (ab8580), anti-p38 (ab170099), anti-phopsho-p38 (ab178867), anti-JNK (ab1779461), anti-phospho-JNK (ab124956) were purchased from Abcam Ltd. (Cambridge, UK). Anti-MLL1 antibody (sc-374392) was obtained from Santa Cruz Ltd. (Santa Cruz, CA, USA). Anti-ERK 1/2 (4695S) and anti-phospho-ERK 1/2 (4370S) were purchased from Cell signaling Technology Ltd. (Danvers, MA, USA). Anti-BAX (ER0907), anti-caspase 3 (ER30804), and anti-cleaved-caspase 3 (ET1608-64) were purchased form Hangzhou HuaAn Biotechnology (Hangzhou, China). Anti-HSP90 (60318-1-lg) was obtained from Proteintech Ltd. (Wuhan, China).

2.7. Small Interfering RNA (siRNA) Transfection

Three pig MLL1 and TNFRSF1A siRNAs and a negative control siRNA sequence were synthesized from GenenPharma (Suzhou, China). The siRNA MLL1 sequences were listed in Table S1, and the siRNAs of TNFRSF1A sequences are listed in Table S1, of which si-MLL1-3 and si-TNFRSF1A-3 were efficient and used in the study for analysis. Cells (1 × 10⁶ cells/well) were seeded in 6- or 12-well plates, then the transfection was performed using jet PRIME (PolyPlus, France) according to the manufacturer’s instructions when the cells had reached approximately 60–70% confluence. After transfection, the medium was changed for 24 h, and cells were harvested for another 24 h.

2.8. Reactive Oxygen Species Assessment

Reactive oxygen species (ROS) levels were determined with 2′,7′-dichlorofluorescein diacetate (DCFH-DA) probe using a reactive oxygen species assay kit (Solarbio, Beijing, China). After treatments, cells were washed twice in cooled-PBS, then incubated with serum-free DMEM containing DCFH-DA (10 μM) for 30 min at 37 °C incubator. Following, fluorescence signals of DCF were measured at 488 nm excitation and 525 nm emission using the confocal microscope (Leica, Heidelberg, Germany) within 1 h.

2.9. RNA-Sequencing and Library Construction

Total RNA of samples transfected with si-MLL1 and si-MLL1-NC was isolated using RNAiso (Takara, Dalian, China) for RNA-seq library construction. The quality of RNA was inspected with a 1% agarose gel, and the RNA integrity and concentration were monitored using a Qubit RNA Assay Kit at the Qubit® 2.0 Fluorometer (Life Technologies, Camarillo, CA, USA) and a NanoDrop spectrophotometer (IMPLEN, Westlake Village, CA, USA), respectively. Afterwards, the NEBNext@ UltraTM II Directional RNA Library Prep Kit (New England Biolabs (NEB), Beijing, China) was conducted to prepare the RNA-seq library of each sample following the provided guidelines, and the libraries were sequenced on Illumina HiSeq2000 platform. The quality control of sequences raw data was filtered to discard low-quality reads using fastQC, the clean reads were aligned to the pig reference genome (Ensembl, Sscrofa11.1) using Bowtie2, the read counts mapped to each gene were calculated using HTSeq program, the FPKM (fragments per kilobase of transcript sequence per million of mapped fragments) was determined using Gfold, the differentially expressed genes (DEGs) between the samples were verified with DESeq2, and the threshold p-values < 0.05 and |log2 (fold change)| > 0 were considered to be statistically significant [21,22,23,24]. GO (Gene Ontology) functional annotation of DEGs was conducted with GOseq, which divided biological function of DEGs into three aspects including cellular component, molecular function, and biological process. KOBAS software was employed to check the enrichment of DEGs in the KEGG (Kyoto Encyclopedia of Genes and Genomes) pathways. The GO terms and KEGG pathways analysis were performed using a correction with cutoff of 0.05.

2.10. Determination of Porcine TNFRSF1A Core Promotor Region with Reporter Assay

The 2kb upstream sequence of pig TNFRSF1A gene was derived from UCSC database, and then the core promotor region was predicted using the online website of Berkeley Drosophila Genome Project (BDGP) and Promotor 2.0. According to the predicted loci, the sequence was cut into four different lengths (-500-(-1) bp, -750-(-1) bp, -1010-(-1) bp and -1610-(-1) bp) to amplify corresponding products. The primers are listed in Table S3. The pGL3-basic vector was digested with XhoI and HindⅢ for 3 h, and then the four amplification fragments of the promotor were ligated in vector for 15 min at 50 ℃ using a ClonExpress Ultra One Step Cloning Kit (Vazyme biotech Co., Ltd., Nanjing, China). Next, the ligations were transformed into TreliefTM Chemically competent cells (TSINGKE, Nanjing, China) and then cultured on a solid LB-medium containing ampicillin at 37 °C overnight. Monoclonal colonies were taken and replicated in the liquid LB-medium, consequently, plasmids were extracted, and sequenced by company (Songon, Shanghai, China).
HEK293T cells were co-transfected into 500 ng Renilla plasmid and four recombinant plasmids and an empty vector as negative control, and afterwards cultured for 48 h at 37 °C incubator. The Substrate fluorescence intensity was detected on a Tecan Infinite 200 microplate reader (Tecan, Switzerland) using a Dual Luciferase Reporter Assay Kit (Vazyme biotech Co., Ltd., Nanjing, China). The promotor activities were calculated by the ratio Firefly Luciferase/Renilla Luciferase.

2.11. Chromatin Immunoprecipitation (ChIP) Assay

IPEC-J2 cells treated with 1 μg/mL DON (60% density) or not were digested (1 × 10⁷) and washed twice with chilled PBS. The cell precipitation was resuspended with medium and cells and were cross-linked with 1% formaldehyde for 10 min on a shaker at room temperature, then crosslinking was ended with 50 mM glycine for 5 min [25]. The chromatin fragments of 200–700 bp were obtained through lysing cell by lysed buffer (5 mM PIPES, pH 8.0, 85 mM KCl, 1% Nonidet P-40, 1 × protease inhibitor cocktail) and sonicated by Bioruptor (Covaris) for 21 min below 7 °C. ChIP-grade antibodies (anti-tri-methyl-histone H3 (Lys 4), ab8580, Abcam) and rabbit immunoglobulin G (IgG) were incubated with 400 μL TBST containing 50 μL Protein A/G Magnetic Beads (MedChemExpress, Monmouth Junction, NJ, USA) for 4 h on a rotator at 4 °C, and then the chromatin and the beads connected antibody were co-incubated overnight with rotation at 4 °C. Next, the ChIP DNA was de-crosslinked by Protease K digested at 65 °C overnight and enriched and purified using a FastPure Gel DNA Extraction Mini Kit (Vazyme biotech Co., Ltd., Nanjing, China). At last, purification of DNA was performed and detected via qPCR using TNFRSF1A primers listed in Table S3.

2.12. Statistical Analysis

The results were analyzed using Excel and GraphPad Prism version 8 (GraphPad Software, San Diego, CA, USA). The data were represented as means ± SD, Student’s t-test was applied to compare significance between two groups. p < 0.05 was regarded as statistically significant.

3. Results

3.1. The Toxic Impacts of DON Exposure on IPEC-J2 Cells

To examine the effect of DON on IPEC-J2 cells, we treated cells with a concentration of 1 µg/mL for 24 h and 48 h. The results indicated that 1 µg/mL DON significantly reduced the cell viability; specifically, the cell viability declined to about 50% at 48 h (p < 0.001) (Figure 1A). We further monitored the cell morphological changes of IPEC-J2 cells exposed to 1 μg/mL DON; the cells exhibited an irregular and shrinkage morphology (Figure 1B). Furthermore, apoptosis analysis found that the DON-treated group obviously increased the ratio of apoptosis compared with the control group (p < 0.001) (Figure 1C). qPCR assay revealed that the expression of antioxidative gene SOD was decreased (Figure 1D), the pro-apoptotic factors (caspase 3 and BAK) were elevated and antiapoptotic factor (Bcl-2) was reduced (Figure 1E). We also revealed that the expression of cytokines (IL-6, IL-8, IL-18 and TNF-α) and NF-κB were increased upon 1 μg/mL DON exposure (p < 0.001) (Figure 1F, G). These results suggest that DON causes toxicity in IPEC-J2 cells.

3.2. Elevation of H3K4me3 and MLL1 Expression Induced by DON

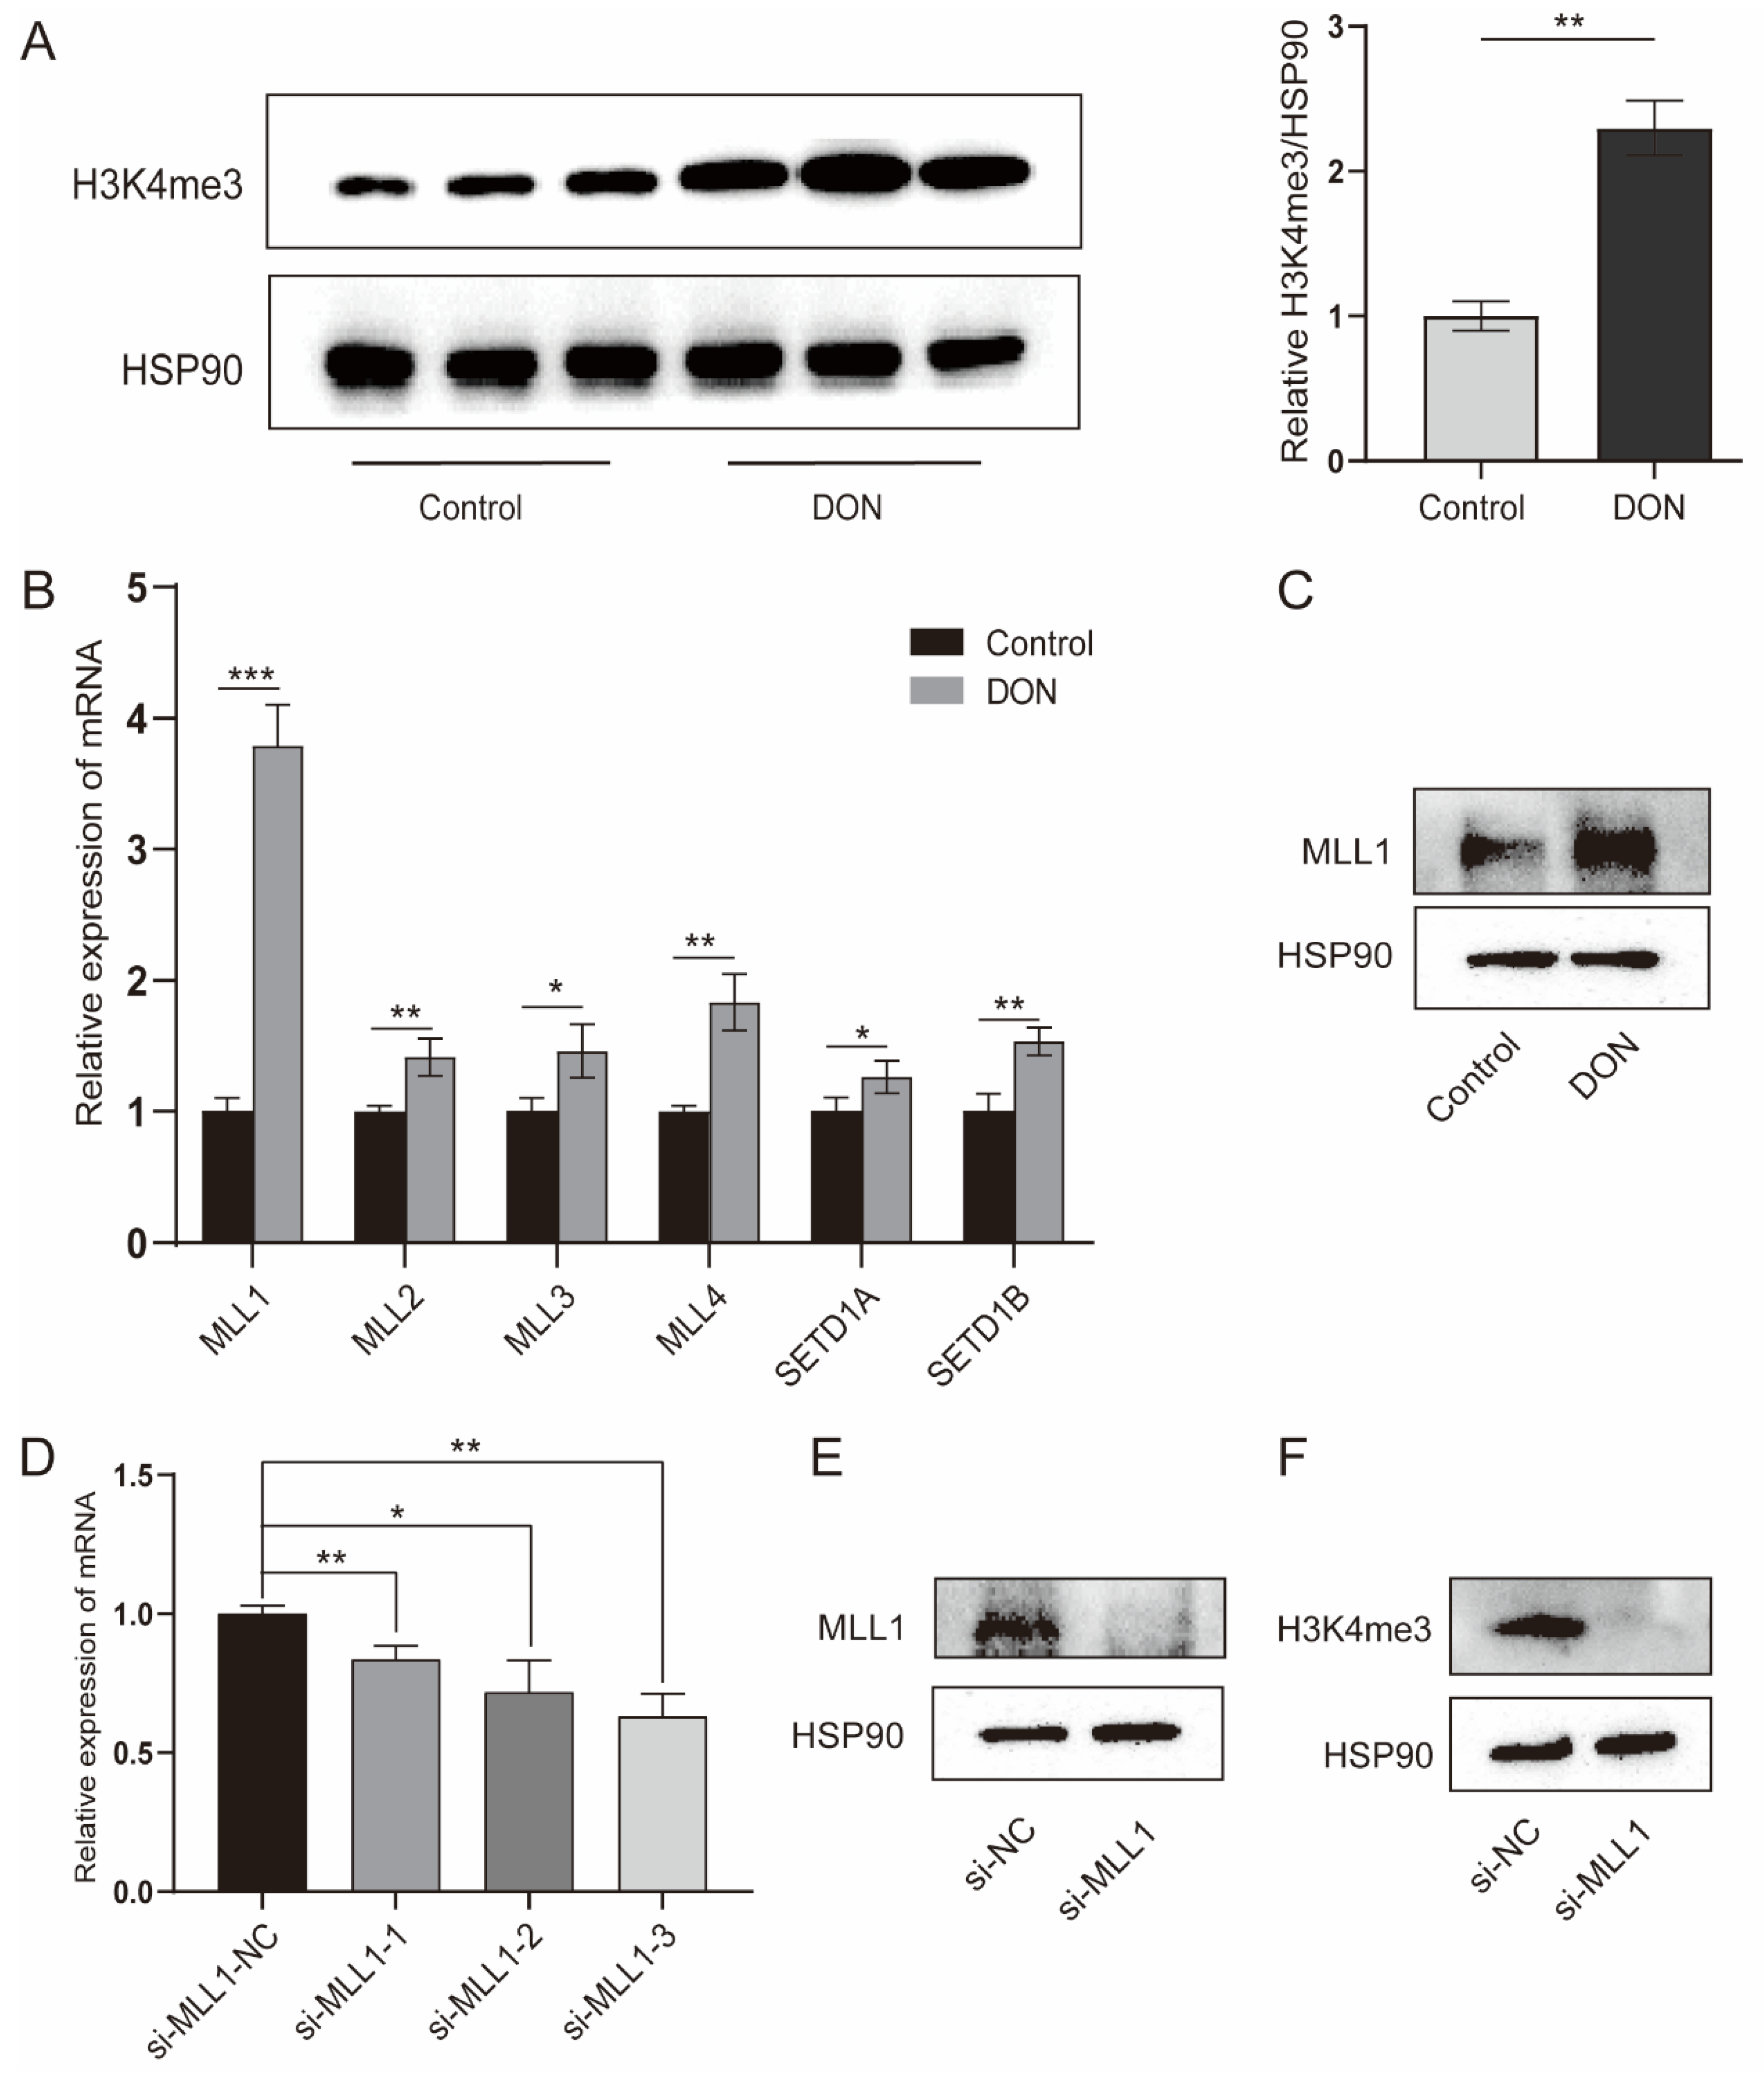
The H3K4me3 modification was significantly enriched by 1 μg/mL DON treatment (p < 0.01) (Figure 2A). H3K4me3 is a dynamic process that is regulated by histone methyltransferases and demethylases. We further investigated a variety of genes that participate in the H3K4me3, the methyltransferase genes (MLL1, MLL2, MLL3, MLL4, MLL5, SETD1A and SETD1B) were increased with 1 μg/mL DON treatment (Figure 2B); especially, MLL1 was markedly elevated. As shown in Figure 2C, we found that DON increased the MLL1 protein. The IPEC-J2 cells transfected with si-MLL1-3 possessed the highest knockdown efficiency (p < 0.01) (Figure 2D). The protein level of MLL1 was obviously reduced by treatment with si-MLL1 (Figure 2E), and H3K4me3 was also subsequently declined (Figure 2F). These above-mentioned results suggest that MLL1 may participate in the regulation of DON induced IPEC-J2 cells.

3.3. MLL1 Knockdown Resulted in Cell Cycle Arrest and Exacerbated the Oxidative Stress

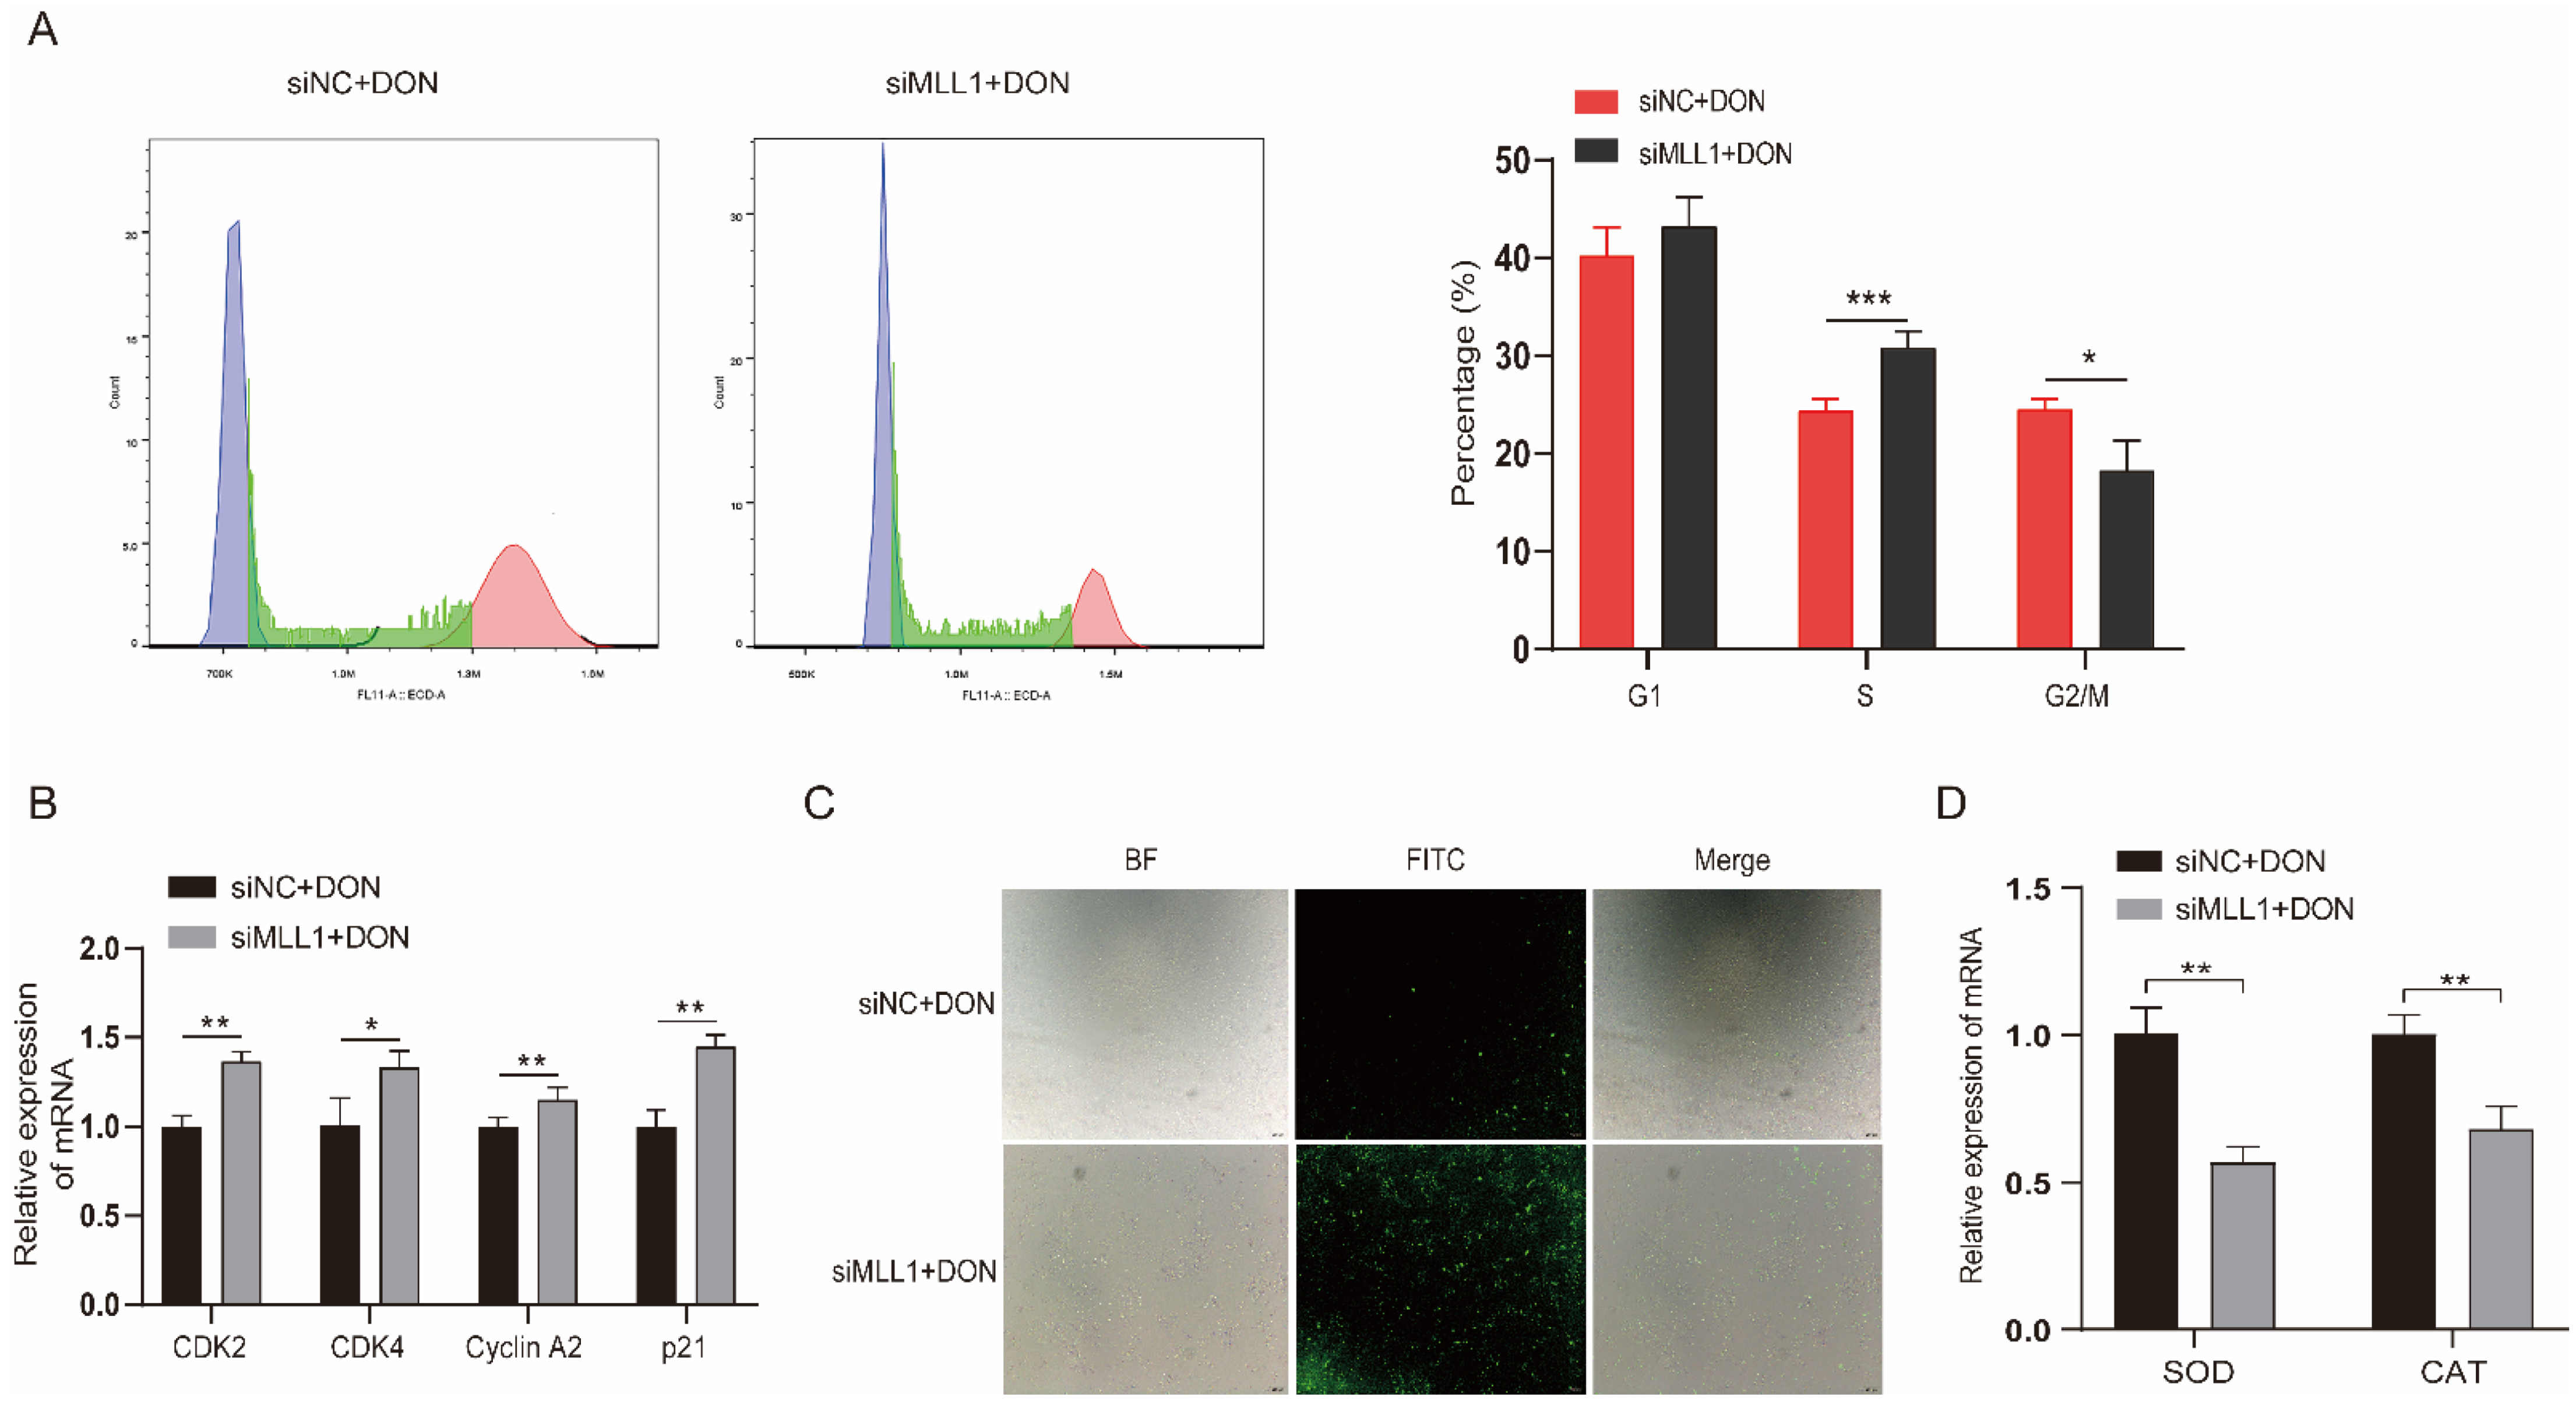
Ample reports suggest that DON can arrest the cell cycle and induce ROS in many cell lines [26,27]. The flow cytometry and fluorescent probe were exerted to investigate whether MLL1 participates in the cell cycle and ROS biological process and plays potential functions. The cell cycle assay showed that the rate of the S phase increased and G2/M phase declined after knockdown of MLL1 (Figure 3A). The mRNA expression levels of cell cycle related genes (CDK2, CDK4, Cyclin A2 and p21) were all upregulated (Figure 3B). The ROS levels were elevated after treatment with MLL1 siRNA (Figure 3C). Furthermore, the expression of antioxidative genes, SOD and CAT, decreased by si-MLL1 (Figure 3D). Taken together, the findings indicated that the knockdown of MLL1 caused cell cycle arrest at the S phase and intensified the ROS.

3.4. MLL1 Knockdown Aggravated Cell Apoptosis

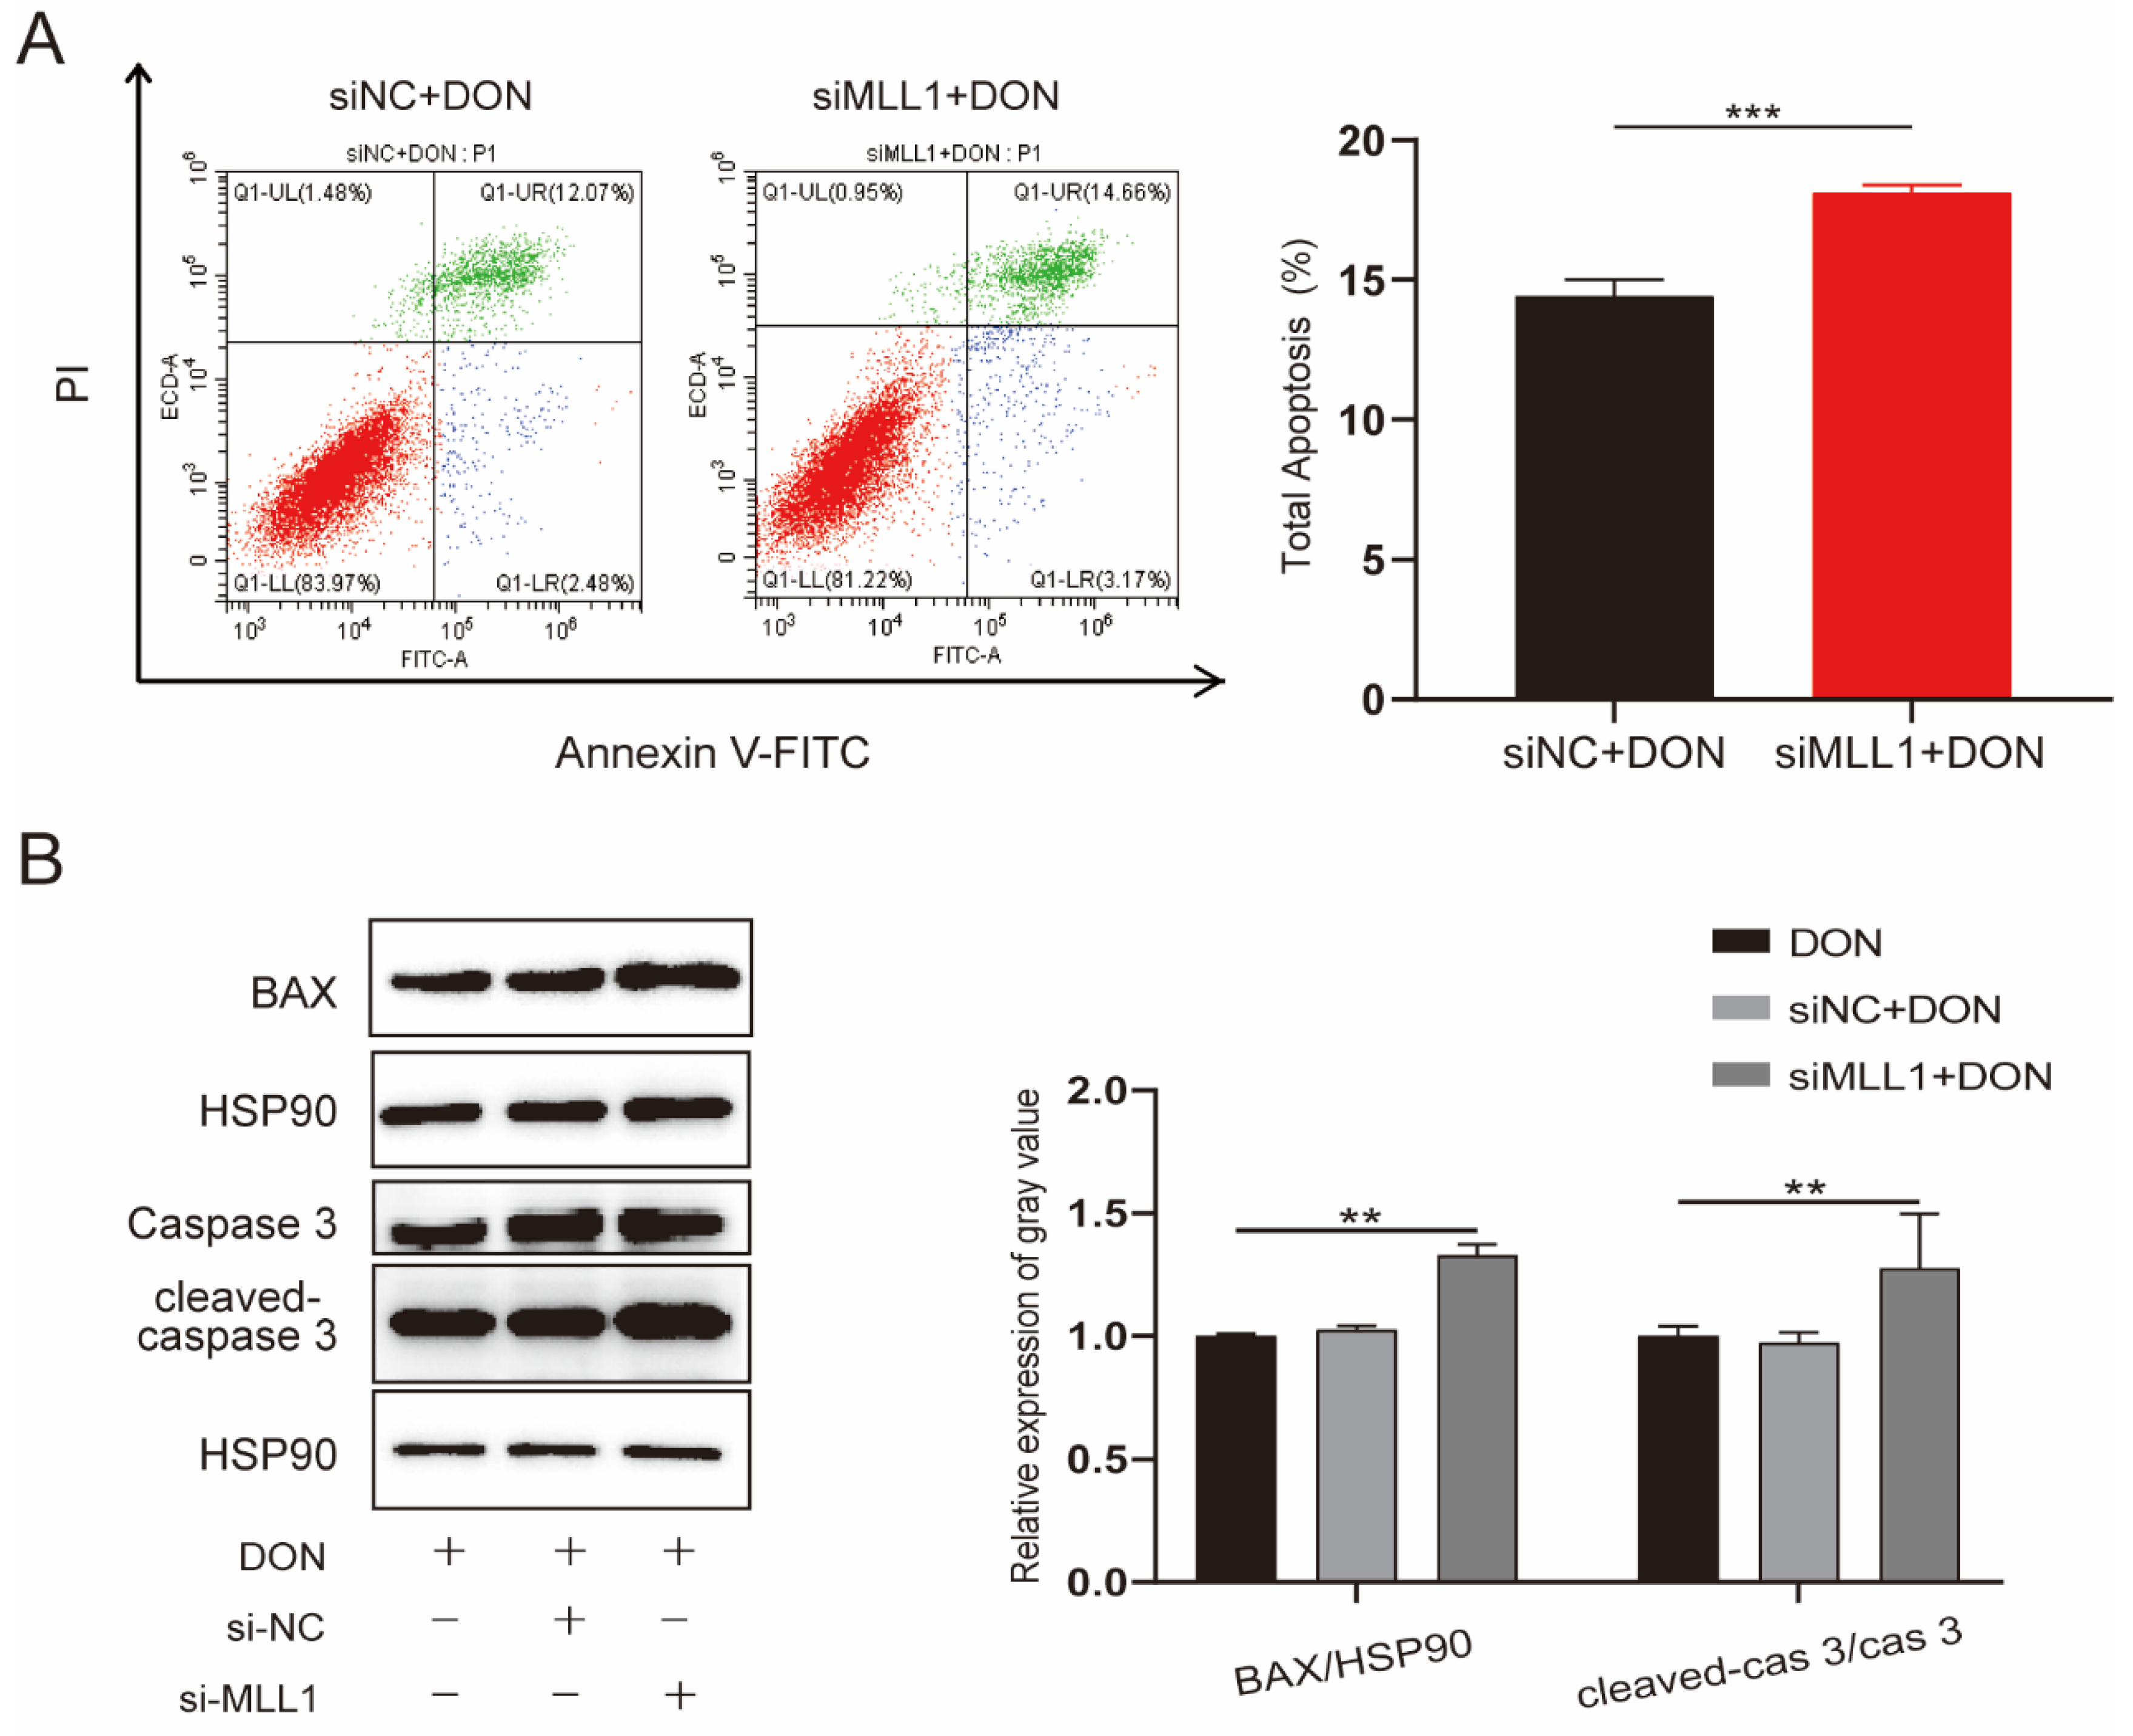
The increasing ROS level was closely associated with apoptosis and was proved by a variety of studies [28,29]. The IPEC-J2 cells were transfected with si-MLL1-NC and si-MLL1 to further test the influence of MLL1 on apoptosis upon DON exposure. As shown in Figure 4A, the rate of apoptotic cells was elevated by MLL1 knockdown (p < 0.001). Furthermore, the proteins of cleaved-caspase 3/caspase 3 and Bax were upregulated (Figure 4B). Collectively, the results suggested that the loss of MLL1 indeed aggravated apoptosis induced by DON.

3.5. RNA-Sequencing Analysis between si-NC and si-MLL1 Transfected into IPEC-J2 Cells

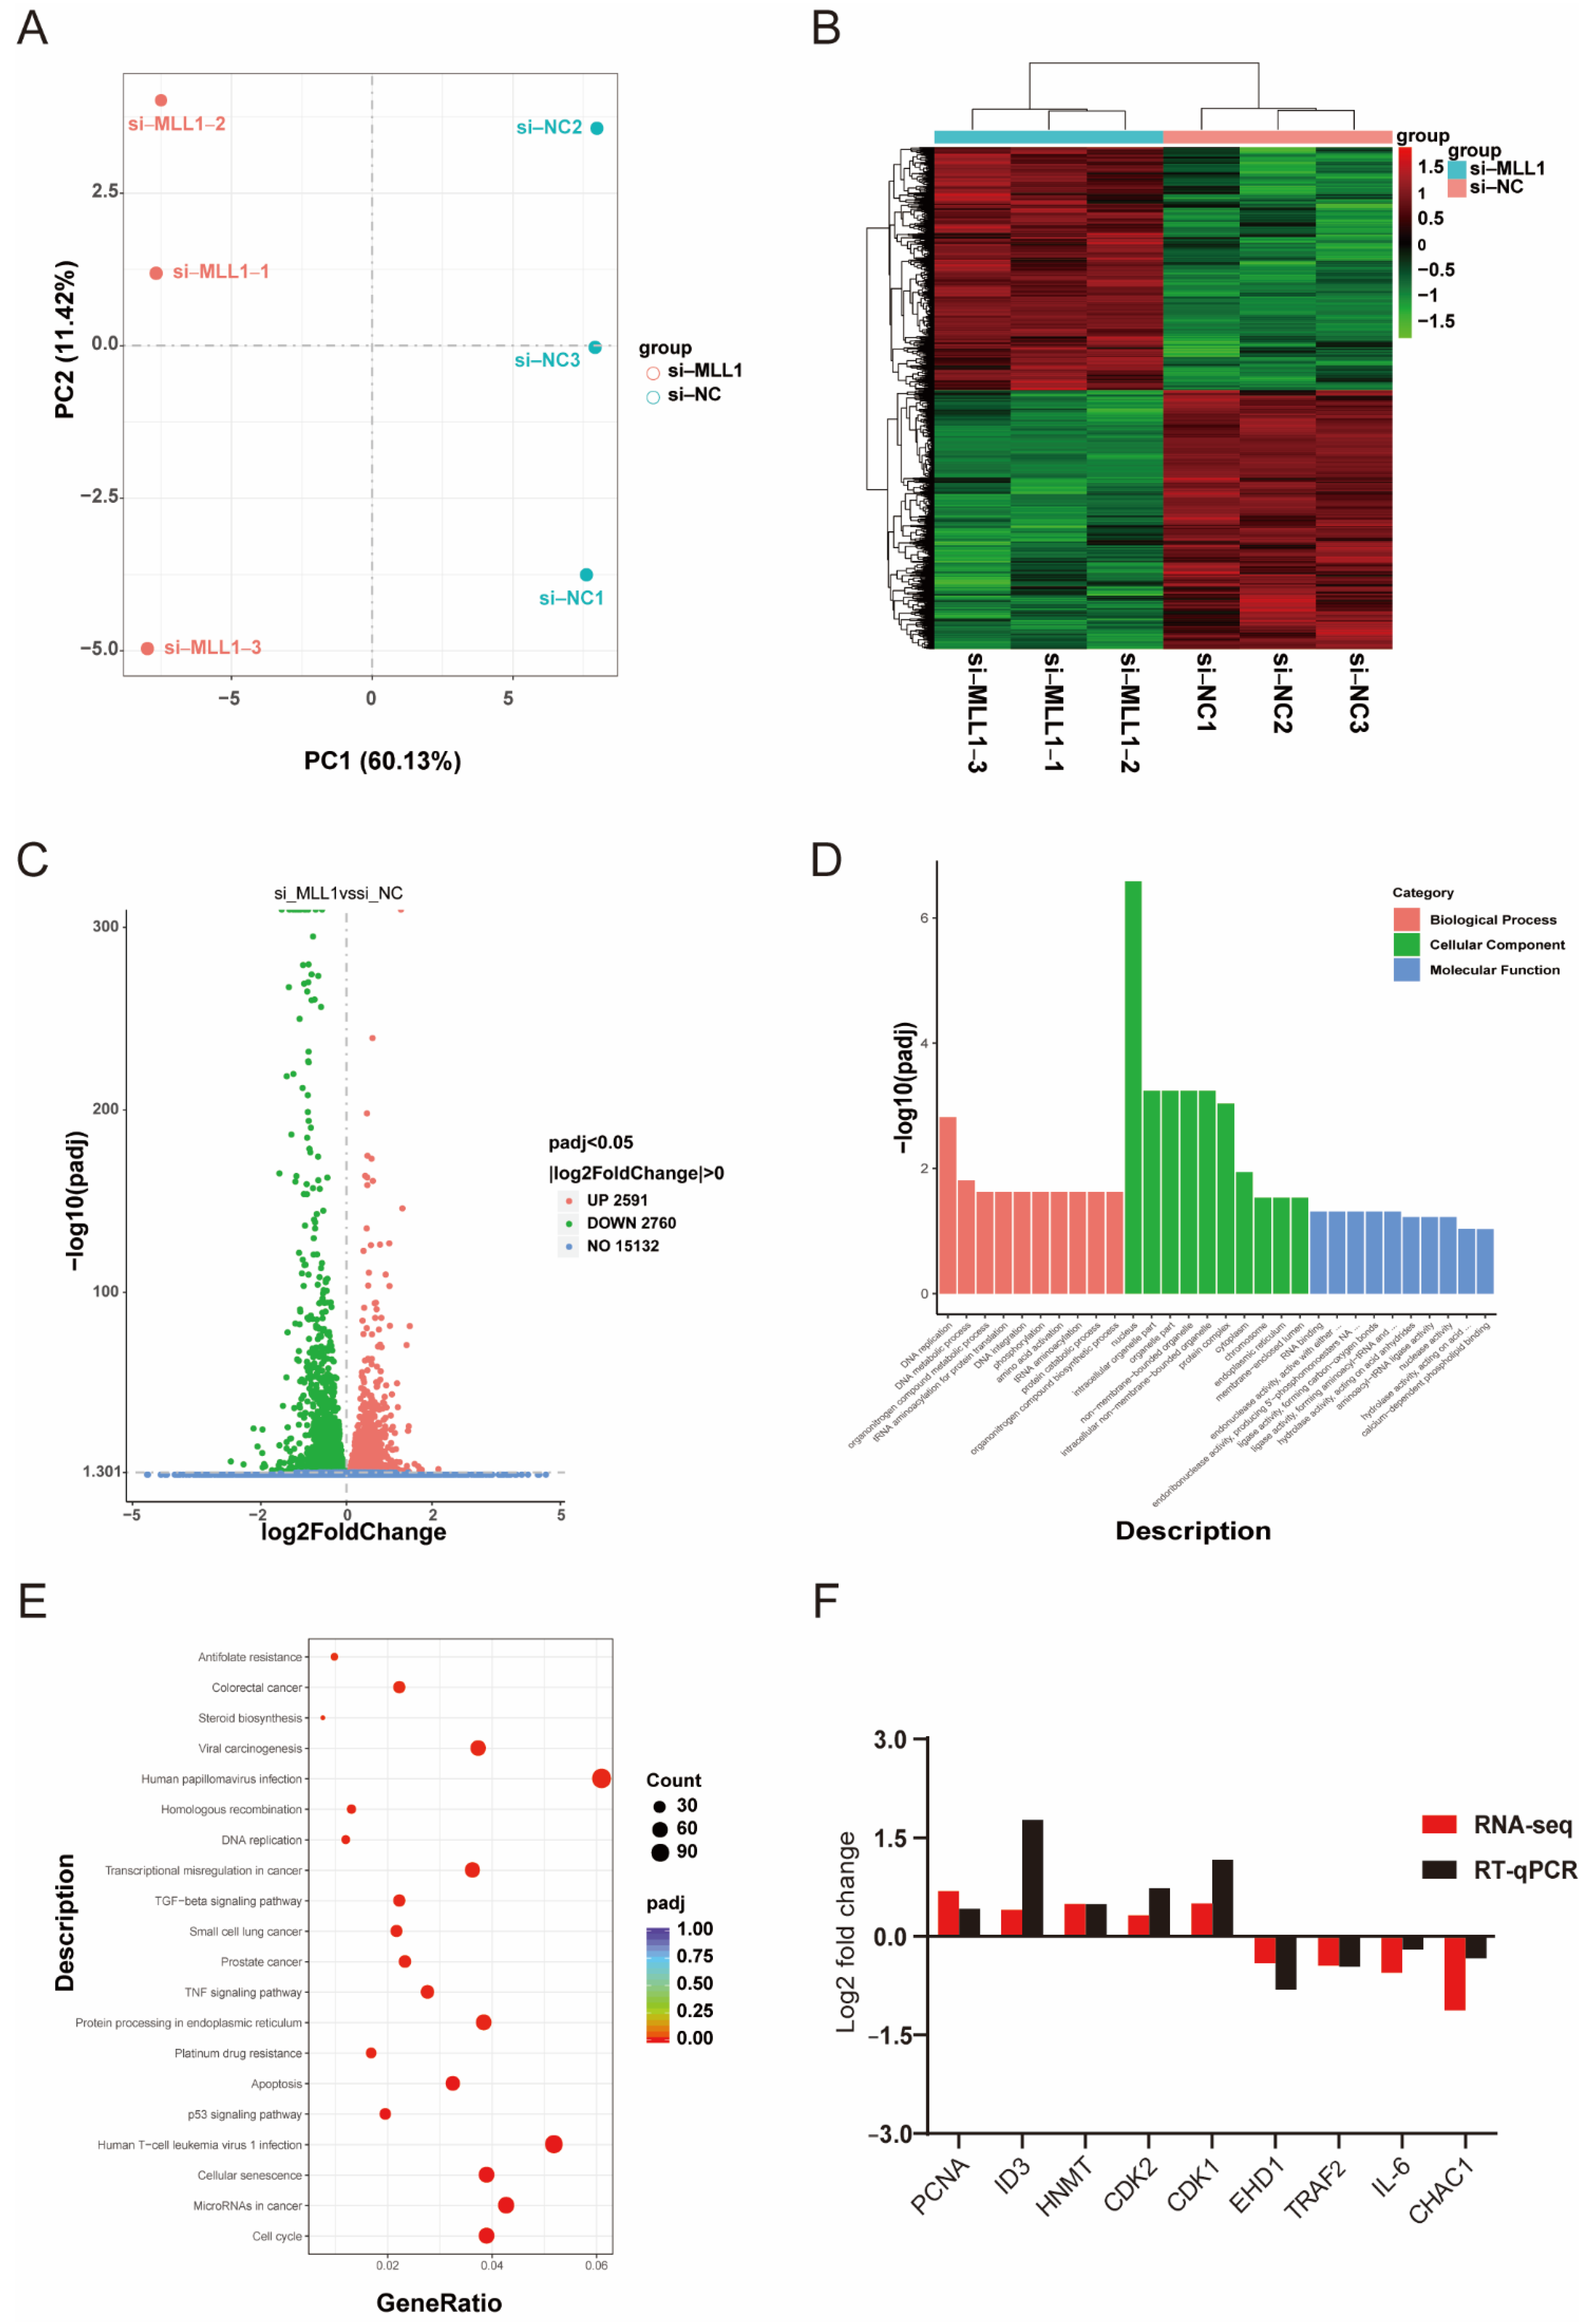
To identify and figure out the underlying mechanism induced by MLL1, we performed RNA sequencing. First, principal component analysis (PCA) indicated an obvious separation of the si-MLL1-NC group from si-MLL1 group (Figure 5A), and the heatmap analysis of sample-to-sample correlation also validated this (Figure 5B). Adjusted p < 0.05 and |log2 fold change| > 0 were utilized as criteria to filter differentially expressed genes. As shown in Figure 5C, there are 2591 and 2760 mRNAs upregulated and downregulated, respectively (Figure S1). As well, the differentially expressed genes between two groups were provided in Tables S4 and S5. Gene Ontology (GO) enrichment analysis was divided into three terms, including biological process, cellular component, and molecular function (Figure 5D and Figure S1C,D; Table S6). For all DEGs, Kyoto Encyclopedia of Genes and Genomes (KEGG) enrichment analysis indicated that MLL1 mediates the cell cycle, apoptosis and TNF signaling pathway (Figure 5E; Tables S7 and S8). To validate the reliability of RNA-sequencing analysis, nine genes were randomly selected and their expression levels were examined by qPCR; we then found the result is consistent with the expression changes detected by RNA-seq (Figure 5F).

3.6. Loss Function of MLL1 Exacerbated MAPKs Activation

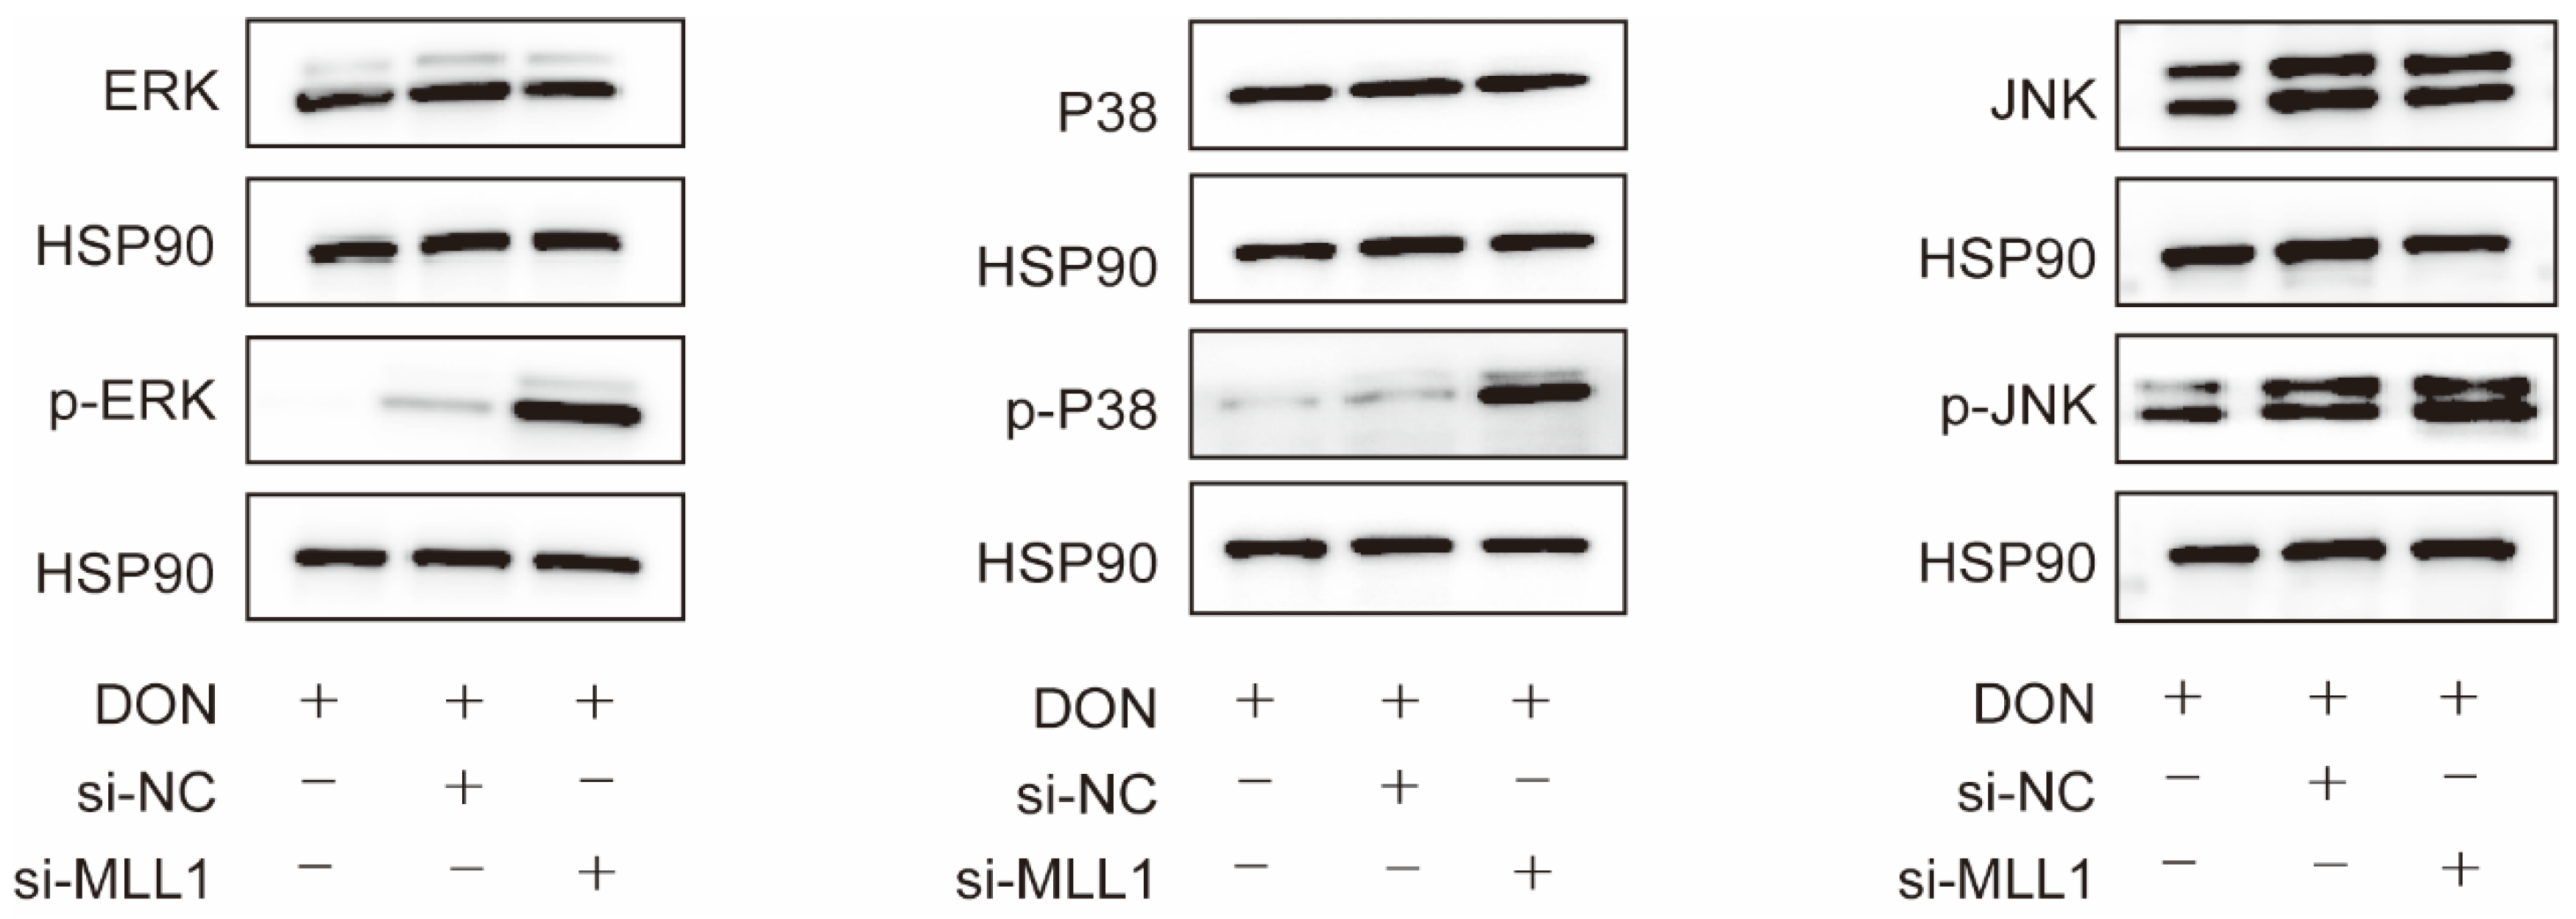
Accumulating reports have validated that ROS could trigger the MAPKs signaling pathway and lead to the secretion of pro-inflammatory cytokines which promotes inflammation response [30,31]. Western blot analysis represented that the phosphorylated protein levels of p38, ERK, and JNK markedly increased after the IPEC-J2 cells were transfected with si-MLL1 compared with si-MLL1-NC upon 1 μg/mL DON exposure (Figure 6).

3.7. Identification of TNFRSF1A Core Promoter Region and Function of TNFRSF1A

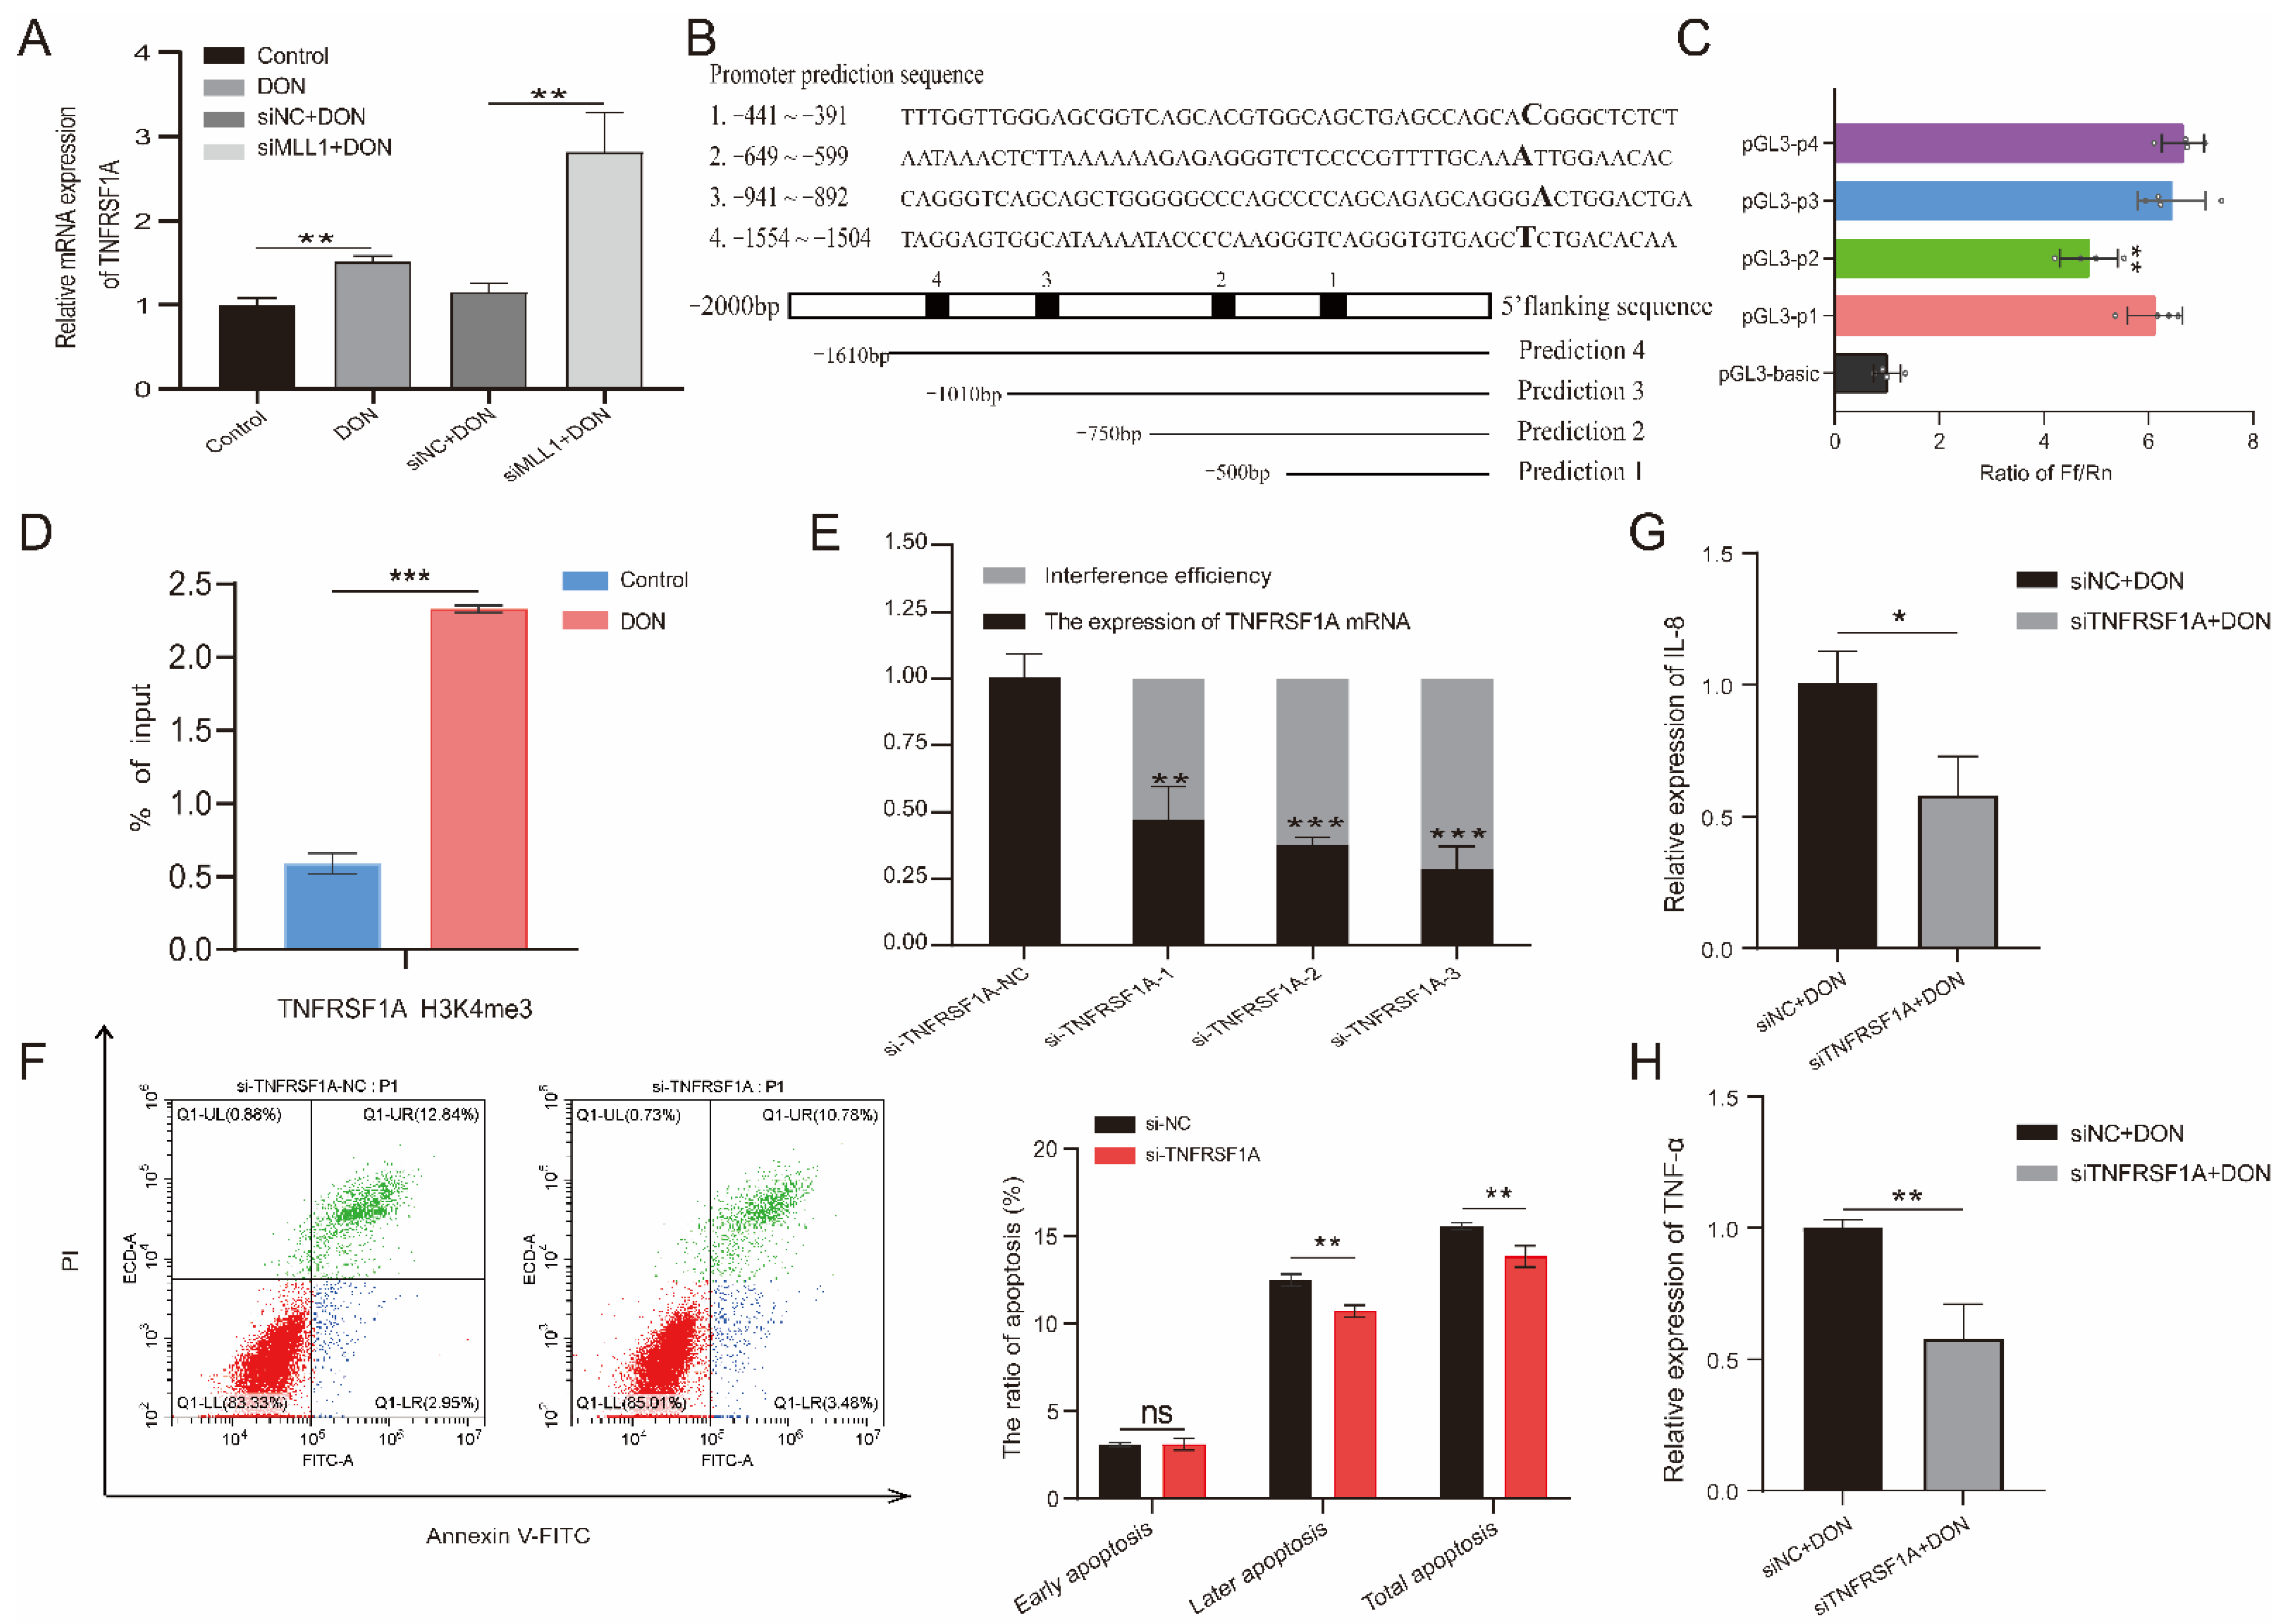
According to the RNA-seq, we found that TNFRSF1A may be the potential target of MLL1. Previous studies indicated that tumor necrosis factor receptor 1 (TNFR1), which is encoded by TNFRSF1A, is a hub to mediate the apoptosis and inflammation response pathway [32]. The qPCR that detected the relative mRNA expression of TNFRSF1A was elevated when induced by 1 μg/mL DON, and knockdown of MLL1 also obviously increased its expression (Figure 7A). According to the prediction of the TNFRSF1A core promoter region from the website, we amplified the truncated products and recombined it with the pGL3-basic vector to construct four insertional vectors (Figure 7B and Figure S2). Then we performed a dual-luciferase reporter and identified that the luciferase activity of pGL3-p1 was remarkedly higher than the pGL3-basic (p < 0.01) (Figure 7C), which suggested that the core promoter region of TNFRSF1A was located at −441~−391. Furthermore, we also examined that H3K4me3 modification was significantly enriched in the TNFRSF1A promoter region through a ChIP-qPCR (p < 0.001) (Figure 7D and Figure S3). Afterwards, we constructed a small interfering RNA of TNFRSF1A and validated the si-TNFRSF1A-3 possessing the best interference efficiency (Figure 7E). Silencing of TNFRSF1A resulted in the rate of later apoptosis being increased when a flow cytometry assay was used (Figure 7F). Moreover, knockdown of TNFRSF1A led to the relative expression of TNF-α and IL-8 being declined upon 1 μg/mL DON exposure (Figure 7G,H).

4. Discussion

DON is one of the most prevalent environmental toxins that is produced by fungi, which attracts cytotoxicity and causes immune system dysregulation and is severely harmful to animals and human health [33]. Furthermore, recently accumulating studies uncovered that mycotoxins could elicit different types of cancer [34]. In 2016, the International Agency for Research on Cancer (IARC) and World Health Organization (WHO) urged for action to be taken against widespread mycotoxin contamination in developing countries. DON is regarded by the IARC as a Group 3 carcinogen that is suspected of carcinogenicity in humans and there are no adequate human and animal data. Increasing studies explored the effects of DON exposure to the body; however, the potential regulatory mechanism remains to be clarified.
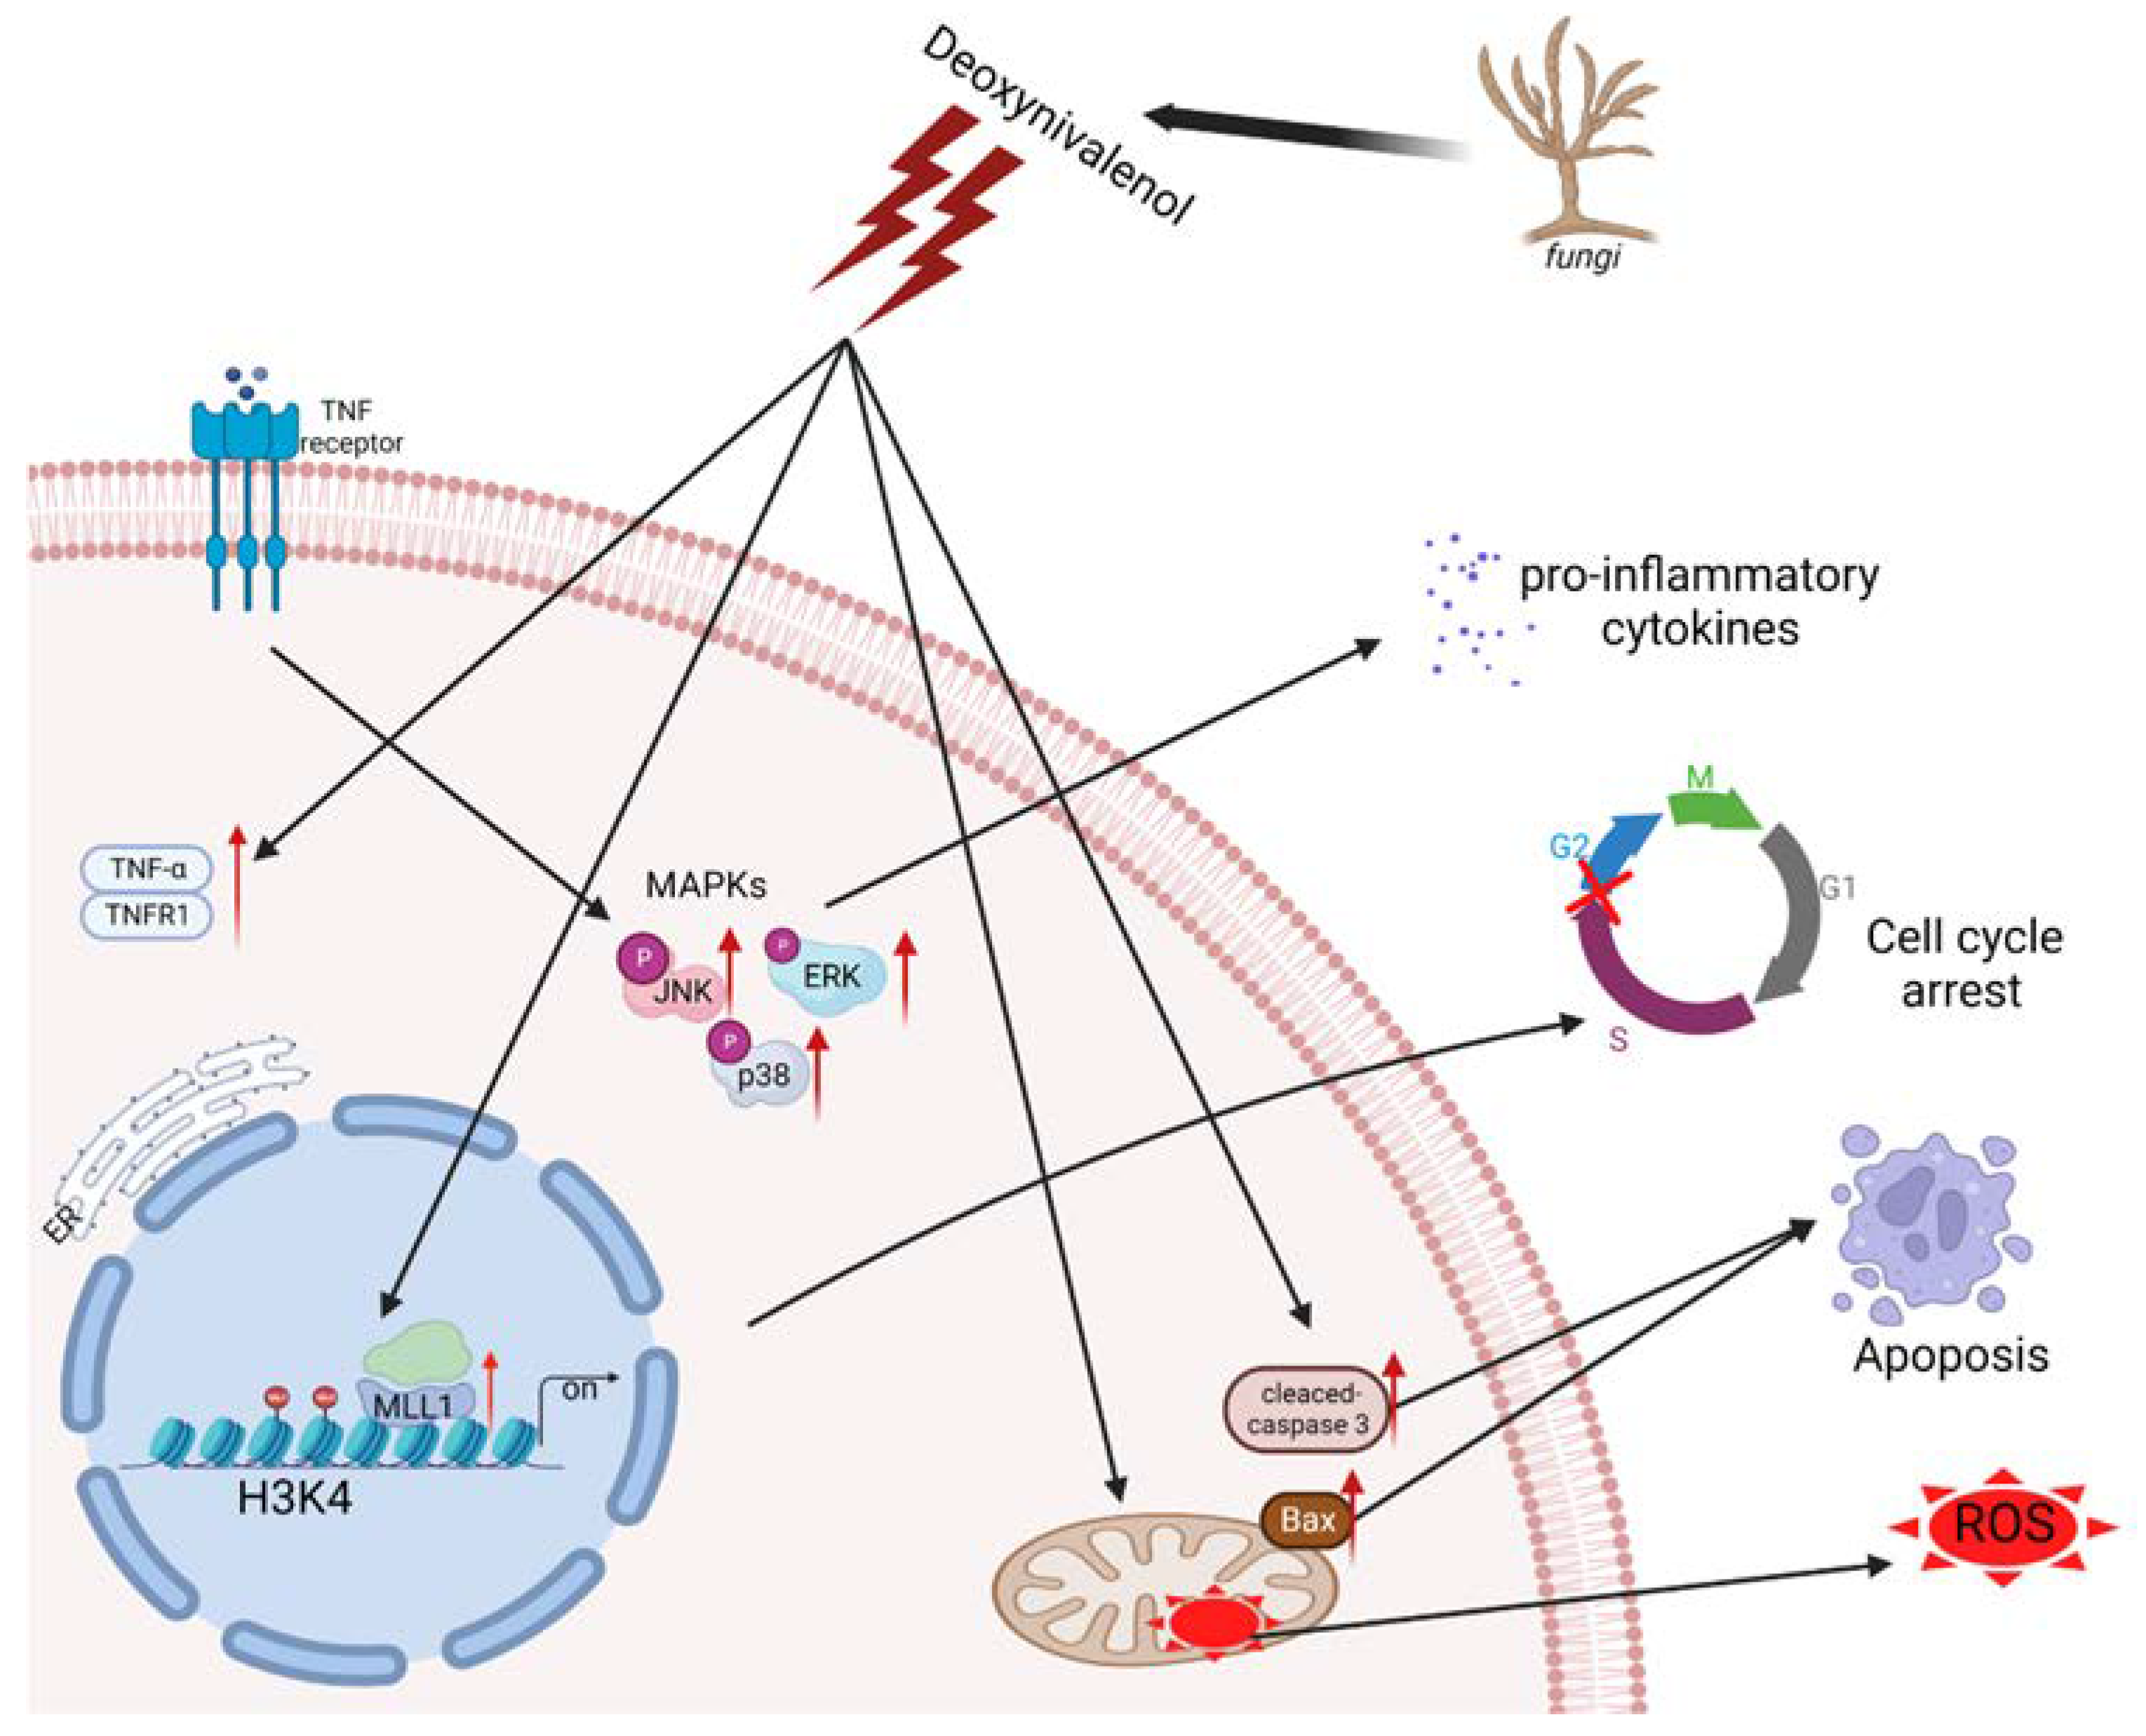
Recently, epigenetic modification was reported to be related to the regulation of intracellular oxidative stress response caused by mycotoxin. The protein post-translational modifications have drawn much attention to their ability to regulate gene expression and impact chromatin structure while not directly affecting the sequence of genes [35]. Czakai et al. found that histone acetyltransferases participating in Ochratoxin A (OTA) led to toxicity and carcinogenicity [36]. They reported that OTA caused core histones to be phosphorylated and acetylated, after which the mitotic chromosomes were condensed and the sister chromatid was separated. The histone modification alterations, including the levels of H4K20me3 and H3K9me3 that increased and levels of H4K20me2 and H3K27me3 that decreased, were monitored in the mouse oocytes upon Aflatoxin B1 (AFB1) exposure [37]. In this study, we proved that after IPEC-J2 cells’ exposure to 1 μg/mL DON, H3K4me3 modification was enriched and the gene expression of histone methyltransferases were elevated; in particular, the levels of MLL1 mRNA expression were dramatically increased. The results suggest that MLL1 may take part in the regulation of DON-induced cytotoxicity. Consistent with the previous study conducted by Ansari et al., they cultured human H358 cells and treated them with different concentrations of DON (up to 33 µM) for 7.5 h, then observed that the levels of MLL1 and Set1 mRNA induced a two- to five-fold upregulation in a concentration-dependent manner, and the protein level of MLL1 was also obviously increased (8.3-fold) [38]. Moreover, they reported that the transcription factor Sp1 plays a crucial role in the regulation of MLL1 under stress. As shown in Figure 8, we found that MLL1 plays a crucial role during DON exposure to IPEC-J2 cells. Previous investigations indicated that MLL1 could promote cell proliferation, self-renewal and skeletal muscle regeneration, and also participate in the biological process, including hematopoiesis and development [39,40]. MLL1 attracted people’s attention in the study of mixed lineage leukemia. However, the study of its own function in other fields was limited. Besides, MLL1 was regarded as one of the histone methyltransferases and specifically regulated the methylation on histone 3 lysine 4 [41]. In the present study, a small interfering RNA was further exerted to explore the function of MLL1. The silencing of MLL1 resulted in an attenuation of MLL1 mRNA and MLL1 protein, and H3K4me3 modification also decreased. Furthermore, cell cycle was arrested after the loss of MLL1. A previous study indicated that the knockdown of MLL1 induced cell cycle arrest at G2/M phase in HeLa cells [42]. Histone methylation modification could regulate gene expression through changing the state and structure of chromatin [43]. In the myogenesis process, Myf5 is considered an important transcription factor. The si-MLL1 decreased H3K4me3 modification. Therefore, MLL1 probably directly regulates Myf5 and affects the expression of Cyclin D1, resulting in cell cycle arrests in the G1/S phase [44]. Herein, we also illustrated that the loss function of MLL1 increased cell apoptosis and ROS levels. A knockdown of MLL1 declined the expression of p16 INK4A and induced cellular senescence after cells were treated with ambient air particulate PM with a diameter < 2.5 (PM2.5) [45]. Besides, N-acetylcysteine (NAC), known as an antioxidant, attenuated the ROS increase upon PM2.5 exposure in NHEK and HaCaT cells. The cells were pretreated with NAC followed by PM2.5 treatment; the ROS levels and epigenetic enzymes’ (DNMT, DNMT3B, TET1, EZH2 and MLL1) expression levels returned to normal. In this study, we demonstrated that si-MLL1 aggravated the apoptosis rate and increased the expression of cleaved-caspase 3 and Bax upon IPEC-J2 cell exposure to 1 μg/mL DON.
We performed an RNA-sequencing profile between si-MLL1 and negative control groups to investigate the function of MLL1. Adjusted p < 0.05 and |log2 fold change| > 0 were used as criteria to screen differentially expressed genes. As shown in Figure 5C, 2591 mRNAs were upregulated and 2760 mRNAs were downregulated. The KEGG enrichment analysis proved that MLL1 participates in the cell cycle, apoptosis, TNF signaling pathway, and so on.
The MAPKs include three subfamilies, ERK 1/2, p38 and JNK; its phosphorylated proteins performed the function of regulating inflammation, cell growth, development, and apoptosis [46,47]. The p38/MAPK and ERK 1/2/MAPK are correlated with the inflammation response via mediated proinflammatory cytokines secretion, such as interleukin families and TNF-α [48]. Our study revealed that the silencing of MLL1 significantly elevated the phosphorylated levels of ERK, p38, and JNK after IPEC-J2 cells were induced by 1 μg/mL DON. These results suggested that oxidative stress probably regulates the MAPKs (ERK, p38 and JNK) signaling pathway to trigger cell apoptosis and cell cycle arrest.
According to our RNA-seq, TNFRSF1A may be the target to regulate the cytotoxicity and genotoxicity induced by DON. TNFRSF1A is regarded as a transmembrane receptor for TNF-α, and TNFRSF1A encodes a protein called TNFR1 which can assist TNF-α to signal into cells [49]. TNFR1 possesses a death domain and is involved in a variety of cellular processes, such as cell apoptosis [50]. Consistent with the previous study, the expression of TNF-α and TNFRSF1A mRNA was significantly increased when cells upon oxidative stress. In addition, the modification of H3K4me3 was increased in the promoter region of TNFRSF1A after IPEC-J2 cells were treated with 1 μg/mL DON. Besides, the silencing of MLL1 induced an elevation of the mRNA expression of TNFRSF1A. Nevertheless, we discovered that a knockdown of TNFRSF1A attenuated apoptosis and inhibited the expression of IL-8 and TNF-α mRNA. These evidences suggested that the blocking of TNFR1 attenuated the inflammatory response induced by DON through the TNF-α signaling pathway.

5. Conclusions

In summary, we confirmed that a histone methyltransferase MLL1 and modification of H3K4me3 significantly increased upon DON exposure, and the knockdown of MLL1 could aggravate ROS levels, cell apoptosis, induce cell cycle arrest and activate the MAPKs pathway. Moreover, we also performed an RNA-seq profile to identify the MLL1 potential target gene. We provide new insight that MLL1 probably mediates the H3K4me3 modification of the TNFRSF1A promoter region to regulate gene expression and take part in DON-induced cytotoxicity.

Supplementary Materials

The following supporting information can be downloaded at: https://www.mdpi.com/article/10.3390/antiox11102006/s1, Figure S1: Differentially expressed genes and its function enrichment analysis between si-MLL1-NC and si-MLL1; Figure S2: Construct the TNFRSF1A gene promoter region truncated vector; Figure S3: Evaluation of the condition of Chromatin sonication by agarose gel electrophoresis; Table S1: The siRNA sequences of MLL1 and TNFRSF1A; Table S2: The primers of RT-qPCR; Table S3: Amplification primers of different fragments of pig TNFRSF1A gene promotor region & The primers of ChIP-qPCR; Table S4: Differentially Expression Genes of up-regulation (si-MLL1 vs. si-MLL1-NC); Table S5: Differentially Expression Genes of down-regulation (si-MLL1 vs. si-MLL1-NC); Table S6: GO enrichment analysis of DEGs; Table S7: KEGG enrichment analysis of up-regulated DEGs, Table S8: KEGG enrichment analysis of down-regulated DEGs.

Author Contributions

Conceptualization, W.B. and Z.W.; methodology, D.S.; software, Z.W.; validation, D.S. and Y.S.; formal analysis, X.Z.; investigation, D.S.; resources, D.S.; data curation, D.S.; writing—original draft preparation, D.S.; writing-review and editing, Z.W. and H.W.; visualization, D.S.; supervision, W.B.; project administration, W.B.; funding acquisition, S.W. and W.B. All authors have read and agreed to the published version of the manuscript.

Funding

This study was financially supported by Seed Industry Vitalization Research Projects of Jiangsu Province (JBGS [2021]098, JBGS [2021]024), Key Research and Development Project (Modern Agriculture) of Jiangsu Province (BE2019341), and Priority Academic Program Development of Jiangsu Higher Education Institution.

Institutional Review Board Statement

Not applicable.

Informed Consent Statement

Not applicable.

Data Availability Statement

The data presented in this study are available on request from the corresponding author.

Conflicts of Interest

The authors declare no conflict of interest. The funders had no role in the design of the study; in the collection, analyses, or interpretation of data; in the writing of the manuscript or in the decision to publish the results.

References

  1. Liao, Y.; Peng, Z.; Chen, L.; Nussler, A.K.; Liu, L.; Yang, W. Deoxynivalenol, gut microbiota and immunotoxicity: A potential approach? Food Chem. Toxicol. 2018, 112, 342–354. [Google Scholar] [CrossRef]
  2. Lauren, D.R.; Smith, W.A. Stability of the fusarium mycotoxins nivalenol, deoxynivalenol and zearalenone in ground maize under typical cooking environments. Food Addit. Contam. 2001, 18, 1011–1016. [Google Scholar] [CrossRef] [PubMed]
  3. Chen, Y.; Kistler, H.C.; Ma, Z. Fusarium graminearum Trichothecene Mycotoxins: Biosynthesis, Regulation, and Management. Annu. Rev. Phytopathol. 2019, 57, 15–39. [Google Scholar] [CrossRef] [Green Version]
  4. Graziani, F.; Pujol, A.; Nicoletti, C.; Pinton, P.; Armand, L.; Di Pasquale, E.; Oswald, I.P.; Perrier, J.; Maresca, M. The Food-Associated Ribotoxin Deoxynivalenol Modulates Inducible NO Synthase in Human Intestinal Cell Model. Toxicol. Sci. 2015, 145, 372–382. [Google Scholar] [CrossRef] [Green Version]
  5. Liu, D.; Ge, L.; Wang, Q.; Su, J.; Chen, X.; Wang, C.; Huang, K. Low-level contamination of deoxynivalenol: A threat from environmental toxins to porcine epidemic diarrhea virus infection. Environ. Int. 2020, 143, 105949. [Google Scholar] [CrossRef]
  6. Savard, C.; Pinilla, V.; Provost, C.; Gagnon, C.A.; Chorfi, Y. In vivo effect of deoxynivalenol (DON) naturally contaminated feed on porcine reproductive and respiratory syndrome virus (PRRSV) infection. Vet. Microbiol. 2014, 174, 419–426. [Google Scholar] [CrossRef] [Green Version]
  7. Lucioli, J.; Pinton, P.; Callu, P.; Laffitte, J.; Grosjean, F.; Kolf-Clauw, M.; Oswald, I.P.; Bracarense, A.P. The food contaminant deoxynivalenol activates the mitogen activated protein kinases in the intestine: Interest of ex vivo models as an alternative to in vivo experiments. Toxicon 2013, 66, 31–36. [Google Scholar] [CrossRef] [PubMed] [Green Version]
  8. Pinton, P.; Nougayrede, J.P.; Del Rio, J.C.; Moreno, C.; Marin, D.E.; Ferrier, L.; Bracarense, A.P.; Kolf-Clauw, M.; Oswald, I.P. The food contaminant deoxynivalenol, decreases intestinal barrier permeability and reduces claudin expression. Toxicol. Appl. Pharmacol. 2009, 237, 41–48. [Google Scholar] [CrossRef] [PubMed] [Green Version]
  9. Garreau de Loubresse, N.; Prokhorova, I.; Holtkamp, W.; Rodnina, M.V.; Yusupova, G.; Yusupov, M. Structural basis for the inhibition of the eukaryotic ribosome. Nature 2014, 513, 517–522. [Google Scholar] [CrossRef] [PubMed] [Green Version]
  10. Youle, R.J.; van der Bliek, A.M. Mitochondrial fission, fusion, and stress. Science 2012, 337, 1062–1065. [Google Scholar] [CrossRef]
  11. Yang, I.V.; Schwartz, D.A. Epigenetic mechanisms and the development of asthma. J. Allergy Clin. Immunol. 2012, 130, 1243–1255. [Google Scholar] [CrossRef] [Green Version]
  12. Wang, H.; Zong, Q.; Wang, S.; Zhao, C.; Wu, S.; Bao, W. Genome-Wide DNA Methylome and Transcriptome Analysis of Porcine Intestinal Epithelial Cells upon Deoxynivalenol Exposure. J. Agric. Food Chem. 2019, 67, 6423–6431. [Google Scholar] [CrossRef]
  13. Fan, J.; Krautkramer, K.A.; Feldman, J.L.; Denu, J.M. Metabolic regulation of histone post-translational modifications. ACS Chem. Biol. 2015, 10, 95–108. [Google Scholar] [CrossRef] [Green Version]
  14. Chen, K.; Chen, Z.; Wu, D.; Zhang, L.; Lin, X.; Su, J.; Rodriguez, B.; Xi, Y.; Xia, Z.; Chen, X.; et al. Broad H3K4me3 is associated with increased transcription elongation and enhancer activity at tumor-suppressor genes. Nat. Genet. 2015, 47, 1149–1157. [Google Scholar] [CrossRef]
  15. Krivtsov, A.V.; Hoshii, T.; Armstrong, S.A. Mixed-Lineage Leukemia Fusions and Chromatin in Leukemia. Cold Spring Harb. Perspect. Med. 2017, 7, a026658. [Google Scholar] [CrossRef]
  16. Yang, W.; Ernst, P. Distinct functions of histone H3, lysine 4 methyltransferases in normal and malignant hematopoiesis. Curr. Opin. Hematol. 2017, 24, 322–328. [Google Scholar] [CrossRef]
  17. Ansari, K.I.; Mandal, S.S. Mixed lineage leukemia: Roles in gene expression, hormone signaling and mRNA processing. FEBS J. 2010, 277, 1790–1804. [Google Scholar] [CrossRef]
  18. Mohan, M.; Lin, C.; Guest, E.; Shilatifard, A. Licensed to elongate: A molecular mechanism for MLL-based leukaemogenesis. Nat. Rev. Cancer 2010, 10, 721–728. [Google Scholar] [CrossRef]
  19. Livak, K.J.; Schmittgen, T.D. Analysis of relative gene expression data using real-time quantitative PCR and the 2(-Delta Delta C(T)) Method. Methods 2001, 25, 402–408. [Google Scholar] [CrossRef]
  20. Xu, Y.; Chen, X.; Yu, L.; Wang, Y.; Wang, H.; Wu, Z.; Wu, S.; Bao, W. SLC4A11 and MFSD3 Gene Expression Changes in Deoxynivalenol Treated IPEC-J2 Cells. Front. Genet. 2021, 12, 697883. [Google Scholar] [CrossRef]
  21. Wingett, S.W.; Andrews, S. FastQ Screen: A tool for multi-genome mapping and quality control. F1000Research 2018, 7, 1338. [Google Scholar] [CrossRef]
  22. Langmead, B.; Salzberg, S.L. Fast gapped-read alignment with Bowtie 2. Nat. Methods 2012, 9, 357–359. [Google Scholar] [CrossRef] [Green Version]
  23. Anders, S.; Pyl, P.T.; Huber, W. HTSeq--a Python framework to work with high-throughput sequencing data. Bioinformatics 2015, 31, 166–169. [Google Scholar] [CrossRef] [Green Version]
  24. Wang, L.; Feng, Z.; Wang, X.; Wang, X.; Zhang, X. DEGseq: An R package for identifying differentially expressed genes from RNA-seq data. Bioinformatics 2010, 26, 136–138. [Google Scholar] [CrossRef] [Green Version]
  25. Blecher-Gonen, R.; Barnett-Itzhaki, Z.; Jaitin, D.; Amann-Zalcenstein, D.; Lara-Astiaso, D.; Amit, I. High-throughput chromatin immunoprecipitation for genome-wide mapping of in vivo protein-DNA interactions and epigenomic states. Nat. Protoc. 2013, 8, 539–554. [Google Scholar] [CrossRef]
  26. Li, D.; Ye, Y.; Lin, S.; Deng, L.; Fan, X.; Zhang, Y.; Deng, X.; Li, Y.; Yan, H.; Ma, Y. Evaluation of deoxynivalenol-induced toxic effects on DF-1 cells in vitro: Cell-cycle arrest, oxidative stress, and apoptosis. Environ. Toxicol. Pharmacol. 2014, 37, 141–149. [Google Scholar] [CrossRef]
  27. Zhang, X.; Jiang, L.; Geng, C.; Cao, J.; Zhong, L. The role of oxidative stress in deoxynivalenol-induced DNA damage in HepG2 cells. Toxicon 2009, 54, 513–518. [Google Scholar] [CrossRef]
  28. Wang, X.; Lu, X.; Zhu, R.; Zhang, K.; Li, S.; Chen, Z.; Li, L. Betulinic Acid Induces Apoptosis in Differentiated PC12 Cells Via ROS-Mediated Mitochondrial Pathway. Neurochem. Res. 2017, 42, 1130–1140. [Google Scholar] [CrossRef]
  29. Yu, G.; Luo, H.; Zhang, N.; Wang, Y.; Li, Y.; Huang, H.; Liu, Y.; Hu, Y.; Liu, H.; Zhang, J.; et al. Loss of p53 Sensitizes Cells to Palmitic Acid-Induced Apoptosis by Reactive Oxygen Species Accumulation. Int. J. Mol. Sci. 2019, 20, 6268. [Google Scholar] [CrossRef] [Green Version]
  30. Sun, J.; Guo, Y.; Fan, Y.; Wang, Q.; Zhang, Q.; Lai, D. Decreased expression of IDH1 by chronic unpredictable stress suppresses proliferation and accelerates senescence of granulosa cells through ROS activated MAPK signaling pathways. Free Radic. Biol. Med. 2021, 169, 122–136. [Google Scholar] [CrossRef]
  31. Hung, S.Y.; Chen, W.F.; Lee, Y.C.; Su, J.H.; Juan, Y.S.; Lin, I.P.; Zhang, Y.H.; Chang, M.K.; Lin, M.Y.; Chen, C.Y.; et al. Rhopaloic acid A induces apoptosis, autophagy and MAPK activation through ROS-mediated signaling in bladder cancer. Phytomedicine 2021, 92, 153720. [Google Scholar] [CrossRef] [PubMed]
  32. Tseng, W.Y.; Huang, Y.S.; Lin, H.H.; Luo, S.F.; McCann, F.; McNamee, K.; Clanchy, F.; Williams, R. TNFR signalling and its clinical implications. Cytokine 2018, 101, 19–25. [Google Scholar] [CrossRef]
  33. Ren, Z.; Deng, H.; Deng, Y.; Liang, Z.; Deng, J.; Zuo, Z.; Hu, Y.; Shen, L.; Yu, S.; Cao, S. Combined effects of deoxynivalenol and zearalenone on oxidative injury and apoptosis in porcine splenic lymphocytes in vitro. Exp. Toxicol. Pathol. 2017, 69, 612–617. [Google Scholar] [CrossRef] [PubMed]
  34. Claeys, L.; Romano, C.; De Ruyck, K.; Wilson, H.; Fervers, B.; Korenjak, M.; Zavadil, J.; Gunter, M.J.; De Saeger, S.; De Boevre, M.; et al. Mycotoxin exposure and human cancer risk: A systematic review of epidemiological studies. Compr. Rev. Food Sci. Food Saf. 2020, 19, 1449–1464. [Google Scholar] [CrossRef] [PubMed]
  35. Teneng, I.; Montoya-Durango, D.E.; Quertermous, J.L.; Lacy, M.E.; Ramos, K.S. Reactivation of L1 retrotransposon by benzo(a)pyrene involves complex genetic and epigenetic regulation. Epigenetics 2011, 6, 355–367. [Google Scholar] [CrossRef] [PubMed] [Green Version]
  36. Czakai, K.; Muller, K.; Mosesso, P.; Pepe, G.; Schulze, M.; Gohla, A.; Patnaik, D.; Dekant, W.; Higgins, J.M.; Mally, A. Perturbation of mitosis through inhibition of histone acetyltransferases: The key to ochratoxin a toxicity and carcinogenicity? Toxicol. Sci. 2011, 122, 317–329. [Google Scholar] [CrossRef] [PubMed] [Green Version]
  37. Dai, Y.; Huang, K.; Zhang, B.; Zhu, L.; Xu, W. Aflatoxin B1-induced epigenetic alterations: An overview. Food Chem. Toxicol. 2017, 109, 683–689. [Google Scholar] [CrossRef]
  38. Ansari, K.I.; Hussain, I.; Das, H.K.; Mandal, S.S. Overexpression of human histone methylase MLL1 upon exposure to a food contaminant mycotoxin, deoxynivalenol. FEBS J. 2009, 276, 3299–3307. [Google Scholar] [CrossRef]
  39. Sengupta, D.; Deb, M.; Kar, S.; Parbin, S.; Pradhan, N.; Patra, S.K. miR-193a targets MLL1 mRNA and drastically decreases MLL1 protein production: Ectopic expression of the miRNA aberrantly lowers H3K4me3 content of the chromatin and hampers cell proliferation and viability. Gene 2019, 705, 22–35. [Google Scholar] [CrossRef]
  40. Artinger, E.L.; Ernst, P. Cell context in the control of self-renewal and proliferation regulated by MLL1. Cell Cycle 2013, 12, 2969–2972. [Google Scholar] [CrossRef]
  41. Alicea-Velazquez, N.L.; Shinsky, S.A.; Loh, D.M.; Lee, J.H.; Skalnik, D.G.; Cosgrove, M.S. Targeted Disruption of the Interaction between WD-40 Repeat Protein 5 (WDR5) and Mixed Lineage Leukemia (MLL)/SET1 Family Proteins Specifically Inhibits MLL1 and SETd1A Methyltransferase Complexes. J. Biol. Chem. 2016, 291, 22357–22372. [Google Scholar] [CrossRef] [PubMed] [Green Version]
  42. Mishra, B.P.; Ansari, K.I.; Mandal, S.S. Dynamic association of MLL1, H3K4 trimethylation with chromatin and Hox gene expression during the cell cycle. FEBS J. 2009, 276, 1629–1640. [Google Scholar] [CrossRef] [PubMed]
  43. Woodhouse, S.; Pugazhendhi, D.; Brien, P.; Pell, J.M. Ezh2 maintains a key phase of muscle satellite cell expansion but does not regulate terminal differentiation. J. Cell Sci. 2013, 126, 565–579. [Google Scholar] [CrossRef] [Green Version]
  44. Cai, S.; Zhu, Q.; Guo, C.; Yuan, R.; Zhang, X.; Nie, Y.; Chen, L.; Fang, Y.; Chen, K.; Zhang, J.; et al. MLL1 promotes myogenesis by epigenetically regulating Myf5. Cell Prolif. 2020, 53, e12744. [Google Scholar] [CrossRef] [Green Version]
  45. Ryu, Y.S.; Kang, K.A.; Piao, M.J.; Ahn, M.J.; Yi, J.M.; Bossis, G.; Hyun, Y.M.; Park, C.O.; Hyun, J.W. Particulate matter-induced senescence of skin keratinocytes involves oxidative stress-dependent epigenetic modifications. Exp. Mol. Med. 2019, 51, 1–14. [Google Scholar] [CrossRef] [PubMed] [Green Version]
  46. Kyriakis, J.M.; Avruch, J. Mammalian MAPK signal transduction pathways activated by stress and inflammation: A 10-year update. Physiol. Rev. 2012, 92, 689–737. [Google Scholar] [CrossRef] [Green Version]
  47. Xu, G.; Gu, Y.; Yan, N.; Li, Y.; Sun, L.; Li, B. Curcumin functions as an anti-inflammatory and antioxidant agent on arsenic-induced hepatic and kidney injury by inhibiting MAPKs/NF-kappaB and activating Nrf2 pathways. Environ. Toxicol. 2021, 36, 2161–2173. [Google Scholar] [CrossRef]
  48. Kong, L.; Barber, T.; Aldinger, J.; Bowman, L.; Leonard, S.; Zhao, J.; Ding, M. ROS generation is involved in titanium dioxide nanoparticle-induced AP-1 activation through p38 MAPK and ERK pathways in JB6 cells. Environ. Toxicol. 2022, 37, 237–244. [Google Scholar] [CrossRef]
  49. Liang, Y.; Fisher, J.; Gonzales, C.; Trent, B.; Card, G.; Sun, J.; Tumanov, A.V.; Soong, L. Distinct Role of TNFR1 and TNFR2 in Protective Immunity Against Orientia tsutsugamushi Infection in Mice. Front. Immunol. 2022, 13, 867924. [Google Scholar] [CrossRef]
  50. Brenner, D.; Blaser, H.; Mak, T.W. Regulation of tumour necrosis factor signalling: Live or let die. Nat. Rev. Immunol. 2015, 15, 362–374. [Google Scholar] [CrossRef]
Figure 1. The toxic impacts of DON exposure on IPEC-J2 cells. (A) The viability of cells which were induced by 1 µg/mL concentration DON for 24 h and 48 h (n = 6 per group). (B) The morphological changes between treated and control group cells for 48 h 1 μg/mL DON exposure. Cells were stained by α-tubulin antibody (red) and DNA was stained by DAPI (blue). Scale bar = 100 µm. (C) Cell apoptosis ratio of cell samples at 48 h exposure were analyzed by flow cytometry. Annexin-FITC: green, PI: red. (DG) RT-qPCR analyzed the mRNA levels of SOD, apoptosis regulators (Caspase 3, BAK and Bcl-2), cytokines (IL-6, IL-8, IL-18 and TNF-α) and NF-κB. Data are shown as the mean ± SD of three independent experiments (n = 3); * p < 0.05, ** p < 0.01, *** p < 0.001 (Student’s t-test).
Antioxidants 11 02006 g001
Figure 2. Upon DON exposure, the H3K4me3 enrichment was enhanced and the expression of histone methyltransferases was elevated. (A) The protein level of H3K4me3 in IPEC-J2 cells treated with 1 μg/mL DON or not at 48 h was determined by western blot. (B,C) The mRNA abundances of histone methyltransferases were detected by qPCR and the MLL1 protein level was examined by western blot. (D) The IPEC-J2 cells were transfected with MLL1 small interfering RNA (siRNA) and after 48 h the cells were harvested to check the knockdown efficiency. (E,F) The protein levels of MLL1 and H3K4me3 were measured after cells were transfected with siRNA for 48 h. Data are presented as mean ± SD, * p < 0.05, ** p < 0.01, *** p < 0.001 (Student’s t-test).
Antioxidants 11 02006 g002
Figure 3. Loss of MLL1 induced cell cycle arrest and oxidative stress. (A) The cell cycle distribution was analyzed by flow cytometry. (B) The mRNA levels of cell cycle genes (CDK2, CDK4, Cyclin A2 and p21) were examined via qPCR. (C) Cells were stained with DCHF-DA to detect the reactive oxygen species (ROS) levels. The intensity of FITC (green) shows the level of ROS. Scale bar = 200 µm. (D) The mRNA levels of antioxidant genes were determined by qPCR. Data are presented as mean ± SD, * p < 0.05, ** p < 0.01, *** p < 0.001 (Student t-test).
Antioxidants 11 02006 g003
Figure 4. MLL1 knockdown elevated apoptosis in IPEC-J2 cells exposed to DON. (A) Apoptosis of IPEC-J2 cells was detected by flow cytometry. (B) Cell apoptosis was determined by protein level of cleaved-caspase-3/caspase 3 and BAX. Data are shown as mean ± SD, ** p < 0.01, *** p < 0.001 (Student’s t-test).
Antioxidants 11 02006 g004
Figure 5. Analysis of RNA-sequencing profile and differentially expressed genes (DEGs). (A) The principal component analysis (PCA) between si-MLL1-NC and si-MLL1 groups; PC1 means 60.13% of the variance and PC2 means 11.42% of the variance. (B) The cluster heatmap analysis of RNA-seq samples. (C) Volcano plot of differential expression genes. Green plots represent downregulated genes and red plots represent upregulated genes. (D) Gene Ontology (GO) analysis indicates the DEGs were divided into three parts: biological process, cellular component, and molecular function. (E) The bubbles showed the top 20 enriched Kyoto Encyclopedia of Genes and Genomes (KEGG) pathway of the DEGs. The dot size means the quantity of DEGs enrichment. (F) RNA-seq data were randomly selected and validated by RT-qPCR. Fold changes are shown as the expression level of genes between si-MLL1-NC and si-MLL1 group.
Antioxidants 11 02006 g005
Figure 6. Loss of MLL1 activated the MAPKs inIPEC-J2 cells. The protein levels of p-ERK, p-p38 and p-JNK were examined by western blot.
Antioxidants 11 02006 g006
Figure 7. The effects of TNFRSF1A in regulating DON induced cytotoxicity. (A) The relative expression of TNFRSF1A was determined by qPCR among Control, DON, si-TNFRSF1A-NC+DON and si-TNFRSF1A+DON group. (B) Prediction of TNFRSF1A gene promoter region and amplified the corresponding truncated sequences. (C) Identified the core promoter region via dual-luciferase reporter. (D) The H3K4me3 modification at the TNFRSF1A promoter was analyzed by ChIP-qPCR assay after the IPEC-J2 cells was treated with 1 μg/mL DON. The result is shown as % of input. (E) The interference efficiency of TNFRSF1A mRNA examined by qPCR. (F) Flow cytometry analysis the cell apoptotic ratio after knockdown of TNFRSF1A. (G,H) Relative mRNA expression of IL-8 and TNF-α after silenced TNFRSF1A. All data are presented as the mean ± SD, * p < 0.05, ** p < 0.01, *** p < 0.001, ns > 0.05 (Student t-test).
Antioxidants 11 02006 g007
Figure 8. The diagram of regulation mechanism of MLL1 upon IPEC-J2 cell exposure DON.
Antioxidants 11 02006 g008
Publisher’s Note: MDPI stays neutral with regard to jurisdictional claims in published maps and institutional affiliations.