
Vitamin B12 Reduces TDP-43 Toxicity by Alleviating Oxidative Stress and Mitochondrial Dysfunction

 ,
,  ,
,  and
and 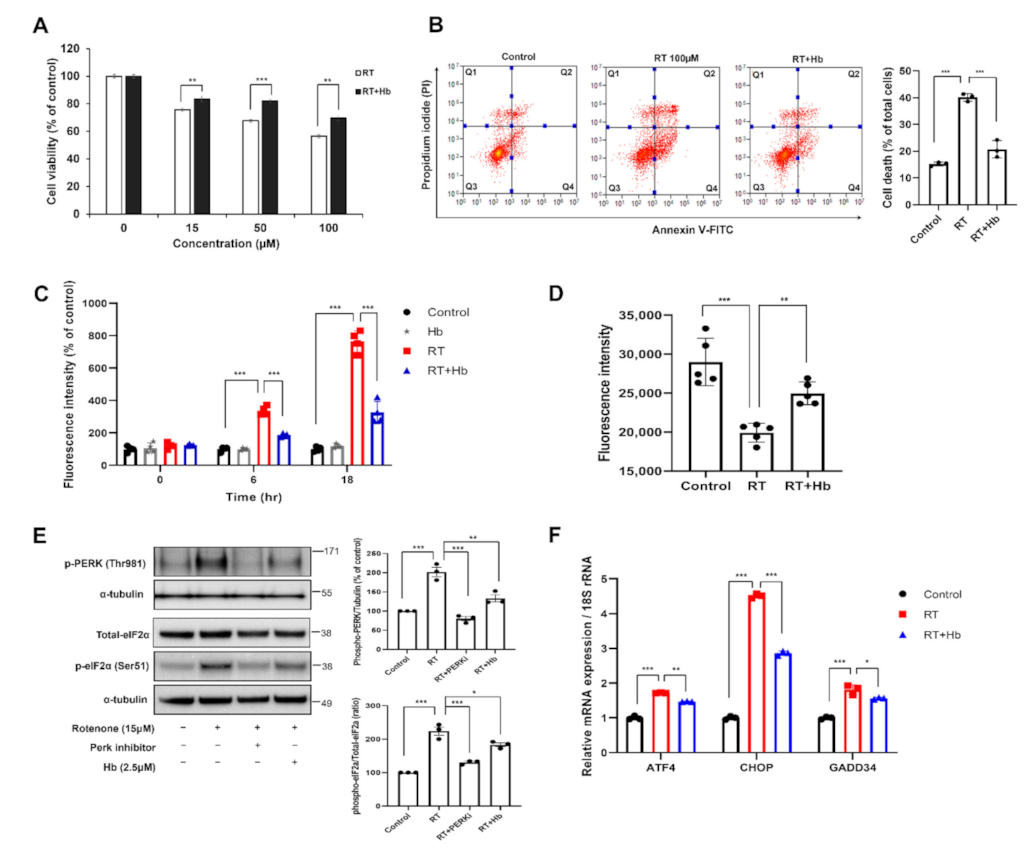
Abstract
:1. Introduction
2. Materials and Methods
2.1. Reagents and Antibodies
2.2. Cell Culture
2.3. Lentiviral Transduction
2.4. Cytotoxicity Test
2.4.1. CCK-8 Assay
2.4.2. Flow Cytometry Analysis of Annexin V-FITC/PI Staining
2.5. Immunoblot Analysis
2.6. Preparation of Soluble and Insoluble Cell Extracts
2.7. Preparation of Nuclear and Cytoplasmic Extracts
2.8. Mitochondrial Extraction
2.9. Immunostaining
2.10. IncuCyte ZOOMTM (IncuCyteTM Cytotox Red Reagent to Detect Dead Cells)
2.11. Bioenergetics Measurements in Cultured Cells
2.12. Quantitative RT–PCR
2.13. Subcellular Fractionation and DNA Isolation
2.14. Fly Strains
2.15. Climbing and Lifespan Assays
2.16. Statistical Analyses
3. Results and Discussion
3.1. Hydroxocobalamin Attenuates Oxidative Stress-Induced Neuronal Cell Death
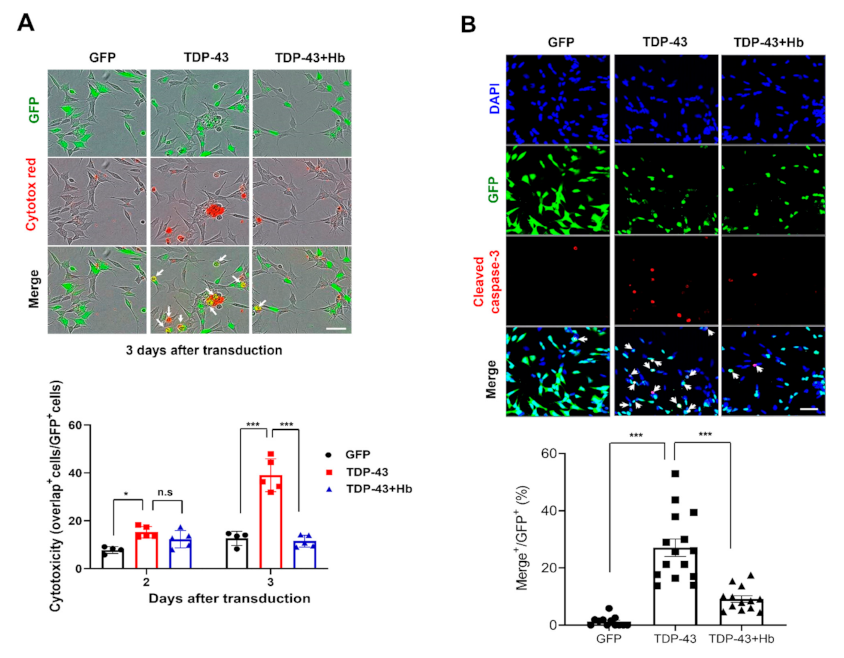
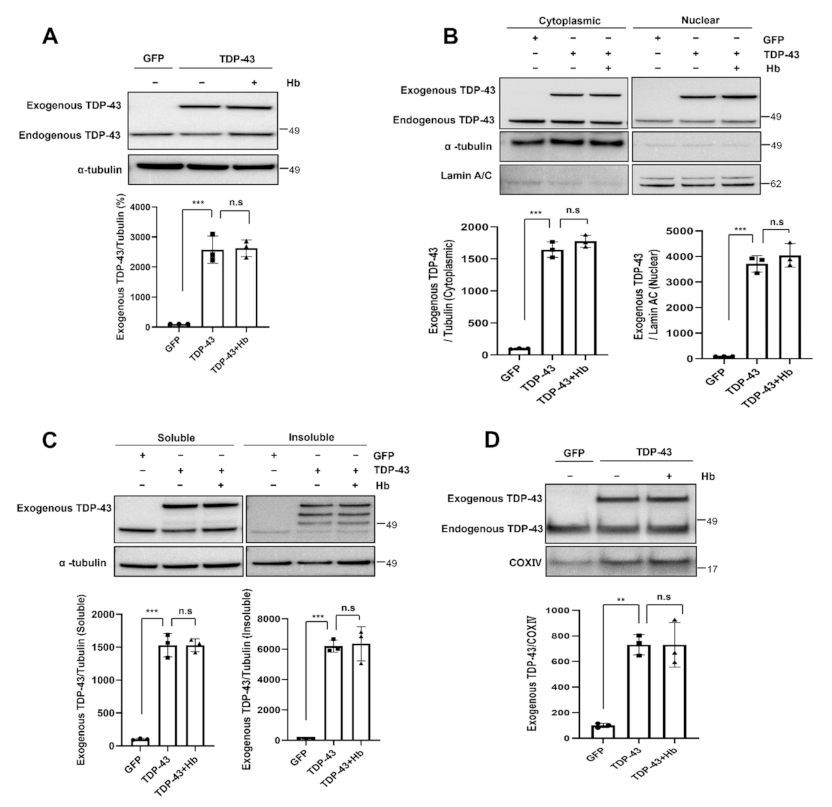
3.2. Hydroxocobalamin Mitigates TDP-43-Induced Neurotoxicity
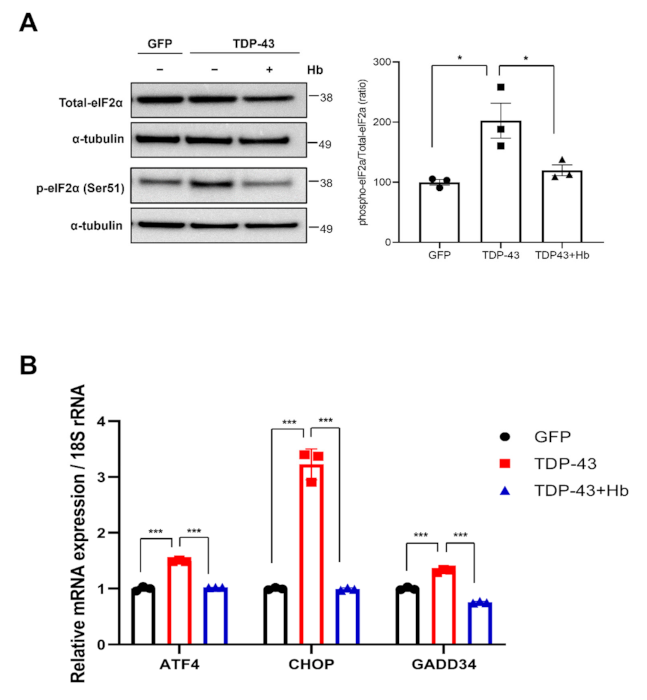
3.3. Hydroxocobalamin Suppresses TDP-43-Induced ER Stress
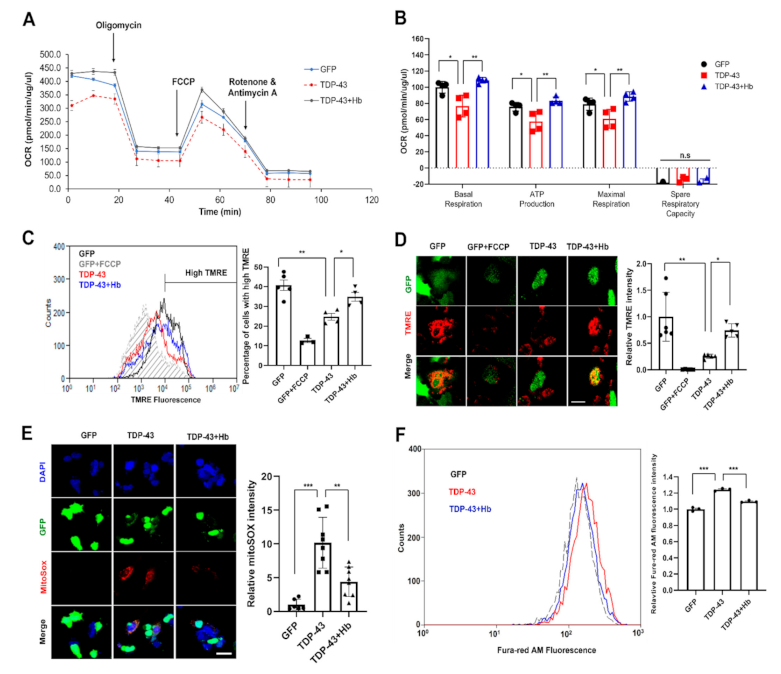
3.4. Hydroxocobalamin Ameliorates TDP-43-Induced Mitochondrial Dysfunction
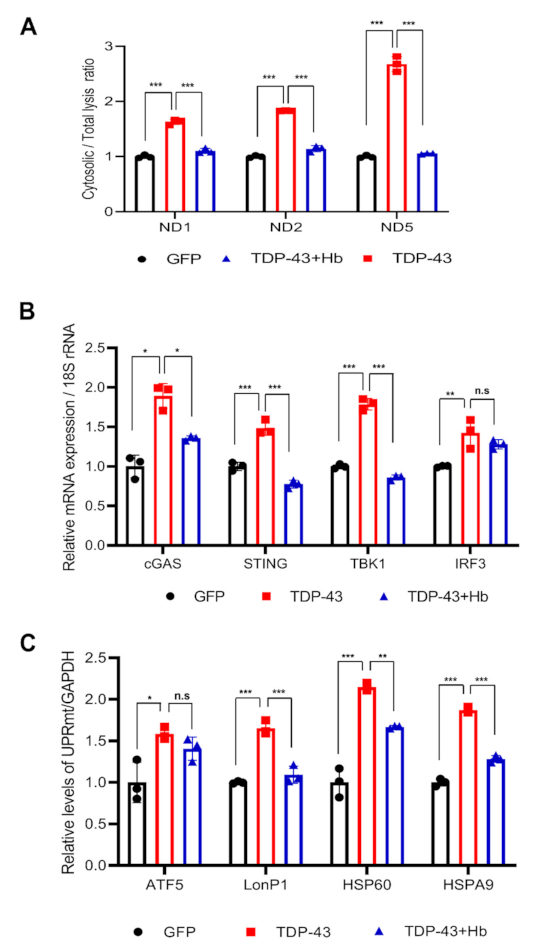
3.5. Hydroxocobalamin Regulates the TDP-43-Induced Mitochondrial Unfolded Protein Response and Mitochondrial DNA Release
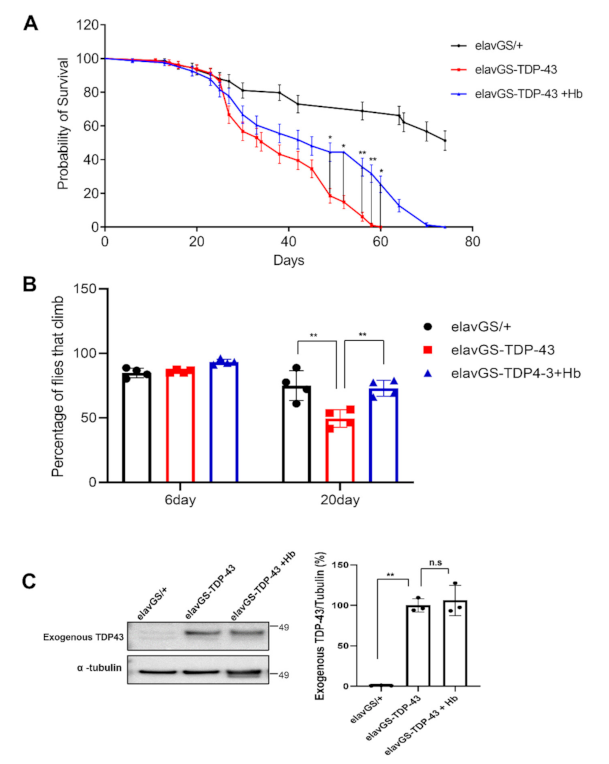
3.6. Hydroxocobalamin Mitigates TDP-43-Induced Neuronal Toxicity in Drosophila
4. Conclusions
Supplementary Materials
Author Contributions
Funding
Institutional Review Board Statement
Informed Consent Statement
Data Availability Statement
Conflicts of Interest
References
- Ou, S.H.; Wu, F.; Harrich, D.; Garcia-Martinez, L.F.; Gaynor, R.B. Cloning and characterization of a novel cellular protein, TDP-43, that binds to human immunodeficiency virus type 1 TAR DNA sequence motifs. J. Virol. 1995, 69, 3584–3596. [Google Scholar] [CrossRef] [Green Version]
- Passoni, M.; De Conti, L.; Baralle, M.; Buratti, E. UG repeats/TDP-43 interactions near 5′ splice sites exert unpredictable effects on splicing modulation. J. Mol. Biol. 2012, 415, 46–60. [Google Scholar] [CrossRef]
- Bhardwaj, A.; Myers, M.P.; Buratti, E.; Baralle, F.E. Characterizing TDP-43 interaction with its RNA targets. Nucleic Acids Res. 2013, 41, 5062–5074. [Google Scholar] [CrossRef] [Green Version]
- Winton, M.J.; Igaz, L.M.; Wong, M.M.; Kwong, L.K.; Trojanowski, J.Q.; Lee, V.M. Disturbance of nuclear and cytoplasmic TAR DNA-binding protein (TDP-43) induces disease-like redistribution, sequestration, and aggregate formation. J. Biol. Chem. 2008, 283, 13302–13309. [Google Scholar] [CrossRef] [Green Version]
- Svahn, A.J.; Don, E.K.; Badrock, A.P.; Cole, N.J.; Graeber, M.B.; Yerbury, J.J.; Chung, R.; Morsch, M. Nucleo-cytoplasmic transport of TDP-43 studied in real time: Impaired microglia function leads to axonal spreading of TDP-43 in degenerating motor neurons. Acta Neuropathol. 2018, 136, 445–459. [Google Scholar] [CrossRef] [Green Version]
- Tremblay, C.; St-Amour, I.; Schneider, J.; Bennett, D.A.; Calon, F. Accumulation of transactive response DNA binding protein 43 in mild cognitive impairment and Alzheimer disease. J. Neuropathol. Exp. Neurol. 2011, 70, 788–798. [Google Scholar] [CrossRef]
- Kwong, L.K.; Neumann, M.; Sampathu, D.M.; Lee, V.M.; Trojanowski, J.Q. TDP-43 proteinopathy: The neuropathology underlying major forms of sporadic and familial frontotemporal lobar degeneration and motor neuron disease. Acta Neuropathol. 2007, 114, 63–70. [Google Scholar] [CrossRef] [PubMed]
- Mackenzie, I.R.; Neumann, M.; Baborie, A.; Sampathu, D.M.; Du Plessis, D.; Jaros, E.; Perry, R.H.; Trojanowski, J.Q.; Mann, D.M.; Lee, V.M. A harmonized classification system for FTLD-TDP pathology. Acta Neuropathol. 2011, 122, 111–113. [Google Scholar] [CrossRef] [Green Version]
- Nelson, P.T.; Dickson, D.W.; Trojanowski, J.Q.; Jack, C.R.; Boyle, P.A.; Arfanakis, K.; Rademakers, R.; Alafuzoff, I.; Attems, J.; Brayne, C.; et al. Limbic-predominant age-related TDP-43 encephalopathy (LATE): Consensus working group report. Brain 2019, 142, 1503–1527. [Google Scholar] [CrossRef] [PubMed] [Green Version]
- Kabashi, E.; Valdmanis, P.N.; Dion, P.; Spiegelman, D.; McConkey, B.J.; Vande Velde, C.; Bouchard, J.P.; Lacomblez, L.; Pochigaeva, K.; Salachas, F.; et al. TARDBP mutations in individuals with sporadic and familial amyotrophic lateral sclerosis. Nat. Genet. 2008, 40, 572–574. [Google Scholar] [CrossRef]
- Van Deerlin, V.M.; Leverenz, J.B.; Bekris, L.M.; Bird, T.D.; Yuan, W.; Elman, L.B.; Clay, D.; Wood, E.M.; Chen-Plotkin, A.S.; Martinez-Lage, M.; et al. TARDBP mutations in amyotrophic lateral sclerosis with TDP-43 neuropathology: A genetic and histopathological analysis. Lancet Neurol. 2008, 7, 409–416. [Google Scholar] [CrossRef] [Green Version]
- Scotter, E.L.; Chen, H.J.; Shaw, C.E. TDP-43 Proteinopathy and ALS: Insights into Disease Mechanisms and Therapeutic Targets. Neurotherapeutics 2015, 12, 352–363. [Google Scholar] [CrossRef] [PubMed] [Green Version]
- Gao, J.; Wang, L.; Huntley, M.L.; Perry, G.; Wang, X. Pathomechanisms of TDP-43 in neurodegeneration. J. Neurochem. 2018, 146, 7–20. [Google Scholar] [CrossRef] [PubMed]
- de Boer, E.M.J.; Orie, V.K.; Williams, T.; Baker, M.R.; De Oliveira, H.M.; Polvikoski, T.; Silsby, M.; Menon, P.; van den Bos, M.; Halliday, G.M.; et al. TDP-43 proteinopathies: A new wave of neurodegenerative diseases. J. Neurol. Neurosurg. Psychiatry 2020, 92, 86–95. [Google Scholar] [CrossRef]
- Swarup, V.; Phaneuf, D.; Dupre, N.; Petri, S.; Strong, M.; Kriz, J.; Julien, J.P. Deregulation of TDP-43 in amyotrophic lateral sclerosis triggers nuclear factor kappaB-mediated pathogenic pathways. J. Exp. Med. 2011, 208, 2429–2447. [Google Scholar] [CrossRef] [PubMed]
- Zhao, W.; Beers, D.R.; Bell, S.; Wang, J.; Wen, S.; Baloh, R.H.; Appel, S.H. TDP-43 activates microglia through NF-kappaB and NLRP3 inflammasome. Exp. Neurol. 2015, 273, 24–35. [Google Scholar] [CrossRef]
- Wang, W.; Wang, L.; Lu, J.; Siedlak, S.L.; Fujioka, H.; Liang, J.; Jiang, S.; Ma, X.; Jiang, Z.; da Rocha, E.L.; et al. The inhibition of TDP-43 mitochondrial localization blocks its neuronal toxicity. Nat. Med. 2016, 22, 869–878. [Google Scholar] [CrossRef]
- Wang, P.; Deng, J.; Dong, J.; Liu, J.; Bigio, E.H.; Mesulam, M.; Wang, T.; Sun, L.; Wang, L.; Lee, A.Y.; et al. TDP-43 induces mitochondrial damage and activates the mitochondrial unfolded protein response. PLoS Genet. 2019, 15, e1007947. [Google Scholar] [CrossRef] [Green Version]
- Yu, C.H.; Davidson, S.; Harapas, C.R.; Hilton, J.B.; Mlodzianoski, M.J.; Laohamonthonkul, P.; Louis, C.; Low, R.R.J.; Moecking, J.; De Nardo, D.; et al. TDP-43 Triggers Mitochondrial DNA Release via mPTP to Activate cGAS/STING in ALS. Cell 2020, 183, 636–649.e18. [Google Scholar] [CrossRef]
- Gao, J.; Wang, L.; Yan, T.; Perry, G.; Wang, X. TDP-43 proteinopathy and mitochondrial abnormalities in neurodegeneration. Mol. Cell. Neurosci. 2019, 100, 103396. [Google Scholar] [CrossRef] [PubMed]
- Huang, C.; Yan, S.; Zhang, Z. Maintaining the balance of TDP-43, mitochondria, and autophagy: A promising therapeutic strategy for neurodegenerative diseases. Transl. Neurodegener. 2020, 9, 40. [Google Scholar] [CrossRef] [PubMed]
- Davis, S.A.; Itaman, S.; Khalid-Janney, C.M.; Sherard, J.A.; Dowell, J.A.; Cairns, N.J.; Gitcho, M.A. TDP-43 interacts with mitochondrial proteins critical for mitophagy and mitochondrial dynamics. Neurosci. Lett. 2018, 678, 8–15. [Google Scholar] [CrossRef] [PubMed]
- Dafinca, R.; Barbagallo, P.; Talbot, K. The Role of Mitochondrial Dysfunction and ER Stress in TDP-43 and C9ORF72 ALS. Front. Cell. Neurosci. 2021, 15, 653688. [Google Scholar] [CrossRef]
- Barber, S.C.; Shaw, P.J. Oxidative stress in ALS: Key role in motor neuron injury and therapeutic target. Free Radic. Biol. Med. 2010, 48, 629–641. [Google Scholar] [CrossRef]
- Kaji, R.; Imai, T.; Iwasaki, Y.; Okamoto, K.; Nakagawa, M.; Ohashi, Y.; Takase, T.; Hanada, T.; Shimizu, H.; Tashiro, K.; et al. Ultra-high-dose methylcobalamin in amyotrophic lateral sclerosis: A long-term phase II/III randomised controlled study. J. Neurol. Neurosurg. Psychiatry 2019, 90, 451–457. [Google Scholar] [CrossRef] [PubMed] [Green Version]
- Green, R.; Allen, L.H.; Bjorke-Monsen, A.L.; Brito, A.; Gueant, J.L.; Miller, J.W.; Molloy, A.M.; Nexo, E.; Stabler, S.; Toh, B.H.; et al. Vitamin B12 deficiency. Nat. Rev. Dis. Primers 2017, 3, 17040. [Google Scholar] [CrossRef] [PubMed]
- Miller, A.; Korem, M.; Almog, R.; Galboiz, Y. Vitamin B12, demyelination, remyelination and repair in multiple sclerosis. J. Neurol. Sci. 2005, 233, 93–97. [Google Scholar] [CrossRef] [PubMed]
- Yamazaki, K.; Oda, K.; Endo, C.; Kikuchi, T.; Wakabayashi, T. Methylcobalamin (methyl-B12) promotes regeneration of motor nerve terminals degenerating in anterior gracile muscle of gracile axonal dystrophy (GAD) mutant mouse. Neurosci. Lett. 1994, 170, 195–197. [Google Scholar] [CrossRef]
- Baltrusch, S. The Role of Neurotropic B Vitamins in Nerve Regeneration. Biomed Res. Int. 2021, 2021, 9968228. [Google Scholar] [CrossRef]
- Offringa, A.K.; Bourgonje, A.R.; Schrier, M.S.; Deth, R.C.; van Goor, H. Clinical implications of vitamin B12 as redox-active cofactor. Trends Mol. Med. 2021, 27, 931–934. [Google Scholar] [CrossRef]
- Moreira, E.S.; Brasch, N.E.; Yun, J. Vitamin B12 protects against superoxide-induced cell injury in human aortic endothelial cells. Free Radic. Biol. Med. 2011, 51, 876–883. [Google Scholar] [CrossRef] [PubMed] [Green Version]
- Tamura, J.; Kubota, K.; Murakami, H.; Sawamura, M.; Matsushima, T.; Tamura, T.; Saitoh, T.; Kurabayshi, H.; Naruse, T. Immunomodulation by vitamin B12: Augmentation of CD8+ T lymphocytes and natural killer (NK) cell activity in vitamin B12-deficient patients by methyl-B12 treatment. Clin. Exp. Immunol. 1999, 116, 28–32. [Google Scholar] [CrossRef] [PubMed]
- Scalabrino, G.; Veber, D.; Mutti, E. Experimental and clinical evidence of the role of cytokines and growth factors in the pathogenesis of acquired cobalamin-deficient leukoneuropathy. Brain Res. Rev. 2008, 59, 42–54. [Google Scholar] [CrossRef] [PubMed]
- Politis, A.; Olgiati, P.; Malitas, P.; Albani, D.; Signorini, A.; Polito, L.; De Mauro, S.; Zisaki, A.; Piperi, C.; Stamouli, E.; et al. Vitamin B12 levels in Alzheimer’s disease: Association with clinical features and cytokine production. J. Alzheimers Dis. 2010, 19, 481–488. [Google Scholar] [CrossRef]
- Luthra, N.S.; Marcus, A.H.; Hills, N.K.; Christine, C.W. Vitamin B12 measurements across neurodegenerative disorders. J. Clin. Mov. Disord. 2020, 7, 3. [Google Scholar] [CrossRef]
- Thakkar, K.; Billa, G. Treatment of vitamin B12 deficiency-methylcobalamine? Cyancobalamine? Hydroxocobalamin?-clearing the confusion. Eur. J. Clin. Nutr. 2015, 69, 1–2. [Google Scholar] [CrossRef]
- Morris, M.S. The role of B vitamins in preventing and treating cognitive impairment and decline. Adv. Nutr. 2012, 3, 801–812. [Google Scholar] [CrossRef] [Green Version]
- Hall, C.A. Function of vitamin B12 in the central nervous system as revealed by congenital defects. Am. J. Hematol. 1990, 34, 121–127. [Google Scholar] [CrossRef]
- Obeid, R.; Fedosov, S.; Nexo, E. Cobalamin coenzyme forms are not likely to be superior to cyano- and hydroxyl-cobalamin in prevention or treatment of cobalamin deficiency. Mol. Nutr. Food Res. 2015, 59, 1364–1372. [Google Scholar] [CrossRef]
- Balka, K.R.; Louis, C.; Saunders, T.L.; Smith, A.M.; Calleja, D.J.; D’Silva, D.B.; Moghaddas, F.; Tailler, M.; Lawlor, K.E.; Zhan, Y.; et al. TBK1 and IKKepsilon Act Redundantly to Mediate STING-Induced NF-kappaB Responses in Myeloid Cells. Cell Rep. 2020, 31, 107492. [Google Scholar] [CrossRef]
- Amawi, H.; Hussein, N.A.; Ashby, C.R., Jr.; Alnafisah, R.; Sanglard, L.M.; Manivannan, E.; Karthikeyan, C.; Trivedi, P.; Eisenmann, K.M.; Robey, R.W.; et al. Bax/Tubulin/Epithelial-Mesenchymal Pathways Determine the Efficacy of Silybin Analog HM015k in Colorectal Cancer Cell Growth and Metastasis. Front. Pharmacol. 2018, 9, 520. [Google Scholar] [CrossRef]
- Kawahara, N.; Mizutani, A.; Matsubara, S.; Takeda, Y.; Kobayashi, H. GSK-3beta mediates the effects of HNF-1beta overexpression in ovarian clear cell carcinoma. Exp. Ther. Med. 2020, 20, 122. [Google Scholar] [CrossRef]
- Livak, K.J.; Schmittgen, T.D. Analysis of relative gene expression data using real-time quantitative PCR and the 2(-Delta Detal C(T)). Methods 2001, 25, 402–408. [Google Scholar] [CrossRef]
- Kim, H.J.; Raphael, A.R.; LaDow, E.S.; McGurk, L.; Weber, R.A.; Trojanowski, J.Q.; Lee, V.M.; Finkbeiner, S.; Gitler, A.D.; Bonini, N.M. Therapeutic modulation of eIF2alpha phosphorylation rescues TDP-43 toxicity in amyotrophic lateral sclerosis disease models. Nat. Genet. 2014, 46, 152–160. [Google Scholar] [CrossRef] [PubMed] [Green Version]
- Sanders, L.H.; Timothy Greenamyre, J. Oxidative damage to macromolecules in human Parkinson disease and the rotenone model. Free Radic. Biol. Med. 2013, 62, 111–120. [Google Scholar] [CrossRef] [Green Version]
- Goswami, P.; Gupta, S.; Biswas, J.; Joshi, N.; Swarnkar, S.; Nath, C.; Singh, S. Endoplasmic Reticulum Stress Plays a Key Role in Rotenone-Induced Apoptotic Death of Neurons. Mol. Neurobiol. 2016, 53, 285–298. [Google Scholar] [CrossRef] [PubMed]
- Han, G.; Casson, R.J.; Chidlow, G.; Wood, J.P. The mitochondrial complex I inhibitor rotenone induces endoplasmic reticulum stress and activation of GSK-3beta in cultured rat retinal cells. Investig. Ophthalmol. Vis. Sci. 2014, 55, 5616–5628. [Google Scholar] [CrossRef] [PubMed] [Green Version]
- Jeon, Y.M.; Lee, S.; Kim, S.; Kwon, Y.; Kim, K.; Chung, C.G.; Lee, S.; Lee, S.B.; Kim, H.J. Neuroprotective Effects of Protein Tyrosine Phosphatase 1B Inhibition against ER Stress-Induced Toxicity. Mol. Cells 2017, 40, 280–290. [Google Scholar] [CrossRef] [PubMed]
- Sherer, T.B.; Betarbet, R.; Testa, C.M.; Seo, B.B.; Richardson, J.R.; Kim, J.H.; Miller, G.W.; Yagi, T.; Matsuno-Yagi, A.; Greenamyre, J.T. Mechanism of toxicity in rotenone models of Parkinson’s disease. J. Neurosci. 2003, 23, 10756–10764. [Google Scholar] [CrossRef]
- Dodiya, H.B.; Forsyth, C.B.; Voigt, R.M.; Engen, P.A.; Patel, J.; Shaikh, M.; Green, S.J.; Naqib, A.; Roy, A.; Kordower, J.H.; et al. Chronic stress-induced gut dysfunction exacerbates Parkinson’s disease phenotype and pathology in a rotenone-induced mouse model of Parkinson’s disease. Neurobiol. Dis. 2020, 135, 104352. [Google Scholar] [CrossRef]
- Li, N.R.K.; Lawle, G.; Sturgi, J.; Rajwa, B.; Melendez, J.A.; Robinson, J.P. Mitochondrial Complex I Inhibitor Rotenone Induces Apoptosis through Enhancing Mitochondrial Reactive Oxygen Species Production. J. Biol. Chem. 2003, 278, 8516–8525. [Google Scholar] [CrossRef] [Green Version]
- Choi, W.-S.; Palmiter, R.D.; Xia, Z. Loss of mitochondrial complex I activity potentiates dopamine neuron death induced by microtubule dysfunction in a Parkinson’s disease model. J. Cell Biol. 2011, 192, 873–882. [Google Scholar] [CrossRef]
- Chen, Y.Y.; Chen, G.; Fan, Z.; Luo, J.; Ke, Z.J. GSK3beta and endoplasmic reticulum stress mediate rotenone-induced death of SK-N-MC neuroblastoma cells. Biochem. Pharmacol. 2008, 76, 128–138. [Google Scholar] [CrossRef] [PubMed]
- Liu, Z.; Shi, Q.; Song, X.; Wang, Y.; Wang, Y.; Song, E.; Song, Y. Activating Transcription Factor 4 (ATF4)-ATF3-C/EBP Homologous Protein (CHOP) Cascade Shows an Essential Role in the ER Stress-Induced Sensitization of Tetrachlorobenzoquinone-Challenged PC12 Cells to ROS-Mediated Apoptosis via Death Receptor 5 (DR5) Signaling. Chem. Res. Toxicol. 2016, 29, 1510–1518. [Google Scholar] [CrossRef]
- Chen, Y.; Gui, D.; Chen, J.; He, D.; Luo, Y.; Wang, N. Down-regulation of PERK-ATF4-CHOP pathway by Astragaloside IV is associated with the inhibition of endoplasmic reticulum stress-induced podocyte apoptosis in diabetic rats. Cell. Physiol. Biochem. 2014, 33, 1975–1987. [Google Scholar] [CrossRef]
- Cao, J.; Dai, D.L.; Yao, L.; Yu, H.H.; Ning, B.; Zhang, Q.; Chen, J.; Cheng, W.H.; Shen, W.; Yang, Z.X. Saturated fatty acid induction of endoplasmic reticulum stress and apoptosis in human liver cells via the PERK/ATF4/CHOP signaling pathway. Mol. Cell. Biochem. 2012, 364, 115–129. [Google Scholar] [CrossRef]
- Crowley, L.C.; Waterhouse, N.J. Detecting Cleaved Caspase-3 in Apoptotic Cells by Flow Cytometry. Cold Spring Harb. Protoc. 2016, 11, 953–957. [Google Scholar] [CrossRef] [PubMed]
- Wang, W.; Arakawa, H.; Wang, L.; Okolo, O.; Siedlak, S.L.; Jiang, Y.; Gao, J.; Xie, F.; Petersen, R.B.; Wang, X. Motor-Coordinative and Cognitive Dysfunction Caused by Mutant TDP-43 Could Be Reversed by Inhibiting Its Mitochondrial Localization. Mol. Ther. 2017, 25, 127–139. [Google Scholar] [CrossRef] [PubMed] [Green Version]
- Nijholt, D.A.; van Haastert, E.S.; Rozemuller, A.J.; Scheper, W.; Hoozemans, J.J. The unfolded protein response is associated with early tau pathology in the hippocampus of tauopathies. J. Pathol. 2012, 226, 693–702. [Google Scholar] [CrossRef]
- Hoozemans, J.J.; van Haastert, E.S.; Nijholt, D.A.; Rozemuller, A.J.; Eikelenboom, P.; Scheper, W. The unfolded protein response is activated in pretangle neurons in Alzheimer’s disease hippocampus. Am. J. Pathol. 2009, 174, 1241–1251. [Google Scholar] [CrossRef] [PubMed] [Green Version]
- Halliday, M.; Radford, H.; Sekine, Y.; Moreno, J.; Verity, N.; le Quesne, J.; Ortori, C.A.; Barrett, D.A.; Fromont, C.; Fischer, P.M.; et al. Partial restoration of protein synthesis rates by the small molecule ISRIB prevents neurodegeneration without pancreatic toxicity. Cell Death Dis. 2015, 6, e1672. [Google Scholar] [CrossRef] [PubMed] [Green Version]
- Radford, H.; Moreno, J.A.; Verity, N.; Halliday, M.; Mallucci, G.R. PERK inhibition prevents tau-mediated neurodegeneration in a mouse model of frontotemporal dementia. Acta Neuropathol. 2015, 130, 633–642. [Google Scholar] [CrossRef] [Green Version]
- Wang, W.; Li, L.; Lin, W.L.; Dickson, D.W.; Petrucelli, L.; Zhang, T.; Wang, X. The ALS disease-associated mutant TDP-43 impairs mitochondrial dynamics and function in motor neurons. Hum. Mol. Genet. 2013, 22, 4706–4719. [Google Scholar] [CrossRef] [PubMed] [Green Version]
- Xu, Y.F.; Gendron, T.F.; Zhang, Y.J.; Lin, W.L.; D’Alton, S.; Sheng, H.; Casey, M.C.; Tong, J.; Knight, J.; Yu, X.; et al. Wild-type human TDP-43 expression causes TDP-43 phosphorylation, mitochondrial aggregation, motor deficits, and early mortality in transgenic mice. J. Neurosci. 2010, 30, 10851–10859. [Google Scholar] [CrossRef] [PubMed] [Green Version]
- Huntley, M.L.; Gao, J.; Termsarasab, P.; Wang, L.; Zeng, S.; Thammongkolchai, T.; Liu, Y.; Cohen, M.L.; Wang, X. Association between TDP-43 and mitochondria in inclusion body myositis. Lab. Investig. 2019, 99, 1041–1048. [Google Scholar] [CrossRef]
- Mattson, M.P.; Chan, S.L. Dysregulation of cellular calcium homeostasis in Alzheimer’s disease: Bad genes and bad habits. J. Mol. Neurosci. 2001, 17, 205–224. [Google Scholar] [CrossRef]
- Surmeier, D.J.; Schumacker, P.T.; Guzman, J.D.; Ilijic, E.; Yang, B.; Zampese, E. Calcium and Parkinson’s disease. Biochem. Biophys. Res. Commun. 2017, 483, 1013–1019. [Google Scholar] [CrossRef] [Green Version]
- Tang, T.S.; Slow, E.; Lupu, V.; Stavrovskaya, I.G.; Sugimori, M.; Llinas, R.; Kristal, B.S.; Hayden, M.R.; Bezprozvanny, I. Disturbed Ca2+ signaling and apoptosis of medium spiny neurons in Huntington’s disease. Proc. Natl. Acad. Sci. USA 2005, 102, 2602–2607. [Google Scholar] [CrossRef] [Green Version]
- Leal, S.S.; Gomes, C.M. Calcium dysregulation links ALS defective proteins and motor neuron selective vulnerability. Front. Cell. Neurosci. 2015, 9, 225. [Google Scholar] [CrossRef] [Green Version]
- Tradewell, M.L.; Cooper, L.A.; Minotti, S.; Durham, H.D. Calcium dysregulation, mitochondrial pathology and protein aggregation in a culture model of amyotrophic lateral sclerosis: Mechanistic relationship and differential sensitivity to intervention. Neurobiol. Dis. 2011, 42, 265–275. [Google Scholar] [CrossRef] [PubMed]
- Aggad, D.; Veriepe, J.; Tauffenberger, A.; Parker, J.A. TDP-43 toxicity proceeds via calcium dysregulation and necrosis in aging Caenorhabditis elegans motor neurons. J. Neurosci. 2014, 34, 12093–12103. [Google Scholar] [CrossRef] [PubMed]
- Nakahira, K.; Haspel, J.A.; Rathinam, V.A.; Lee, S.J.; Dolinay, T.; Lam, H.C.; Englert, J.A.; Rabinovitch, M.; Cernadas, M.; Kim, H.P.; et al. Autophagy proteins regulate innate immune responses by inhibiting the release of mitochondrial DNA mediated by the NALP3 inflammasome. Nat. Immunol. 2011, 12, 222–230. [Google Scholar] [CrossRef] [Green Version]
- West, A.P.; Shadel, G.S. Mitochondrial DNA in innate immune responses and inflammatory pathology. Nat. Rev. Immunol. 2017, 17, 363–375. [Google Scholar] [CrossRef] [PubMed]
- Wan, D.; Jiang, W.; Hao, J. Research Advances in How the cGAS-STING Pathway Controls the Cellular Inflammatory Response. Front. Immunol. 2020, 11, 615. [Google Scholar] [CrossRef]
- Weng, H.; Ma, Y.; Chen, L.; Cai, G.; Chen, Z.; Zhang, S.; Ye, Q. A New Vision of Mitochondrial Unfolded Protein Response to the Sirtuin Family. Curr. Neuropharmacol. 2020, 18, 613–623. [Google Scholar] [CrossRef] [PubMed]
- Lee, S.; Jeon, Y.M.; Cha, S.J.; Kim, S.; Kwon, Y.; Jo, M.; Jang, Y.N.; Lee, S.; Kim, J.; Kim, S.R.; et al. PTK2/FAK regulates UPS impairment via SQSTM1/p62 phosphorylation in TARDBP/TDP-43 proteinopathies. Autophagy 2020, 16, 1396–1412. [Google Scholar] [CrossRef]
- Lee, S.; Kim, S.; Kang, H.Y.; Lim, H.R.; Kwon, Y.; Jo, M.; Jeon, Y.M.; Kim, S.R.; Kim, K.; Ha, C.M.; et al. The overexpression of TDP-43 in astrocytes causes neurodegeneration via a PTP1B-mediated inflammatory response. J. Neuroinflammation 2020, 17, 299. [Google Scholar] [CrossRef]
- Wu, F.; Xu, K.; Liu, L.; Zhang, K.; Xia, L.; Zhang, M.; Teng, C.; Tong, H.; He, Y.; Xue, Y.; et al. Vitamin B12 Enhances Nerve Repair and Improves Functional Recovery After Traumatic Brain Injury by Inhibiting ER Stress-Induced Neuron Injury. Front. Pharmacol. 2019, 10, 406. [Google Scholar] [CrossRef] [PubMed]
- Birch, C.S.; Brasch, N.E.; McCaddon, A.; Williams, J.H. A novel role for vitamin B(12): Cobalamins are intracellular antioxidants in vitro. Free Radic. Biol. Med. 2009, 47, 184–188. [Google Scholar] [CrossRef]
- Birger, A.; Ben-Dor, I.; Ottolenghi, M.; Turetsky, T.; Gil, Y.; Sweetat, S.; Perez, L.; Belzer, V.; Casden, N.; Steiner, D.; et al. Human iPSC-derived astrocytes from ALS patients with mutated C9ORF72 show increased oxidative stress and neurotoxicity. EBioMedicine 2019, 50, 274–289. [Google Scholar] [CrossRef] [Green Version]
- Deng, Z.; Lim, J.; Wang, Q.; Purtell, K.; Wu, S.; Palomo, G.M.; Tan, H.; Manfredi, G.; Zhao, Y.; Peng, J.; et al. ALS-FTLD-linked mutations of SQSTM1/p62 disrupt selective autophagy and NFE2L2/NRF2 anti-oxidative stress pathway. Autophagy 2020, 16, 917–931. [Google Scholar] [CrossRef]
- Angeles, D.C.; Gan, B.H.; Onstead, L.; Zhao, Y.; Lim, K.L.; Dachsel, J.; Melrose, H.; Farrer, M.; Wszolek, Z.K.; Dickson, D.W.; et al. Mutations in LRRK2 increase phosphorylation of peroxiredoxin 3 exacerbating oxidative stress-induced neuronal death. Hum. Mutat. 2011, 32, 1390–1397. [Google Scholar] [CrossRef] [PubMed]
- Abdul, H.M.; Butterfield, D.A. Involvement of PI3K/PKG/ERK1/2 signaling pathways in cortical neurons to trigger protection by cotreatment of acetyl-L-carnitine and alpha-lipoic acid against HNE-mediated oxidative stress and neurotoxicity: Implications for Alzheimer’s disease. Free Radic. Biol. Med. 2007, 42, 371–384. [Google Scholar] [CrossRef] [Green Version]
- Zuo, X.; Zhou, J.; Li, Y.; Wu, K.; Chen, Z.; Luo, Z.; Zhang, X.; Liang, Y.; Esteban, M.A.; Zhou, Y.; et al. TDP-43 aggregation induced by oxidative stress causes global mitochondrial imbalance in ALS. Nat. Struct. Mol. Biol. 2021, 28, 132–142. [Google Scholar] [CrossRef] [PubMed]
- Lin, M.T.; Beal, M.F. Mitochondrial dysfunction and oxidative stress in neurodegenerative diseases. Nature 2006, 443, 787–795. [Google Scholar] [CrossRef]
- Cooper, J.F.; Machiela, E.; Dues, D.J.; Spielbauer, K.K.; Senchuk, M.M.; Van Raamsdonk, J.M. Activation of the mitochondrial unfolded protein response promotes longevity and dopamine neuron survival in Parkinson’s disease models. Sci. Rep. 2017, 7, 16441. [Google Scholar] [CrossRef] [PubMed] [Green Version]
- Beck, J.S.; Mufson, E.J.; Counts, S.E. Evidence for Mitochondrial UPR Gene Activation in Familial and Sporadic Alzheimer’s Disease. Curr. Alzheimer Res. 2016, 13, 610–614. [Google Scholar] [CrossRef] [PubMed]


Publisher’s Note: MDPI stays neutral with regard to jurisdictional claims in published maps and institutional affiliations. |
© 2021 by the authors. Licensee MDPI, Basel, Switzerland. This article is an open access article distributed under the terms and conditions of the Creative Commons Attribution (CC BY) license (https://creativecommons.org/licenses/by/4.0/).
Share and Cite
Jeon, Y.-M.; Kwon, Y.; Lee, S.; Kim, S.; Jo, M.; Lee, S.; Kim, S.R.; Kim, K.; Kim, H.-J. Vitamin B12 Reduces TDP-43 Toxicity by Alleviating Oxidative Stress and Mitochondrial Dysfunction. Antioxidants 2022, 11, 82. https://doi.org/10.3390/antiox11010082
Jeon Y-M, Kwon Y, Lee S, Kim S, Jo M, Lee S, Kim SR, Kim K, Kim H-J. Vitamin B12 Reduces TDP-43 Toxicity by Alleviating Oxidative Stress and Mitochondrial Dysfunction. Antioxidants. 2022; 11(1):82. https://doi.org/10.3390/antiox11010082
Chicago/Turabian StyleJeon, Yu-Mi, Younghwi Kwon, Shinrye Lee, Seyeon Kim, Myungjin Jo, Seongsoo Lee, Sang Ryong Kim, Kiyoung Kim, and Hyung-Jun Kim. 2022. "Vitamin B12 Reduces TDP-43 Toxicity by Alleviating Oxidative Stress and Mitochondrial Dysfunction" Antioxidants 11, no. 1: 82. https://doi.org/10.3390/antiox11010082
APA StyleJeon, Y.-M., Kwon, Y., Lee, S., Kim, S., Jo, M., Lee, S., Kim, S. R., Kim, K., & Kim, H.-J. (2022). Vitamin B12 Reduces TDP-43 Toxicity by Alleviating Oxidative Stress and Mitochondrial Dysfunction. Antioxidants, 11(1), 82. https://doi.org/10.3390/antiox11010082