Article

PtrMYB3, a R2R3-MYB Transcription Factor from Poncirus trifoliata, Negatively Regulates Salt Tolerance and Hydrogen Peroxide Scavenging

1
Key Laboratory of Horticultural Plant Biology (MOE), College of Horticulture and Forestry Sciences, Huazhong Agricultural University, Wuhan 430070, China
2
College of Horticulture and Plant Protection, Henan University of Science and Technology, Luoyang 471023, China
*
Author to whom correspondence should be addressed.
Antioxidants 2021, 10(9), 1388; https://doi.org/10.3390/antiox10091388
Submission received: 12 August 2021 / Revised: 26 August 2021 / Accepted: 27 August 2021 / Published: 30 August 2021
(This article belongs to the Special Issue Plant Redox Biology)

Abstract

:
MYB transcription factors are widely present in plants and play significant roles in abiotic stresses. However, most MYB genes have not been identified in plants and their functions in abiotic stresses are still unknown. In this study, one MYB gene, designated as PtrMYB3, was cloned from trifoliate orange (Poncirus trifoliata (L.) Raf.), and its function in salt tolerance was investigated. PtrMYB3 contains a conserved R2R3-MYB domain, which is the typical property of R2R3-MYB subfamily proteins. Expression profiling under abiotic stresses indicated that PtrMYB3 could be induced by salt, dehydration and cold stresses. PtrMYB3 was found to be localized to the nucleus and possessed transactivation activity. Overexpression of PtrMYB3 by genetic transformation in tobacco impaired its salt tolerance, whereas silencing of PtrMYB3 by VIGS (virus-induced gene silencing) in trifoliate orange conferred significantly enhanced salt tolerance, indicating that PtrMYB3 negatively regulates salt tolerance. Furthermore, a peroxidase gene (PtrPOD) was found to be greatly upregulated in PtrMYB3-silenced trifoliate orange, and a dual LUC (luciferase) assay confirmed that PtrMYB3 could suppress the expression of PtrPOD. The hydrogen peroxide (H2O2) accumulation in PtrMYB3 transgenic tobacco plants after salt stress was higher than the wild type (WT), further confirming that overexpression of PtrMYB3 inhibited PtrPOD-mediated H2O2 scavenging. Taken together, these results demonstrate that PtrMYB3 negatively regulates salt tolerance, at least in part, due to the excess accumulation of H2O2.

1. Introduction

Salt stress is becoming a major environmental problem because of the massive crop loss caused by high salinity in soil, especially in arid and semi-arid regions around the world [1]. Salt stress results in ion toxicity, osmotic stress and oxidative stress [2], leading to severe damage to plants. Therefore, it is imperative to improve plant salt tolerances by employing various strategies. Genetic engineering is an effective approach for creating tolerant transgenic plants tolerant to salt stress, and one of the key steps is to identify important salt-responsive genes. To this end, it is pressing and important to identify key genes and unravel their functions in salt tolerance.
Transcription factors are important regulatory proteins that can either activate or inhibit the expression of downstream target genes by binding directly to the promoters [3]. The MYB family transcription factors are widely present in all angiosperms. MYB proteins contain a conserved domain, which usually locates at the N-terminal region [4]. According to the number of MYB domains, MYB transcription factors can be classified into four major subgroups: 1R, R2R3, 3R and 4R-MYB proteins [5]. The R2R3-MYB transcription factors are plant-specific ones with the largest group members, such as 124 members in Arabidopsis thaliana [6], 192 in Populus trichocarpa [7], 244 in Glycine max [8], and 100 in Citrus sinensis [9].
Increasing MYB transcription factors have been identified in the last two decades, and studies showed that MYBs played important roles in multiple plant processes, such as growth and development, phenylpropanoid metabolism, hormone homeostasis, biotic and abiotic stresses responses, and light response [3,4,10,11]. MYB transcription factors are involved in the responses of various abiotic stresses, including drought [12,13], low temperature [14,15,16], high temperature [17] and salt [13,18,19]. For salt stress, MYB transcription factors can play a role in the salt tolerance of plants by directly regulating the expression of downstream target genes. For example, Arabidopsis MYB transcription factor AtMyb73 negatively regulates salt tolerance by changing the expression of two salt overly sensitive (SOS) genes, SOS1 and SOS3 [20]. AtMYB20 enhances salt tolerance by negatively regulating the gene expression of the type 2C serine/threonine protein phosphatases [21]. The Arabidopsis MYB gene, ATDIV2, negatively regulates ABA signaling in response to salt stress [22]. Apple (Malus domestica Borkh.) MdMYB46 positively regulates salt responsive genes, RD29A and RD22, to function in the salt tolerance [18]. Some other MYB transcription factors, like TaMYBsdu1, TaMYB3R1 and TaMYB33 from wheat, CmMYB2 from chrysanthemum, MdSIMYB1 from apple, RhMYB96 from rose, have all been proven to function in salt tolerance [19,23,24,25,26,27], suggesting the pivotal role of MYBs from various plants in modulation of salt stress response.
Redox components are involved in all vital activities during plant growth and development [28]. Reactive oxygen species (ROS), such as H2O2 and O2•−, act as important signaling molecules in plant cells [29]. However, under abiotic stresses, excessive accumulation of ROS will generate oxidative stress harmful to plants [30]. To cope with this, plants have evolved a sophisticated mechanism to scavenge the harmful ROS by mobilizing a range of antioxidant enzymes, like peroxidase (POD), superoxide dismutase (SOD) and catalase (CAT). In this regard, the regulation of antioxidant enzymes plays a significant role in enhancing plant tolerance to abiotic stresses, as has been revealed in previously studies [31,32,33].
Trifoliate orange (Poncirus trifoliata (L.) Raf.) is widely used as rootstock in citrus because of its elite attributes, such as remarkable cold tolerance and desirable disease resistance [34,35]. However, the salt tolerance of trifoliate orange is weak [36], so improving the salt tolerance is a major goal for trifoliate orange, which needs to firstly identify key genes involved in the salt responses. In this study, we identified one R2R3-MYB transcription factor, PtrMYB3, from trifoliate orange, and elucidated its function in salt tolerance. Our findings revealed a negatively regulatory pathway of salt tolerance in trifoliate orange.

2. Materials and Methods

2.1. Plant Materials and Stress Treatments

To obtain the trifoliate orange (Poncirus trifoliata (L.) Raf.) seedlings, seeds collected from trifoliate orange fruits that were harvested in the citrus germplasm repository of Huazhong Agricultural University (Wuhan, China) were sown in commercial soil mixture, and germinated under the natural photoperiod in the greenhouse. Three-month-old seedlings with uniform growth status were used to conduct abiotic stress treatments including salt, dehydration and cold. For salt treatment, seedlings detached from soil were placed in a conical flask with the roots immersed in 250 mM NaCl for 0, 4, 8, 12, 24, 48 and 72 h. For dehydration treatment, seedlings were placed in clean paper under an ambient environment for 0, 1, 3, 6, 12, 24, 48 h, and replaced in water for recovery for 24 h. For cold treatment, seedlings in soil pots were placed in a growth chamber under 4 °C for 0, 6, 24, 72, 120 h, and replaced in 24 °C for 24 h. The leaves were sampled at each designated time point and immediately frozen in liquid nitrogen. All samples were stored in a –80 °C refrigerator for the following analysis.

2.2. Quantitative Real-Time Polymerase Chain Reaction (qPCR) Analysis

Total RNA was extracted from the samples stored in −80 °C using a RNAiso Plus kit (TaKaRa, Dalian, China) according to the manufacturer’s instrument. The RNA quality was assessed by gel electrophoresis, and the RNA concentration was measured by a NanoDrop 2000 UV-vis Spectrophotometer (ThermoFisher Scientific, Waltham, MA, USA). The cDNA was synthesized with a RevertAid First Strand cDNA Synthesis Kit (Thermo, Waltham, MA, USA), and cDNA quality was evaluated with the NanoDrop 2000 UV-vis Spectrophotometer. The diluted cDNA was used for qPCR. Primers used for qPCR were designed by the online Primer-blast program in NCBI (https://www.ncbi.nlm.nih.gov/tools/primer-blast/, accessed on 2 June 2020) (Table S1). For qPCR, the 20 μL of reaction mixture consisted of 10 μL of 2 × SYBR Green PCR Master Mix (QIAGEN, Dusseldorf, Germany), 2 μL of ROX dye, 0.25 μM of forward and reverse primers, and 50 ng of cDNA. The qPCR analysis was processed on a QuantStudio 7 Flex (ThermoFisher Scientific, Waltham, MA, USA) system according to the following cycling regimes: 95 °C for 2 min, 95 °C for 10 s (40 cycles), 60 °C for 30 s (40 cycles) and 72 °C for 25 s. The relative gene expression levels were calculated based on the 2−ΔΔCT method [37]. ACTIN and Ubiquitin were used as internal reference genes for trifoliate orange and tobacco respectively.

2.3. Cloning and Sequence Analysis of PtrMYB3

The coding sequence (CDS) of PtrMYB3 (ID: Pt1g018990) from the trifoliate orange genome (http://citrus.hzau.edu.cn/orange/download/index.php, accessed on 7 January 2021) was used to design primers for cloning this gene. Primers were designed with Primer Premier5 software, and primer sequences (PtrMYB3-T) are shown in Table S1. The homologous gene sequences of PtrMYB3 from other plant species were downloaded from NCBI (https://www.ncbi.nlm.nih.gov/, accessed on 16 April 2020). Multiple sequence alignments were performed by ClustalX software based on the protein sequence of PtrMYB3 and the homologous gene sequences of other five species including Vitis vinifera, Oryza sativa, Zea mays, Brassica rapa, and Arabidopsis thaliana.

2.4. Subcellular Localization

For testing the subcellular localization, the CDS of PtrMYB3 without the stop codon was cloned into the EcorRI and BamHI restriction sites of the 101LYFP vector, which contained a CaMV35S promoter and a yellow fluorescence protein (YFP) reporter gene. The formed construct (PtrMYB3-YFP) and the control vector (YFP without PtrMYB3) were respectively transferred into Agrobacterium tumefaciens strain GV3101. Transient expression was performed by co-injecting constructed GV3101 strain and a positive control strain (with a nuclear marker gene VirD2NLS fused to mCherry) into the hypodermis of tobacco (Nicotiana benthamiana) leaves. The infiltrated tobacco plants were placed in a growth chamber at 25 °C for 3 d under a 16 h light/8 h dark photoperiod. The fluorescence signal was detected and imaged with a laser scanning confocal microscope (Leica TCS-SP8, Frankfurt, Germany).

2.5. Transactivation Activity Assay

For analyzing the transactivation activity, the CDS of PtrMYB3 was amplified into the EcorRI and BamHI restriction sites of the pGBKT7 vector. The fused construct (PtrMYB3-pGBKT7) and the negative control (pGBKT7 without PtrMYB3) were separately transformed into the yeast strain AH109, which harbored three reporter genes including ADE2, HIS3 and MEL1. A transactivation assay was performed by incubating the transformed yeast strains on the selective yeast growth mediums, including SD/-Trp, SD/-Trp/-His/-Ade supplemented with 0, 5, 15 mM 3-amino-1,2,4-triazole (3-AT), and SD/-Trp/-His/-Ade supplemented with 20 mM X-α-Gal.

2.6. Genetic Transformation of Tobacco

To overexpress PtrMYB3, the full-length CDS was cloned into the XbaI and SmaI restriction sites of the pBI121 vector under the control of the CaMV35S promoter. The fused vector was transformed into the A. tumefaciens GV3101 strain. Genetic transformation of tobacco (N. tabacum) was performed using leaf disc as explants according to previous methods [38]. To identify positive transformed seedlings, DNA was firstly extracted from the leaves, and PCR was performed with the extracted DNA and two pairs of specific primers (NPTⅡ-F/R and 35S-F+PtrMYB3-T-R, Table S1). The gene expression levels of PtrMYB3 in the identified transgenic plants were measured by qPCR, according to the methods described above. The transgenic tobacco plants of T0 generation were grown in a growth chamber to harvest seeds and obtain transgenic seedlings of the T1 generation. T1 generation seedlings were conducted positive identification again as described above, and the T2 stable transgenic tobacco plants were used for the subsequent experiments.

2.7. Virus Induced Gene Silencing (VIGS)

To obtain PtrMYB3-silenced seedlings, a VIGS system was employed according to the previous study [31]. A 350 bp fragment of PtrMYB3 was inserted into the BamHI and SmaI restriction sites of the pTRV2 vector. The constructed PtrMYB3-pTRV2, as well as pTRV2 and pTRV1 vectors, was separately transformed into A. tumefaciens GV3101 strain. Before agroinfiltration, germinating seeds of trifoliate oranges were prepared in advance, by placing seeds on the soaked gauze for about 10 d. When agroinfiltration was carried out, the bacterial cells were suspended in a 2-(N-morpholino) ethanesulfonic acid (MES) buffer to a concentration of OD600 = 1, and pTRV1 suspension was mixed with PtrMYB3-pTRV2 or pTRV2 in a ratio of 1:1. The germinated seeds were submerged into the bacterial suspension mixture in vacuum for 30 min. After water cleaning, the seeds were placed in the dark for 3 d. Washed in water for 2–3 times, the seeds were grown in soil for 3–4 weeks. Fully expanded leaves were sampled and DNA was extracted from each plant. Genomic PCR and qPCR were performed to screen positive PtrMYB3-silenced plants.

2.8. Salt Tolerance Assay

To investigate the salt tolerance of PtrMYB3 transgenic tobacco plants, the seeds of the T2 generation of two transgenic lines and wild type (WT) were sown in soil pots, with four pots for each line. All the pots were placed in a growth chamber under a 16 h light/8 h dark photoperiod until seeds germinated. The 7-day-old seedlings of every soil pot were sprayed with 20 mL of 200 mM NaCl solution at 3 d intervals two times. The survival rates were calculated after this treatment. In addition, 40-day-old tobacco plants were used to perform salt treatment by spraying and watering with 20 mL of 200 mM NaCl solution at 3 d intervals five times. Three seedlings were planted in one soil pot, with in total eight pots for every line (including the two transgenic lines and one WT line) for salt treatment. Chlorophyll (a, b and total) content of the WT and transgenic tobacco leaves after salt treatment was measured according to the previous method [39].
For the trifoliate oranges of VIGS, one-month-old seedlings were used to perform salt tolerance assays by spraying with 20 mL of 300 mM NaCl solution and watering with 50 mL of 300 mM NaCl solution for every pot at 3 d intervals for 25 d. After treatment, chlorophyll (a, b and total) content of silenced seedlings (PtrMYB3-TRV) and control (WT) were measured as mentioned above. Before and after treatment, the chlorophyll fluorescence was detected with an IMAGING-PAM chlorophyll fluorometer (Walz, Effeltrich, Germany). The maximum quantum efficiency of photosystem II (Fv/Fm) was calculated by an Imaging WinGegE software according to the chlorophyll fluorescence imaging [40].

2.9. Dual-Luciferase Reporter Assay

The CDS of PtrMYB3 was amplified and inserted into the BamHI and EcoRI restriction sites of pGreenII 62-SK vector as effector. The promoter sequence of PtrPOD was cloned into the HindIII and BamHI restriction sites of pGreenII 0800-LUC vector as reporter. The recombinant vectors were transformed into A. tumefaciens GV3101 (with a helper plasmid pSoup), and transiently expressed in tobacco (N. benthamiana) leaves according to the previous method [31]. A purchased kit of the Dual-Luciferase Reporter Assay System (Promega, Madison, WI, USA) was used to examine the activities of firefly luciferase (LUC) and Renilla luciferase (REN) according to the manufacturer’s instructions with an Infinite 200 Pro microplate reader (Tecan, Switzerland). The LUC/REN ratios were calculated with the control (effector without PtrMYB3) setting as 1. In addition, the transiently expressed tobacco plants were placed in dark for 20 min, and the detached leaves were used to detect and image the luminescence on a NightSHADE LB983 imaging system (Berthold, Stuttgart, Germany).

2.10. Hydrogen Peroxide (H2O2) Measurement

H2O2 content in tobacco leaves was measured using the purchased Hydrogen Peroxide Assay Kit (Nanjing Jiancheng Bioengineering Institute, Nanjing, China) according to the user manual and the previously described methods [32]. In situ H2O2 accumulation in tobacco leaves was examined by histochemical staining with 3,3′-diaminobenzidine (DAB). Leaves were immersed in 1 mg/mL DAB solution (prepared with pH 7.8 phosphatic buffer solution, adding 30% H2O2 before staining), and put in room temperature for staining for 1–2 d. The stained leaves were discolored with 80% ethanol under 60 °C, and photographed after drying.

2.11. Statistical Analysis

All the data, shown as means ± SE, were analyzed by the SAS software (SAS Institute, Cary, NC, USA) and Microsoft Office Excel. The significance of statistical difference was analyzed by SPSS software (IBM, Chicago, IL, USA) based on the Fisher’s LSD test in the one-way analysis of variance (ANOVA) program, taking p < 0.05 (*), p < 0.01 (**) and p < 0.001 (***) as significance levels.

3. Results

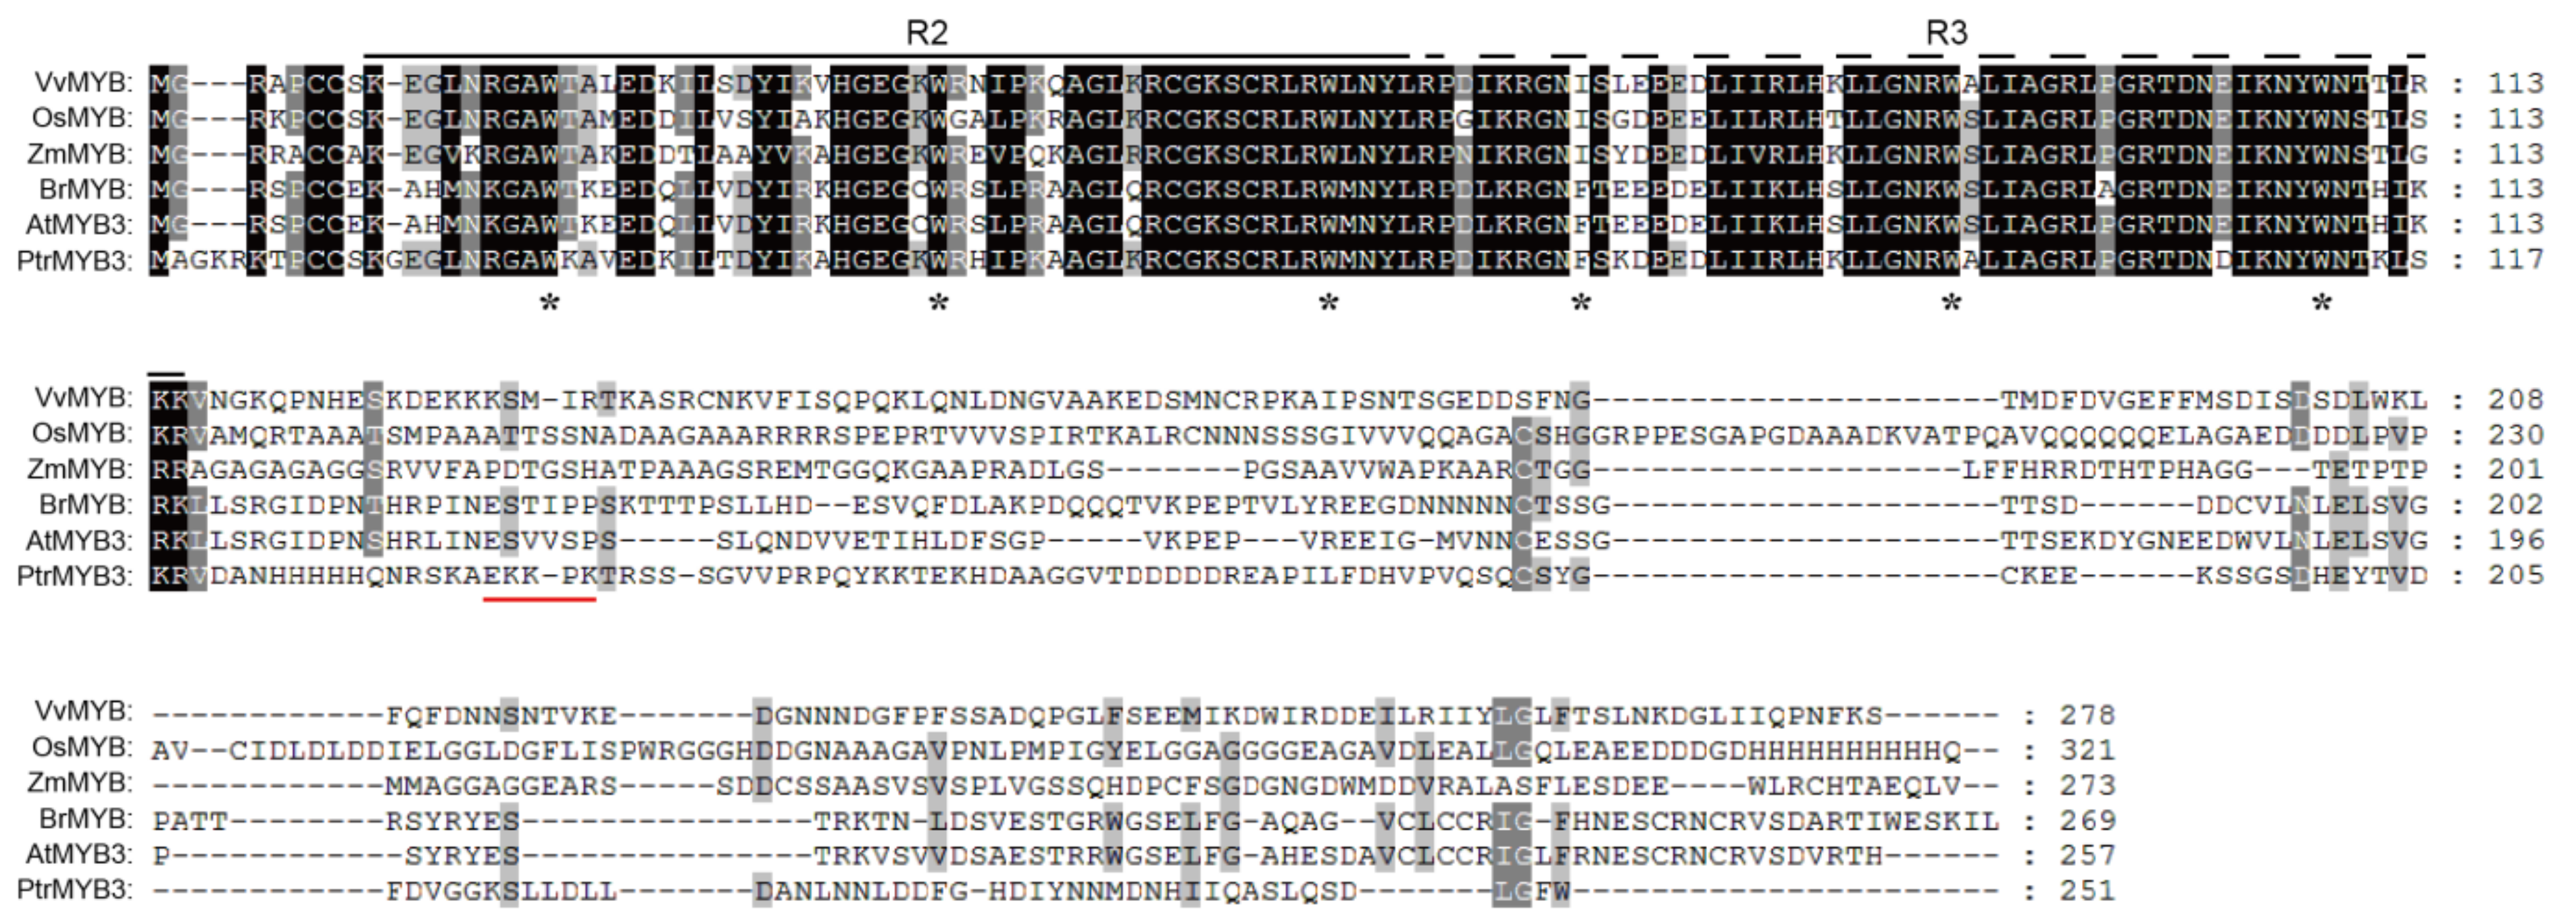
3.1. Cloning and Sequence Analysis of PtrMYB3

From our previous RNA-sequencing data [36], a gene (gene ID: Pt1g018990) was found significantly upregulated after salt stress treatment in trifoliate orange. To study this gene, we cloned its ORF (open reading frame) sequence, which was 756 bp encoding a putative protein of 251 amino acids (aa). By BLAST analysis in the Arabidopsis genome database, the protein sequence of this gene showed the highest identity with AtMYB3 (AT1G22640), and one R2R3-MYB transcription factor. The gene was designated as PtrMYB3 (Poncirus trifoliata MYB3). By sequence alignment with the homologous genes from other five plant species (Vitis vinifera, Oryza sativa, Zea mays, Brassica rapa, and Arabidopsis thaliana), PtrMYB3 was found possessing a conserved R2R3-MYB domain in the N-terminal region and a quite non-conservative C-terminal region (Figure 1). In addition, the N-terminal region of PtrMYB3 contained a short sequence of nuclear localization signal (NLS). Cloning and sequence analysis showed that PtrMYB3 is a typical R2R3-MYB transcription factor.

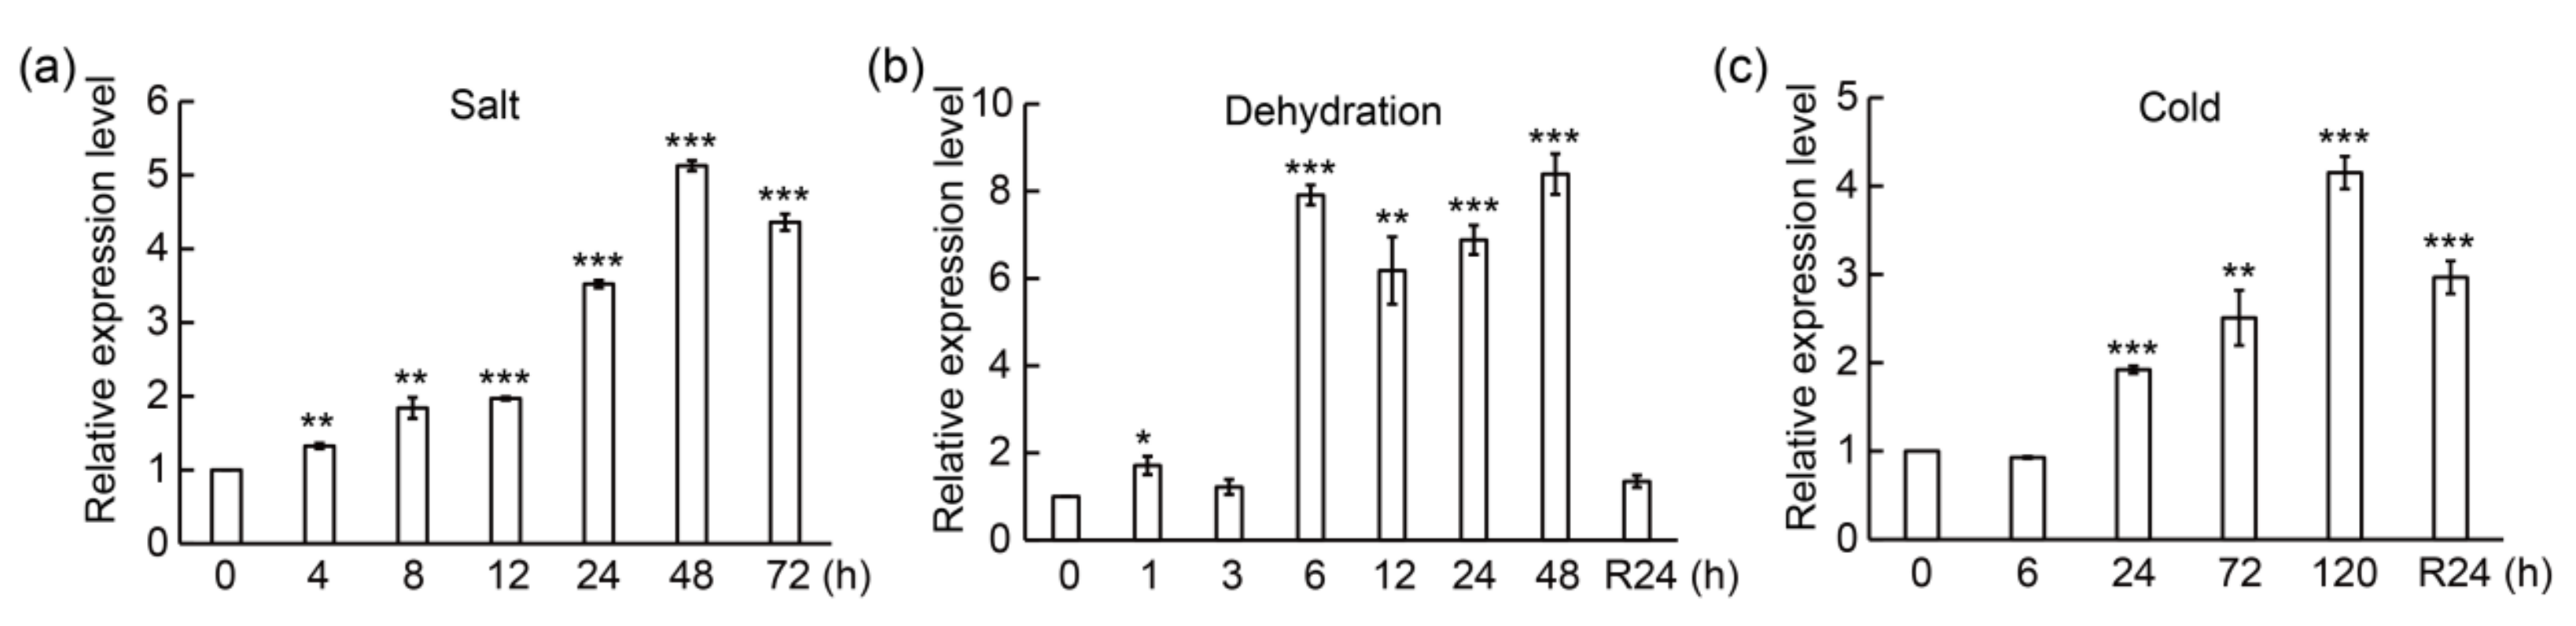
3.2. PtrMYB3 Is Induced by Multiple Abiotic Stresses

To ascertain the function of PtrMYB3, real-time quantitative PCR (qPCR) was used to measure the expression levels under abiotic stresses including salt, dehydration and cold. The results showed that the relative expression level of PtrMYB3 was continuously increased within 48 h of salt treatment (Figure 2a). Under dehydration treatment, the expression of PtrMYB3 was maintained stable during the first 3 h treatment, sharply reached the top at 6 h treatment, and reverted to the basal level after recovery treatment for 24 h (Figure 2b). Under cold stress, PtrMYB3 was gradually induced within the 120 h treatment, and then slightly decreased after recovery for 24 h (Figure 2c). These results reveal that PtrMYB3 can be induced by various abiotic stresses.

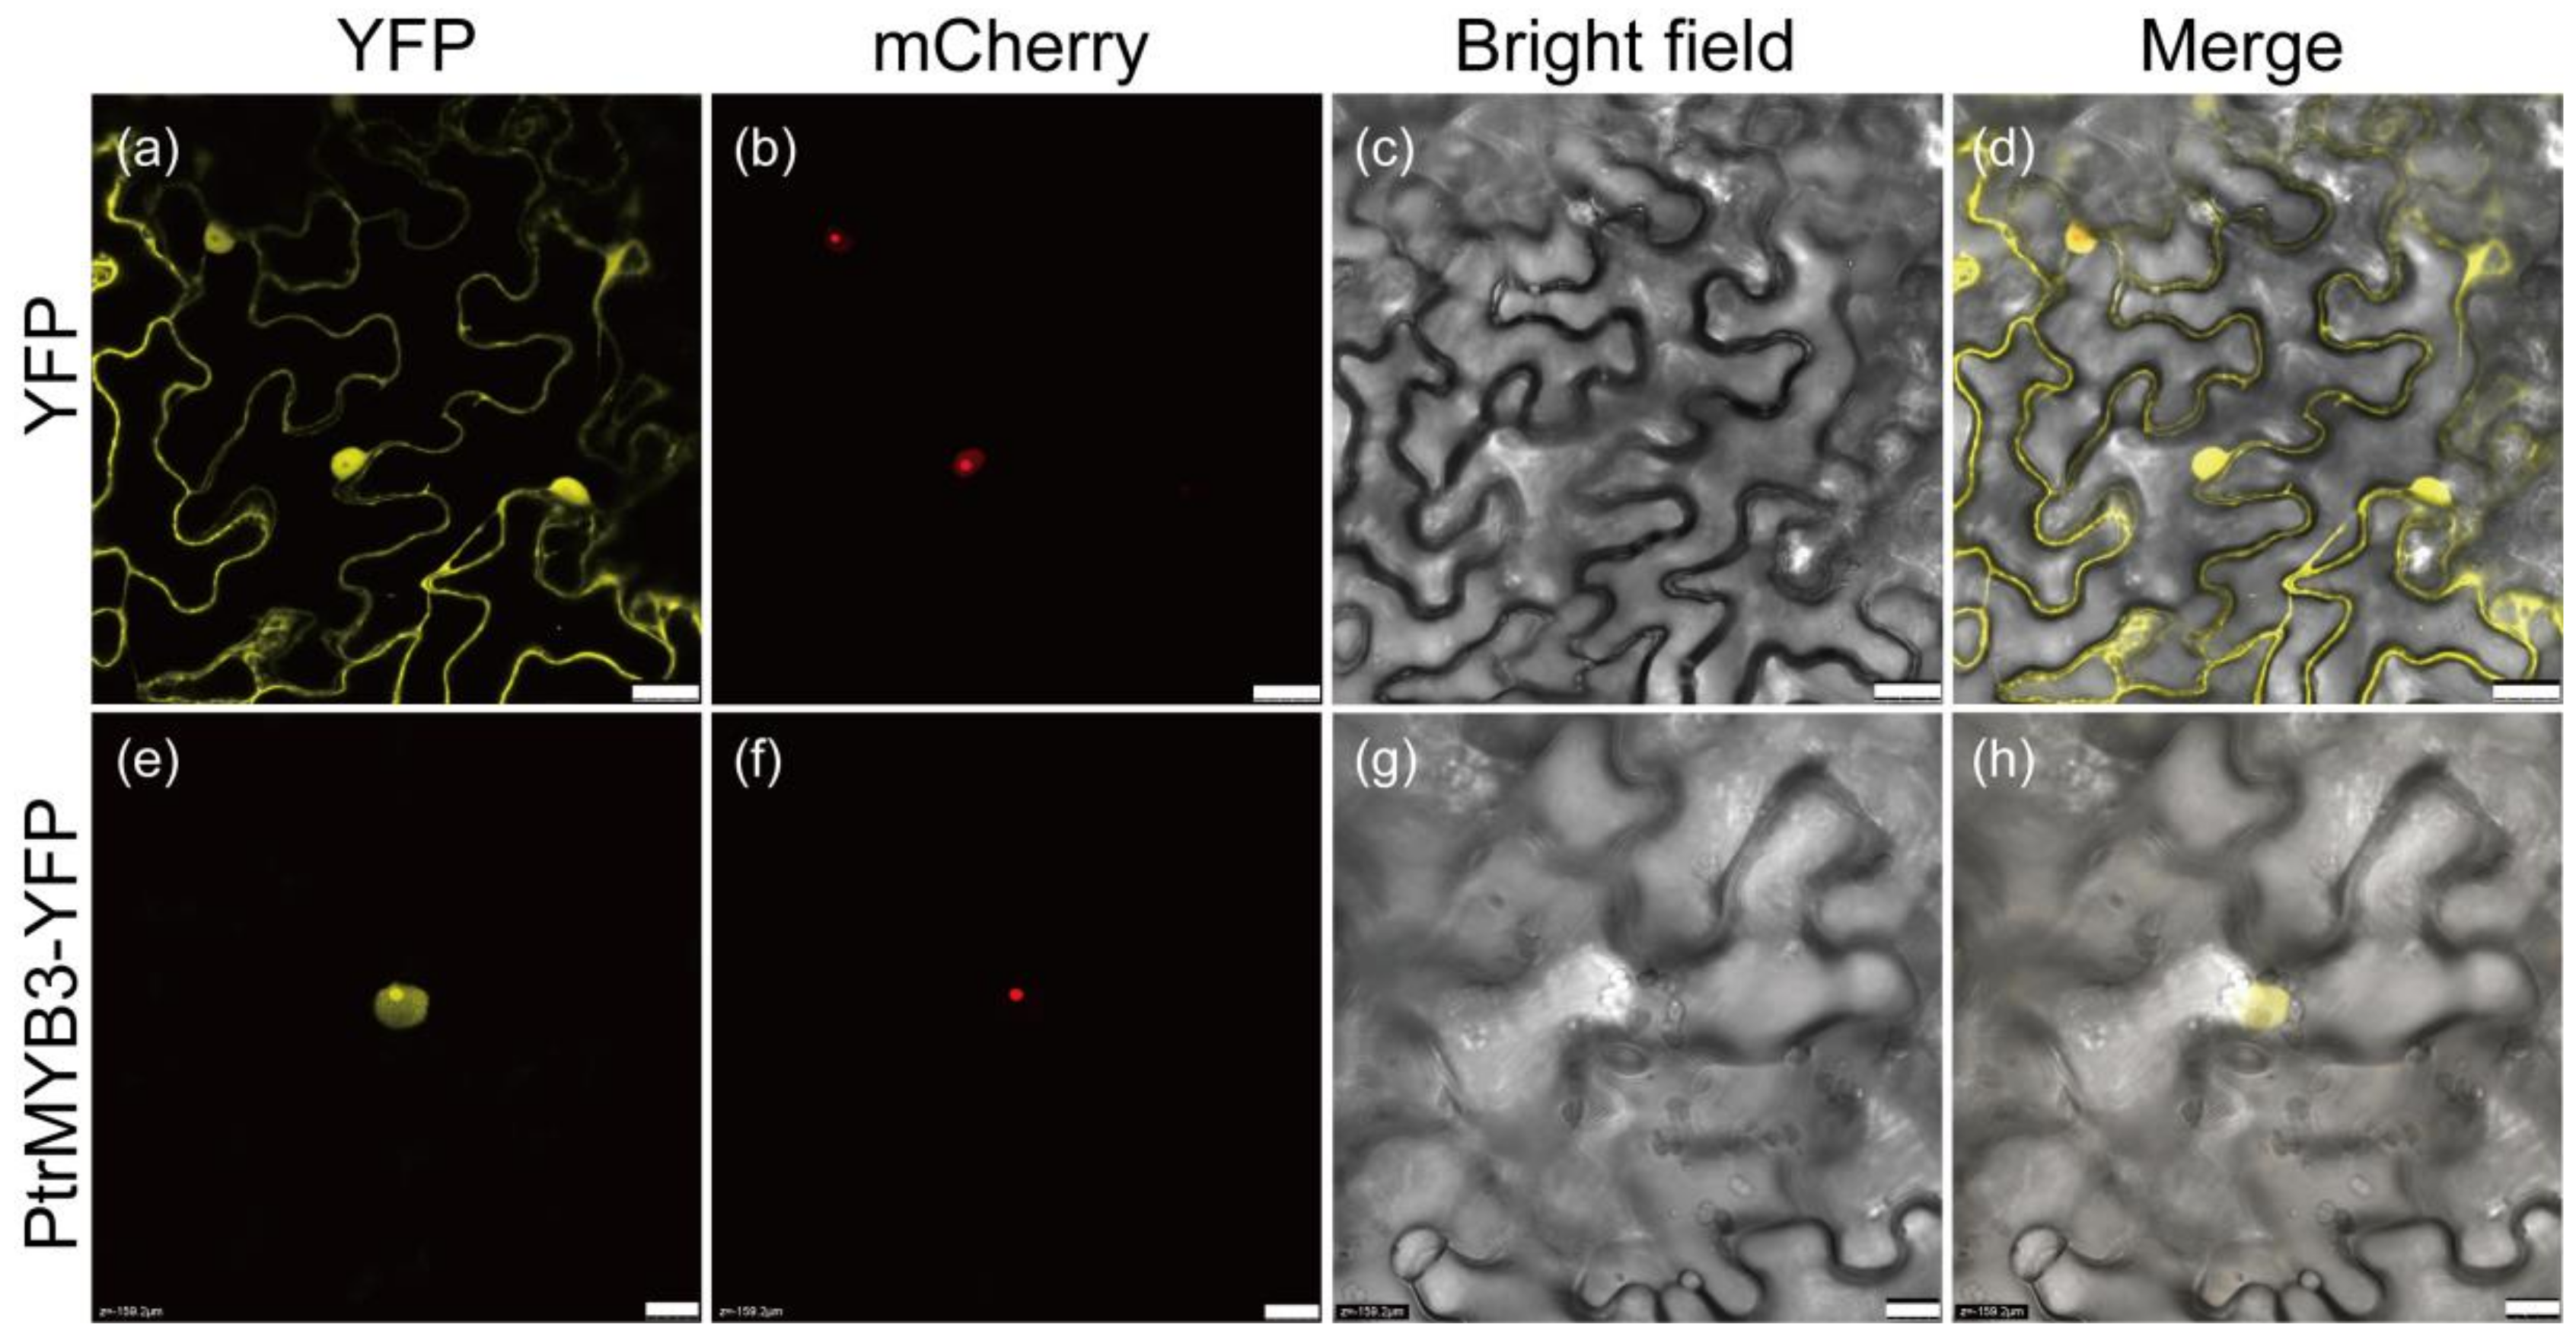
3.3. PtrMYB3 Is Localized to Nucleus

A nuclear localization signal was found in the N-terminal region of PtrMYB3 protein (Figure 1), suggesting that this protein might be localized to the nucleus. To test its subcellular localization, the full-length coding sequence of PtrMYB3 was fused to a yellow fluorescence protein (YFP) driven by the cauliflower mosaic virus 35S (CaMV35S) promoter. The fused protein (PtrMYB3-YFP), as well as the control unfused protein (YFP), was transiently expressed in the epidermal cells of tobacco leaves. One nuclear-localized marker gene fused to mCherry (with red fluorescence) was co-transformed. Observed in the imaging of the confocal microscopy, the yellow fluorescence signal of the fused protein (PtrMYB3-YFP) was exclusively detected in the nuclear, the same as the mCherry signal of the nuclear-localized marker gene, while the YFP signal of the unfused protein was found throughout the whole cell including the nucleus and cytoplasm (Figure 3), indicating that PtrMYB3 is a nuclear-localized protein.

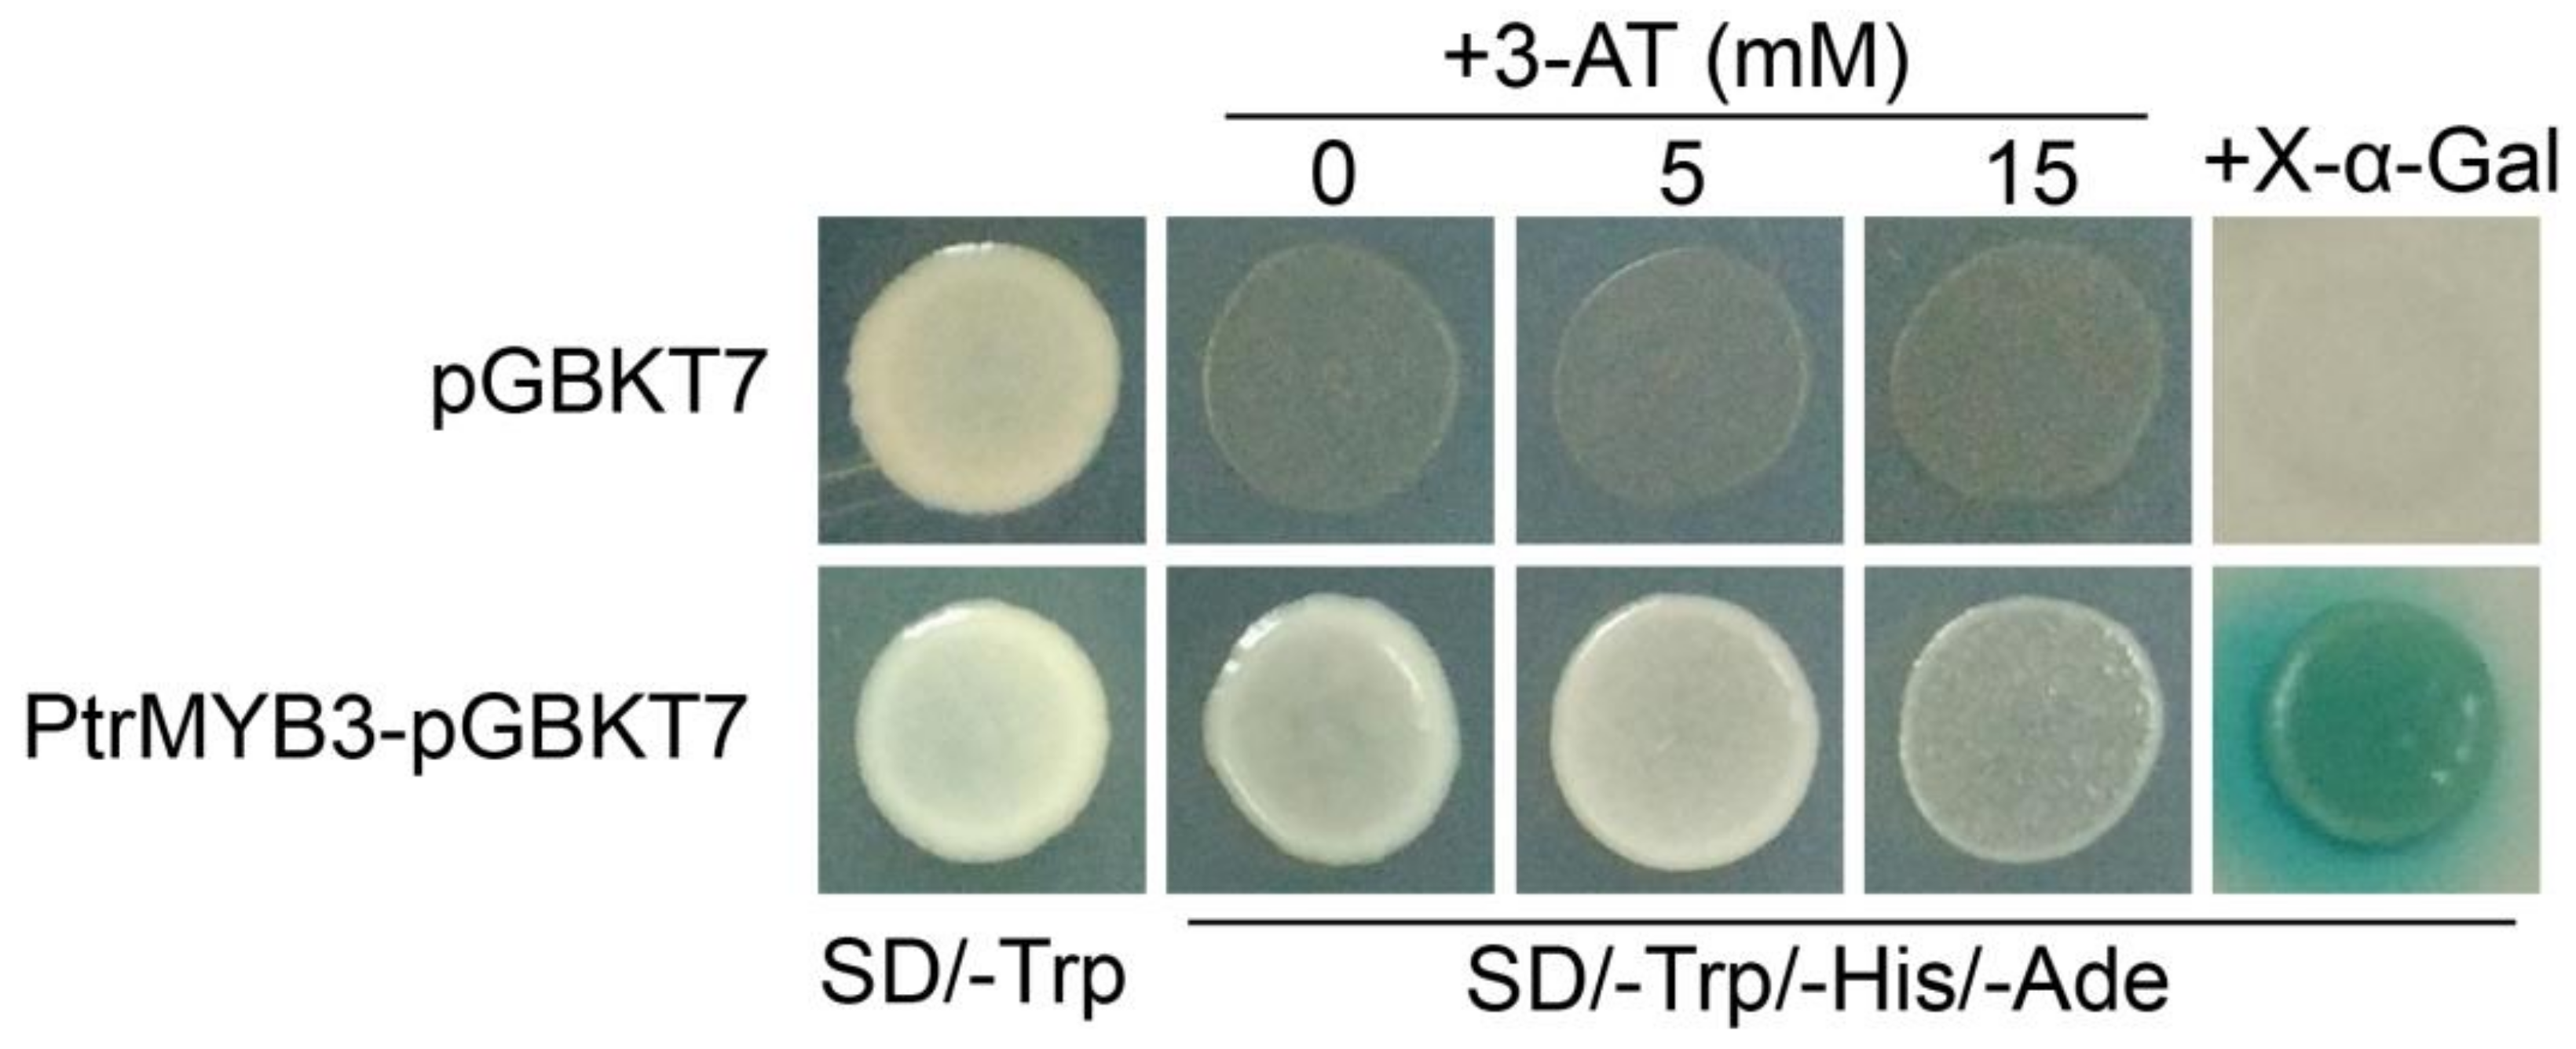
3.4. PtrMYB3 Has Transactivation Activity

As a transcription factor, possessing transactivation activity is a defining feature for PtrMYB3. To verify this, the full-length coding sequence of PtrMYB3 was fused to a GAL4 DNA-binding domain in the pGBKT7 vector, and the fused construct (PtrMYB3-pGBKT7), as well as the control empty vector (pGBKT7), was transformed separately into the yeast strain AH109, which carried reporter genes including ADE2, HIS3 and MEL1. The transactivation activity was tested by the observation of the yeast growth under selective growth mediums. The results showed that the yeast cells transformed either control vector (pGBKT7) or fused constructs (PtrMYB3-pGBKT7) could grow well on the SD/-Trp medium (Figure 4), indicating that the transformation system was reliable. On the selective SD/-Trp/-His/-Ade medium, only the yeast cells expressing PtrMYB3-pGBKT7 could survive, and the survived yeast colony turned blue when supplemented with X-α-Gal (Figure 4), indicating that PtrMYB3 transcription factor has transactivation activity.

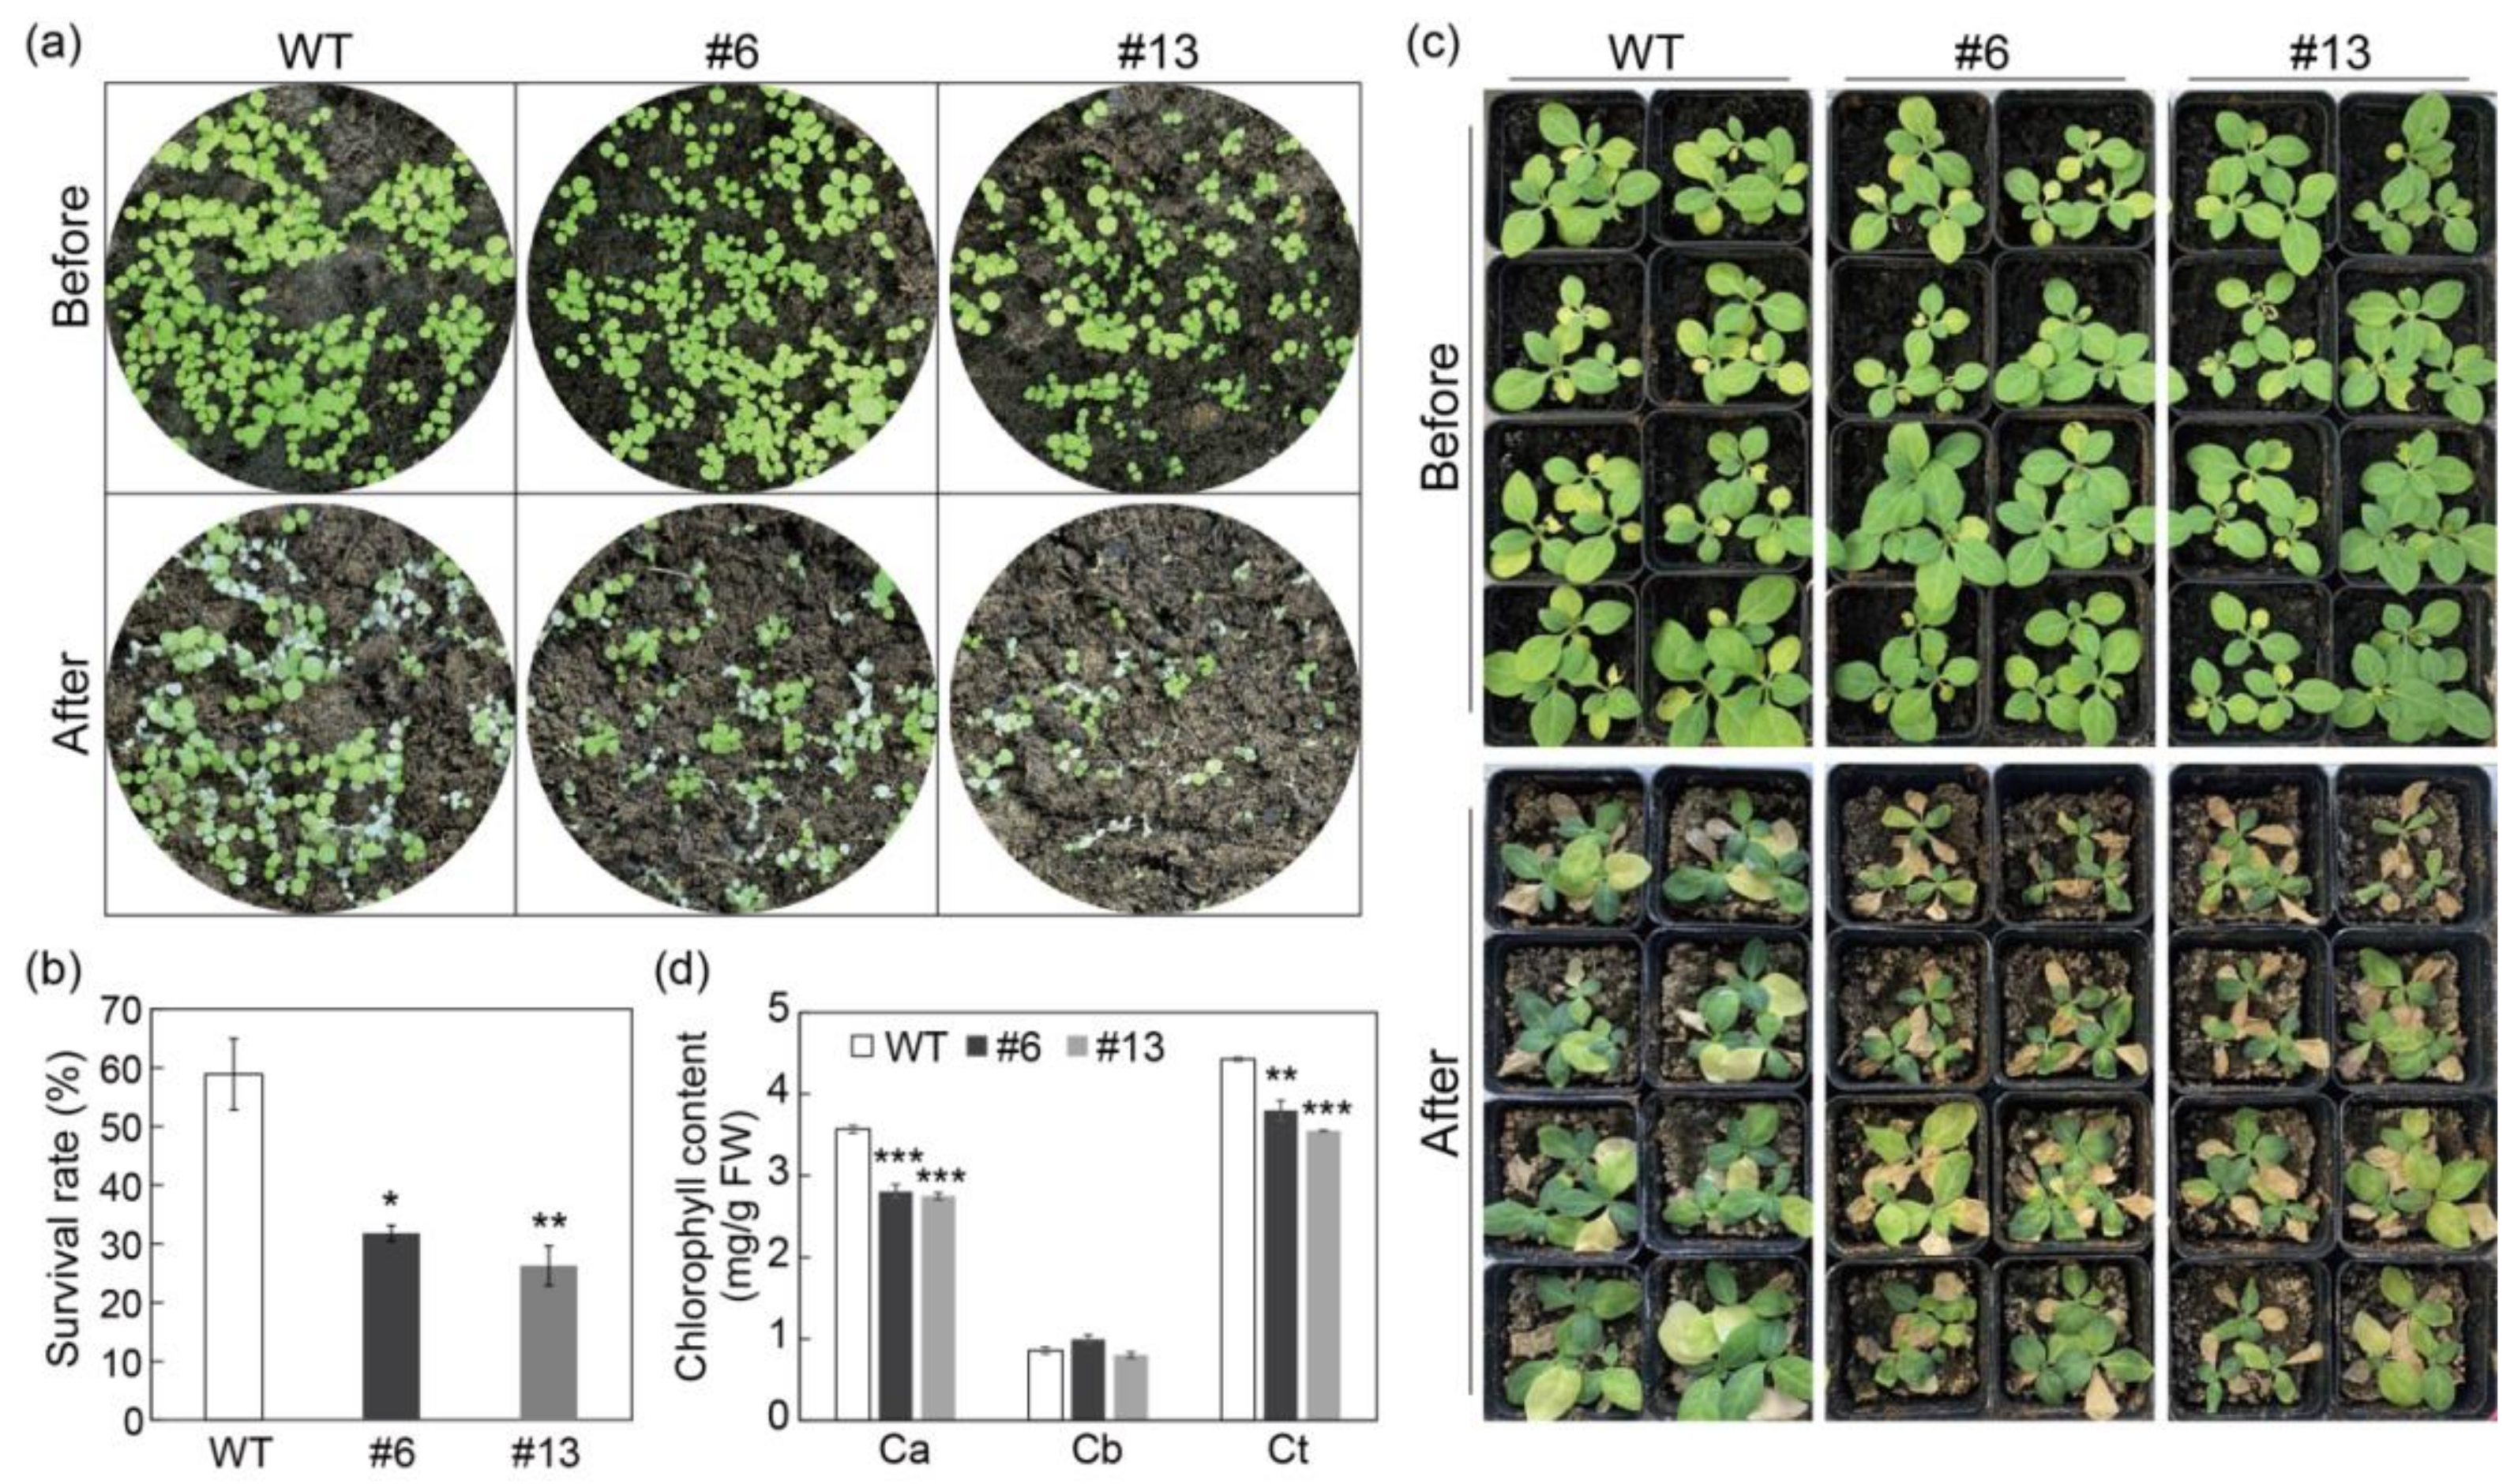
3.5. Overexpression of PtrMYB3 Impairs the Salt Tolerance of Tobacco

As PtrMYB3 was strongly induced by salt stress (Figure 2a), it was speculated to play a role in salt stress tolerance. To investigate its putative function, transgenic tobacco overexpressing PtrMYB3, under the control of CaMV35S promoter, was generated by Agrobacterium-mediated transformation (Figure S1a). Positive identification was conducted with two pairs of primers, and 14 transgenic tobacco lines were finally screened (Figure S1b), among which two lines (#6 and #13) showed significantly elevated expression of PtrMYB3 (Figure S1c). With the T2 generation of these two lines and one wild-type (WT) line, 7-day-old potted seedlings were conducted salt treatment by spraying 200 mM NaCl solution. Before treatment, there was no morphological difference between the transgenic lines and WT. After treatment, all lines had some dead plants with chlorosis phenotype, while this damage was visibly more severe in the transgenic plants in comparison with the WT plants (Figure 5a), with significantly lower survival rate in two transgenic lines than in the WT (Figure 5b). In addition, to further confirm the salt tolerance of adult plants, 40-day-old seedlings of transgenic lines and WT were used to perform salt treatment with 200 mM NaCl solution. Before stress treatment, no conspicuous difference was detected between the transgenic lines and WT. After stress, the two transgenic lines exhibited more serious leaf damage in comparison with the WT plants (Figure 5c), concomitant with significantly lower chlorophyll content (chlorophyll a and total) in two transgenic lines than in the WT (Figure 5d). These results indicate that overexpression of PtrMYB3 in tobacco impairs its salt tolerance.

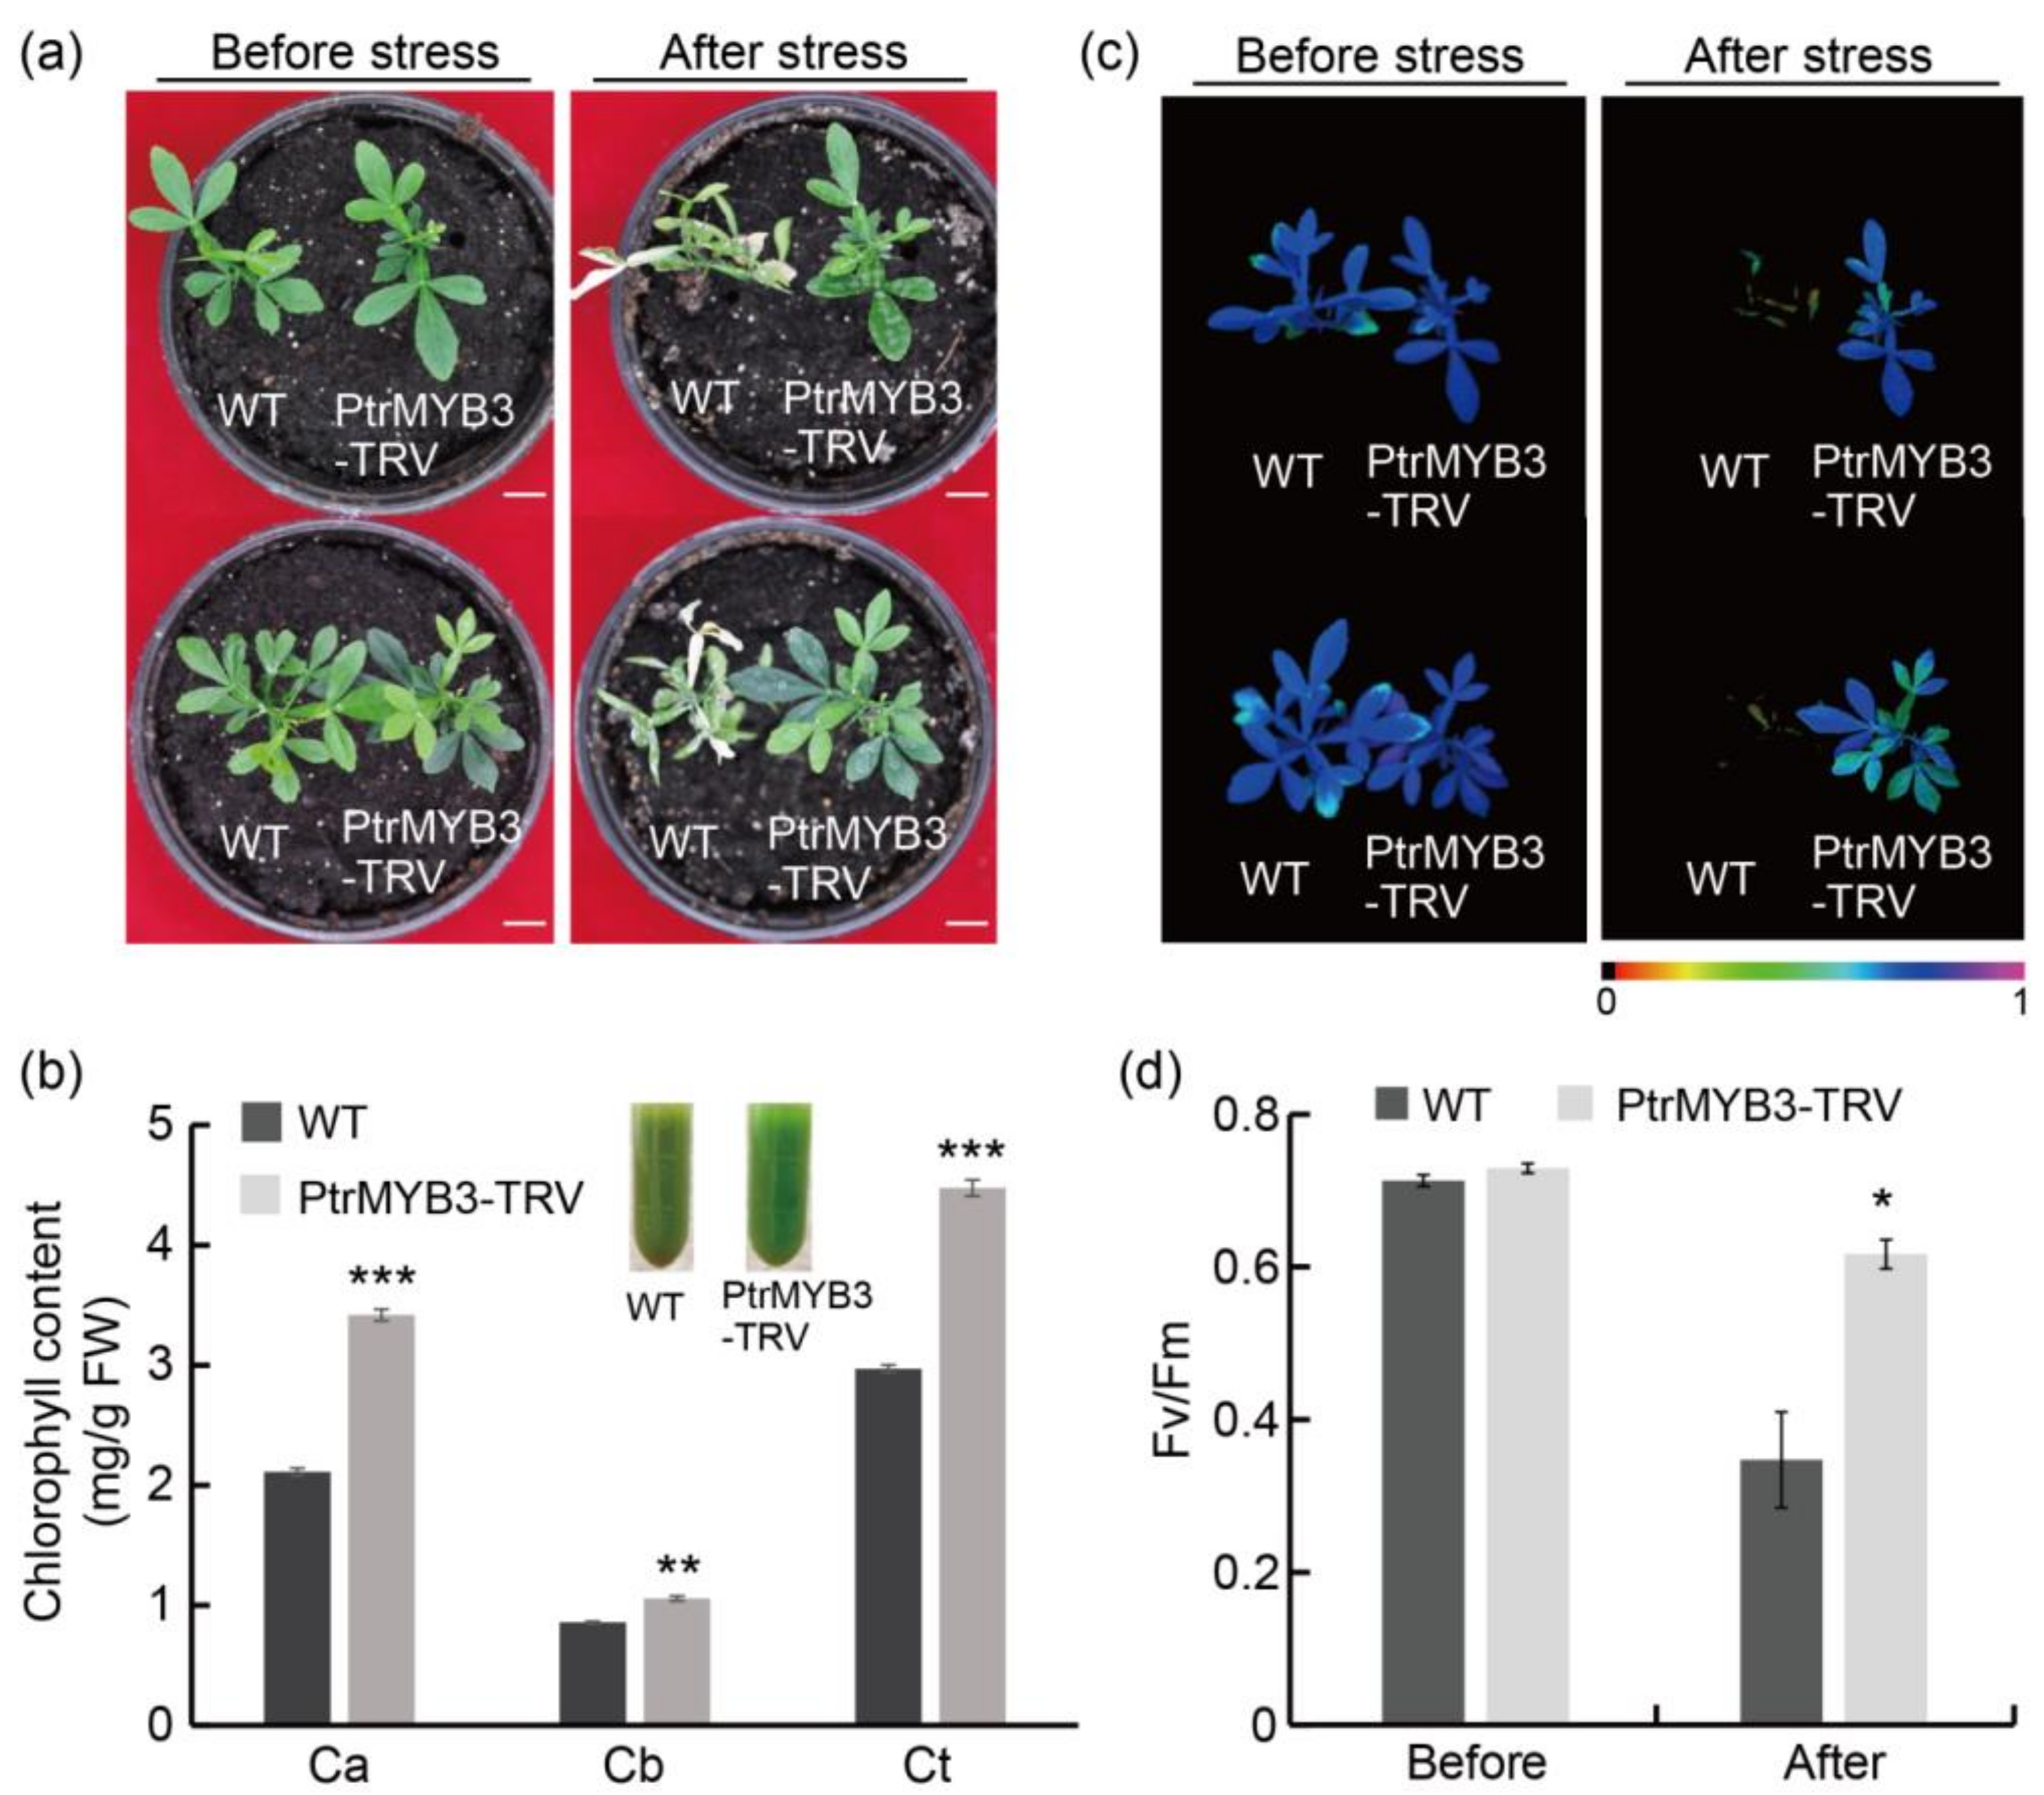
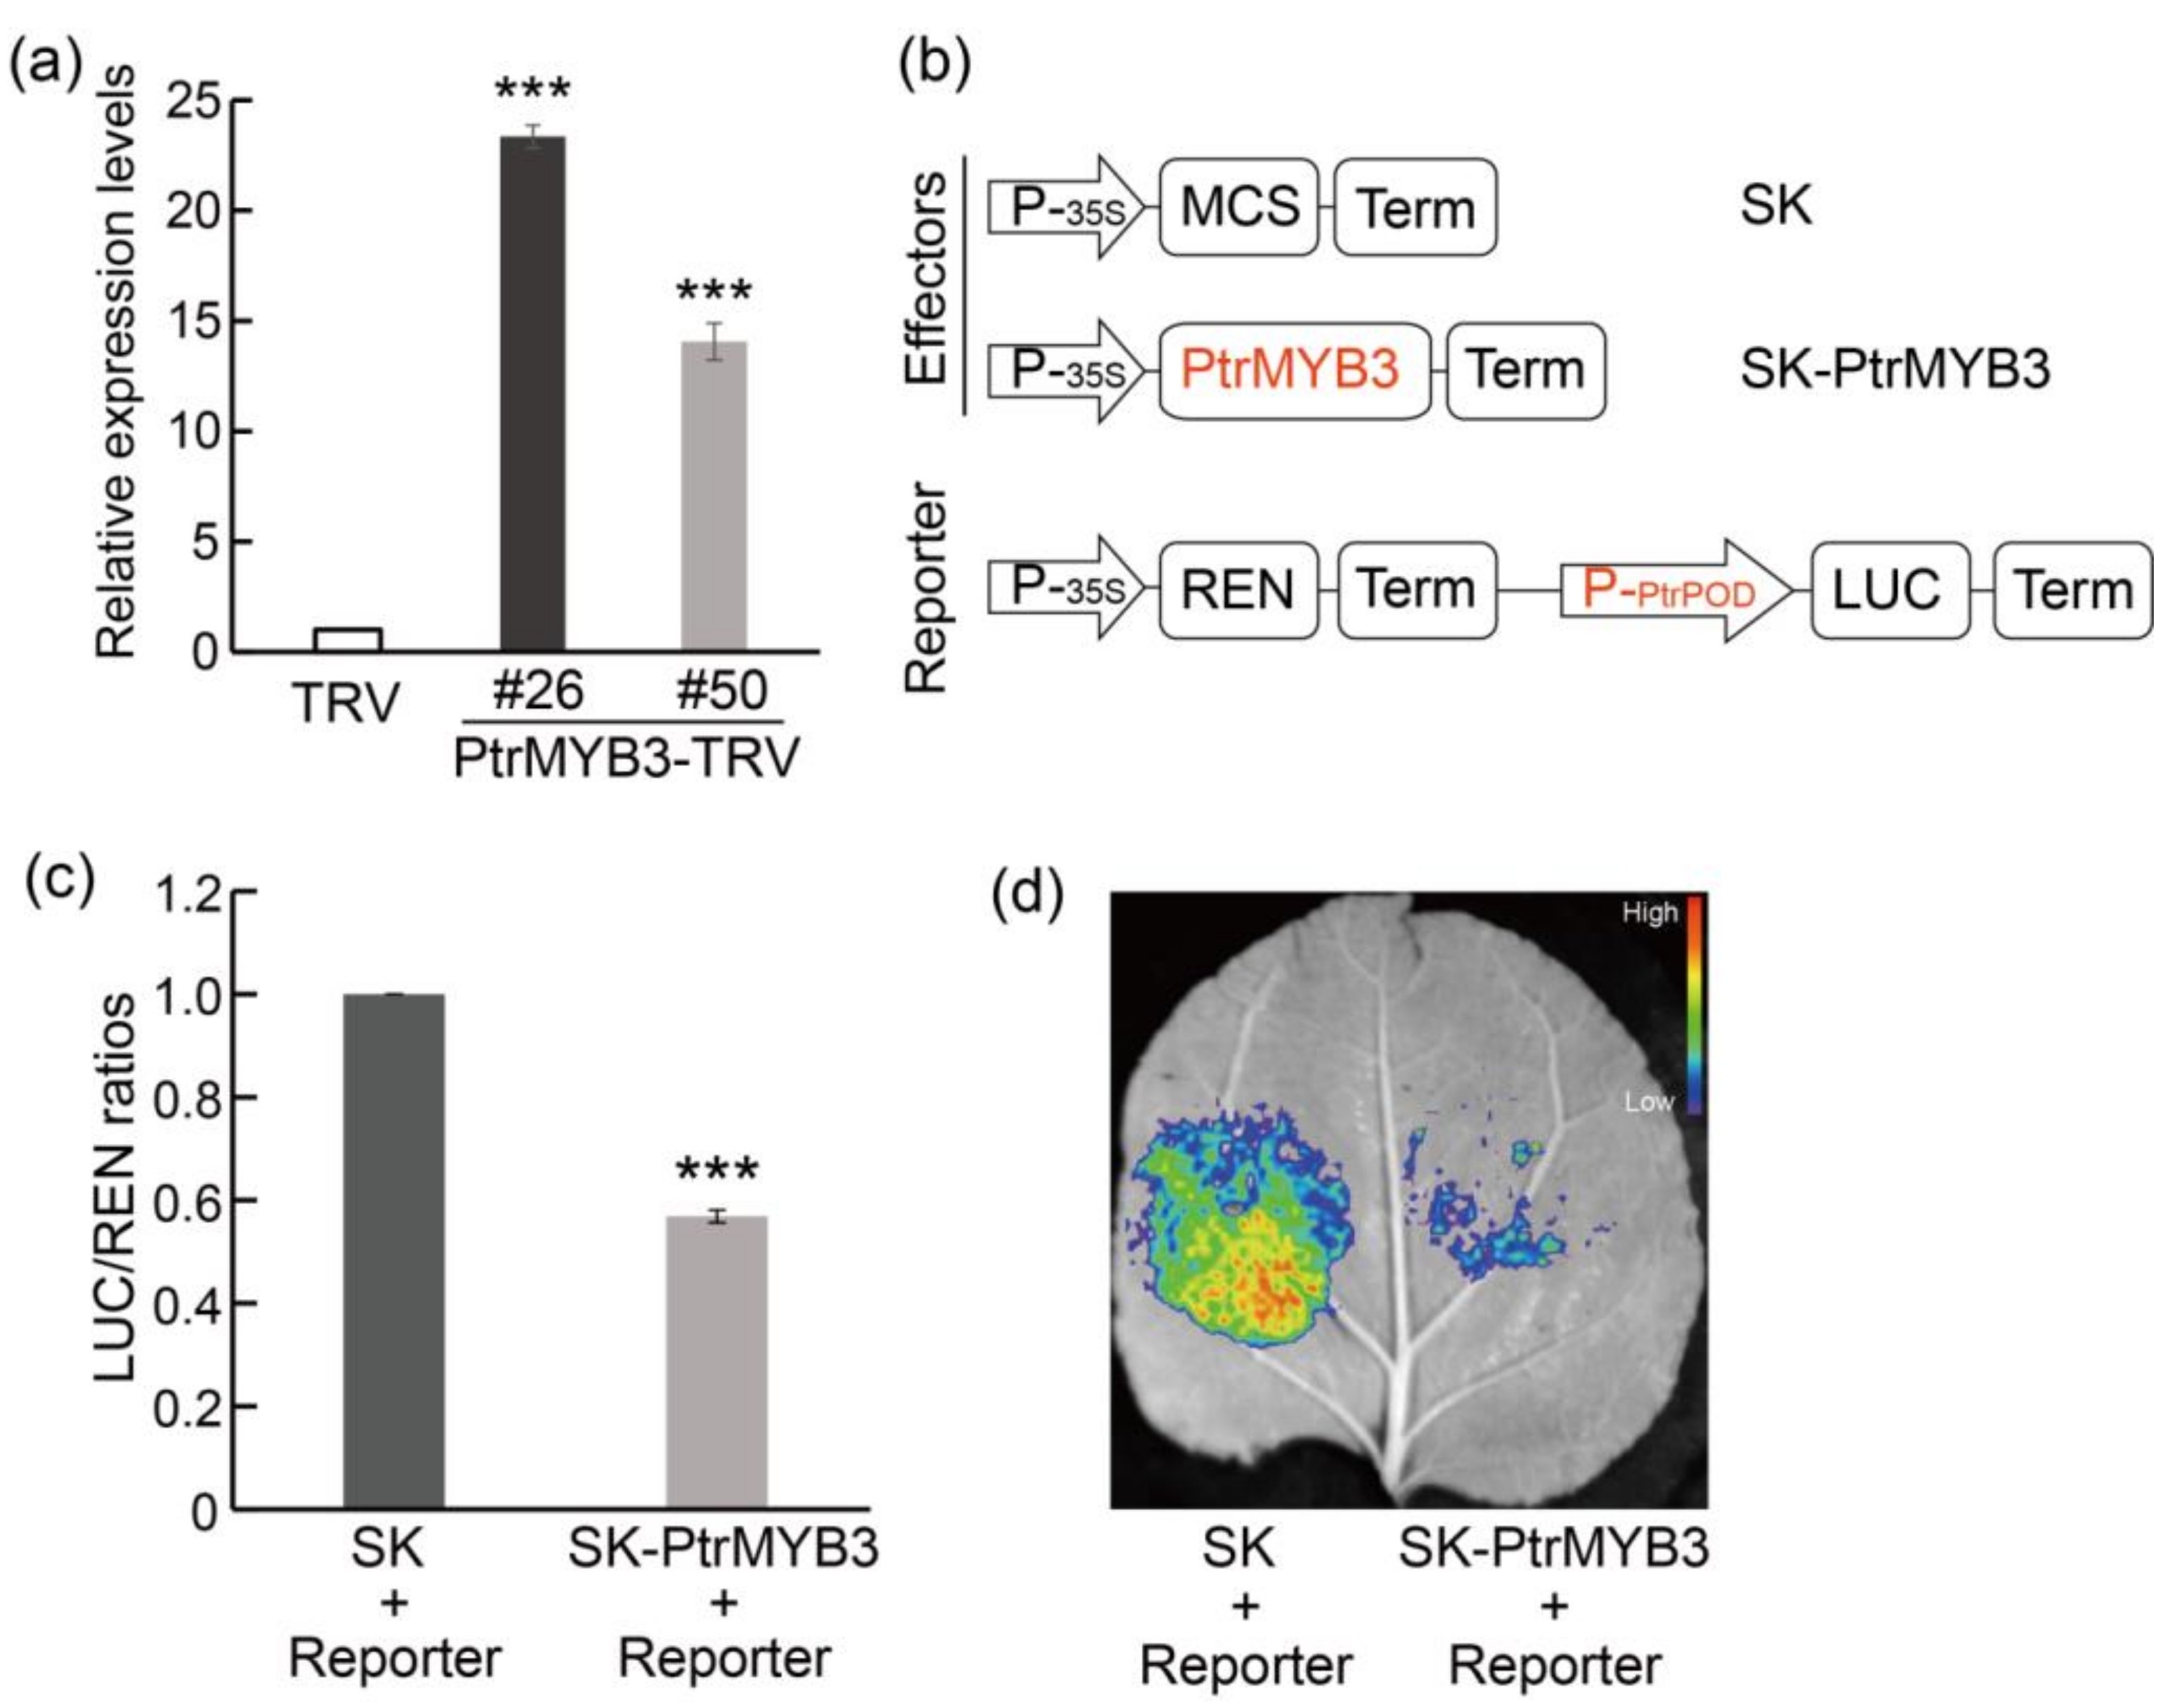
3.6. Silencing of PtrMYB3 in Trifoliate Orange Confers Enhanced Salt Tolerance

Overexpression of PtrMYB3 in tobacco confirmed the negatively regulated role of this gene in salt tolerance. To further verify this function, a virus-induced gene silencing (VIGS) system was employed to obtain PtrMYB3-silenced trifoliate orange seedlings (Figure S2a). Transcript abundance of PtrMYB3 in the silenced seedlings was repressed, to varying degrees, in comparison with the control seedlings (WT) (Figure S2b). With the obtained silenced seedlings (PtrMYB3-TRV) and WT, a salt stress assay was conducted by watering and spraying 300 mM NaCl solution. Before stress, the silenced seedlings and WT showed no morphological difference. However, after stress, WT leaves exhibited obviously wilting and yellowing while the silenced plants still grew well with totally green leaves (Figure 6a). Consistent with the morphological phenotype, chlorophyll (a, b and total) content in the leaves of silenced plants was significantly higher than that in the WT leaves (Figure 6b). In addition, chlorophyll fluorescence imaging, which could reflect the growth status by monitoring the photosynthesis, showed no difference between WT and the silenced lines before salt stress treatment, whereas after salt stress, WT plants exhibited more serious photosynthetic damage compared with the silenced plants (Figure 6c). Meanwhile, coupled with the chlorophyll fluorescence imaging, the maximum quantum efficiency of photosystem II (Fv/Fm) in silenced plants was significantly higher than that in WT plants after stress (Figure 6d). Taken together, these data demonstrate that silencing of PtrMYB3 in trifoliate orange confers enhanced salt tolerance, and PtrMYB3 is a negative regulator of salt tolerance.

3.7. PtrMYB3 Negatively Regulates the Expression of a Peroxidase Gene, PtrPOD

To study the underlying mechanism of PtrMYB3-regulated salt sensitivity, we examined the expression of the salt stress-related genes in PtrMYB3-silenced trifoliate orange, and a peroxidase gene (named as PtrPOD, ID: Pt6g017020) was finally found to be remarkably up-regulated in two PtrMYB3-silenced lines in comparison with the WT (Figure 7a). Peroxidase, which functions in eliminating excessive reactive oxygen species (ROS), plays a vital role in the stress tolerance of plants [41]. Therefore, it was speculated that PtrMYB3 might regulate salt sensitivity by negatively regulating the gene expression of PtrPOD. To verify this assumption, a dual-luciferase reporter system was employed by constructing “Effector” (SK-PtrMYB3 or SK) and “Reporter” (inserting PtrPOD promoter upstream the LUC reporter gene) (Figure 7b). Both the effector and the reporter were co-expressed transiently in tobacco leaves, and the promoter activity of PtrPOD with or without PtrMYB3 was tested by the measurement of a relative LUC/REN ratio. The results showed that the LUC/REN ratio was significantly lower in the presence of PtrMYB3 than the control without PtrMYB3 (Figure 7c), indicating that the presence of PtrMYB3 can suppress the promoter activity of PtrPOD. Consistent with the LUC/REN ratio, in vivo fluorescence imaging showed an obviously weaker fluorescence when PtrMYB3 was expressed than when PtrMYB3 was absent (Figure 7d). These data reveal that PtrMYB3 serves as a negative regulator and can suppress the expression of PtrPOD.

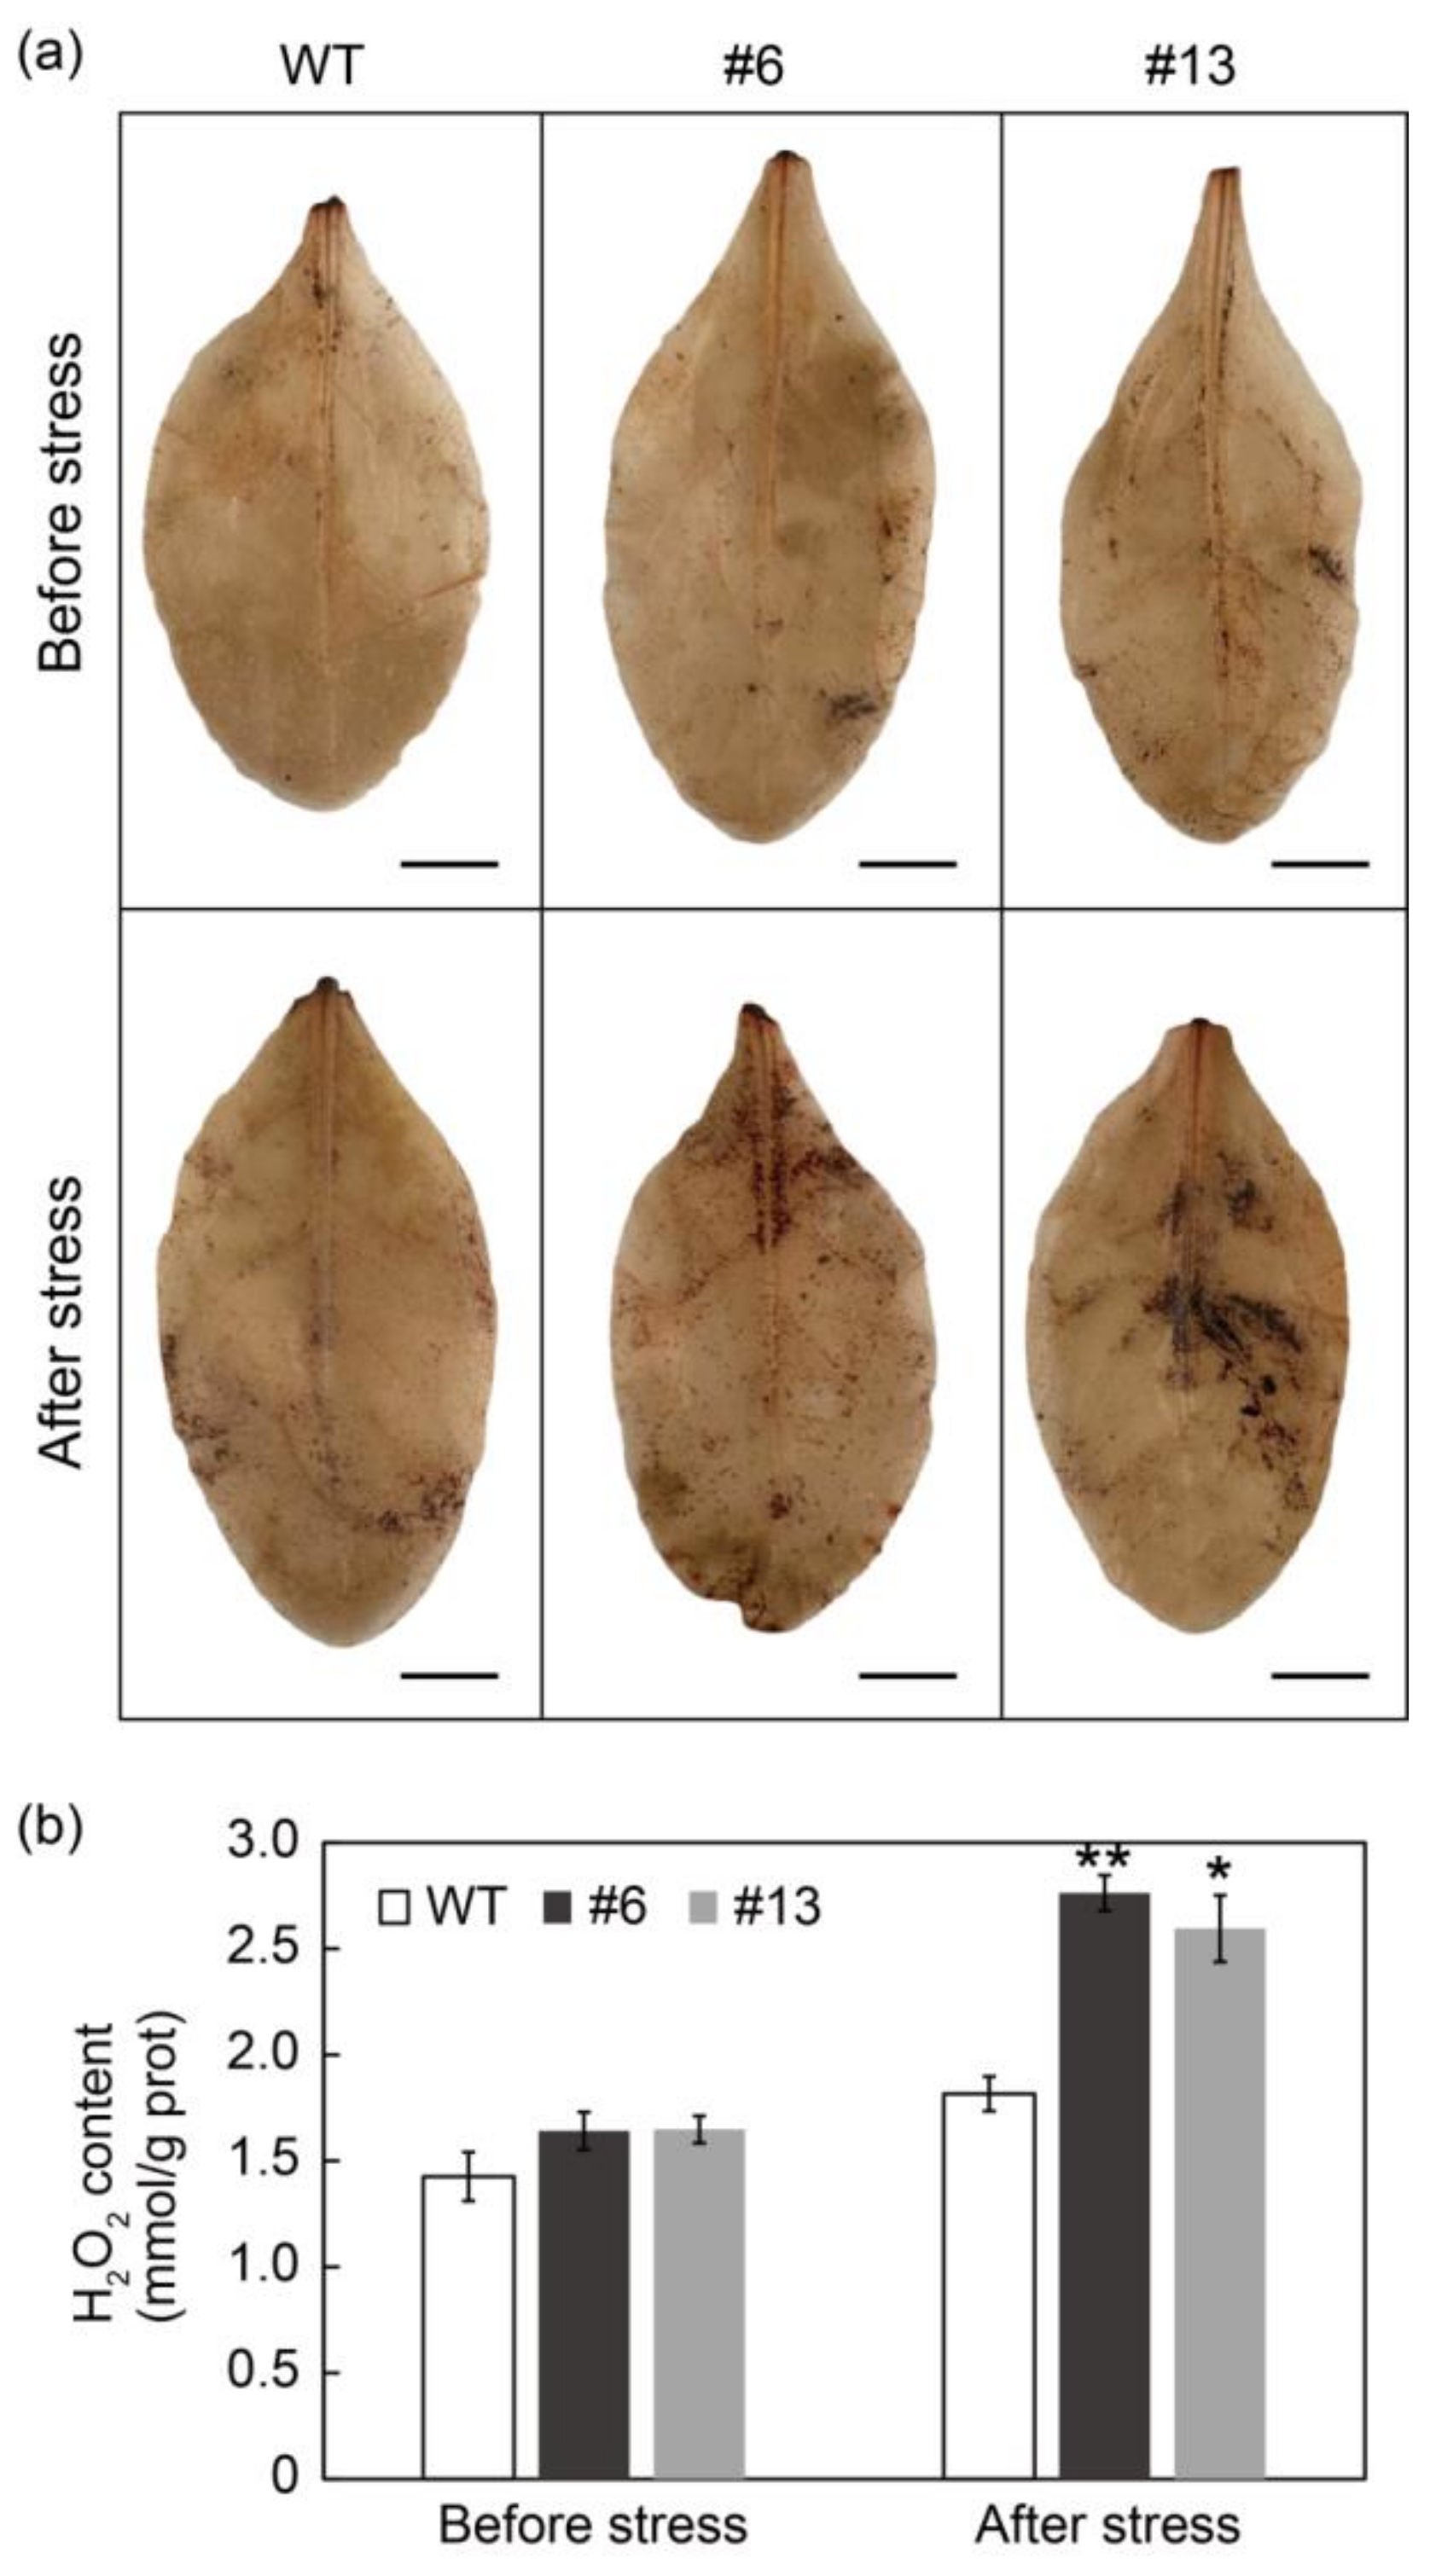
3.8. PtrMYB3 Transgenic Tobacco Plants Accumulated Excess H2O2 after Salt Stress

As PtrPOD-encoded peroxidase functions in the scavenging of H2O2 under abiotic stresses, the H2O2 accumulation in transgenic tobacco plants overexpressing PtrMYB3 was examined before and after salt stress (Figure 8). In situ H2O2 staining with 3,3′-diaminobenzidine (DAB) showed that the leaves of transgenic lines (#6 and #13) and WT both had no staining before salt stress, while transgenic lines had obviously darker and more extensive staining than the WT after salt stress (Figure 8a), indicating that PtrMYB3 transgenic plants accumulated more H2O2 than the WT after salt stress. Further quantitative measurement of H2O2 in the leaves of transgenic tobacco plants and WT presented the same results, which showed that the H2O2 content in the transgenic lines and WT had no significant differences before salt stress, while after stress, H2O2 content was increased in all tobacco plants, and the two transgenic lines had significantly higher content than the WT (Figure 8b). These results demonstrate that transgenic tobacco plants overexpressing PtrMYB3 accumulate excess H2O2 after salt stress.

4. Discussion

Salt stress can generate osmotic stress, ion toxicity and oxidative stress, resulting in severe damage to plants [2]. Trifoliate orange is one of the most commonly used rootstocks in citrus, but its extensive application is limited by the salt sensitivity [34,35]. It is of great significance to study the mechanisms underlying the responses of trifoliate orange to salt stress, mainly by discovering important responsive genes and revealing their functions in salt tolerance. The MYB transcription factors, which are widely present in plants, participate in a variety of physiological processes in plant life [10]. Increasing studies have shown that MYB transcription factors are also involved in the response to abiotic stresses [4,10,42]. In this study, a gene encoding R2R3-MYB transcription factor, designated as PtrMYB3, was cloned from trifoliate orange, and functional analyzing indicated that this gene negatively regulated salt tolerance. This study can help us better understand the response mechanisms of trifoliate orange to salt stress.

4.1. PtrMYB3 Is Induced by Various Stresses

Through the expression profiling under different abiotic stresses, PtrMYB3 was found to be able to be induced by salt, dehydration, and cold stresses, indicating that this gene may be involved in a variety of stress responses. In this study, we have shown that this gene is involved in salt stress, so the next step is to investigate whether it is also involved in dehydration and cold stresses. Previous studies also indicated that one same MYB transcription factor could be involved in multiple abiotic stresses simultaneously [4,26]. For example, ZmMYB3R was found to be involved in both drought and salt stresses in maize (Zea mays L.) [13]. MYB3R from wheat (Triticum aestivum L.) functioned in drought, salt and cold stresses [26]. Two MYB transcription factors from rose (Rosa rugosa) were identified involved in both mechanical injury and oxidative stress [43]. This may be explained by the interconnection between different stresses. When a MYB transcription factor simultaneously regulates multiple stress responsive genes, or regulates a gene functioning in multiple stresses, this MYB transcription factor will be able to participate in the responses of multiple stresses. In this study, we found that PtrMYB3 could regulate PtrPOD, a gene encoding an antioxidant enzyme, which plays a role in a variety of abiotic stresses [44]. Therefore, it is reasonable that PtrMYB3 may function in a variety of abiotic stresses, but more experiments need to be carried out to verify this hypothesis.

4.2. PtrMYB3 Negatively Regulates Salt Tolerance

The involvement of MYB transcription factors in response to abiotic stresses has been extensively reported [4], especially in the past decade, with the completion of genome sequencing of many plant species. A large number of MYB transcription factors have been discovered, and their roles in abiotic stresses have been investigated well. In these studies, most MYB transcription factors are involved in stress responses as positive regulators, which play a positive role in salt tolerance [14,18,45], while few negative regulators have been discovered. In previous reports, some MYB transcription factors were found negatively regulating fruit color [46] and fruit ripening [47,48], but few were found in abiotic stresses, except for one MYB transcription factor identified from rice which negatively regulated cold tolerance [49]. In this study, one R2R3-MYB transcription factor (PtrMYB3) was identified from trifoliate orange as a negative regulator for salt tolerance, which is meaningful for the studies on transcriptional regulation of abiotic stresses.
Transcription factors can be classified into two types: activator and repressor, which play positive and negative regulatory roles on downstream genes respectively [3]. The transcription activator is positively correlated with the expression of downstream genes, and plays the same functions as downstream genes. In contrast, the transcription repressor is negatively correlated with downstream gene expression and plays a possible role in reducing gene expression in order to avoid the possible adverse effect of overexpression. In this study, we found that PtrMYB3 negatively regulates the salt tolerance of trifoliate orange, suggesting that PtrMYB3 might play a role in balancing gene expression and salt tolerance. To be specific, at the early stage of salt stress, a series of responsive genes are induced which might generate the opposite effects on plants. In this situation, transcription repressors can play a crucial role by decreasing the expression of some responsive genes. After stress for a long time, the salt responsive genes are still maintained in a state of high expression that will inevitably cause adverse effects, so transcription repressors are required to orchestrate a dynamic expression for most genes. In this study, PtrMYB3 was found to be up-regulated at the early stage of salt stress, indicating that PtrMYB3 works as a repressor by suppressing early salt-responsive genes, including PtrPOD, causing salt sensitivity of trifoliate orange, which is generally considered as a salt-sensitive species in citrus. In a word, transcription repressors are also very significant players for governing plant responses to the abiotic stresses.

4.3. PtrMYB3 Regulates PtrPOD-Mediated H2O2 Accumulation

In this study, PtrPOD expression was found to be significantly increased when PtrMYB3 was silenced in trifoliate orange, and the dual-luciferase (LUC) assay further confirmed that PtrMYB3 could suppress the expression of PtrPOD promoter (Figure 7), suggesting that PtrMYB3 can regulate PtrPOD expression. PtrPOD encodes peroxidase (POD), which is an important antioxidant enzyme functioning in scavenging excessive reactive oxygen species (ROS) accumulated in abiotic stresses [44]. ROS, such as H2O2, O2•−, NO, work as intracellular signaling molecules in an appropriate concentration range. However, under abiotic stresses, ROS will accumulate sharply, resulting in oxidative stress, which will finally have harmful effects on plant growth [41]. The function of POD in moderating excessive ROS accumulation has been well studied, but the transcriptional regulatory mechanism has not been thoroughly studied. In recent years, some transcription factors have been proved to be able to directly bind to the POD promoter to positively regulate its expression under abiotic stresses, such as bHLH18 [32], ERF109 [31], ABF [33], and PtrbHLH [50]. These findings revealed the function of the “transcription factors-POD” regulatory module in abiotic stresses. However, the negative regulators of POD have not been reported yet. The PtrMYB3, found in this study as a rare transcriptional repressor regulating POD, will greatly enrich the transcriptional regulatory network of POD. As the H2O2 accumulation in transgenic tobacco plants overexpressing PtrMYB3 was found significantly increased after salt stress in comparison with the WT (Figure 8), we conclude that PtrMYB3 negatively regulates the expression of the POD gene, inhibits peroxidase-mediated H2O2 scavenging, leads to excess accumulation of H2O2, and finally impairs the salt tolerance of plants.

5. Conclusions

In this study, a MYB transcription factor, PtrMYB3, was identified from trifoliate orange, and its function in salt tolerance was investigated. Studies showed that PtrMYB3 was a typical R2R3-MYB transcription factor, and could be induced by salt, dehydration and cold stresses. Overexpression of PtrMYB3 in tobacco conferred impaired salt tolerance and, by contrast, silencing of this gene by VIGS in trifoliate orange conferred enhanced salt tolerance, indicating that PtrMYB3 negatively regulated salt tolerance. Additionally, a peroxidase gene (PtrPOD) was identified as the potential target gene of PtrMYB3, and PtrMYB3 could negatively regulate salt tolerance, at least in part, through the regulation of PtrPOD-mediated ROS scavenging.

Supplementary Materials

The following documents are available online at https://www.mdpi.com/article/10.3390/antiox10091388/s1. Figure S1: Genetic transformation and molecular identification of PtrMYB3 overexpressed tobacco plants. Figure S2: Molecular identification of PtrMYB3-silenced Poncirus trifoliata plants by genomic PCR and qPCR. Table S1: Primer sequences used in this study.

Author Contributions

Data curation, T.W.; Funding acquisition, D.G. and J.L.; Investigation, T.W.; Methodology, T.W. and D.G.; Project administration, J.L.; Supervision, J.L.; Validation, D.G.; Visualization, T.W.; Writing-original draft, T.W.; Writing-review and editing, J.L. All authors have read and agreed to the published version of the manuscript.

Funding

The work is supported by National Key Research and Development Program of China (2018YFD1000300), The National Natural Science Foundation of China (31772273, U1904113), Hubei Provincial Natural Science Foundation for Innovative Group (2017CFA018), and Program for Innovative Research Team (in Science and Technology) in University of Henan Province (21IRTSTHN021).

Institutional Review Board Statement

Not applicable.

Informed Consent Statement

Not applicable.

Data Availability Statement

Data are contained within the article and supplementary material.

Conflicts of Interest

The authors declare that they have no conflict of interest.

References

  1. van Zelm, E.; Zhang, Y.; Testerink, C. Salt tolerance mechanisms of plants. Annu. Rev. Plant Biol. 2020, 71, 403–433. [Google Scholar] [CrossRef] [PubMed] [Green Version]
  2. Zhu, J.-K. Abiotic stress signaling and responses in plants. Cell 2016, 167, 313–324. [Google Scholar] [CrossRef] [Green Version]
  3. Liu, J.-H.; Peng, T.; Dai, W. Critical cis-acting elements and interacting transcription factors: Key players associated with abiotic stress responses in plants. Plant Mol. Biol. Rep. 2014, 32, 303–317. [Google Scholar] [CrossRef]
  4. Li, C.; Ng, C.K.Y.; Fan, L.-M. MYB transcription factors, active players in abiotic stress signaling. Environ. Exp. Bot. 2015, 114, 80–91. [Google Scholar] [CrossRef]
  5. Prouse, M.B.; Campbell, M.M. The interaction between MYB proteins and their target DNA binding sites. Biochim. Biophys. Acta 2012, 1819, 67–77. [Google Scholar] [CrossRef]
  6. Chen, Y.; Yang, X.; He, K.; Liu, M.; Li, J.; Gao, Z.; Lin, Z.; Zhang, Y.; Wang, X.; Qiu, X.; et al. The MYB transcription factor superfamily of Arabidopsis: Expression analysis and phylogenetic comparison with the rice MYB family. Plant Mol. Biol. 2006, 60, 107–124. [Google Scholar] [CrossRef]
  7. Wilkins, O.; Nahal, H.; Foong, J.; Provart, N.J.; Campbell, M.M. Expansion and diversification of the Populus R2R3-MYB family of transcription factors. Plant Physiol. 2009, 149, 981. [Google Scholar] [CrossRef] [PubMed] [Green Version]
  8. Du, H.; Yang, S.-S.; Liang, Z.; Feng, B.-R.; Liu, L.; Huang, Y.-B.; Tang, Y.-X. Genome-wide analysis of the MYB transcription factor superfamily in soybean. BMC Plant Biol. 2012, 12, 106. [Google Scholar] [CrossRef] [Green Version]
  9. Liu, C.; Wang, X.; Xu, Y.; Deng, X.; Xu, Q. Genome-wide analysis of the R2R3-MYB transcription factor gene family in sweet orange (Citrus sinensis). Mol. Biol. Rep. 2014, 41, 6769–6785. [Google Scholar] [CrossRef]
  10. Ambawat, S.; Sharma, P.; Yadav, N.R.; Yadav, R.C. MYB transcription factor genes as regulators for plant responses: An overview. Physiol. Mol. Biol. Plants 2013, 19, 307–321. [Google Scholar] [CrossRef] [Green Version]
  11. Dubos, C.; Stracke, R.; Grotewold, E.; Weisshaar, B.; Martin, C.; Lepiniec, L. MYB transcription factors in Arabidopsis. Trends Plant Sci. 2010, 15, 573–581. [Google Scholar] [CrossRef]
  12. Zhang, S.; Feng, M.; Chen, W.; Zhou, X.; Lu, J.; Wang, Y.; Li, Y.; Jiang, C.-Z.; Gan, S.-S.; Ma, N.; et al. In rose, transcription factor PTM balances growth and drought survival via PIP2;1 aquaporin. Nat. Plants 2019, 5, 290–299. [Google Scholar] [CrossRef]
  13. Wu, J.; Jiang, Y.; Liang, Y.; Chen, L.; Chen, W.; Cheng, B. Expression of the maize MYB transcription factor ZmMYB3R enhances drought and salt stress tolerance in transgenic plants. Plant Physiol. Biochem. 2019, 137, 179–188. [Google Scholar] [CrossRef]
  14. An, J.-P.; Wang, X.-F.; Zhang, X.-W.; Xu, H.-F.; Bi, S.-Q.; You, C.-X.; Hao, Y.-J. An apple MYB transcription factor regulates cold tolerance and anthocyanin accumulation and undergoes MIEL1-mediated degradation. Plant Biotechnol. J. 2020, 18, 337–353. [Google Scholar] [CrossRef] [PubMed] [Green Version]
  15. Xing, C.; Liu, Y.; Zhao, L.; Zhang, S.; Huang, X. A novel MYB transcription factor regulates ascorbic acid synthesis and affects cold tolerance. Plant Cell Environ. 2019, 42, 832–845. [Google Scholar] [CrossRef] [PubMed]
  16. An, J.-P.; Li, R.; Qu, F.-J.; You, C.-X.; Wang, X.-F.; Hao, Y.-J. R2R3-MYB transcription factor MdMYB23 is involved in the cold tolerance and proanthocyanidin accumulation in apple. Plant J. 2018, 96, 562–577. [Google Scholar] [CrossRef] [Green Version]
  17. Liao, C.; Zheng, Y.; Guo, Y. MYB30 transcription factor regulates oxidative and heat stress responses through ANNEXIN-mediated cytosolic calcium signaling in Arabidopsis. New Phytol. 2017, 216, 163–177. [Google Scholar] [CrossRef] [Green Version]
  18. Chen, K.; Song, M.; Guo, Y.; Liu, L.; Xue, H.; Dai, H.; Zhang, Z. MdMYB46 could enhance salt and osmotic stress tolerance in apple by directly activating stress-responsive signals. Plant Biotechnol. J. 2019, 17, 2341–2355. [Google Scholar] [CrossRef] [PubMed] [Green Version]
  19. Jiang, X.; Li, S.; Ding, A.; Zhang, Z.; Hao, Q.; Wang, K.; Liu, Q.; Liu, Q. The novel rose MYB transcription factor RhMYB96 enhances salt tolerance in transgenic Arabidopsis. Plant Mol. Biol. Rep. 2018, 36, 406–417. [Google Scholar] [CrossRef]
  20. Kim, J.H.; Nguyen, N.H.; Jeong, C.Y.; Nguyen, N.T.; Hong, S.-W.; Lee, H. Loss of the R2R3 MYB, AtMyb73, causes hyper-induction of the SOS1 and SOS3 genes in response to high salinity in Arabidopsis. J. Plant Physiol. 2013, 170, 1461–1465. [Google Scholar] [CrossRef]
  21. Cui, M.H.; Yoo, K.S.; Hyoung, S.; Nguyen, H.T.K.; Kim, Y.Y.; Kim, H.J.; Ok, S.H.; Yoo, S.D.; Shin, J.S. An Arabidopsis R2R3-MYB transcription factor, AtMYB20, negatively regulates type 2C serine/threonine protein phosphatases to enhance salt tolerance. FEBS Lett. 2013, 587, 1773–1778. [Google Scholar] [CrossRef] [Green Version]
  22. Fang, Q.; Wang, Q.; Mao, H.; Xu, J.; Wang, Y.; Hu, H.; He, S.; Tu, J.; Cheng, C.; Tian, G.; et al. AtDIV2, an R-R-type MYB transcription factor of Arabidopsis, negatively regulates salt stress by modulating ABA signaling. Plant Cell Rep. 2018, 37, 1499–1511. [Google Scholar] [CrossRef] [PubMed]
  23. Wang, R.-K.; Cao, Z.-H.; Hao, Y.-J. Overexpression of a R2R3 MYB gene MdSIMYB1 increases tolerance to multiple stresses in transgenic tobacco and apples. Physiol. Plant. 2014, 150, 76–87. [Google Scholar] [CrossRef]
  24. Shan, H.; Chen, S.; Jiang, J.; Chen, F.; Chen, Y.; Gu, C.; Li, P.; Song, A.; Zhu, X.; Gao, H.; et al. Heterologous expression of the chrysanthemum R2R3-MYB transcription factor CmMYB2 enhances drought and salinity tolerance, increases hypersensitivity to ABA and delays flowering in Arabidopsis thaliana. Mol. Biotechnol. 2012, 51, 160–173. [Google Scholar] [CrossRef] [PubMed]
  25. Qin, Y.; Wang, M.; Tian, Y.; He, W.; Han, L.; Xia, G. Over-expression of TaMYB33 encoding a novel wheat MYB transcription factor increases salt and drought tolerance in Arabidopsis. Mol. Biol. Rep. 2012, 39, 7183–7192. [Google Scholar] [CrossRef]
  26. Cai, H.; Tian, S.; Liu, C.; Dong, H. Identification of a MYB3R gene involved in drought, salt and cold stress in wheat (Triticum aestivum L.). Gene 2011, 485, 146–152. [Google Scholar] [CrossRef] [PubMed]
  27. Rahaie, M.; Xue, G.-P.; Naghavi, M.R.; Alizadeh, H.; Schenk, P.M. A MYB gene from wheat (Triticum aestivum L.) is up-regulated during salt and drought stresses and differentially regulated between salt-tolerant and sensitive genotypes. Plant Cell Rep. 2010, 29, 835–844. [Google Scholar] [CrossRef]
  28. Ahmad, P. Water Stress and Crop Plants: A Sustainable Approach; John Wiley & Sons: Hoboken, NJ, USA, 2016; Volume 1, pp. 1–756. [Google Scholar]
  29. De Rossi, S.; Di Marco, G.; Bruno, L.; Gismondi, A.; Canini, A. Investigating the drought and salinity effect on the redox components of Sulla Coronaria (L.) Medik. Antioxidants 2021, 10, 1048. [Google Scholar] [CrossRef]
  30. Hossain, M.S.; ElSayed, A.I.; Moore, M.; Dietz, K.J. Redox and reactive oxygen species network in acclimation for salinity tolerance in sugar beet. J. Exp. Bot. 2017, 68, 1283–1298. [Google Scholar] [CrossRef] [PubMed] [Green Version]
  31. Wang, M.; Dai, W.; Du, J.; Ming, R.; Dahro, B.; Liu, J.-H. ERF109 of trifoliate orange (Poncirus trifoliata (L.) Raf.) contributes to cold tolerance by directly regulating expression of Prx1 involved in antioxidative process. Plant Biotechnol. J. 2019, 17, 1316–1332. [Google Scholar] [CrossRef] [Green Version]
  32. Geng, J.; Liu, J.-H. The transcription factor CsbHLH18 of sweet orange functions in modulation of cold tolerance and homeostasis of reactive oxygen species by regulating the antioxidant gene. J. Exp. Bot. 2018, 69, 2677–2692. [Google Scholar] [CrossRef] [Green Version]
  33. Zhang, Q.; Wang, M.; Hu, J.; Wang, W.; Fu, X.; Liu, J.-H. PtrABF of Poncirus trifoliata functions in dehydration tolerance by reducing stomatal density and maintaining reactive oxygen species homeostasis. J. Exp. Bot. 2015, 66, 5911–5927. [Google Scholar] [CrossRef] [Green Version]
  34. Huang, Y.; Xu, Y.; Jiang, X.; Yu, H.; Jia, H.; Tan, C.; Hu, G.; Hu, Y.; Rao, M.J.; Deng, X.; et al. Genome of a citrus rootstock and global DNA demethylation caused by heterografting. Hortic. Res. 2021, 8, 69. [Google Scholar] [CrossRef]
  35. Peng, Z.; Bredeson, J.V.; Wu, G.A.; Shu, S.; Rawat, N.; Du, D.; Parajuli, S.; Yu, Q.; You, Q.; Rokhsar, D.S.; et al. A chromosome-scale reference genome of trifoliate orange (Poncirus trifoliata) provides insights into disease resistance, cold tolerance and genome evolution in Citrus. Plant J. 2020, 104, 1215–1232. [Google Scholar] [CrossRef]
  36. Wei, T.; Wang, Y.; Liu, J.-H. Comparative transcriptome analysis reveals synergistic and disparate defense pathways in the leaves and roots of trifoliate orange (Poncirus trifoliata) autotetraploids with enhanced salt tolerance. Hortic. Res. 2020, 7, 88. [Google Scholar] [CrossRef]
  37. Livak, K.J.; Schmittgen, T.D. Analysis of relative gene expression data using real-time quantitative PCR and the 2−ΔΔCT method. Methods 2001, 25, 402–408. [Google Scholar] [CrossRef]
  38. Horsch, R.B.; Fry, J.E.; Hoffmann, N.L.; Eichholtz, D.; Rogers, S.G.; Fraley, R.T. A simple and general method for transferring genes into plants. Science 1985, 227, 1229–1231. [Google Scholar] [CrossRef]
  39. Dai, W.; Wang, M.; Gong, X.; Liu, J.-H. The transcription factor FcWRKY40 of Fortunella crassifolia functions positively in salt tolerance through modulation of ion homeostasis and proline biosynthesis by directly regulating SOS2 and P5CS1 homologs. New Phytol. 2018, 219, 972–989. [Google Scholar] [CrossRef] [Green Version]
  40. Wei, T.; Wang, Y.; Xie, Z.; Guo, D.; Chen, C.; Fan, Q.; Deng, X.; Liu, J.-H. Enhanced ROS scavenging and sugar accumulation contribute to drought tolerance of naturally occurring autotetraploids in Poncirus trifoliata. Plant Biotechnol. J. 2019, 17, 1394–1407. [Google Scholar] [CrossRef] [Green Version]
  41. Choudhury, F.K.; Rivero, R.M.; Blumwald, E.; Mittler, R. Reactive oxygen species, abiotic stress and stress combination. Plant J. 2017, 90, 856–867. [Google Scholar] [CrossRef]
  42. Albert, N.W.; Thrimawithana, A.H.; McGhie, T.K.; Clayton, W.A.; Deroles, S.C.; Schwinn, K.E.; Bowman, J.L.; Jordan, B.R.; Davies, K.M. Genetic analysis of the liverwort Marchantia polymorpha reveals that R2R3MYB activation of flavonoid production in response to abiotic stress is an ancient character in land plants. New Phytol. 2018, 218, 554–566. [Google Scholar] [CrossRef] [Green Version]
  43. Shen, Y.; Sun, T.; Pan, Q.; Anupol, N.; Chen, H.; Shi, J.; Liu, F.; Deqiang, D.; Wang, C.; Zhao, J.; et al. RrMYB5- and RrMYB10-regulated flavonoid biosynthesis plays a pivotal role in feedback loop responding to wounding and oxidation in Rosa rugosa. Plant Biotechnol. J. 2019, 17, 2078–2095. [Google Scholar] [CrossRef] [Green Version]
  44. Navrot, N.; Collin, V.r.; Gualberto, J.; Gelhaye, E.; Hirasawa, M.; Rey, P.; Knaff, D.B.; Issakidis, E.; Jacquot, J.-P.; Rouhier, N. Plant glutathione peroxidases are functional peroxiredoxins distributed in several subcellular compartments and regulated during biotic and abiotic stresses. Plant Physiol. 2006, 142, 1364–1379. [Google Scholar] [CrossRef] [Green Version]
  45. Li, K.; Xing, C.; Yao, Z.; Huang, X. PbrMYB21, a novel MYB protein of Pyrus betulaefolia, functions in drought tolerance and modulates polyamine levels by regulating arginine decarboxylase gene. Plant Biotechnol. J. 2017, 15, 1186–1203. [Google Scholar] [CrossRef] [PubMed] [Green Version]
  46. Ma, D.; Reichelt, M.; Yoshida, K.; Gershenzon, J.; Constabel, C.P. Two R2R3-MYB proteins are broad repressors of flavonoid and phenylpropanoid metabolism in poplar. Plant J. 2018, 96, 949–965. [Google Scholar] [CrossRef] [PubMed] [Green Version]
  47. Fan, Z.-Q.; Ba, L.-J.; Shan, W.; Xiao, Y.-Y.; Lu, W.-J.; Kuang, J.-F.; Chen, J.-Y. A banana R2R3-MYB transcription factor MaMYB3 is involved in fruit ripening through modulation of starch degradation by repressing starch degradation-related genes and MabHLH6. Plant J. 2018, 96, 1191–1205. [Google Scholar] [CrossRef] [PubMed] [Green Version]
  48. Zhu, F.; Luo, T.; Liu, C.; Wang, Y.; Yang, H.; Yang, W.; Zheng, L.; Xiao, X.; Zhang, M.; Xu, R.; et al. An R2R3-MYB transcription factor represses the transformation of α- and β-branch carotenoids by negatively regulating expression of CrBCH2 and CrNCED5 in flavedo of Citrus reticulate. New Phytol. 2017, 216, 178–192. [Google Scholar] [CrossRef] [Green Version]
  49. Lv, Y.; Yang, M.; Hu, D.; Yang, Z.; Ma, S.; Li, X.; Xiong, L. The OsMYB30 transcription factor suppresses cold tolerance by interacting with a JAZ protein and suppressing β-amylase expression. Plant Physiol. 2017, 173, 1475–1491. [Google Scholar] [CrossRef] [Green Version]
  50. Huang, X.-S.; Wang, W.; Zhang, Q.; Liu, J.-H. A basic helix-loop-helix transcription factor, PtrbHLH, of Poncirus trifoliata confers cold tolerance and modulates peroxidase-mediated scavenging of hydrogen peroxide. Plant Physiol. 2013, 162, 1178–1194. [Google Scholar] [CrossRef] [Green Version]
Figure 1. Multiple sequence alignment of PtrMYB3 and another five R2R3-MYB genes from five species, including Vitis vinifera (VvMYB, CBI20715.3), Oryza sativa (OsMYB, XP_015629423.1), Zea mays (ZmMYB, NP_001358856.1), Brassica rapa (BrMYB, XP_009115618.1), Arabidopsis thaliana (AtMYB, NP_564176.2). The R2 and R3 MYB domains are indicated with a black solid line and a dotted line, respectively. The conserved tryptophan (W) residues are indicated with asterisks (*). A nuclear localization signal (NLS) is indicated with a red solid line.
Antioxidants 10 01388 g001
Figure 2. Relative expression levels of PtrMYB3 under salt (a), dehydration (b) and cold (c) stresses at each designated time point. Error bars indicate ± SE (standard error). R: recovery. Asterisks indicate significant differences compared to the value at 0 h: p < 0.05 (*), p < 0.01 (**) and p < 0.001 (***).
Antioxidants 10 01388 g002
Figure 3. Subcellular localization of PtrMYB3. The representative images indicate cells expressing YFP (ad) or PtrMYB3-YFP fusion protein (eh) under different fields, including yellow fluorescence (YFP, (a,e)), red fluorescence (mCherry, (b,f)), bright field (c,g) and merged field (d,h). The red fluorescence images (b,f) show the signal of a nuclear marker gene VirD2NLS fused to mCherry. Bar, shown at the right bottom, =25 μm (upper panels) and 10 μm (bottom panels).
Antioxidants 10 01388 g003
Figure 4. Transactivation assay of PtrMYB3. The representative images indicate yeast cells expressing pGBKT7 control plasmid (upper panels) or PtrMYB3-pGBKT7 fusion plasmid (bottom panels) under different selective growth mediums, including SD/-Trp or SD/-Trp/-His/-Ade with or without 3-AT and X-α-Gal.
Antioxidants 10 01388 g004
Figure 5. Salt tolerance assays of transgenic tobacco plants overexpressing PtrMYB3. (a) Representative images of 7-day-old tobacco plants of the two transgenic lines (#6 and #13) and wild-type (WT) before and after salt treatment. (b) The survival rate of the two transgenic lines and WT after salt treatment. (c) Representative images of 40-day-old tobacco plants of the two transgenic lines and WT before and after salt treatment. (d) The chlorophyll content (a, b and total) of the two transgenic lines and WT after salt treatment. Ca: chlorophyll a; Cb: chlorophyll b; Ct: total chlorophyll including a and b. Error bars indicate ± SE. Asterisks indicate significant differences between the transgenic line and WT: p < 0.05 (*), p < 0.01 (**) and p < 0.001 (***).
Antioxidants 10 01388 g005
Figure 6. Silencing of PtrMYB3 in Poncirus trifoliata confers enhanced salt tolerance. (a) Phenotypes of WT and PtrMYB3-silenced plants (PtrMYB3-TRV) before and after salt stress. Bar = 1 cm. (b) Chlorophyll content (a, b and total) of WT and PtrMYB3-silenced plants after salt stress. The images above show the crude extract in WT and PtrMYB3-silenced plants. (c,d) The chlorophyll fluorescence imaging (c) and the Fv/Fm values (d) of WT and PtrMYB3-silenced plants before and after salt stress. Error bars indicate ± SE. Asterisks indicate significant differences between WT and PtrMYB3-silenced plants: p < 0.05 (*), p < 0.01 (**) and p < 0.001 (***).
Antioxidants 10 01388 g006
Figure 7. PtrMYB3 negatively regulates the expression of PtrPOD. (a) The relative expression levels of PtrPOD in WT and two PtrMYB3-silenced lines (#26 and #50). (b) Schematic diagrams of the reporter and the effectors used for dual-luciferase activity assay. P-35S: CaMV35S promoter; Term: terminator; MCS: multiple cloning sites; REN: renilla luciferase; LUC: firefly luciferase; P-PtrPOD: the promoter of PtrPOD; SK: pGreenII 62-SK vector. (c) The relative LUC/REN ratios in tobacco leaves transiently co-expressing the reporter and the effector. The LUC/REN ratio of empty vector (SK) without PtrMYB3 is set to 1. (d) The representative image of one tobacco leaf transiently co-expressing the reporter and the effector. The fluorescence intensity is indicated with different colors from low to high as shown in the color scale bar. Error bars indicate ± SE. Asterisks indicate significant differences: p < 0.001 (***).
Antioxidants 10 01388 g007
Figure 8. PtrMYB3 transgenic tobacco plants accumulate excess H2O2 after salt stress. (a) In situ H2O2 staining with 3,3′-diaminobenzidine (DAB) in the leaves of two transgenic lines (#6 and #13) and the WT before and after salt stress. Bar = 1 cm. (b) H2O2 content measurement in the leaves of two transgenic lines (#6 and #13) and the WT before and after salt stress. Error bars indicate ± SE. Asterisks indicate significant differences: p < 0.05 (*), p < 0.01 (**).
Antioxidants 10 01388 g008
Publisher’s Note: MDPI stays neutral with regard to jurisdictional claims in published maps and institutional affiliations.

