
Differential Effects of Polyphenols on Insulin Proteolysis by the Insulin-Degrading Enzyme

 and
and
Abstract
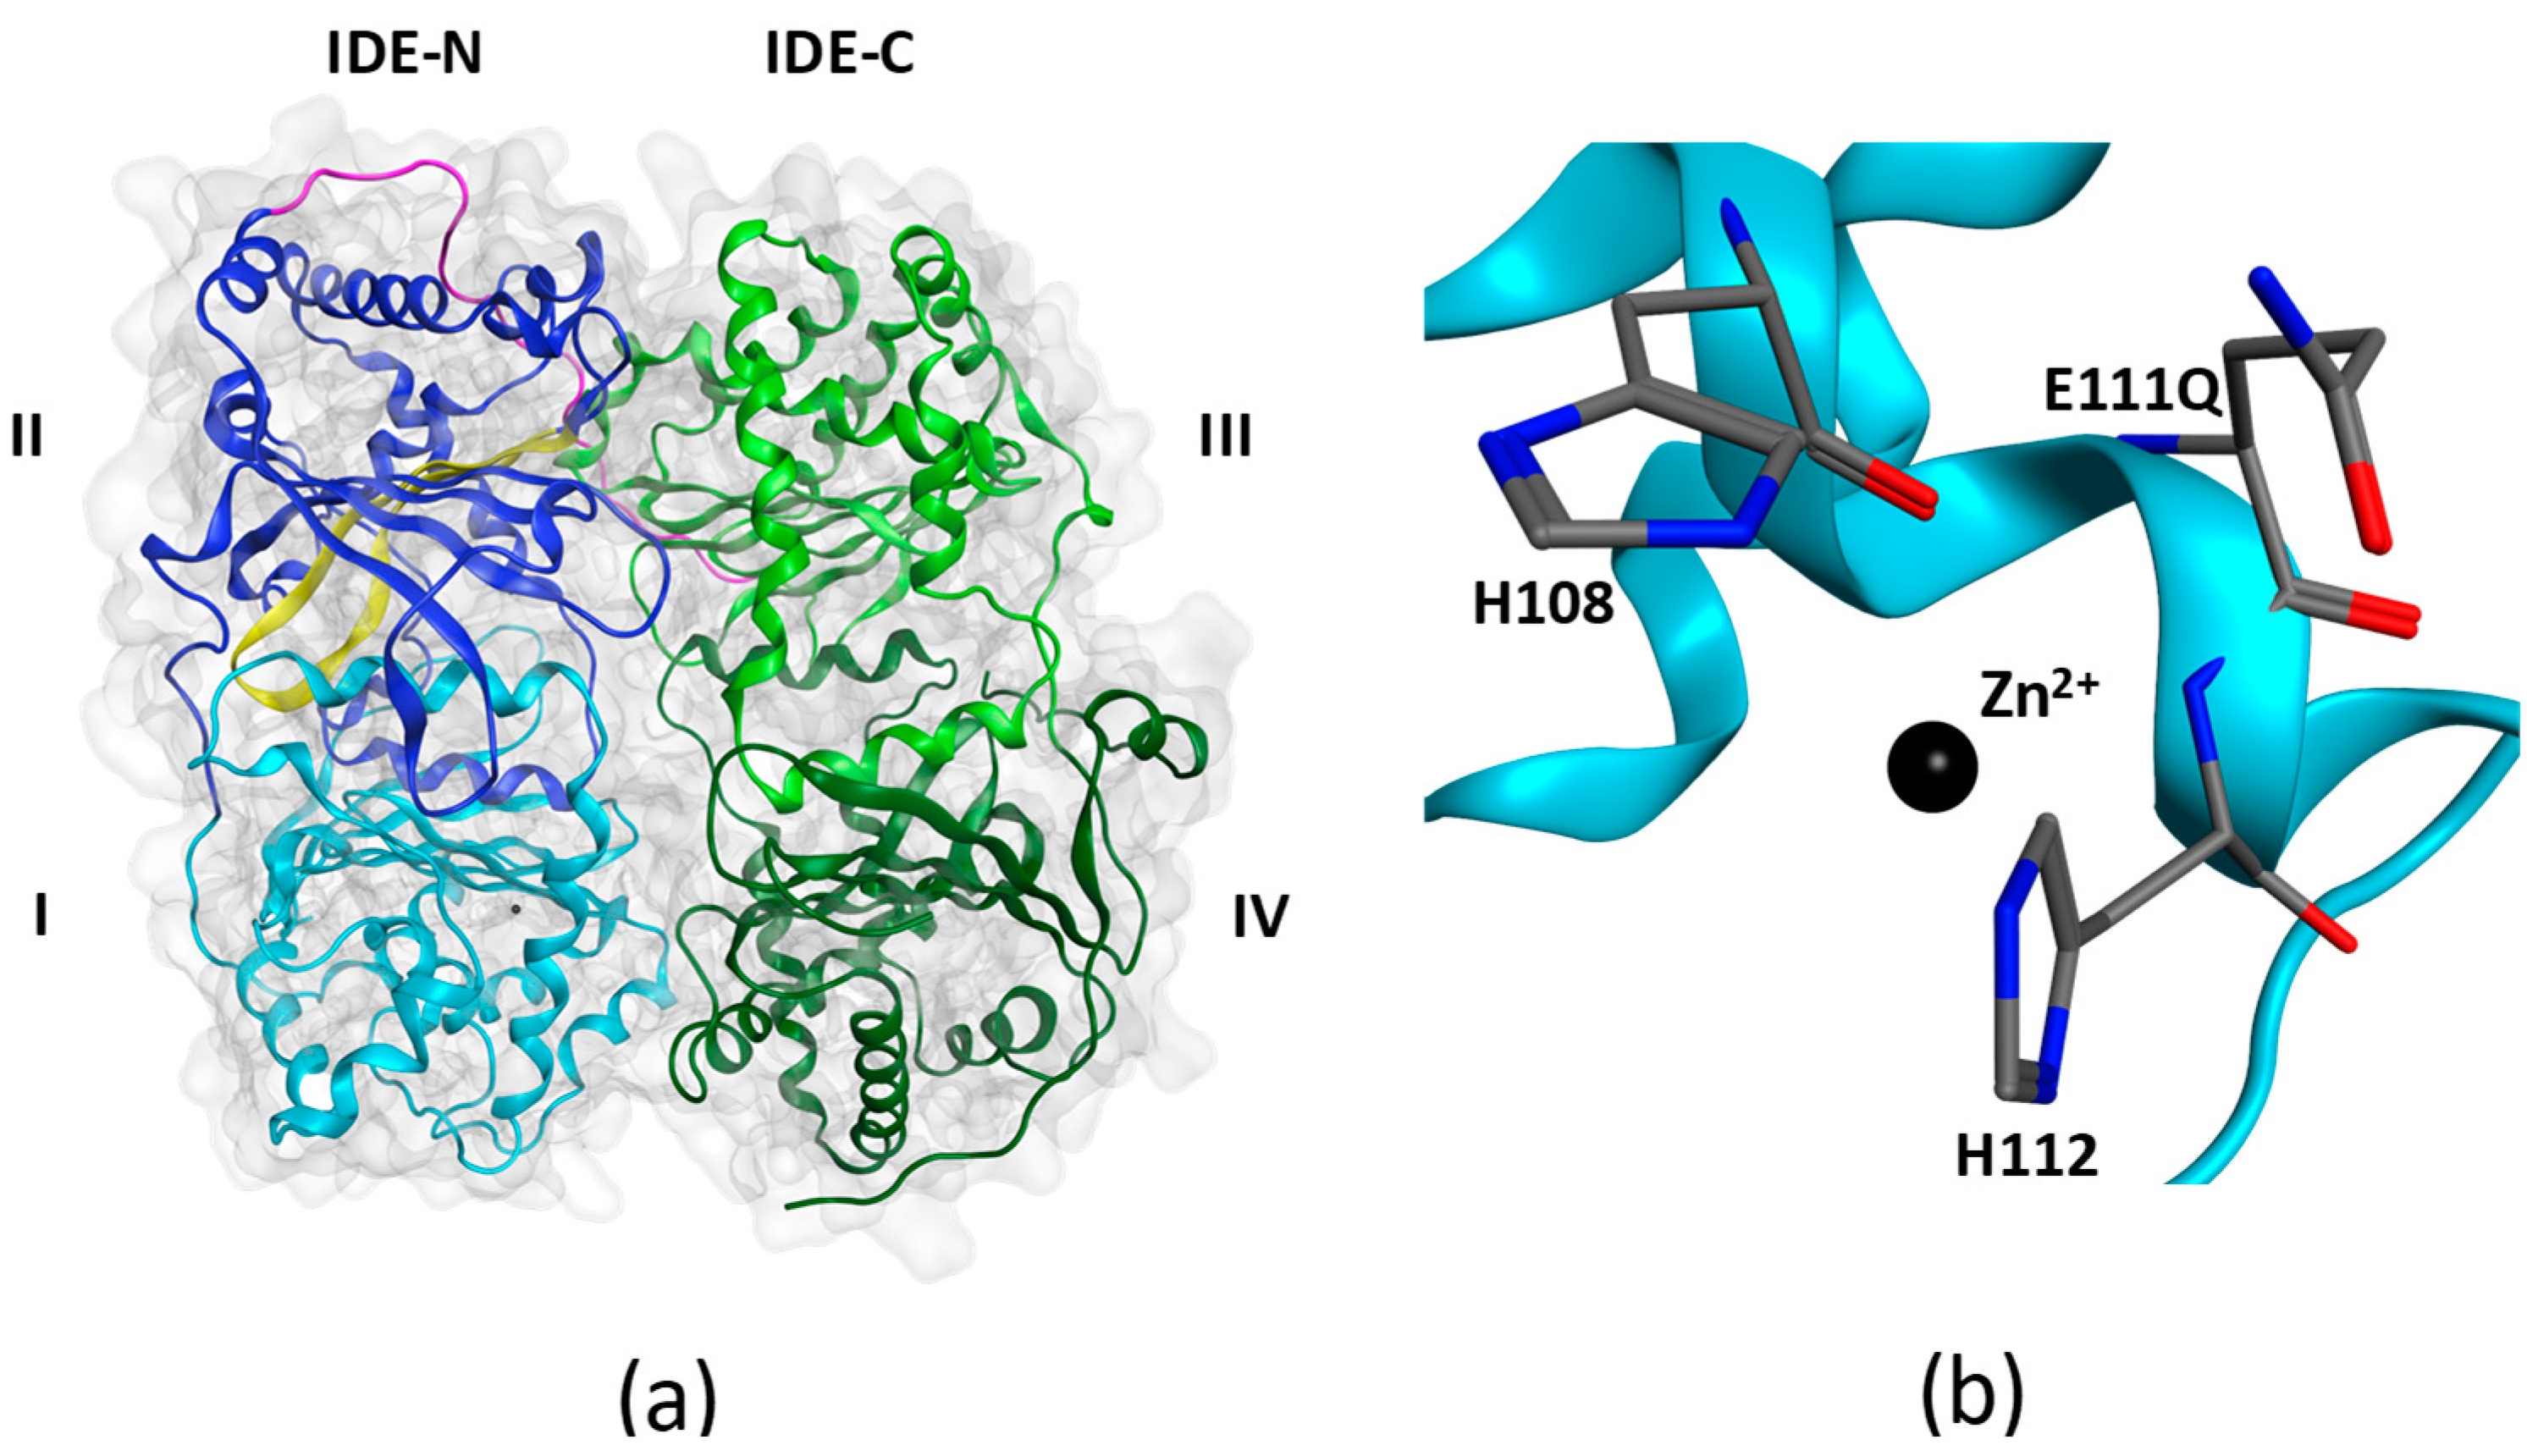
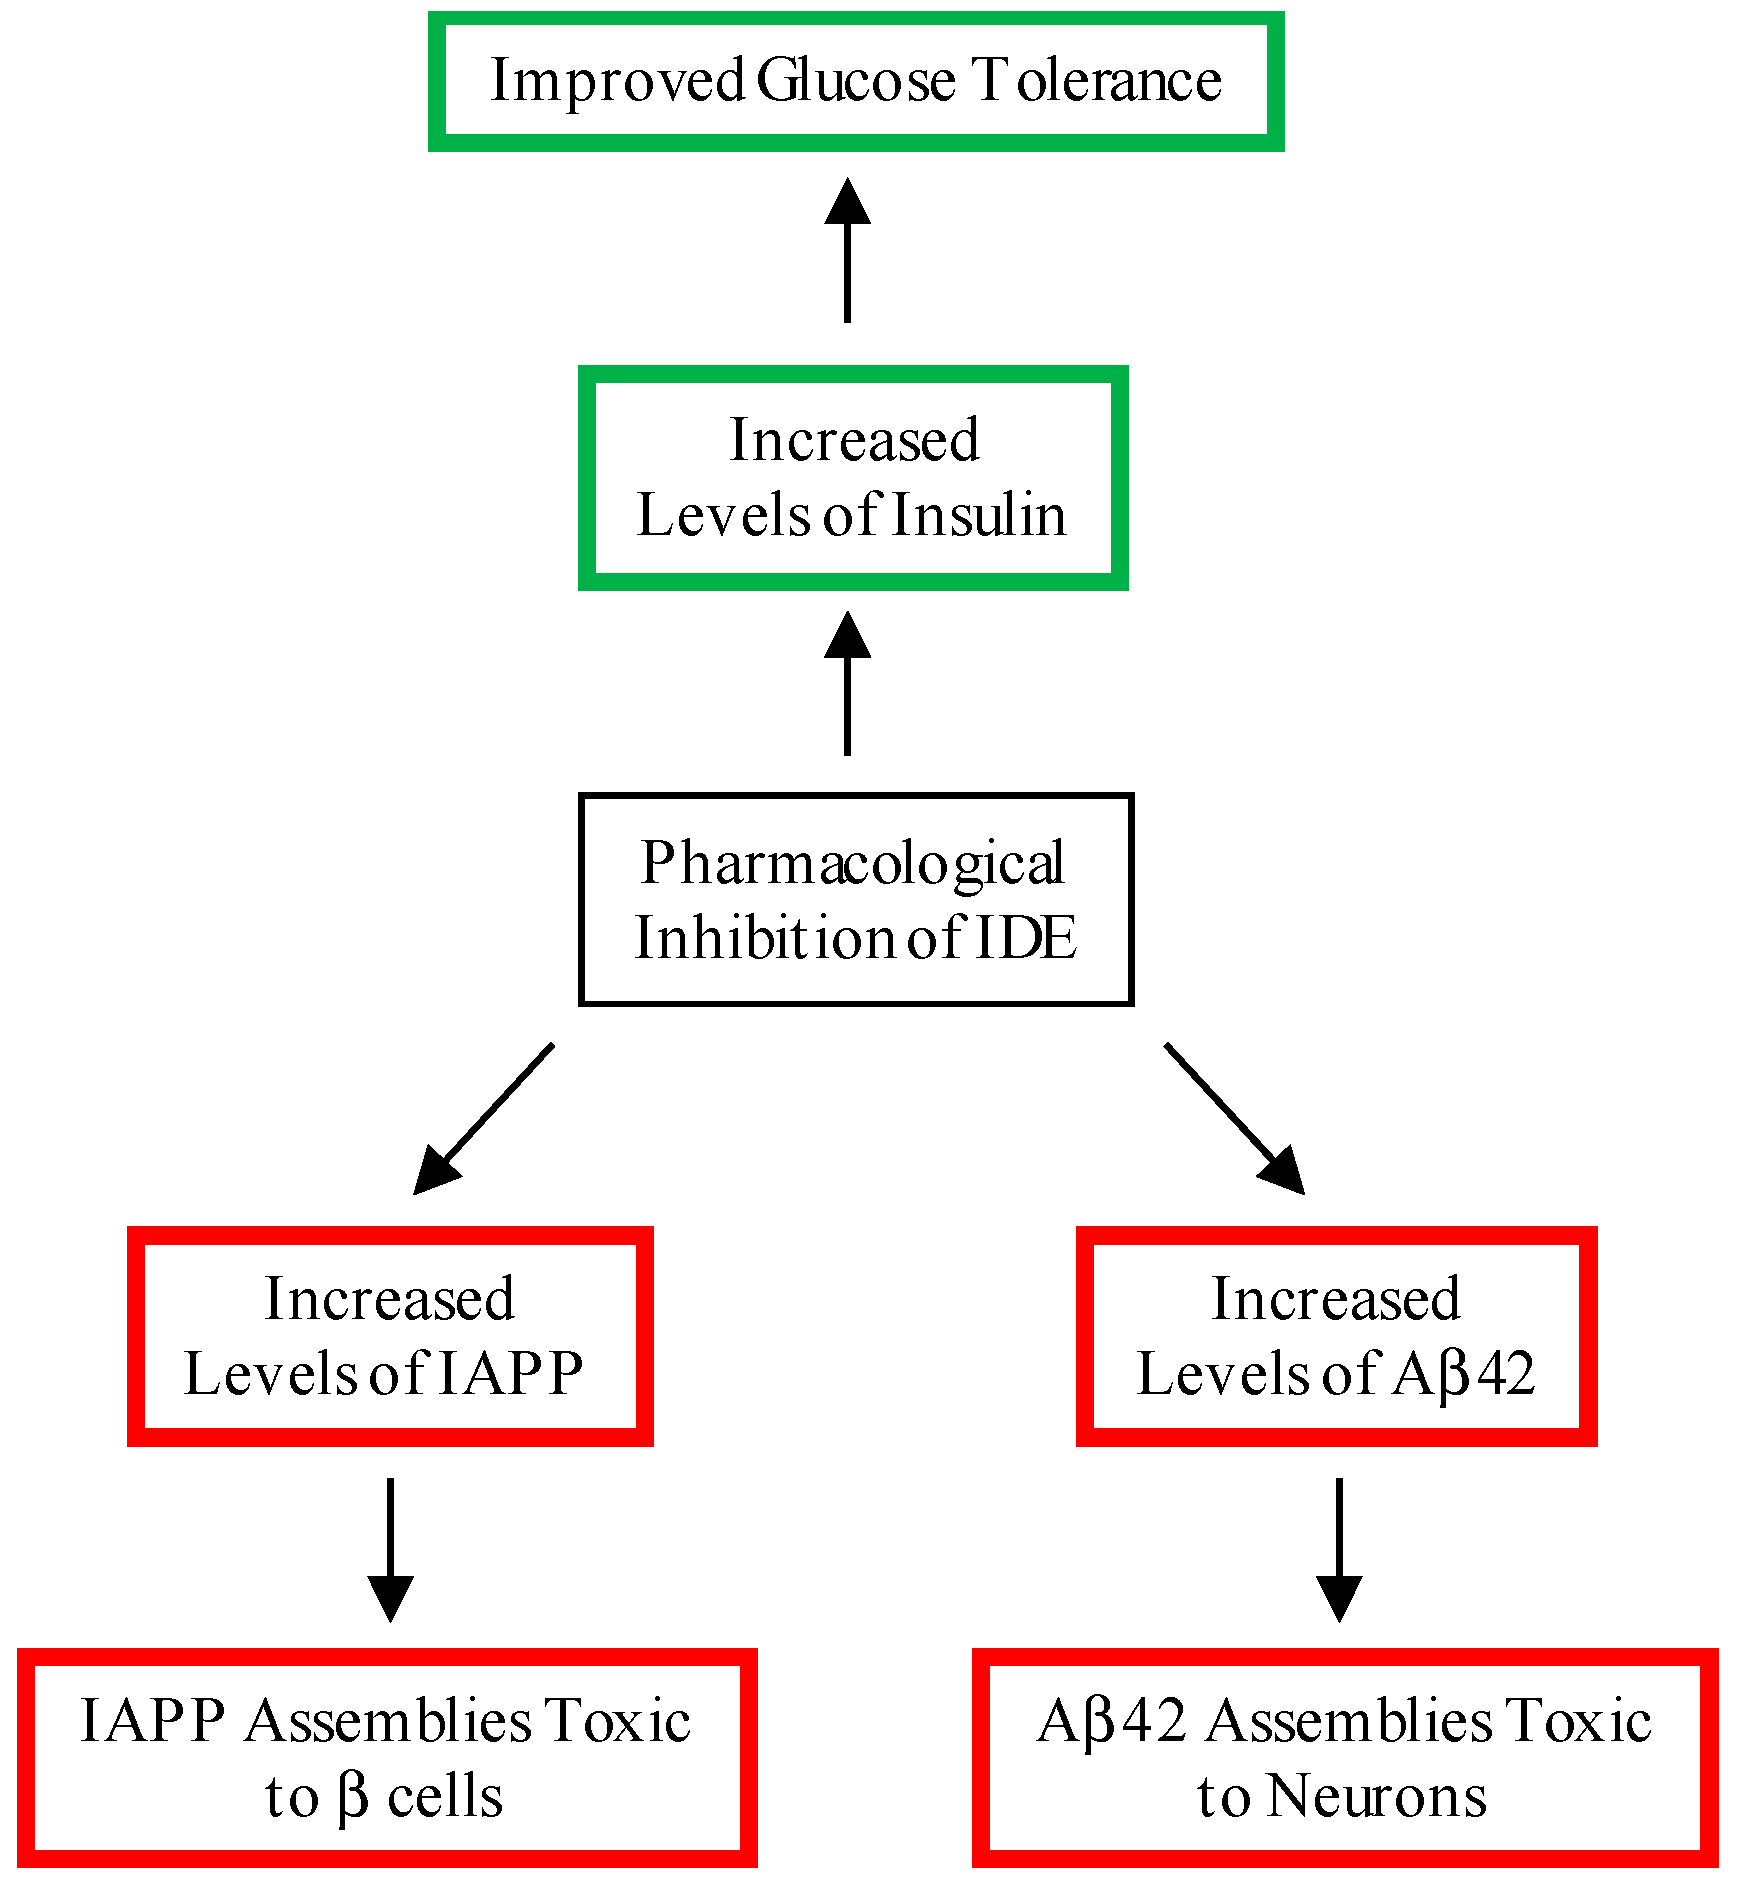
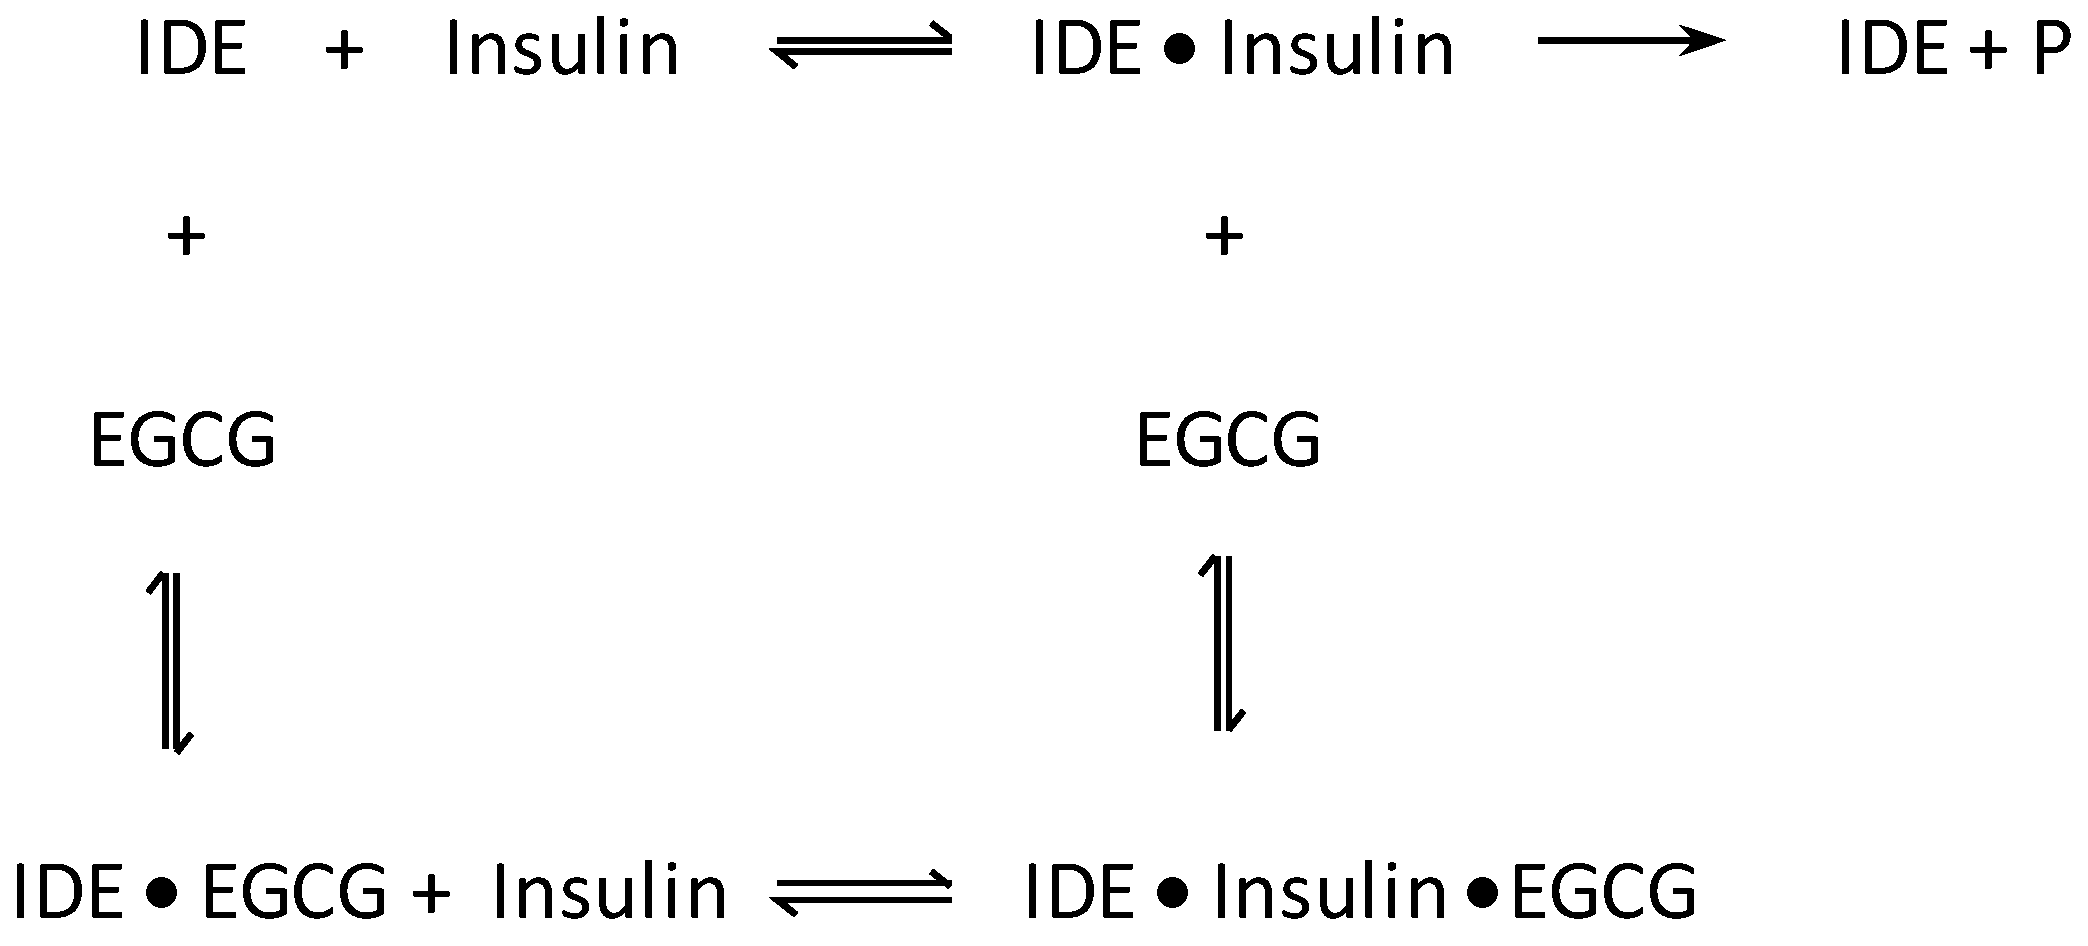
:1. Introduction
2. Materials and Methods
2.1. Insulin-Degrading Enzyme Expression and Purification
2.2. Preparation of Stock Solutions
2.3. Circular Dichroism Spectroscopy
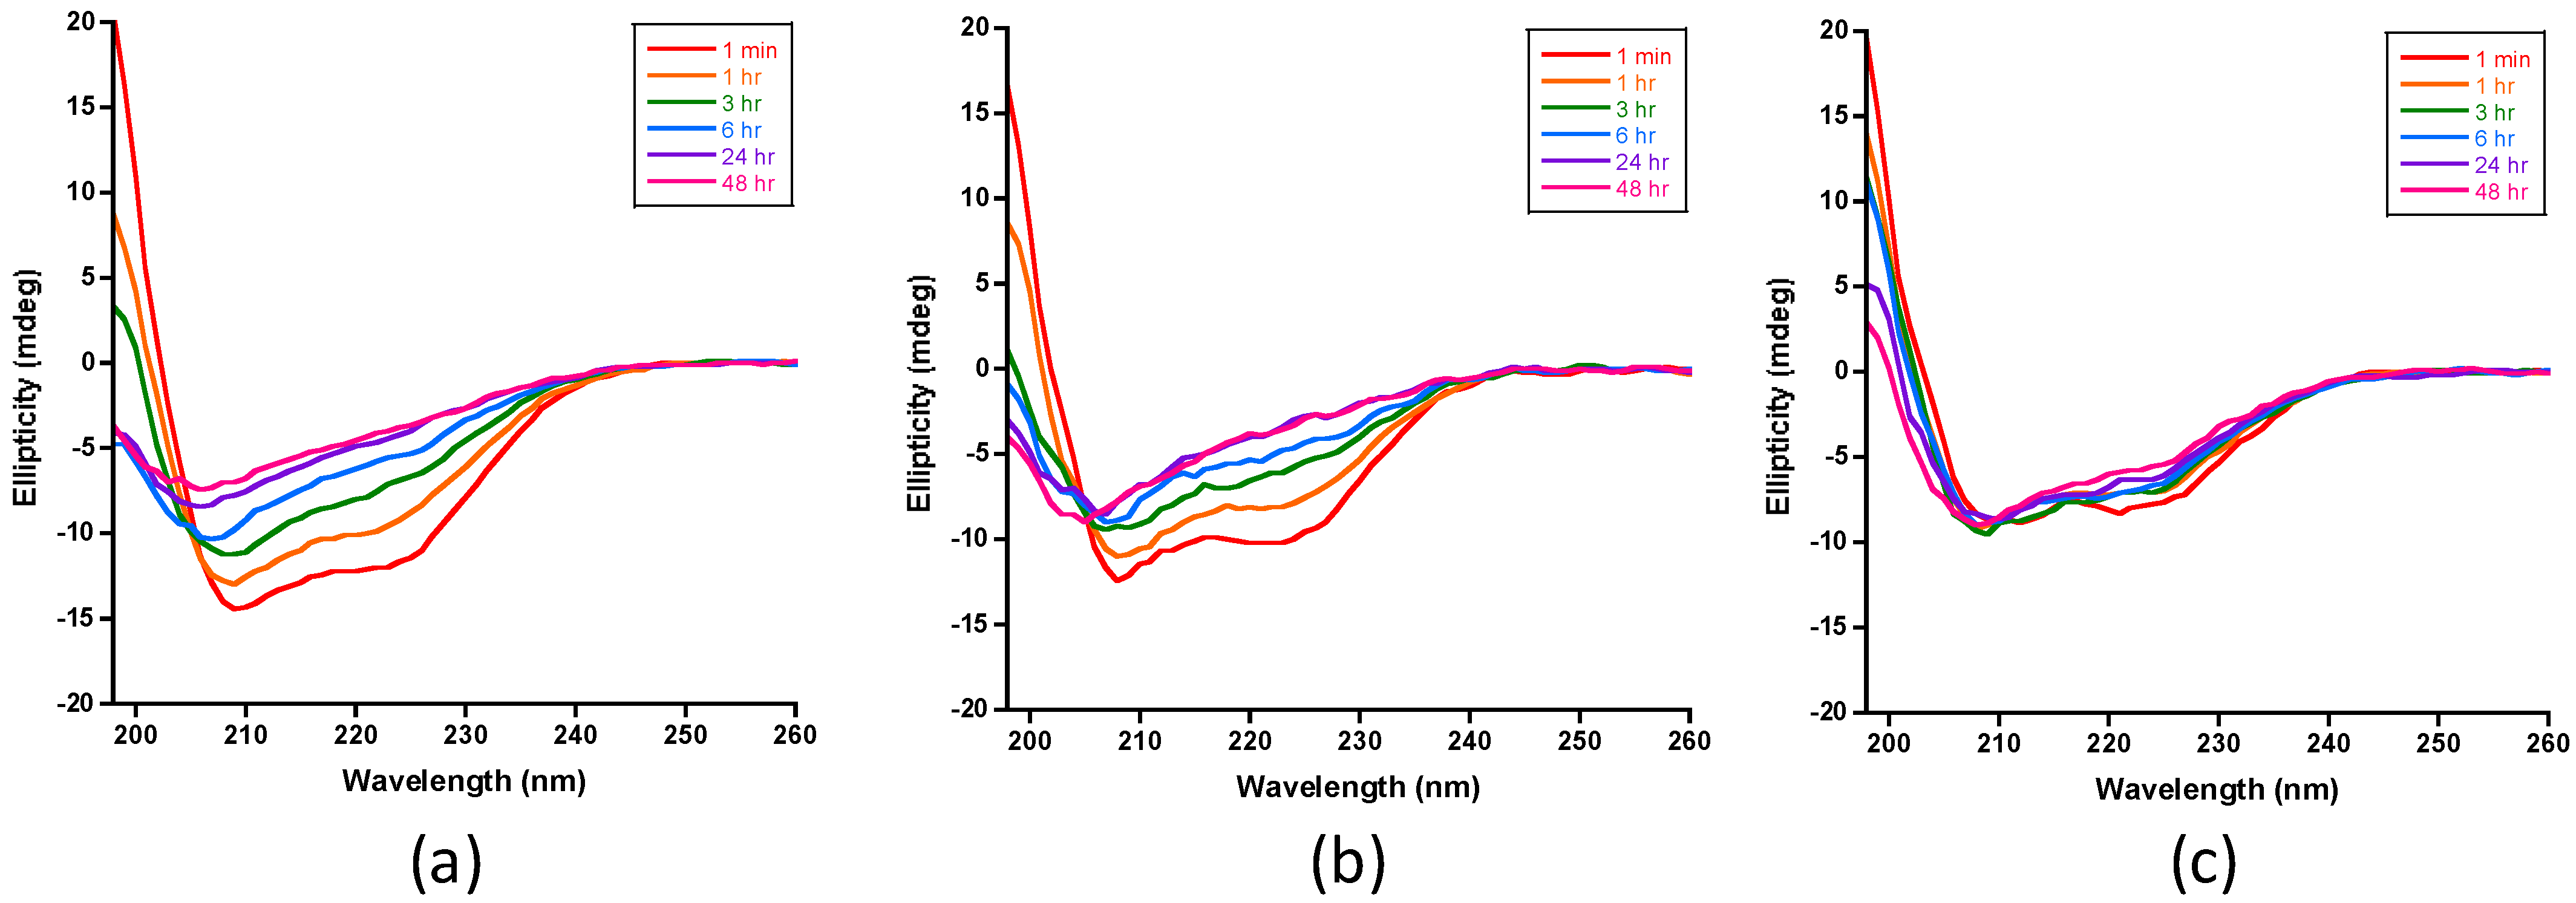
2.3.1. Monitoring the Loss of Insulin’s Helical Circular Dichroic Signals with Digestion Time
2.3.2. Kinetic Parameters from Insulin’s Helical Circular Dichroic Ellipticity at 222 nm
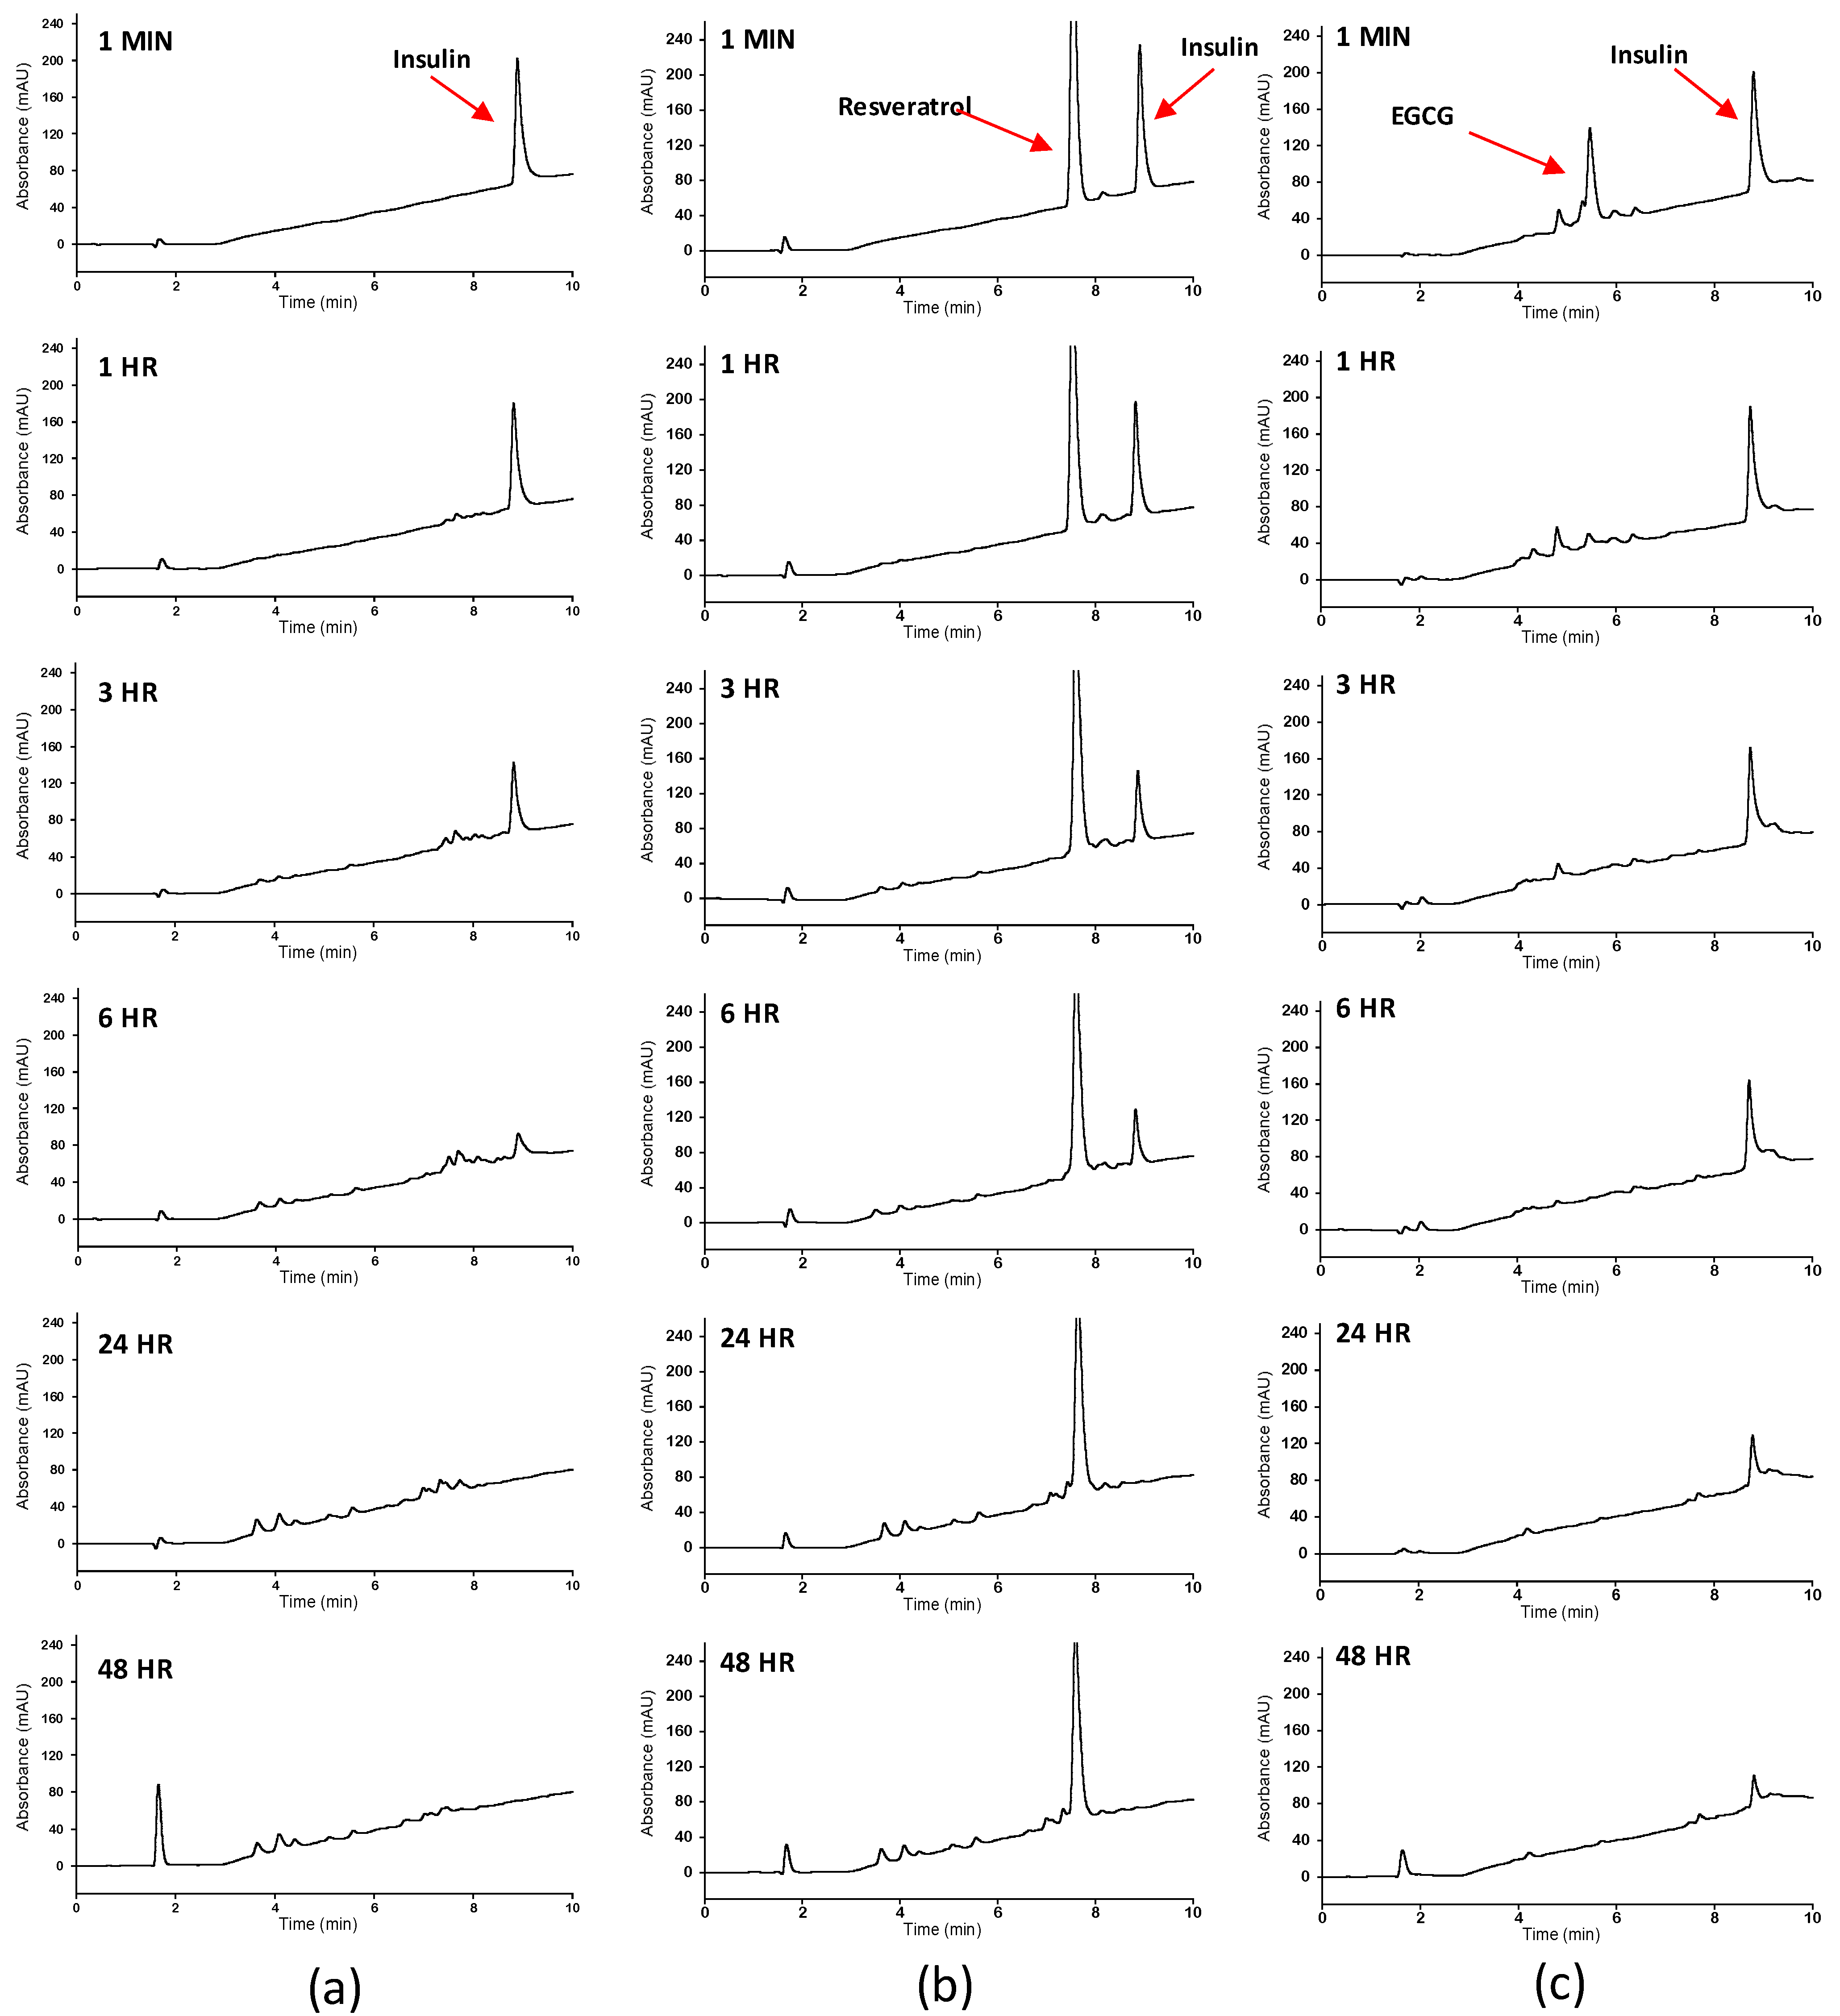
2.4. Reversed Phase High Performance Liquid Chromatography
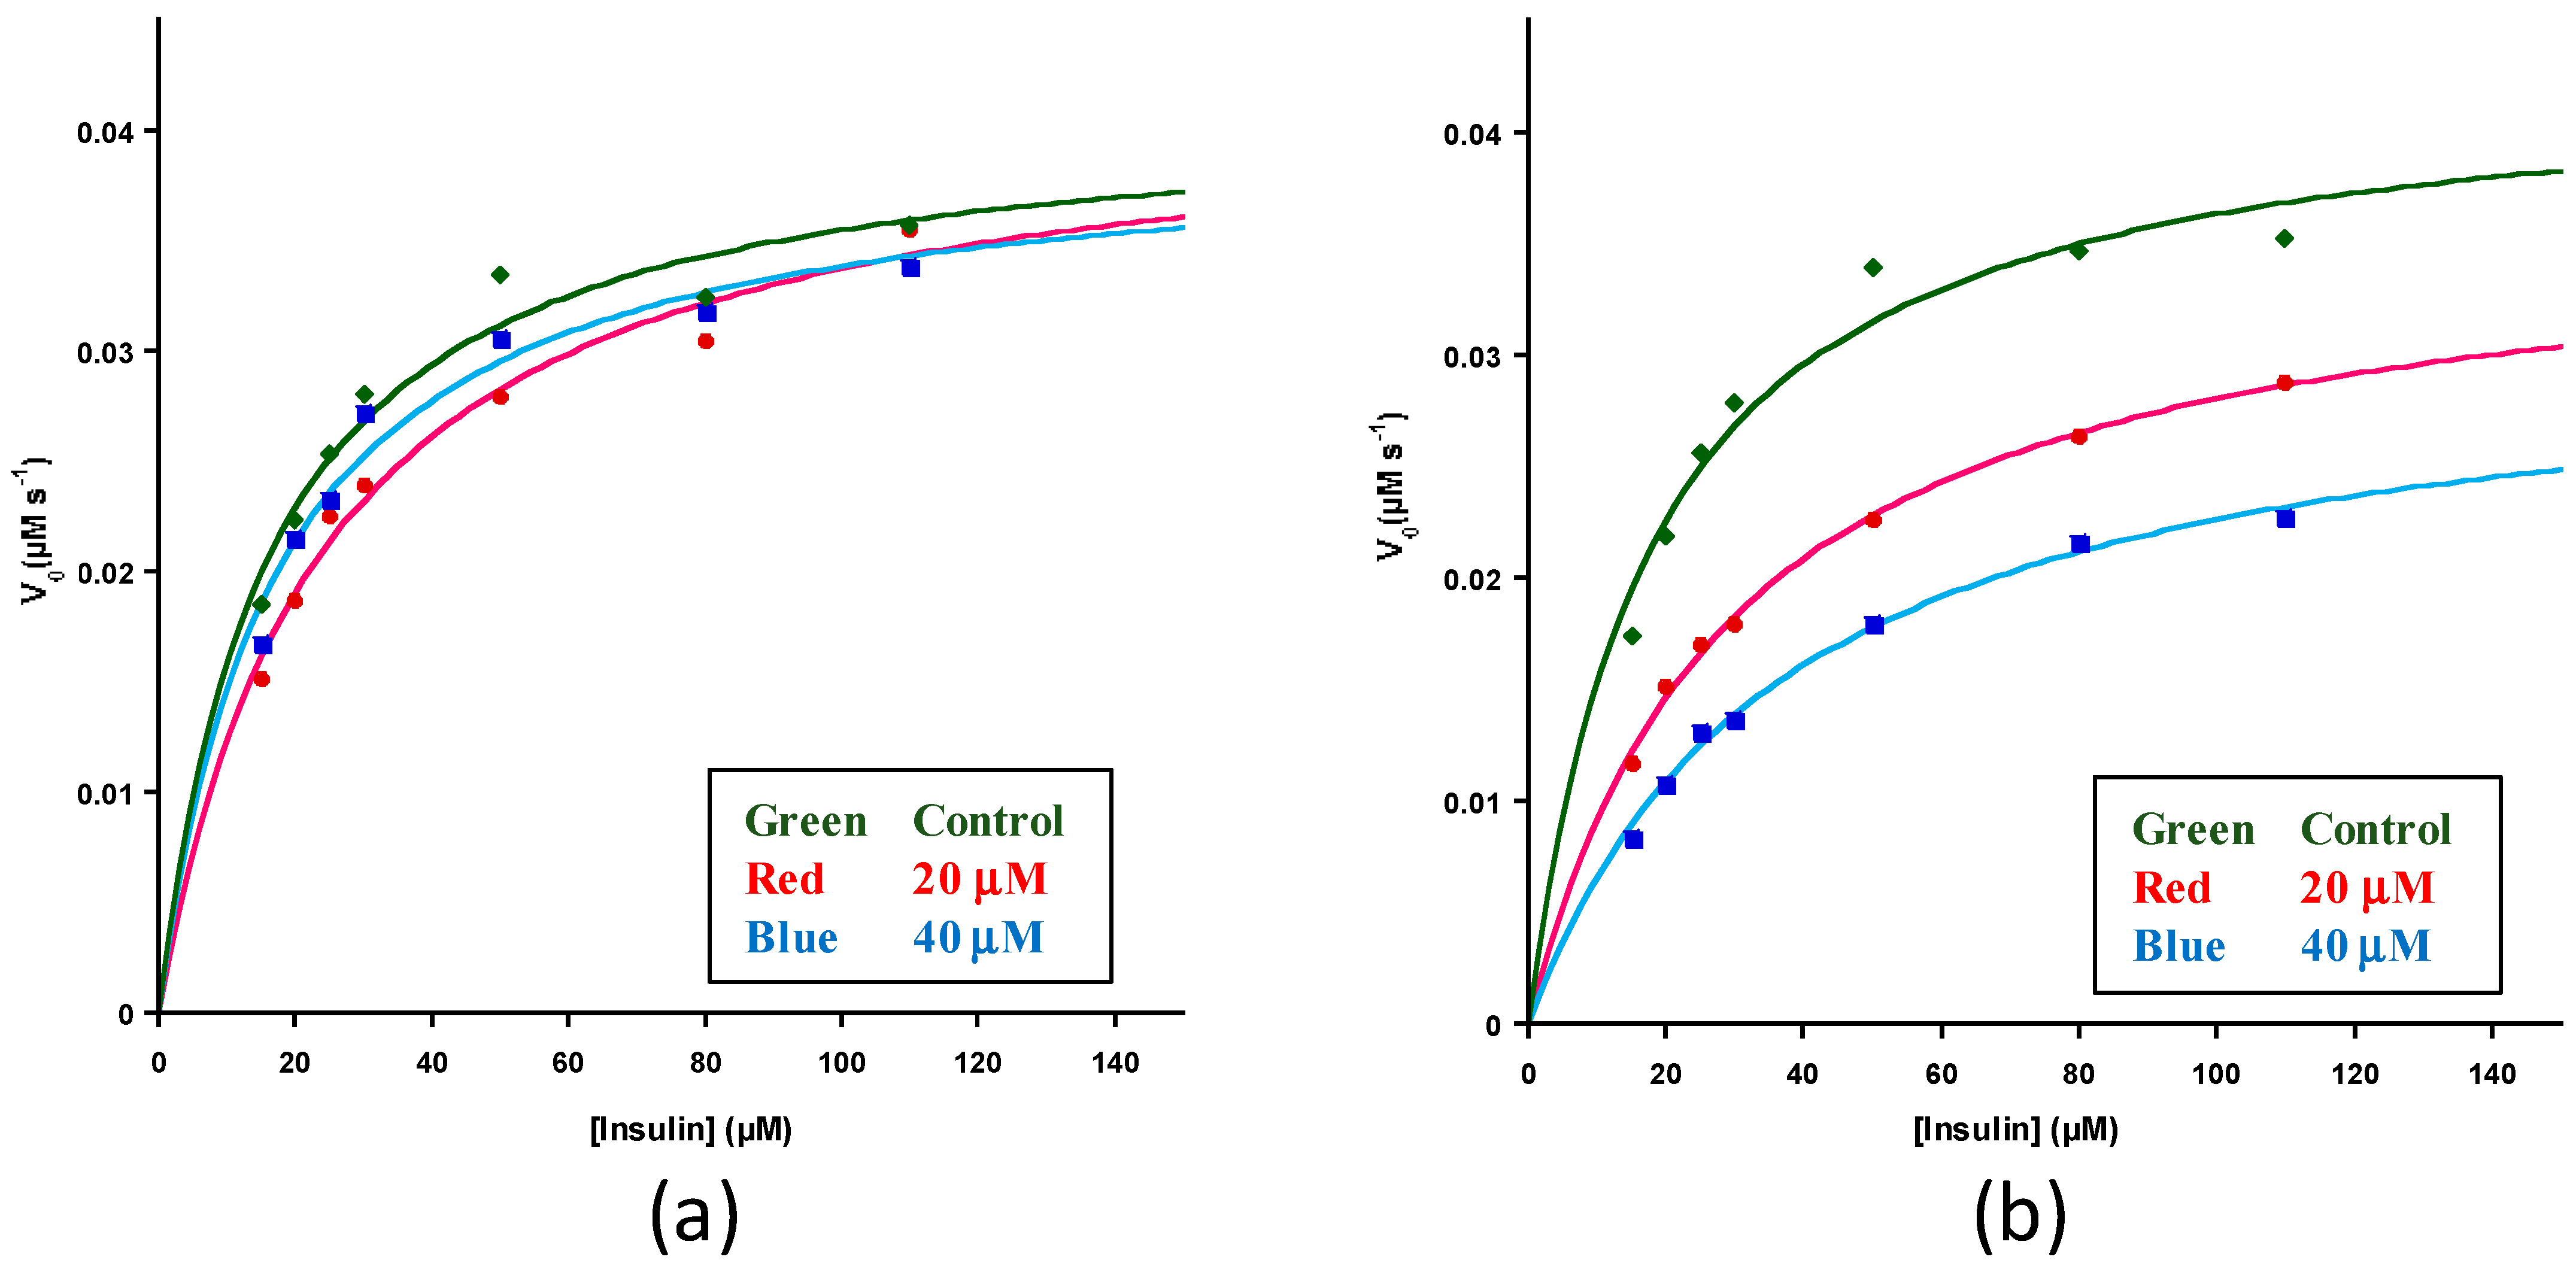
3. Results and Discussion
Supplementary Materials
Author Contributions
Funding
Institutional Review Board Statement
Informed Consent Statement
Data Availability Statement
Acknowledgments
Conflicts of Interest
References
- Barrett, A.J.; Rawlings, N.D.; Woessner, J.F. Handbook of Proteolytic Enzymes; Academic Press: Cambridge, MA, USA, 2012. [Google Scholar]
- Manolopoulou, M.; Guo, Q.; Malito, E.; Schilling, A.B.; Tang, W.J. Molecular basis of catalytic chamber-assisted unfolding and cleavage of human insulin by human insulin-degrading enzyme. J. Biol. Chem. 2009, 284, 14177–14188. [Google Scholar] [CrossRef] [Green Version]
- Malito, E.; Hulse, R.E.; Tang, W.J. Amyloid β-degrading cryptidases: insulin degrading enzyme, presequence peptidase, and neprilysin. Cell. Mol. Life Sci. 2008, 65, 2574–2585. [Google Scholar] [CrossRef] [Green Version]
- Shen, Y.; Joachimiak, A.; Rosner, M.R.; Tang, W.J. Structures of human insulin-degrading enzyme reveal a new substrate recognition mechanism. Nature 2006, 443, 870–874. [Google Scholar] [CrossRef] [Green Version]
- McCord, L.A.; Liang, W.G.; Dowdell, E.; Kalas, V.; Hoey, R.J.; Koide, A.; Koide, S.; Tang, W.J. Conformational states and recognition of amyloidogenic peptides of human insulin-degrading enzyme. Proc. Natl. Acad. Sci. USA 2013, 110, 13827–13832. [Google Scholar] [CrossRef] [PubMed] [Green Version]
- Zhang, Z.; Liang, W.G.; Bailey, L.J.; Tan, Y.Z.; Wei, H.; Wang, A.; Farcasanu, M.; Woods, V.A.; McCord, L.A.; Lee, D.; et al. Ensemble cryoEM elucidates the mechanism of insulin capture and degradation by human insulin degrading enzyme. Elife 2018, 7, e33572. [Google Scholar] [CrossRef]
- Selkoe, D.J.; Hardy, J. The amyloid hypothesis of Alzheimer’s disease at 25 years. EMBO Mol. Med. 2016, 8, 595–608. [Google Scholar] [CrossRef] [PubMed]
- Milardi, D.; Gazit, E.; Radford, S.E.; Xu, Y.; Gallardo, R.U.; Caflisch, A.; Westermark, G.T.; Westermark, P.; Rosa, C.; Ramamoorthy, A. Proteostasis of Islet Amyloid Polypeptide: A Molecular Perspective of Risk Factors and Protective Strategies for Type II Diabetes. Chem. Rev. 2021, 121, 1845–1893. [Google Scholar] [CrossRef]
- Tang, W.J. Targeting Insulin-Degrading Enzyme to Treat Type 2 Diabetes Mellitus. Trends Endocrinol. Metab. 2016, 27, 24–34. [Google Scholar] [CrossRef] [Green Version]
- Kurochkin, I.V.; Guarnera, E.; Berezovsky, I.N. Insulin-Degrading Enzyme in the Fight against Alzheimer’s Disease. Trends Pharmacol. Sci. 2018, 39, 49–58. [Google Scholar] [CrossRef]
- Gonzalez-Casimiro, C.M.; Merino, B.; Casanueva-Alvarez, E.; Postigo-Casado, T.; Camara-Torres, P.; Fernandez-Diaz, C.M.; Leissring, M.A.; Cozar-Castellano, I.; Perdomo, G. Modulation of Insulin Sensitivity by Insulin-Degrading Enzyme. Biomedicines 2021, 9, 86. [Google Scholar] [CrossRef]
- Leissring, M.A.; Gonzalez-Casimiro, C.M.; Merino, B.; Suire, C.N.; Perdomo, G. Targeting Insulin-Degrading Enzyme in Insulin Clearance. Int. J. Mol. Sci. 2021, 22, 2235. [Google Scholar] [CrossRef]
- Abdul-Hay, S.O.; Lane, A.L.; Caulfield, T.R.; Claussin, C.; Bertrand, J.; Masson, A.; Choudhry, S.; Fauq, A.H.; Maharvi, G.M.; Leissring, M.A. Optimization of peptide hydroxamate inhibitors of insulin-degrading enzyme reveals marked substrate-selectivity. J. Med. Chem. 2013, 56, 2246–2255. [Google Scholar] [CrossRef]
- Suire, C.N.; Nainar, S.; Fazio, M.; Kreutzer, A.G.; Paymozd-Yazdi, T.; Topper, C.L.; Thompson, C.R.; Leissring, M.A. Peptidic inhibitors of insulin-degrading enzyme with potential for dermatological applications discovered via phage display. PLoS ONE 2018, 13, e0193101. [Google Scholar] [CrossRef]
- Deprez-Poulain, R.; Hennuyer, N.; Bosc, D.; Liang, W.G.; Enee, E.; Marechal, X.; Charton, J.; Totobenazara, J.; Berte, G.; Jahklal, J.; et al. Catalytic site inhibition of insulin-degrading enzyme by a small molecule induces glucose intolerance in mice. Nat Commun. 2015, 6, 8250. [Google Scholar] [CrossRef] [Green Version]
- Yang, D.; Qin, W.; Shi, X.; Zhu, B.; Xie, M.; Zhao, H.; Teng, B.; Wu, Y.; Zhao, R.; Yin, F.; et al. Stabilized β-Hairpin Peptide Inhibits Insulin Degrading Enzyme. J. Med. Chem. 2018, 61, 8174–8185. [Google Scholar] [CrossRef]
- Maianti, J.P.; McFedries, A.; Foda, Z.H.; Kleiner, R.E.; Du, X.Q.; Leissring, M.A.; Tang, W.J.; Charron, M.J.; Seeliger, M.A.; Saghatelian, A.; et al. Anti-diabetic activity of insulin-degrading enzyme inhibitors mediated by multiple hormones. Nature 2014, 511, 94–98. [Google Scholar] [CrossRef] [Green Version]
- Baroni, L.; Sarni, A.R.; Zuliani, C. Plant Foods Rich in Antioxidants and Human Cognition: A Systematic Review. Antioxidants 2021, 10, 714. [Google Scholar] [CrossRef] [PubMed]
- Bucciantini, M.; Leri, M.; Nardiello, P.; Casamenti, F.; Stefani, M. Olive Polyphenols: Antioxidant and Anti-Inflammatory Properties. Antioxidants 2021, 10, 1044. [Google Scholar] [CrossRef] [PubMed]
- Silva, R.F.M.; Pogacnik, L. Polyphenols from Food and Natural Products: Neuroprotection and Safety. Antioxidants 2020, 9, 61. [Google Scholar] [CrossRef] [PubMed] [Green Version]
- Kim, H.; Castellon-Chicas, M.J.; Arbizu, S.; Talcott, S.T.; Drury, N.L.; Smith, S.; Mertens-Talcott, S.U. Mango (Mangifera indica L.) Polyphenols: Anti-Inflammatory Intestinal Microbial Health Benefits, and Associated Mechanisms of Actions. Molecules 2021, 26, 2732. [Google Scholar] [CrossRef]
- Zheng, Q.; Kebede, M.T.; Kemeh, M.M.; Islam, S.; Lee, B.; Bleck, S.D.; Wurfl, L.A.; Lazo, N.D. Inhibition of the Self-Assembly of Aβ and of Tau by Polyphenols: Mechanistic Studies. Molecules 2019, 24, 2316. [Google Scholar] [CrossRef] [Green Version]
- Hameed, A.; Galli, M.; Adamska-Patruno, E.; Kretowski, A.; Ciborowski, M. Select Polyphenol-Rich Berry Consumption to Defer or Deter Diabetes and Diabetes-Related Complications. Nutrients 2020, 12, 2538. [Google Scholar] [CrossRef]
- Pasinetti, G.M.; Wang, J.; Ho, L.; Zhao, W.; Dubner, L. Roles of resveratrol and other grape-derived polyphenols in Alzheimer’s disease prevention and treatment. Biochim. Biophys. Acta 2015, 1852, 1202–1208. [Google Scholar] [CrossRef] [PubMed] [Green Version]
- Krasinski, C.A.; Ivancic, V.A.; Zheng, Q.; Spratt, D.E.; Lazo, N.D. Resveratrol Sustains Insulin-degrading Enzyme Activity toward Aβ42. ACS Omega 2018, 3, 13275–13282. [Google Scholar] [CrossRef] [PubMed] [Green Version]
- Ivancic, V.A.; Krasinski, C.A.; Zheng, Q.; Meservier, R.J.; Spratt, D.E.; Lazo, N.D. Enzyme kinetics from circular dichroism of insulin reveals mechanistic insights into the regulation of insulin-degrading enzyme. Biosci. Rep. 2018, 38, BSR20181416. [Google Scholar] [CrossRef] [Green Version]
- Krasinski, C.A.; Zheng, Q.; Ivancic, V.A.; Spratt, D.E.; Lazo, N.D. The Longest Amyloid-β Precursor Protein Intracellular Domain Produced with Aβ42 Forms β-Sheet-Containing Monomers That Self-Assemble and Are Proteolyzed by Insulin-Degrading Enzyme. ACS Chem. Neurosci. 2018, 9, 2892–2897. [Google Scholar] [CrossRef]
- Sharma, S.K.; Chorell, E.; Steneberg, P.; Vernersson-Lindahl, E.; Edlund, H.; Wittung-Stafshede, P. Insulin-degrading enzyme prevents α-synuclein fibril formation in a nonproteolytical manner. Sci. Rep. 2015, 5, 12531. [Google Scholar] [CrossRef] [Green Version]
- Manno, M.; Craparo, E.F.; Martorana, V.; Bulone, D.; San Biagio, P.L. Kinetics of insulin aggregation: disentanglement of amyloid fibrillation from large-size cluster formation. Biophys. J. 2006, 90, 4585–4591. [Google Scholar] [CrossRef] [Green Version]
- Windholz, M.; Budavari, S.; Stroumtsos, L.Y.; Fertig, M.N. The Merck Index: An Encyclopedia of Chemicals and Drugs; Merck & Co.: New York, NY, USA, 1976. [Google Scholar]
- Calderon, A.A.; Zapata, J.M.; Munoz, R.; Pedreno, M.A.; Barcelo, A.R. Resveratrol production as part of the hypersensitive-like response of grapevine cells to an elicitor from Trichoderma viride. New Phytol. 1993, 124, 455–463. [Google Scholar] [CrossRef]
- Holzwarth, G.; Doty, P. The ultraviolet circular dichroism of polypeptides. J. Am. Chem. Soc. 1965, 87, 218–228. [Google Scholar] [CrossRef]
- Sang, S.; Lee, M.J.; Hou, Z.; Ho, C.T.; Yang, C.S. Stability of tea polyphenol (-)-epigallocatechin-3-gallate and formation of dimers and epimers under common experimental conditions. J. Agric. Food Chem. 2005, 53, 9478–9484. [Google Scholar] [CrossRef]
- Nelson, D.L.; Cox, M.M. Lehninger Principles of Biochemistry; W. H. Freeman and Company: New York, NY, USA, 2013. [Google Scholar]
- Bose, M.; Lambert, J.D.; Ju, J.; Reuhl, K.R.; Shapses, S.A.; Yang, C.S. The major green tea polyphenol, (-)-epigallocatechin-3-gallate, inhibits obesity, metabolic syndrome, and fatty liver disease in high-fat-fed mice. J. Nutr. 2008, 138, 1677–1683. [Google Scholar] [CrossRef]
- Chen, N.; Bezzina, R.; Hinch, E.; Lewandowski, P.A.; Cameron-Smith, D.; Mathai, M.L.; Jois, M.; Sinclair, A.J.; Begg, D.P.; Wark, J.D.; et al. Green tea, black tea, and epigallocatechin modify body composition, improve glucose tolerance, and differentially alter metabolic gene expression in rats fed a high-fat diet. Nutr. Res. 2009, 29, 784–793. [Google Scholar] [CrossRef]
- Ueda, M.; Nishiumi, S.; Nagayasu, H.; Fukuda, I.; Yoshida, K.; Ashida, H. Epigallocatechin gallate promotes GLUT4 translocation in skeletal muscle. Biochem. Biophys. Res. Commun. 2008, 377, 286–290. [Google Scholar] [CrossRef]
- Yang, C.S.; Zhang, J.; Zhang, L.; Huang, J.; Wang, Y. Mechanisms of body weight reduction and metabolic syndrome alleviation by tea. Mol. Nutr. Food Res. 2016, 60, 160–174. [Google Scholar] [CrossRef]
- Ni, D.; Ai, Z.; Munoz-Sandoval, D.; Suresh, R.; Ellis, P.R.; Yuqiong, C.; Sharp, P.A.; Butterworth, P.J.; Yu, Z.; Corpe, C.P. Inhibition of the facilitative sugar transporters (GLUTs) by tea extracts and catechins. FASEB J. 2020, 34, 9995–10010. [Google Scholar] [CrossRef]
- Nishiumi, S.; Bessyo, H.; Kubo, M.; Aoki, Y.; Tanaka, A.; Yoshida, K.; Ashida, H. Green and black tea suppress hyperglycemia and insulin resistance by retaining the expression of glucose transporter 4 in muscle of high-fat diet-fed C57BL/6J mice. J. Agric. Food Chem. 2010, 58, 12916–12923. [Google Scholar] [CrossRef]
- Keske, M.A.; Ng, H.L.; Premilovac, D.; Rattigan, S.; Kim, J.A.; Munir, K.; Yang, P.; Quon, M.J. Vascular and metabolic actions of the green tea polyphenol epigallocatechin gallate. Curr. Med. Chem. 2015, 22, 59–69. [Google Scholar] [CrossRef] [Green Version]
- Vingtdeux, V.; Giliberto, L.; Zhao, H.; Chandakkar, P.; Wu, Q.; Simon, J.E.; Janle, E.M.; Lobo, J.; Ferruzzi, M.G.; Davies, P.; et al. AMP-activated protein kinase signaling activation by resveratrol modulates amyloid-β peptide metabolism. J. Biol. Chem. 2010, 285, 9100–9113. [Google Scholar] [CrossRef] [Green Version]
- Karuppagounder, S.S.; Pinto, J.T.; Xu, H.; Chen, H.L.; Beal, M.F.; Gibson, G.E. Dietary supplementation with resveratrol reduces plaque pathology in a transgenic model of Alzheimer’s disease. Neurochem. Int. 2009, 54, 111–118. [Google Scholar] [CrossRef] [Green Version]


| Polyphenol | KM (M) | kcat (s−1) | kcat/KM (M−1S−1) |
|---|---|---|---|
| None | 1.8 ± 0.2 × 10⁻⁵ | 0.043 ± 0.0006 | 2.4 ± 0.3 × 10³ |
| None/Ethanol * | 1.6 ± 0.2 × 10⁻⁵ | 0.041 ± 0.001 | 2.6 ± 0.3 × 10³ |
| Resveratrol (20 μM) | 2.6 ± 1.2 × 10⁻⁵ | 0.043 ± 0.003 | 1.8 ± 0.6 × 10³ |
| Resveratrol (40 μM) | 1.7 ± 0.3 × 10⁻⁵ | 0.040 ± 0.004 | 2.3 ± 0.1 × 10³ |
| EGCG (20 μM) | 3.2 ± 1.2 × 10⁻⁵ | 0.037 ± 0.002 | 1.3 ± 0.4 × 10³ |
| EGCG (40 μM) | 3.7 ± 0.9 × 10⁻⁵ | 0.031 ± 0.0008 | 0.83 ± 0.2 × 10³ |
Publisher’s Note: MDPI stays neutral with regard to jurisdictional claims in published maps and institutional affiliations. |
© 2021 by the authors. Licensee MDPI, Basel, Switzerland. This article is an open access article distributed under the terms and conditions of the Creative Commons Attribution (CC BY) license (https://creativecommons.org/licenses/by/4.0/).
Share and Cite
Zheng, Q.; Kebede, M.T.; Lee, B.; Krasinski, C.A.; Islam, S.; Wurfl, L.A.; Kemeh, M.M.; Ivancic, V.A.; Jakobsche, C.E.; Spratt, D.E.; et al. Differential Effects of Polyphenols on Insulin Proteolysis by the Insulin-Degrading Enzyme. Antioxidants 2021, 10, 1342. https://doi.org/10.3390/antiox10091342
Zheng Q, Kebede MT, Lee B, Krasinski CA, Islam S, Wurfl LA, Kemeh MM, Ivancic VA, Jakobsche CE, Spratt DE, et al. Differential Effects of Polyphenols on Insulin Proteolysis by the Insulin-Degrading Enzyme. Antioxidants. 2021; 10(9):1342. https://doi.org/10.3390/antiox10091342
Chicago/Turabian StyleZheng, Qiuchen, Micheal T. Kebede, Bethany Lee, Claire A. Krasinski, Saadman Islam, Liliana A. Wurfl, Merc M. Kemeh, Valerie A. Ivancic, Charles E. Jakobsche, Donald E. Spratt, and et al. 2021. "Differential Effects of Polyphenols on Insulin Proteolysis by the Insulin-Degrading Enzyme" Antioxidants 10, no. 9: 1342. https://doi.org/10.3390/antiox10091342
APA StyleZheng, Q., Kebede, M. T., Lee, B., Krasinski, C. A., Islam, S., Wurfl, L. A., Kemeh, M. M., Ivancic, V. A., Jakobsche, C. E., Spratt, D. E., & Lazo, N. D. (2021). Differential Effects of Polyphenols on Insulin Proteolysis by the Insulin-Degrading Enzyme. Antioxidants, 10(9), 1342. https://doi.org/10.3390/antiox10091342