Abstract
Carissa spinarum Linn. has been utilized both in the food industry and as a traditional medicine for various ailments, while the responsible chemical components and action mechanisms of its antioxidative and hepatoprotective activities remain unclear. In this work, at least 17 quinic acid derivatives as potential ligands for the superoxide dismutase (SOD) enzyme from Carissa spinarum L. were screened out using the bio-affinity ultrafiltration with liquid chromatography mass spectrometry (UF–LC/MS), and 12 of them (1–12), including, three new ones (1–3), were further isolated by phytochemical methods and identified by high resolution electrospray ionization mass spectrometry (HR-ESI-MS) and extensive nuclear magnetic resonance (NMR) spectroscopic analysis. All of these isolated compounds were evaluated for their antioxidant activities by the 1,1-diphenyl-2-picrylhydrazyl (DPPH) and ferric-reducing antioxidant power (FRAP) methods. As a result, compounds 4 and 6–11 displayed similar or better antioxidant activities compared to vitamin C, which is in good agreement with the bio-affinity ultrafiltration with SOD enzyme. Then, these compounds, 4 and 6–11, with better antioxidant activity were further explored to protect the L02 cells from H2O2-induced oxidative injury by reducing the reactive oxygen species (ROS) and Malondialdehyde (MDA) production and activating the SOD enzyme. To the best of our knowledge, this is the first report to use an efficient ultrafiltration approach with SOD for the rapid screening and identification of the SOD ligands directly from a complex crude extract of Carissa spinarum, and to reveal its corresponding active compounds with good antioxidative and hepatoprotective activities.
1. Introduction
Carissa spinarum Linn., which belongs to the family Apocynaceae and the genus Carissa [1,2], is extensively distributed in Africa, Asia, Australia, and various islands of the Indian Ocean [3]. C. spinarum has been used both in the food industry and as a traditional medicine for the treatment of various ailments [3]. Its raw fruits are used for making pickles, and ripe fruits for syrup and jelly production, and in Australia, these edible berries are known as native currants [3,4]. Traditionally, the leaves and roots of this plant have been extensively used for the treatment of malaria, diarrhea, rheumatism, snake bites, gastric ulcers, diabetes, and so on [2,3,5]. Modern research has also verified its various pharmacological potentials on anti-oxidation [6], anti-inflammation [7], anti-nociception [8], anti-bacterium [6], hepatic protection [9], and wound healing [10]. Phytochemical studies have been performed on the roots, stems, and leaves of C. spinarum, leading to the isolation of a total of 15 compounds [2], including sterols [11], lignans [12], flavonoids [13], cardiac glycosides [14], sesquiterpenes [12], and phenolic acids [15,16]. Only five compounds, consisting of two sterols [11], two cardiac glycosides [14], and one phenolic acids [15], have been identified from the roots of C. spinarum so far, which is not enough to elucidate its various pharmacological potentials. Our previous study revealed that ethyl acetate (EA) extracts from the root barks of C. spinarum exhibit promising antioxidant activity [17], while the responsible components and mechanism remain unexplored.
At present, an integrative strategy combining bio-affinity ultrafiltration of target enzymes of interest with LC/MS (UF–LC/MS) has been developed and applied in the discovery of ligands for biological targets from complex samples, which allows the simultaneously high-throughput screening of the potential ligands for target enzymes and rapid identification of these candidate active molecules [18,19]. Inspired by the advantages of UF–LC/MS in the discovery of bioactive natural products and the rich experience of our research group in the application of this method coupled with various biological targets [20,21], the underlying components and mechanism of the antioxidant activity of an EA fraction of C. spinarum might be disclosed by UF–LC/MS coupled with related enzymes. Superoxide dismutase (SOD), a key endogenous antioxidant enzyme, is regarded as the main component of the defense system against oxidative stress caused by reactive oxygen species (ROS), which has been proven to be related to many physiological dysfunctions, such as cancer, hepatotoxity, and neurodegeneration [22]. Thus, in the present study, in order to explore the efficacious material basis of the antioxidant activity of C. spinarum, UF–LC/MS analysis was used to obtain SOD-combining compounds from C. spinarum, and 17 quinic acid derivatives were screened out. Then, for further structural identification and verification of the results above, UF–LC/MS-guided phytochemical isolation was performed, and 12 acyl quinic acid derivatives, including three new ones, were obtained. Finally, in vitro antioxidant and hepatoprotective assays were carried out to verify the antioxidant, ROS scavenging, and H2O2-induced hepatic protection abilities of the potential active compounds screened out. To the best of our knowledge, this is the first time UF–LC/MS method coupled with SOD has been employed in the phytochemical analysis of C. spinarum, and all these obtained compounds were first isolated from the genus Carissa. More importantly, this strategy also firstly succeeded in revealing the corresponding active compounds with good antioxidative and hepatoprotective activities directly from a complex crude extract of C. spinarum, and can provide a good showcased study for other natural products of interests.
2. Materials and Methods
2.1. Apparatus and Reagents
Thin layer chromatography (TLC) analyses were carried out on silica gel GF254 plates (Yantai Institute of Chemical Technology, Yantai, China), observed under ultraviolet (UV) light at 254 nm and sprayed with 10% H2SO4−EtOH, followed by heating on a hot plate. Medium pressure liquid chromatography (MPLC) was performed using Tauto TBP 5010 (Shanghai Tauto Biotech Co., Ltd., Shanghai, China). Column silica gel (200–300 mesh; Qingdao Marine Chemical Inc., Qingdao, China), Sephadex LH-20 gel (GE Healthcare, Chicago, USA), and ODS gel (S-50 µm, YMC, Tokyo, Japan) were used for column chromatography. A Smuwei C18 column (10 µm, 250 mm × 30 mm i.d.) on Hanbon NP7000 system (Hanbon Sci. and Tech., Jiangsu, China) was used for reversed-phase preparative high performance liquid chromatography (HPLC), a YMC-Pack ODS-A C18 (5 µm, 250 mm × 10 mm i.d.; YMC, Tokyo, Japan) column on the Agilent 1100 system (Agilent, Santa Clara, CA, USA) was used for reversed-phase semi-preparative HPLC, and a Waters Sunfire C18 (3.5 µm, 150 mm × 4.6 mm i.d.; Waters, Milford, CT, USA) column on the Agilent 1220 system (Aglient, Santa Clara, CA, USA) was applied for analytical HPLC. High resolution electrospray ionization mass spectrometry (HR-ESI–MS) data were acquired on an Agilent 1290 infinity II 6530C Q-TOF mass spectrometer (Agilent, Santa Clara, CA, USA) using a Waters ACQUITY UPLC BEH C18 column (1.7 µm, 50 mm × 2.1 mm i.d.; Milford, MA, USA). Optical rotations were measured on a PerkinElmer 341 polarimeter (PerkinElmer, Waltham, MA, USA). UV spectra were carried out on a PerkinElmer Lambda 35 UV/vis spectrometer (PerkinElmer, Waltham, MA, USA). 1D and 2D NMR spectra (1H–1H COSY: 1H–1H correlation spectroscopy; HSQC, heteronuclear single quantum correlation; HMBC, heteronuclear multiple bond correlation; NOESY, nuclear Overhauser effect spectroscopy) were recorded on a Bruker Avance 600 MHz NMR spectrometer (Bruker, Karlsruhe, Germany). Chemical shifts (δ) are expressed in parts per million (ppm) and coupling constants are given in Hertz (Hz). DPPH, FRAP, Sulforhodamine B (SRB), and ROS quantitation assays were all performed on a Tecan Infinite M200 PRO multi-functional microplate reader (Tecan, Männedorf, Switzerland).
2.2. Plant Material
The root barks of C. spinarum were collected from Mount Kenya of Meru, Kenya, and authenticated by a senior taxonomist, Professor Guangwan Hu, from the Key Laboratory of Plant Germplasm Enhancement and Specialty Agriculture of Wuhan Botanical Garden, Chinese Academy of Sciences, Wuhan, People’s Republic of China, where the voucher specimen (No. 20190501) has been deposited.
2.3. Extraction
The air-dried root barks of C. spinarum (3.2 kg) were ground and extracted with methanol (5.0 L × 4 times) by the ultrasonic technique (30 min × 2 per time) at room temperature. The concentrated crude extract (360.7 g) was suspended in H2O (3.0 L) and then sequentially partitioned with petroleum ether (3.0 L, 3 times), dichloromethane (CH2Cl2, 3.0 L, 3 times), ethyl acetate (EtOAc, 3.0 L, 3 times), and n-BuOH (3.0 L, 3 times).
2.4. Screening for Potential SOD Ligands by Ultrafiltration
The ultrafiltration screening procedure followed a previously reported method [18,20,21]. Briefly, 100 µL of the EtOAc fraction sample solution (5.0 mg/mL in Tris-HCl, pH 8.0) was incubated with active SOD (10 U) and inactivated SOD enzyme (10 U, boiled in a water bath for 15 min) at 37 °C. Thirty minutes later, the mixture was ultra-filtrated through 30 KD ultrafiltration membranes (Millipore, 0.5 mL) by centrifuging at 8000 rpm for 10 min, and the membranes were then washed by 200 µL of Tris-HCl (pH 8.0) three times and the filtrates were discarded. Subsequently, 200 µL of MeOH was added into the ultrafiltration tubes, allowed to stand for 10 min, followed by centrifugation at 8000 rpm for 10 min, and this process was repeated three times. The filtrates were collected and freeze-dried by a lyophilizer, and were then dissolved in 50 µL of MeOH and analyzed by HPLC–UV and HPLC–ESI–MS/MS. The binding degrees between the molecule ligands and SOD were assessed by the enrichment factor (EF) values, which can be calculated by the following equation: EF(%) = (As − Ac)/A0, where As, Ac, and A0 represent the HPLC peak areas obtained from incubation of the C. spinarum EA fraction with activated, inactivated, and no SOD, respectively. Additionally, all of the compounds were identified by comparison with the corresponding isolated pure compounds or the reported literature.
2.5. HPLC–UV and HPLC–ESI–MS/MS Analyses
The HPLC–UV analysis was performed on an Agilent 1220 system with a Waters Sunfire C18 (3.5 µm, 150 × 4.6 mm i.d.; Waters, Milford, CT, USA) column eluted by the following procedure: 0–15 min, 5–20% ACN−H2O; 15–45 min, 20–45% ACN−H2O (the water was supplied with 0.1% formic acid). The UV spectra were detected at 280 nm with an injection volume of 10 µL and a flow rate 0.8 mL/min. The HPLC–ESI–MS/MS data were collected on a Thermo Accela 600 series HPLC connected to a TSQ Quantum Access MAX mass spectrometer (Thermo Fisher Scientific, Waltham, MA, USA) in a negative ion mode; the detailed condition is as follows: Spray voltage of 3000 V; collision energy of 40 V; vaporizer temperature of 350 °C; capillary temperature of 250 °C; mass range of 100–1000; sheath gas pressure of 40 psi; aux gas pressure of 10 psi.
2.6. Isolation
The EtOAc fraction (14.0 g) was subjected to MPLC (ODS C18, 50 µm, 180.0 g), and eluted with a mixture of MeOH and H2O gradient system from 50% to 90% to afford five fractions, A–E. Fraction A was chromatographed over MPLC with an ODS C18 column eluted with the above system from 20% to 55% MeOH−H2O to afford subfractions, A1−A4. Fraction A1 was subjected to preparative HPLC (250 mm × 30 mm i.d., C18 10 µm, flow rate: 10.0 mL/min) performed with an elution program of 15%−65% MeOH−H2O in 35 min to afford subfractions A11−A14. A12 was further purified by semi-preparative RP-HPLC (MeOH−H2O−HCOOH, 15:85:0.05, 250 mm × 10 mm i.d., C18 5 µm, flow rate: 2.0 mL/min) to afford compounds 1 (2.4 mg), 2 (6.8 mg), and 4 (4.8 mg). A13 was subjected to semi-preparative RP-HPLC, performed with MeOH−H2O−HCOOH (21:79:0.05) to yield compound 5 (8.8 mg). Fraction A2 was subjected to preparative HPLC (flow rate: 10.0 mL/min, 20–65% MeOH−H2O in 38 min) to obtain subfractions A21−A23. Then, A22 was purified by semi-preparative RP-HPLC performed with an elution program of 20–30% MeOH−H2O with 0.05% formic acid in 30 min to afford compounds 3 (1.4 mg), 6 (27.9 mg), and 12 (2.0 mg), and A23 was later separated by semi-preparative RP-HPLC in gradient 15–25% ACN−H2O with 0.05% formic acid in 35 min to obtain compounds 7 (47.0 mg), 9 (9.3 mg), and 10 (11.2 mg). Fraction A3 was successively purified by preparative HPLC (flow rate: 10.0 mL/min, 20–70% MeOH−H2O in 40 min) and semi-preparative RP-HPLC (ACN−H2O−HCOOH, 15:85:0.05, flow rate: 2.0 mL/min) to yield compounds 8 (14.3 mg) and 11 (5.1 mg).
Data for 3-O-vanilloylquinic acid (1): Colorless oil; [α–7.5 (c 0.12, MeOH); UV (MeOH, Figure S9) λmax (log ε) 204 (4.72), 218 (4.69), 262 (4.47), 291 (4.22) nm; 1H NMR (CD3OD, 600 MHz), 13C NMR (CD3OD, 150 MHz) and 2D NMR data, see Figures S2–S8; (–)-HRESIMS [M–H]– m/z 341.0883 (calculated for C15H17O9, 341.0873, ∆ +2.9 ppm, Figure S1).
Data for 3-O-syringoylquinic acid (2): Colorless oil; [α–4.8 (c 0.23, MeOH); UV (MeOH, Figure S18) λmax (log ε) 215 (4.60), 274 (4.23) nm; 1H NMR (CD3OD, 600 MHz),13C NMR (CD3OD, 150 MHz) and 2D NMR data, see Figures S11–S17; (–)-HRESIMS [M–H]– m/z 371.0984 (calculated for C16H19O10, 371.0978, ∆ +1.6 ppm, Figure S10).
Data for 3,4-Di-O-syringoylquinic acid (3): Colorless oil; [α–25.7 (c 0.07, MeOH); UV (MeOH, Figure S27) λmax (log ε) 210 (4.59), 264 (4.04) nm; 1H NMR (CD3OD, 600 MHz), 13C NMR (CD3OD, 150 MHz) and 2D NMR data, see Figures S20–S26; (–)-HRESIMS [M–H]– m/z 551.1401 (calculated for C25H27O14, 551.1401, ∆ 0 ppm, Figure S19).
2.7. DPPH Radical Scavenging Activity Assay
The DPPH radical scavenging activity screening of the isolates was based on a method reported previously [23]. First, 190 µL of the DPPH solution (100 µM) and 10 µL of the tested samples with various concentrations were placed in a 96-well plate and then incubated for 30 min in darkness at room temperature. Vitamin C was used as the positive control and methanol as the blank control. After the incubation, the absorbance of the reaction mixture was measured with a microplate reader at 517 nm, and the IC50 value was calculated by GraphPad Prism software. Following the same procedures above, all of the tests were repeated three times independently.
2.8. Ferric Reducing Antioxidant Power (FRAP) Assay
A FRAP assay was performed following a previously reported method with modifications [24]. Briefly, 190 µL of freshly prepared FRAP working solution, which was composed of 300 mM of acetate buffer (pH 3.6), 20 mM of FeCl3·6H2O solution, and 10 mM of TPTZ solution at a ratio of 10:1:1 (v/v/v), was pre-warmed at 37 °C, and 10 µL of the sample solutions of various concentrations were mixed in a 96-well plate and incubated for 10 min at 37 °C. Then, the absorbance of the mixture was monitored by a microplate reader at 593 nm. A standard curve was established by FeSO4·7H2O, and the total antioxidant capacities of these tested compounds were calculated accordingly and expressed in terms of the FeSO4 values. Vitamin C was used as a positive control, and all of the tests were repeated three times independently.
2.9. Hepatoprotective Activity Assay
The hepatoprotective activities of the compounds of interest were evaluated according to a published method with minor modifications [25]. The L02 cell line was maintained in RPMI-1640 medium (Hyclone, UT, USA) with a 10% fetal bovine serum and 1% penicillin (100 U/mL)–streptomycin (100 µg/mL) mixture solution (Hyclone, UT, USA) in a 37 °C humidified incubator supplied with 5% CO2. Cells in the logarithmic growth phase were seeded in 96-well plates (2 × 10⁴ cells in 120 μL of culture medium per well); after 24 h of incubation, the cells were pretreated with 15 μL of the solution of the tested compounds with final gradient concentrations (25, 5, 1 μM) in triplicate for 12 h. The model and normal control groups were added to with equivalent amounts of PBS, and vitamin C were used as the positive control. Then, 15 μL of a H2O2 solution with a final concentration of 300 μM was added and incubated for 4 h (equivalent PBS for the normal control group). Finally, the cell viability was evaluated using a sulforhodamine B (SRB) test kit (BestBio, Shanghai, China) according to the manufacturer’s instructions.
2.10. Quantitation and Photography of ROS in the Hepatoprotective Assay
ROS detection was performed by 2′, 7′-Dichlorodihydrofluorescin diacetate (DCFH-DA) based fluorescent method following the instructions of a commercial ROS assay kit (Beyotime, Shanghai, China). The L02 cell pretreatment was the same as that in the hepatoprotective activity assay procedure. Following the treatment of H2O2, DCFH-DA diluted with RPMI-1640 medium (final concentration of 10 µM) was added and maintained in the incubator for 30 min, and then the cells were washed thrice with PBS and photographed by a cell imaging multi-mode reader (Cytation 1, BioTek, Winooski, VT, USA). Lastly, the fluorescence intensity was recorded on a microplate reader (λex = 488 nm; λem = 525 nm) and the fluorescence values were calibrated by the corresponding cell viabilities using the SRB method. In the same way, all of the tests were repeated three times.
2.11. Biochemical Assays
The determinations of the MDA (malondialdehyde) level and the SOD (super oxide dismutase) enzyme activity were measured by corresponding commercial kits purchased from Nanjing Jiancheng Bioengineering Institute (Nanjing, China) following the manufacturer’s instructions. The L02 cells were seeded in 6-well plates and treated by the same procedure as the hepatoprotective activity assay, and the culture supernatant and cells were then collected separately. Then, 200 µL of the culture supernatant of each group was used for the MDA level assays (thibabituric acid method (TBA)). The cells were disrupted by repeated freezing and thawing, and 20 µL of the suspension (after quantify and dilution) of each group were was for the SOD activity assays (Water Soluble Tetrazolium (WST-1) method). The group setting, reagents used, and data analyses were guided by the kit instructions.
2.12. Statistical Analyses
The activity data in this work are expressed as means ± standard deviation (SD). The standard curves used in the FRAP assays were generated by Microsoft Excel (Microsoft Corporation, Redmond, WA, USA). The IC50 values were calculated by GraphPad Prism 5 (GraphPad Software Inc., San Diego, CA, USA) using the log (inhibitor) vs. normalized response–variable slope method. The statistical analyses in this work were performed by GraphPad Prism 5 (GraphPad Software Inc., San Diego, CA, USA) using one-way ANOVA Newman–Keuls multiple comparison tests.
3. Results and Discussion
3.1. Screening for Potential SOD Ligands by UF–LC/MS
Considering the key role SOD plays in the defense against oxidative stress, the SOD-based UF–LC/MS method was used to rapidly screen for the compounds in C. spinarum with good binding ability to SOD, which might be regarded as potential SOD ligands contributing to the antioxidant activity of the extract. As shown in Figure 1, the components released from the binding complex in the bio-affinity ultrafiltration screening were analyzed by HPLC, in which 17 peaks with various binding abilities were observed. Herein, the enrichment factor (EF) values were employed to express the binding degrees between the small molecule ligands and SOD [18]. Accordingly, based on the variations of the peak areas before and after incubation with activated or inactivated SOD enzymes, the EF values of the corresponding peaks are listed in Table 1. As shown in Table 1, peak 17 (compound 10) possessed the highest binding degree (3.53%), followed by peak 15 (3.51%), peak 11 (compound 7, 3.30%), peak 10 (compound 6, 3.16%), and peak 8 (compound 12, 3.16%), while peak 1 (compound 1, −0.24%), followed by peak 2 (compound 2, 2.34%), showed the lowest binding ability. As reported, the different competitive binding interactions between the bioactive compounds and SOD might account for the differences in the EF values [26].
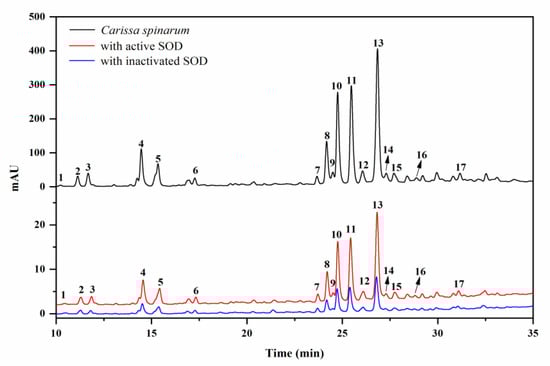
Figure 1.
HPLC chromatograms of the Carissa spinarum ethyl acetate (EA) fraction without ultrafiltration (black line, top), ultrafiltration with activated superoxide dismutase (SOD) (red line, middle), and ultrafiltration with inactivated SOD (blue line, bottom).

Table 1.
Identification of potential SOD ligands in the EA fraction of C. spinarum.
Identification of these compounds with varying affinities to SOD was carried out by comparing their LC–MS/MS data and retention time with those reported data in the literature and the corresponding isolated pure compounds in this work. The retention time (Rt), quasi-molecular ion ([M–H]– in negative ion mode), and characteristic fragments are listed in Table 1. Peaks 1–15 were all determined as quinic acid derivatives according to their coexisting typical ions at m/z 191, which belong to the [M–H]– ion for quinic acid [27]. Among these compounds, peaks 3–5 were identified as caffeoylquinic acid isomers possessing the same quasi-molecular ion at m/z 353 and fragment ion at m/z 179 for the caffeoyl group, which were further distinguished by the retention times with the isolated standards and reference data [27]. Similarly, peaks 10, 11, and 13, with the same [M–H]– ion at m/z 515, were determined to be dicaffeoylquinic acid isomers for the characteristic fragments at m/z 353, 335, and 191 [27], and these isomers were verified by comparison with the isolated corresponding pure compounds. Combined with the parent ion and coexisting fragment ion at m/z 197 attributed to the syringoyl group [28], peak 2 was determined as syringoylquinic acid, which was then isolated and proven to be a new compound according to the NMR data. Meanwhile, peaks 6, 7, and 12, exhibiting an [M–H]– ion at m/z 551, were deduced as disyringoylquinic acid isomers, while only peak 6 was obtained and further verified as a new compound. Simultaneously, peak 8 was explicitly identified as 4-O-caffeoyl-3-O-syringoylquinic acid and confirmed by the retention time with the isolated standard compound, while peak 15 was tentatively identified as a caffeoyl–sinapoylquinic acid isomer. Based on the quasi-molecular ion at m/z 341 and the fragment ion at m/z 167 attributed to the vanilloyl group [28], peak 1 was likely vanilloyl substituted quinic acid, which was further elucidated as a new compound, 3-O-vanilloylquinic acid, by the isolated compound data. Accordingly, peaks 9 and 14 were determined as caffeoyl–vanilloylquinic acid isomers by the similar fragment ions. The m/z values of the [M–H]– ion for peaks 16 and 17 were 14 Da more than for dicaffeoylquinic acid isomers, indicating the existence of a methyl substituent; therefore, these two peaks were determined unequivocally, as shown by the comparison of isolated pure compounds.
3.2. Structure Elucidation of the Isolated Compounds
The EA fraction was found to be rich in quinic acid derivatives with considerable bio-affinity to SOD, and was subjected to a series of chromatographic steps guided by the screening result to obtain 12 acyl quinic acids (1–12), which corresponded to the UF–LC/MS spectrum as shown in Table 1 and Figure 2. To the best of our knowledge, all of these compounds were first isolated from the genus Carissa [2], and compounds 1–3 are newly identified, as they have not been reported to date. Their structures were determined by comprehensive spectroscopic methods as shown in Figures S1–S27, and the detail structural elucidations of compounds 1–3 are discussed below.
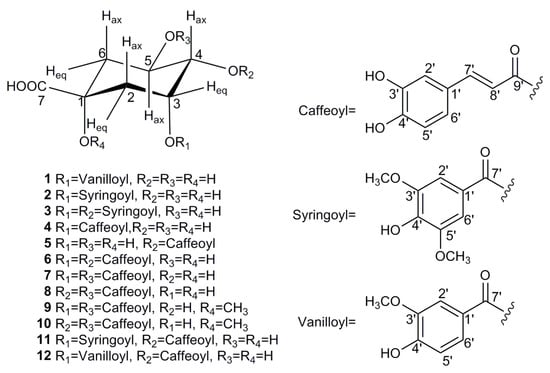
Figure 2.
Chemical structures of compounds 1–12 isolated from C. spinarum.
Compound 1 was isolated as a colorless oil. The negative HR-ESI–MS data showed an ion peak at m/z 341.0883 [M–H]– (calculated for 341.0873), indicating its molecular formula of C15H18O9. The 1H NMR data (Table 2) of 1, combined with the HSQC spectrum, displayed an ABX spin system attributed to a 1,3,4-trisubstituted benzene system (δH 7.67 (1H, d, J = 1.9 Hz, H-2′), 7.63 (1H, dd, J = 8.2, 1.9 Hz, H-6′), and 6.84 (1H, d, J = 8.2 Hz, H-5′)), which is suggestive of the existence of a vanilloyl moiety, along with the methoxy group signal at δH 3.91 (3H, s, 3′-OCH3) [28]. Additionally, the above inference was confirmed by the corresponding 13C NMR signals (Table 2) and the HMBC correlations of OCH3/C-3′; H-2′/C-3′, C-4′, C-7′; H-5′/C-1′, C-4′; and H-6′/C-1′, C-7′ (Figure 3). According to the 1H NMR (Table 2) and HSQC data, the remaining signals of three oxygenated methine protons at δH 5.50 (1H, q, J = 3.7 Hz, H-3), 4.21 (1H, td, J = 9.0, 4.0 Hz, H-5), and 3.70 (1H, dd, J = 8.4, 3.2 Hz, H-4), together with two methylene groups (δH 2.24 (1H, dd, J = 14.7, 3.6 Hz, H-2ax), 2.18 (1H, overlapped, H-2eq), 2.17 (1H, dd, J = 13.5, 3.6 Hz, H-6eq), and 1.97 (1H, dd, J = 13.5, 9.6 Hz, H-6ax)) were observed, which implies the presence of a quinic acid moiety [28,29,30]. The deduction above was further supported by the characteristic 13C NMR signals (Table 2) at δC 179.0, 75.6, 75.0, 68.5, 73.2, 41.5, and 37.0 and the HMBC correlations shown in Figure 3 [29,30]. Based on the above evidences, the structure of 1 should be a quinic acid substituted by a vanilloyl group.
Table 2.
1H NMR and 13C NMR spectroscopic data of the new compounds 1–3 a.
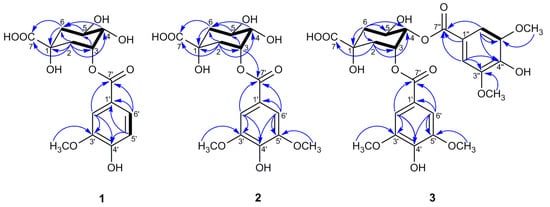
Figure 3.
Key HMBC (→) and 1H–1H COSY ( ) correlations of compounds 1–3.
) correlations of compounds 1–3.
The 1H NMR signal of H-4 in the quinic acid unit was always well defined by the 1H−1H COSY cross peaks with both oxygenated methine protons H-3 and H-5 (Figure 3), while the assignments of H-2/H-3/H-5/H-6 could be approached by the analyses of all of the spin systems and by comparisons of the angular dependence of the coupling constants [31]. In the 1H NMR spectrum of 1, H-4 showed a triplet of doublets (J = 8.4, 3.2 Hz), indicating the β-axial position of H-4 to a β-equatorially oriented H-3 at δH 5.50 (1H, q, J = 3.7 Hz) and an α-axially oriented H-5 at δH 4.21 (1H, td, J = 9.0, 4.0 Hz), which were further proved by the NOESY correlations of H-3/H-4 (Figure 4) [31,32]. In general, the 1H NMR protons of H-2ax and H-6ax appeared as dd signals for the spin–spin coupling constants derived from J2ax,2eq, J2ax,3 and J6ax,6eq, J6ax,5, respectively, while a pattern of ddd signals existed for H-2eq and H-6eq, attributed to the extra 4J2eq,6eq W coupling (nearly 2.0 Hz) [31,32], which was always overlapped in this work. Combined with the HSQC correlation, H-6ax at δH 1.97 (1H, dd, J = 13.5, 9.6 Hz) and H-6eq at δH 2.17 (1H, dd, J = 13.5, 3.6 Hz) could be well distinguished by the great difference in the coupling constants between J6ax,5 (axial–axial coupling constant, 9–11 Hz) and J6eq,5 (axial–equatorial coupling constant, 3–5 Hz) [31]. Meanwhile, the close coupling constant between J2ax,3 (axial–equatorial coupling constant, 3–5 Hz) and J2eq,3 (equatorial–equatorial coupling constant, 4–5 Hz), H-2ax at δH 2.24 (1H, dd, J = 14.7, 3.6 Hz) was differentiated by the NOESY correlation of H-2ax/H-6ax, and the other proton associated to H-2ax in the HSQC spectrum at δH 2.18 (1H, overlapped) was assigned to H-2eq. With the aid of 2D NMR data, all of the 1H and 13C NMR signals of 1 were assigned as shown in Table 2.
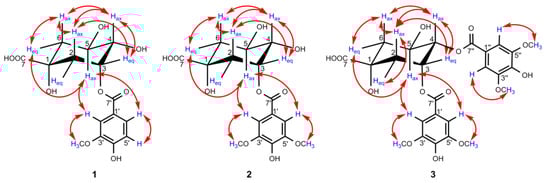
Figure 4.
Key NOESY (↔) correlations of compounds 1–3.
In the HMBC spectrum, no correlation was observed between the oxygenated protons in the quinic acid moiety and the carbonyl carbon at δC 167.9, so the vanilloyl group attached to C-3 was deduced by the downfield shift of H-3 (δH 5.50) according to the substituent chemical shifts effect [31], together with the NOESY correlations of H-5ax/H-2′ and H-6′. Meanwhile, the chair conformation of the quinic acid unit was supported by the large axial–axial coupling constants of J4,5 and J5,6ax, and these key NOESY correlations are shown in Figure 4. In conclusion, the structure of compound 1 was deduced as 3-O-vanilloylquinic acid.
The NMR data of compound 2 was similar to those of 1, except for the appearance of an extra methoxy group in 2, which was further supported by the molecular formula C16H20O10 deduced by the HRESIMS ion peak [M–H]– at m/z 371.0984 (calculated for 371.0978). In the 1H NMR and 13C NMR data (Table 2) of 2, except for the typical signals belong to the quinic acid unit similar to compound 1, two symmetric aromatic protons at δH 7.43 (2H, s, H-2′/H-6′) and two methoxy groups at δH 3.90 (6H, s, 3′/5′-OCH3) were observed. The HMBC cross-peaks (Figure 3) from OCH3 to C-3′/5′ and from H-2′/H-6′ to C-1′, C-3′/5′, C-4′, and C-7′ disclosed the presence of a syringoyl moiety in 2 [28]. An assignment of H-4 was ascertained at δH 3.69 (1H, dd, J = 8.8, 3.3 Hz) by the 1H−1H COSY correlations of H-3/H-4/H-5, H-3 at δH 5.51 (1H, q, J = 3.6 Hz), and H-5 at δH 4.23 (1H, td, J = 9.6, 4.2 Hz), which were assigned by the same coupling constant pattern as 1. Similarly, H-6ax at δH 1.96 (1H, dd, J = 13.6, 10.1 Hz) was determined by its larger coupling constant, and δH 2.25 was assigned to H-2ax by the NOESY correlation of H-2ax/H-6ax (Figure 4). Meanwhile, H-2eq and H-6eq were well defined by the associated signals of H-2ax and H-6ax in the HSQC spectrum, respectively.
In the HMBC spectrum, H-3 (δH 5.51) was correlated with C-7′ (δC 167.9), which unambiguously indicates that a syringoyl group was located at C-3, which was further confirmed by the NOESY correlations of H-5ax/H-2′, H-6′. Moreover, the key NOESY correlations of 2, as shown in Figure 4, along with the large vicinal coupling constants of J4,5 and J5,6ax, proved the chair conformation of the quinic acid unit as 1. Therefore, compound 2 was defined as 3-O-syringoylquinic acid.
Compound 3 was isolated as a colorless oil, and its positive HRESIMS data indicated an [M–H]– ion peak at m/z 551.1401 (calculated for 551.1401) corresponding to the molecular formula C25H28O14. A comparison of the 1H NMR and 13C NMR data (Table 2) of 3 and 2 revealed that the two compounds possessed quite similar structures, and the main differences lay in the two extra symmetric aromatic protons and two methoxy groups in the 1H NMR spectrum of 3, which implies that compound 3 was substituted by two syringoyl groups, supported by the presence of two sets of carbon signals in the 13C NMR spectrum belonging to the syringoyl group. Additionally, the signals of the two syringoyl groups could not be well distinguished for their similar magnitudes. For the quinic acid unit, H-4 (δH 5.30, 1H, dd, J = 8.2, 3.5 Hz) was well defined by the 1H−1H COSY correlations of H-3/H-4/H-5, and H-3 (δH 5.82, 1H, dt, J = 6.3, 3.5 Hz) could be determined by its characteristic axial–equatorial and equatorial–equatorial coupling constants with adjacent protons [32]. The remaining oxygenated protons at δH 4.39 (1H, brs) were assigned to H-5, but it is noteworthy that H-5 appeared as a broad singlet with a large half-width value (Jhw/2) of 18.3 Hz, which was nearly identical to the reported value to differentiate H-3 (Jhw/2 8–10 Hz) and H-5 (Jhw/2 20–28 Hz) when their signals appear as singlets [32,33]. H2-6 and H2-2 were distinguished by the 1H−1H COSY correlations of H-5/H-6 and H-2/H-3, respectively. Due to the overlap of H-2eq/H-6ax at δH 2.19, H-2ax (δH 2.43, 1H, dd, J = 14.6, 3.6 Hz) was preferentially identified by the NOESY correlations of H-2ax/H-4ax, and H-6eq (δH 2.25, 1H, dd, J = 13.7, 3.7 Hz) was subsequently deduced by its small coupling constants of J6eq,5 and the NOESY correlation of H-6eq/H-5 (Figure 4).
Due to the absence of a long-range correlation between carbonyl carbon at δC 167.1/167.3 and the oxygenated protons of the quinic acid unit in the HMBC spectrum of 3, the two syringoyl groups linked to C-3 and C-4 were ascertained by the downfield shift of H-3 (δH 5.82) and H-4 (δH 5.30) compared to the corresponding chemical shift data of quinic acid [31]. The assumption of the chair conformation of the quinic acid unit was evidenced by the NOESY correlations shown in Figure 4. Thus, compound 3 was elucidated as 3,4-di-O-syringoylquinic acid.
Those nine known compounds isolated from C. spinarum were all identified by the NMR data as neochlorogenic acid (4) [34], cryptochlorogenic acid (5) [35], 3,4-dicaffeoylquinic acid (6) [36], 3,5-dicaffeoylquinic acid (7) [37], 4,5-dicaffeoylquinic acid (8) [31], methyl 3,5-dicaffeoylquinate (9) [36], methyl 4,5-dicaffeoylquinate (10) [38], 4-O-caffeoyl-3-O-syringoylquinic acid (11) [29], and 4-O-caffeoyl-3-O-vanilloylquinic acid (12) [28], respectively. In addition, all of the above identifications were further confirmed by comparison with the spectroscopic data reported in the literature.
3.3. Antioxidant Activity Assays for the Isolated Compounds
In order to further confirm those potential active components screened out with UF–LC–MS targeting SOD, the free radical scavenging capacities of all isolated compounds were evaluated by making use of the stable free radical DPPH, the strong purple color of which discolors when reacted with compounds possessing antioxidant ability. The color change in DPPH can be measured spectrophotometrically at 517 nm as an index of the free radical scavenging capacities of tested compounds [39]. As a result, compounds 4 and 6–12 exhibited DPPH radical scavenging capacities of varying degrees, while the other compounds did not show obvious activity. As per the IC50 values shown in Table 3, compounds 4 and 6–11 possessed stronger DPPH radical scavenging capacities than the positive control, vitamin C, as the IC50 values ranked as follows: 9 < 10 < 6 < 8 < 7 < 4 < 11 < vitamin C < 12.
Table 3.
The antioxidant activities of compounds 1–12 and vitamin C with the DPPH and FRAP assays.
A ferric reducing antioxidant power (FRAP) assay was performed to evaluate the total antioxidant capacity of these isolated compounds, in which the intense blue color of the ferrous TPTZ complex in the reduction from ferric TPTZ could be detected at 593 nm, and the standard Fe2+ equivalent (mmol Fe2+/g) was used to express the antioxidant power [23]. Similar to the DPPH results, compounds 4 and 6–11 showed significant ferric reducing antioxidant power, among which the total antioxidant capacities of compounds 6, 8, and 10 were even stronger than the positive control, vitamin C (Table 3).
Combining the results of UF–LC–MS screening and the antioxidant verification experiments, peaks with higher EF values (peaks 8, 10, 11, and 17 corresponding to compounds 6, 7, 9, and 11, respectively; except for peak 15) showed better antioxidant activities in both the DPPH and FRAP methods, while those ones with lower EF values (peaks 1 and 2 corresponding to the compounds 1 and 2, respectively; except for peak 14 not isolated) did not show antioxidant potential in either assay. In other words, the above antioxidant activity validation is roughly consistent with the EF values listed in Table 1, which means that the UF–LC–MS method, to a certain extent, could be an efficient strategy to guide the rapid discovery of bioactive components from complex crude extracts. Certainly, due to the complicated biological factors and the mechanisms of different validation methods, UF screening may show small discrepancies; for example, compound 4 displayed good antioxidant activity but possessed a relatively lower EF value (peak 3, 2.68%), so experimental verification is definitely necessary for further acquisition of a conclusion.
3.4. Hepatoprotective Properties of the Selected Compounds
Many hepatic pathological processes are related to the oxidative stress caused by ROS, such as nonalcoholic fatty liver disease (NAFLD), fibrosis, and hepatocellular carcinoma (HCC) [40]. Thus, compounds 4 and 6–11, screened out and verified as having promising antioxidant activities, were tested for their potential in the protection of hepatic cells from H2O2-induced oxidative injury. As shown in Table 4, these tested compounds exhibited statistically significant hepatic protective effects of different degrees against H2O2-induced L02 injury compared to the negative control group, especially at the concentration of 5 μM. Except the improvement in cell viability, the ROS level in the H2O2-induced L02 cell injury model was also detected by the DCFH-DA fluorescent method with fluorescence image photography and fluorescence intensity measurement. As shown in Figure 5 and Figure S28, L02 cells treated with H2O2 exhibited an obvious increase in ROS production (p < 0.001) compared to the normal control group, while cells pretreated with compounds 4 and 6–11 (final concentration of 5 μM) showed a remarkable decrease in ROS levels (p < 0.001) in comparison to the model group, which indicated that compounds 4 and 6–11 relieved the cell death induced by H2O2 through eliminating ROS production.
Table 4.
Hepatoprotective effects of compounds 4 and 6–11 against H2O2-induced oxidative injury in L02 cells. a
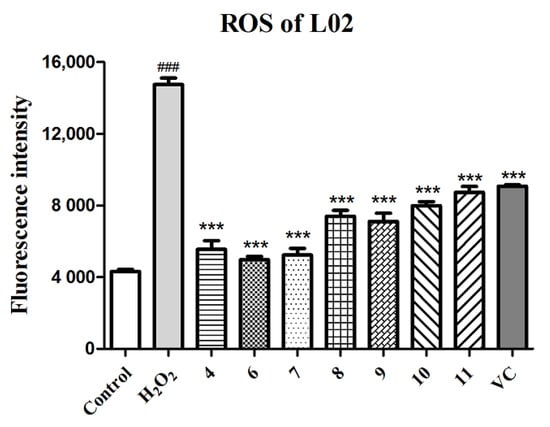
Figure 5.
Quantitation of ROS production with compounds 4 and 6–11 and the positive control (VC) at 5 µM in the H2O2-induced L02 cell injury model. The data of the cells treated with compounds only were similar to those of the control group. Data are expressed as means ± SD (n = 3). ### p < 0.001 compared to the control group and *** p < 0.001 compared to the model group.
Next, we further investigated the MDA level in the culture medium, which was a reflection of the lipid peroxidation levels in the cells and the SOD enzymatic activity of the L02 cells in each group. As exhibited in Figure 6, H2O2 induced an obvious increase in the MDA level and decrease in the SOD activity (p < 0.001), whereas this phenomenon was improved markedly in the compound- or vitamin C-treated groups. Taking all of these data into consideration, compounds 4 and 6–11 can protect L02 cells from oxidative death by reducing the ROS and MDA levels and improving the SOD activity. It has also been reported that these acyl quinic acid derivatives are a group of phenolic secondary metabolites, among which chlorogenic acid, as the most well-known one, has been used for its health benefits and has also been found to possess various pharmacological functions, such as anti-oxidative, anti-inflammatory, and anti-hypertension activities [41]. In this sense, our work further affirms its health benefits, and expands the application of acyl quinic acid derivatives as a new type of natural compound for potential hepatic protection.
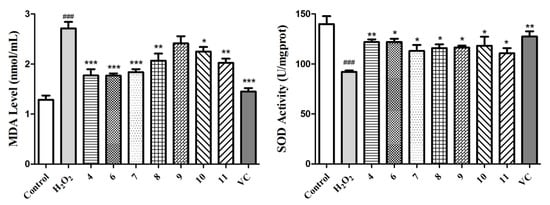
Figure 6.
Determination of the MDA levels and SOD activities for compounds 4 and 6–11 and the positive control (VC) at 5 µM using the H2O2-induced L02 cell injury model. The data of the cells treated with compounds only were similar to those of the control group. Data are expressed as means ± SD (n = 3). ### p < 0.001 compared to the control group and * p < 0.05, ** p < 0.01, and *** p < 0.001 compared to the model group.
4. Conclusions
In order to explore the responsible chemical components in the root barks of C. spinarum and their action mechanisms for antioxidative and hepatoprotective activities, SOD enzyme-based UF–LC/MS screening was firstly used to reveal that acyl quinic acid derivatives possess potential bio-affinity to SOD, and the following phytochemical investigation led to the isolation of 12 acyl quinic acid derivatives (1–12), including three new ones (1–3). Then, subsequent in vitro anti-oxidative assays further revealed that compounds 4 and 6–11 possess promising antioxidant activities with lower IC50 values than vitamin C. In consideration of the key role oxidative stress plays in different hepatic pathological processes, the H2O2-induced L02 cell oxidative injury model was further applied to evaluate the hepato-protective properties of these selected compounds based on the antioxidative activities. It turned out that compounds 4 and 6–11 could attenuate H2O2-induced cell death to different degrees by reducing ROS and MDA production and increasing the SOD activity in L02 cells. In conclusion, this study not only provides some new evidence to support the traditional use of C. spinarum for antioxidative and hepatic protection, but also offers potential antioxidative and hepatoprotective candidate compounds from C. spinarum for further application. To the best of our knowledge, this is the first report using an efficient ultrafiltration screening approach with SOD as the target to simultaneously screen and identify the antioxidant ligands directly from a complex mixture of C. spinarum, and revealing its corresponding active compounds with good antioxidative and hepatoprotective activities.
Supplementary Materials
The following are available online at www.mdpi.com/xxx.s1, Figure S1: (+)-HR-ESI–MS spectrum of 1; Figure S2: 1H NMR (600 MHz, CD3OD) spectrum of 1; Figure S3: 13C NMR (150 MHz, CD3OD) spectrum of 1; Figure S4: DEPT 135 (150 MHz, CD3OD) spectrum of 1; Figure S5: HSQC spectrum of 1 in CD3OD; Figure S6: 1H–1H COSY spectrum of 1 in CD3OD; Figure S7: HMBC spectrum of 1 in CD3OD; Figure S8: NOESY spectrum of 1 in CD3OD; Figure S9: UV spectrum of 1 in CD3OD; Figure S10. (+)-HR-ESI–MS spectrum of 2; Figure S11. 1H NMR (600 MHz, CD3OD) spectrum of 2; Figure S12: 13C NMR (150 MHz, CD3OD) spectrum of 2; Figure S13: DEPT 135 (150 MHz, CD3OD) spectrum of 2; Figure S14: HSQC spectrum of 2 in CD3OD; Figure S15: 1H–1H COSY spectrum of 2 in CD3OD; Figure S16: HMBC spectrum of 2 in CD3OD; Figure S17: NOESY spectrum of 2 in CD3OD; Figure S18: UV spectrum of 2 in CD3OD; Figure S19: (+)-HR-ESI–MS spectrum of 3; Figure S20: 1H NMR (600 MHz, CD3OD) spectrum of 3; Figure S21: 13C NMR (150 MHz, CD3OD) spectrum of 3; Figure S22: DEPT 135 (150 MHz, CD3OD) spectrum of 3; Figure S23: HSQC spectrum of 3 in CD3OD; Figure S24: 1H–1H COSY spectrum of 3 in CD3OD; Figure S25: HMBC spectrum of 3 in CD3OD; Figure S26: NOESY spectrum of 3 in CD3OD; Figure S27: UV spectrum of 3 in CD3OD; Figure S28: ROS production of compounds 4 and 6–11 and the positive control (vitamin C) at 5 µM in the H2O2-induced L02 cell injury model shown in fluorescence images photographed by a cell imaging multi-mode reader (Cytation 1, BioTek; scale bar: 500 µm, 4×).
Author Contributions
Supervision, M.-Q.G.; methodology, Y.L. and F.W.M.; cell culture, Y.-L.Z. and Y.L.; software, Y.L.; writing—original draft preparation, Y.L.; writing—review and editing, M.-Q.G.; funding acquisition, Y.L. All authors have read and agreed to the published version of the manuscript.
Funding
This research was partly supported by the Natural Science Foundation of Hubei Province, grant number 2020CFB486, to Ye Liu.
Institutional Review Board Statement
Not applicable.
Informed Consent Statement
Not applicable.
Data Availability Statement
All data in this study are included in this article and Supplementary Materials.
Conflicts of Interest
The authors declare no conflict of interest.
References
- Bhadane, B.S.; Patil, M.P.; Patil, R.H.; Maheshwari, V.L. Ethnopharmacology, phytochemistry, and biotechnological advances of family Apocynaceae: A review. Phytother. Res. 2018, 32, 1181–1210. [Google Scholar] [CrossRef]
- Kaunda, J.S.; Zhang, Y.J. The genus Carissa: An ethnopharmacological, phytochemical and pharmacological review. Nat. Prod. Bioprospect. 2017, 7, 181–199. [Google Scholar] [CrossRef] [PubMed]
- Ansari, I.; Patil, D.T. A brief review on phytochemical and pharmacological profile of Carissa spinarum L. Asian J. Pharm. Clin. Res. 2018, 11, 12–18. [Google Scholar] [CrossRef]
- Chauhan, A.; Tanwar, B.; Arneja, I. Influence of processing on physiochemical, nutritional and phytochemical composition of Carissa spinarum (karonda) fruit. Asian J. Pharm. Clin. Res. 2015, 8, 254–259. [Google Scholar]
- Maobe, M.A.G.; Gitu, L.; Gatebe, E.; Rotich, H. Phytochemical analysis of phenol and flavonoid in eight selected medicinal herbs used for the treatment of diabetes, malaria and pneumonia in Kisii, Kenya. Acad. J. Cancer Res. 2012, 5, 31–39. [Google Scholar]
- Feyissa, D.; Melaku, Y. Phytochemical, antibacterial and antioxidant studies of the leaves of Carissa spinarum. Int. J. Chem. Pharm. Sci. 2016, 7, 25–30. [Google Scholar]
- Beck, N.R.; Namdeo, K.P. Evaluation of in vivo anti-inflammatory activity of leaves extract of Carissa spinarum on formalin induced paw edema in albino rats. UK J. Pharm. Biosci. 2016, 4, 36–40. [Google Scholar] [CrossRef]
- Mworia, J.K.; Gitahi, S.M.; Juma, K.K.; Njagi, J.M.; Mwangi, B.M.; Aliyu, U.; Njoroge, W.A.; Mwonjoria, K.J.; Mawia, A.M.; Nyamai, D.W.; et al. Antinociceptive activities of acetone leaf extracts of Carissa Spinarum in mice. Med. Aromat. Plants 2015, 4, S1-006. [Google Scholar]
- Hegde, K.; Joshi, A.B. Hepatoprotective effect of Carissa carandas Linn root extract against CCl4 and paracetamol induced hepatic oxidative stress. Indian J. Exp. Biol. 2009, 47, 660–667. [Google Scholar] [PubMed]
- Sanwal, R.; Chaudhary, A.K. Wound healing and antimicrobial potential of Carissa spinarum Linn. in albino mice. J. Ethnopharmacol. 2011, 135, 792–796. [Google Scholar] [CrossRef]
- Hegde, K.; Satyanarayana, D.; Joshi, A.B. Phytochemical investigation of root extract of the plant Carissa spinarum. Rajiv Gandhi Univ. Health Sci. J. Pharm. Sci. 2012, 2, 55–59. [Google Scholar] [CrossRef]
- Rao, R.J.; Kumar, U.S.; Reddy, S.V.; Tiwari, A.K.; Rao, J.M. Antioxidants and a new germacrane sesquiteroene from Carissa spinarum. Nat. Prod. Res. 2005, 19, 763–769. [Google Scholar]
- Mathuram, V.; Brahmadhayalaselvam, A.; Hussain, A.J.; Rao, R.B.; Patra, A. Chemical constituents of Carissa spinarum and their antibacterial activity. J. Indian Chem. Soc. 1998, 75, 262–264. [Google Scholar]
- Rastogi, R.C.; Kulshreshtha, D.K.; Rastogi, R.P. Cardioactive constituents from Carissa spinarum. Indian J. Chem. 1969, 7, 1102–1104. [Google Scholar]
- Raina, M.K.; Bhatnagar, J.K.; Atal, C.K. Isolation of caffeic acid from the roots of Carissa spinarum. Indian J. Pharm. 1971, 33, 76–77. [Google Scholar]
- Wangteeraprasert, R.; Lipipun, V.; Gunaratnam, M.; Neidle, S.; Gibbons, S.; Likhitwitayawuid, K. Bioactive compounds from Carissa spinarum. Phytother. Res. 2012, 26, 1496–1499. [Google Scholar] [CrossRef] [PubMed]
- Liu, Y.; Zhang, Y.L.; Muema, F.W.; Kimutai, F.; Chen, G.L.; Guo, M.Q. Phenolic compounds from Carissa spinarum are characterized by their antioxidant, anti-inflammatory and hepatoprotective activities. Antioxidants 2021, 10, 652. [Google Scholar] [CrossRef]
- Chen, G.L.; Fan, M.X.; Wu, J.L.; Li, N.; Guo, M.Q. Antioxidant and anti-inflammatory properties of flavonoids from lotus plumule. Food Chem. 2019, 277, 706–712. [Google Scholar] [CrossRef] [PubMed]
- Jiao, J.J.; Yang, Y.Z.; Wu, Z.F.; Li, B.T.; Zheng, Q.; Wei, S.F.; Wang, Y.Q.; Yang, M. Screening cyclooxygenase-2 inhibitors from Andrographis paniculata to treat inflammation based on bio-affinity ultrafiltration coupled with UPLC-Q-TOF-MS. Fitoterapia 2019, 137, 104259. [Google Scholar] [CrossRef]
- Chen, G.L.; Wu, J.L.; Li, N.; Guo, M.Q. Screening for anti-proliferative and anti-inflammatory components from Rhamnus davurica Pall. using bio-affinity ultrafiltration with multiple drug targets. Anal. Bioanal. Chem. 2018, 410, 3587–3595. [Google Scholar] [CrossRef] [PubMed]
- Chen, G.L.; Xu, Y.B.; Wu, J.L.; Li, N.; Guo, M.Q. Hypoglycemic and hypolipidemic effects of Moringa oleifera leaves and their functional chemical constituents. Food Chem. 2020, 333, 127478. [Google Scholar] [CrossRef]
- Stephenie, S.; Chang, Y.P.; Gnanasekaran, A.; Esa, N.M.; Gnanaraj, C. An insight on superoxide dismutase (SOD) from plants for mammalian health enhancement. J. Funct. Foods 2020, 68, 103917. [Google Scholar] [CrossRef]
- Yu, H.Y.; Chen, Z.Y.; Sun, B.; Liu, J.J.; Meng, F.Y.; Liu, Y.; Tian, T.; Jin, A.; Ruan, H.L. Lignans from the fruit of Schisandra glaucescens with antioxidant and neuroprotective properties. J. Nat. Prod. 2014, 77, 1311–1320. [Google Scholar] [CrossRef]
- Xu, Y.B.; Chen, G.L.; Guo, M.Q. Antioxidant and anti-inflammatory activities of the crude extracts of Moringa oleifera from Kenya and their correlations with flavonoids. Antioxidants 2019, 8, 296. [Google Scholar] [CrossRef]
- Ma, J.; Li, M.; Kalavagunta, P.K.; Li, J.; He, Q.; Zhang, Y.; Ahmad, O.; Yin, H.; Wang, T.; Shang, J. Protective effects of cichoric acid on H2O2-induced oxidative injury in hepatocytes and larval zebrafish models. Biomed. Pharmacother. 2018, 104, 679–685. [Google Scholar] [CrossRef]
- Wang, L.; Liu, Y.F.; Luo, Y.; Huang, K.Y.; Wu, Z.Q. Quickly screening for potential α-glucosidase inhibitors from guava leaves tea by bioaffinity ultrafiltration coupled with HPLC-ESI-TOF/MS method. J. Agric. Food Chem. 2018, 66, 1576–1582. [Google Scholar] [CrossRef] [PubMed]
- Clifford, M.N.; Knight, S.; Kuhnert, N. Discriminating between the six isomers of dicaffeoylquinic acid by LC-MSn. J. Agric. Food Chem. 2005, 53, 3821–3832. [Google Scholar] [CrossRef]
- Liu, Z.Z.; Feng, Z.M.; Yang, Y.N.; Jiang, J.S.; Zhang, P.C. Acyl quinic acid derivatives from the stems of Erycibe obtusifolia. Fitoterapia 2014, 99, 109–116. [Google Scholar] [CrossRef] [PubMed]
- Song, S.; Li, Y.; Feng, Z.; Jiang, J.; Zhang, P. Hepatoprotective constituents from the roots and stems of Erycibe hainanesis. J. Nat. Prod. 2010, 73, 177–184. [Google Scholar] [CrossRef]
- Deshpande, S.; Matei, M.F.; Jaiswal, R.; Bassil, B.S.; Kortz, U.; Kuhnert, N. Synthesis, structure, and tandem mass spectrometric characterization of the diastereomers of quinic acid. J. Agric. Food Chem. 2016, 64, 7298–7306. [Google Scholar] [CrossRef] [PubMed]
- Pauli, G.F.; Poetsch, F.; Nahrstedt, A. Structure assignment of natural quinic acid derivatives using proton nuclear magnetic resonance techniques. Phytochem. Anal. 1998, 9, 177–185. [Google Scholar] [CrossRef]
- Nogueira, M.S.; Furtado, R.A.; Bastos, J.K. Flavonoids and methoxy-galloylquinic acid derivatives from the leaf extract of Copaifera langsdorffii Desf. J. Agric. Food Chem. 2015, 63, 6939–6945. [Google Scholar] [CrossRef] [PubMed]
- Nishimura, H.; Nonaka, G.I.; Nishioka, I. Seven quinic acid gallates from Quercus stenophylla. Phytochemistry 1984, 23, 2621–2623. [Google Scholar] [CrossRef]
- Nakatani, N.; Kayano, S.; Kikuzaki, H.; Sumino, K.; Katagiri, K.; Mitani, T. Identification, quantitative determination, and antioxidative activities of chlorogenic acid isomers in prune (Prunus domestica L.). J. Agric. Food Chem. 2000, 48, 5512–5516. [Google Scholar] [CrossRef] [PubMed]
- Tatefuji, T.; Izumi, N.; Ohta, T.; Arai, S.; Ikeda, M.; Kurimoto, M. Isolation and identification of compounds from Brazilian propolis which enhance macrophage spreading and mobility. Biol. Pharm. Bull. 1996, 19, 966–970. [Google Scholar] [CrossRef][Green Version]
- Chen, J.; Mangelinckx, S.; Ma, L.; Wang, Z.T.; Li, W.L.; De Kimpe, N. Caffeoylquinic acid derivatives isolated from the aerial parts of Gynura divaricata and their yeast alpha-glucosidase and PTP1B inhibitory activity. Fitoterapia 2014, 99, 1–6. [Google Scholar] [CrossRef]
- Chen, Y.H.; Chang, F.R.; Lin, Y.J.; Wang, L.S.; Chen, J.F.; Wu, Y.C.; Wu, M.J. Identification of phenolic antioxidants from Sword Brake fern (Pteris ensiformis Burm.). Food Chem. 2007, 105, 48–56. [Google Scholar] [CrossRef]
- Ono, M.; Masuoka, C.; Odake, Y.; Ikegashira, S.; Ito, Y.; Nohara, T. Antioxidative constituents from Tessaria integrifolia. Food Sci. Technol. Res. 2000, 6, 106–114. [Google Scholar] [CrossRef][Green Version]
- Holtz, R.W. Chapter 13—In vitro methods to screen materials for anti-aging effects. In Skin Aging Handbook; Dayan, N., Ed.; William Andrew Publishing: Norwich, NY, USA, 2009; pp. 329–362. [Google Scholar]
- Singal, A.K.; Jampana, S.C.; Weinman, S.A. Antioxidants as therapeutic agents for liver disease. Liver Int. 2011, 31, 1432–1448. [Google Scholar] [CrossRef] [PubMed]
- Naveed, M.; Hejazi, V.; Abbas, M.; Kamboh, A.A.; Khan, G.J.; Shumzaid, M.; Ahmad, F.; Babazadeh, D.; Xia, F.F.; Modarresi-Ghazani, F.; et al. Chlorogenic acid (CGA): A pharmacological review and call for further research. Biomed. Pharmacother. 2018, 97, 67–74. [Google Scholar] [CrossRef] [PubMed]


Publisher’s Note: MDPI stays neutral with regard to jurisdictional claims in published maps and institutional affiliations. |
© 2021 by the authors. Licensee MDPI, Basel, Switzerland. This article is an open access article distributed under the terms and conditions of the Creative Commons Attribution (CC BY) license (https://creativecommons.org/licenses/by/4.0/).