
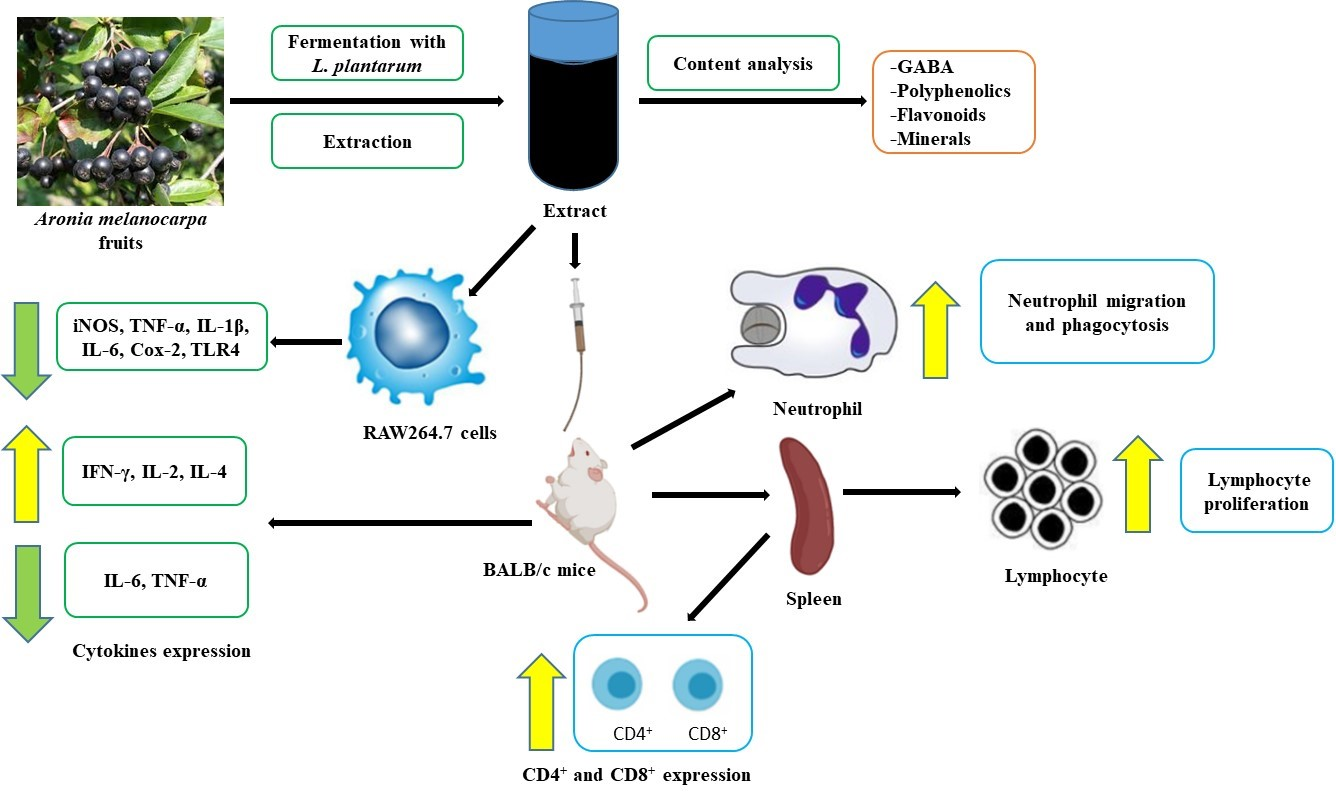
Aronia melanocarpa Extract Fermented by Lactobacillus plantarum EJ2014 Modulates Immune Response in Mice

 , , ,
, , ,  ,
,  and
and 
Abstract
: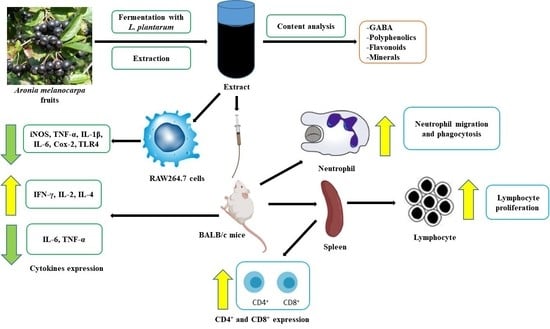
1. Introduction
2. Materials and Methods
2.1. Aronia Fruit and Reagents
2.2. Fermentation of FAME
2.3. Analysis of FAME
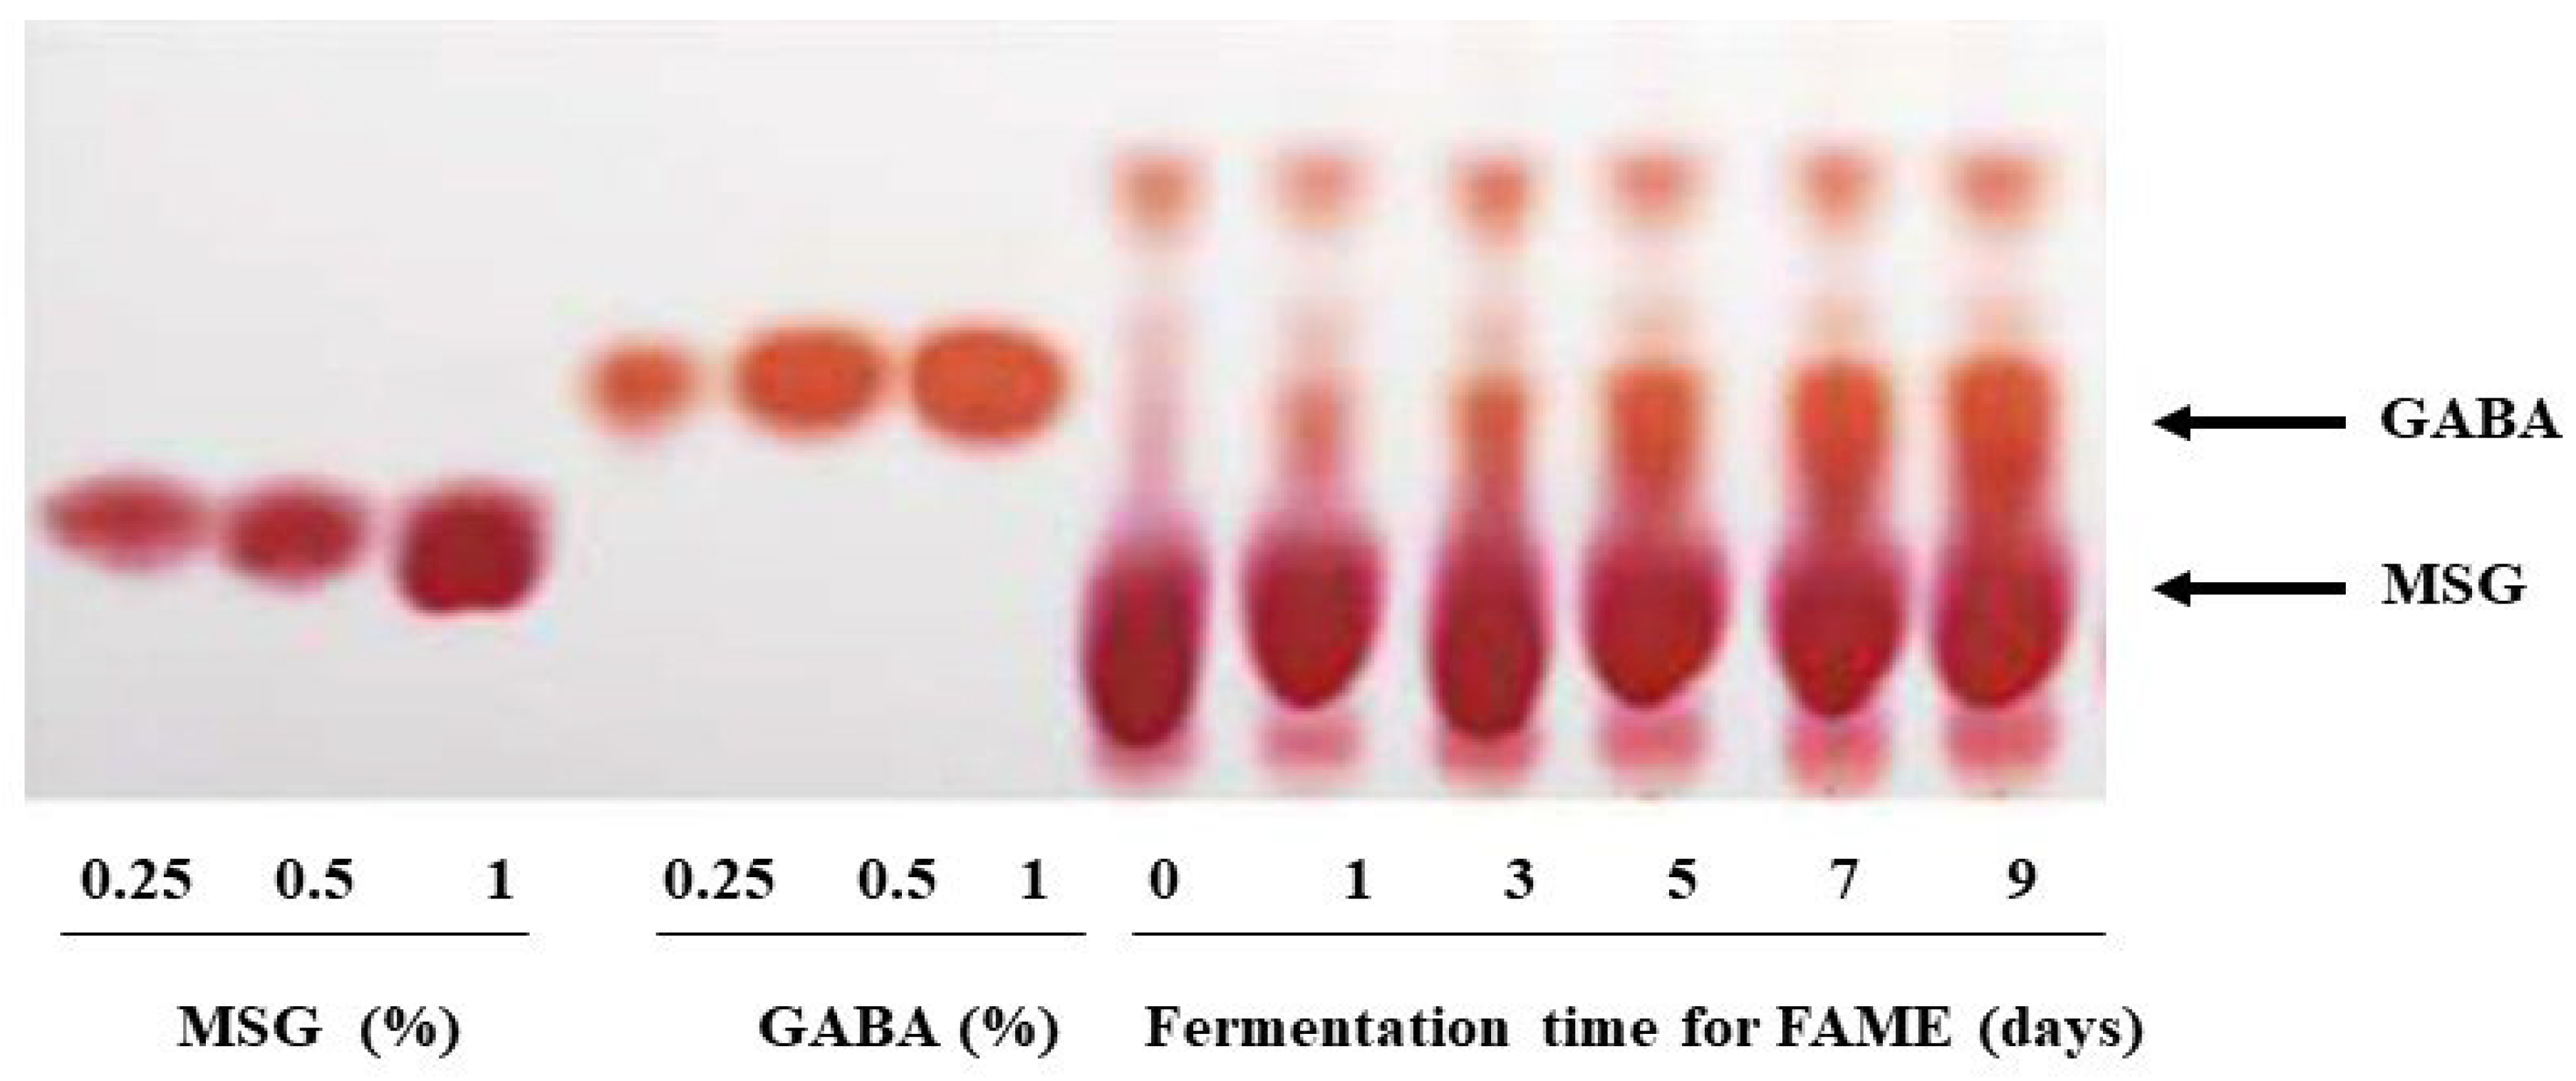
2.3.1. GABA Content
2.3.2. Antioxidant Activity
2.3.3. Mineral Content
2.3.4. pH, Acidity, and Viable Cell Count
2.3.5. Polyphenol and Flavonoid Content
2.3.6. Anthocyanin Content
2.3.7. Reducing Sugar Content
2.3.8. LC–MS/MS Analysis
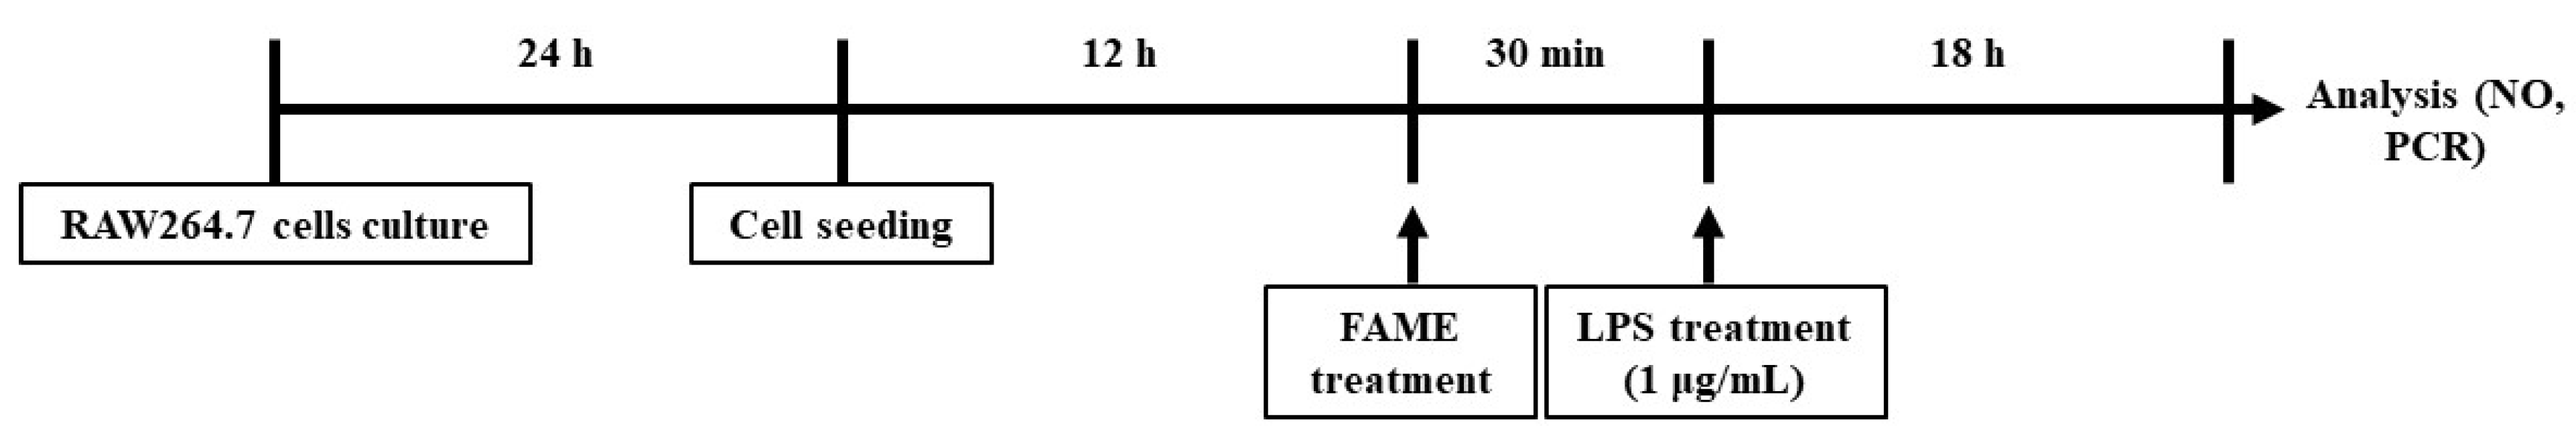
2.4. RAW 264.7 Cells and In Vitro Study Design
2.4.1. NO Assay
2.4.2. Total RNA Extraction and Traditional and Quantitative Real Time RT-PCR
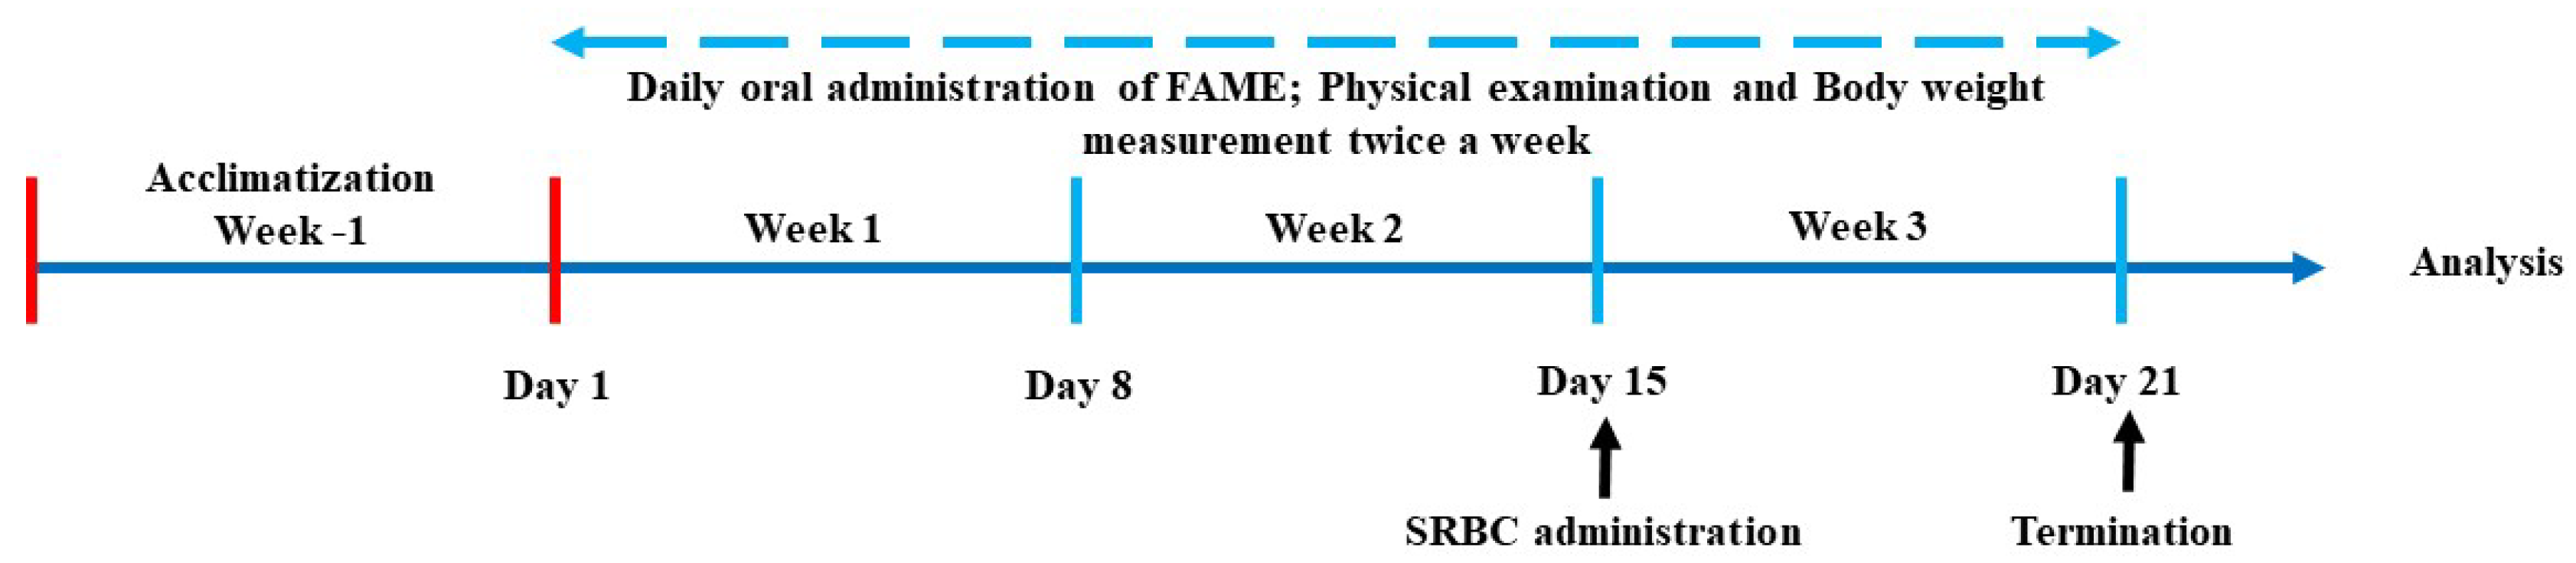
2.5. Animals and Study Design
2.5.1. Acute Oral Toxicity Test
2.5.2. Neutrophil Isolation and Counting
2.5.3. Neutrophil Migration Assay
2.5.4. Neutrophil Phagocytic Activity
2.5.5. Preparation of Splenocytes
2.5.6. Splenic Lymphocyte Proliferation Assay
2.5.7. Flow Cytometric Analysis for T-Lymphocyte Phenotyping
2.5.8. Determination of Cytokine Concentrations
2.6. Statistical Analysis
3. Results
3.1. GABA Content in FAME
3.2. Antioxidant Activity of FAME
3.3. Mineral Content in FAME
3.4. Changes in pH, Acidity, and Viable Cell Count of FAME
3.5. Polyphenol and Flavonoid Content in FAME
3.6. Anthocyanin Content in FAME
3.7. Reducing Sugar Content in FAME
3.8. LC–MS/MS Analysis of FAME
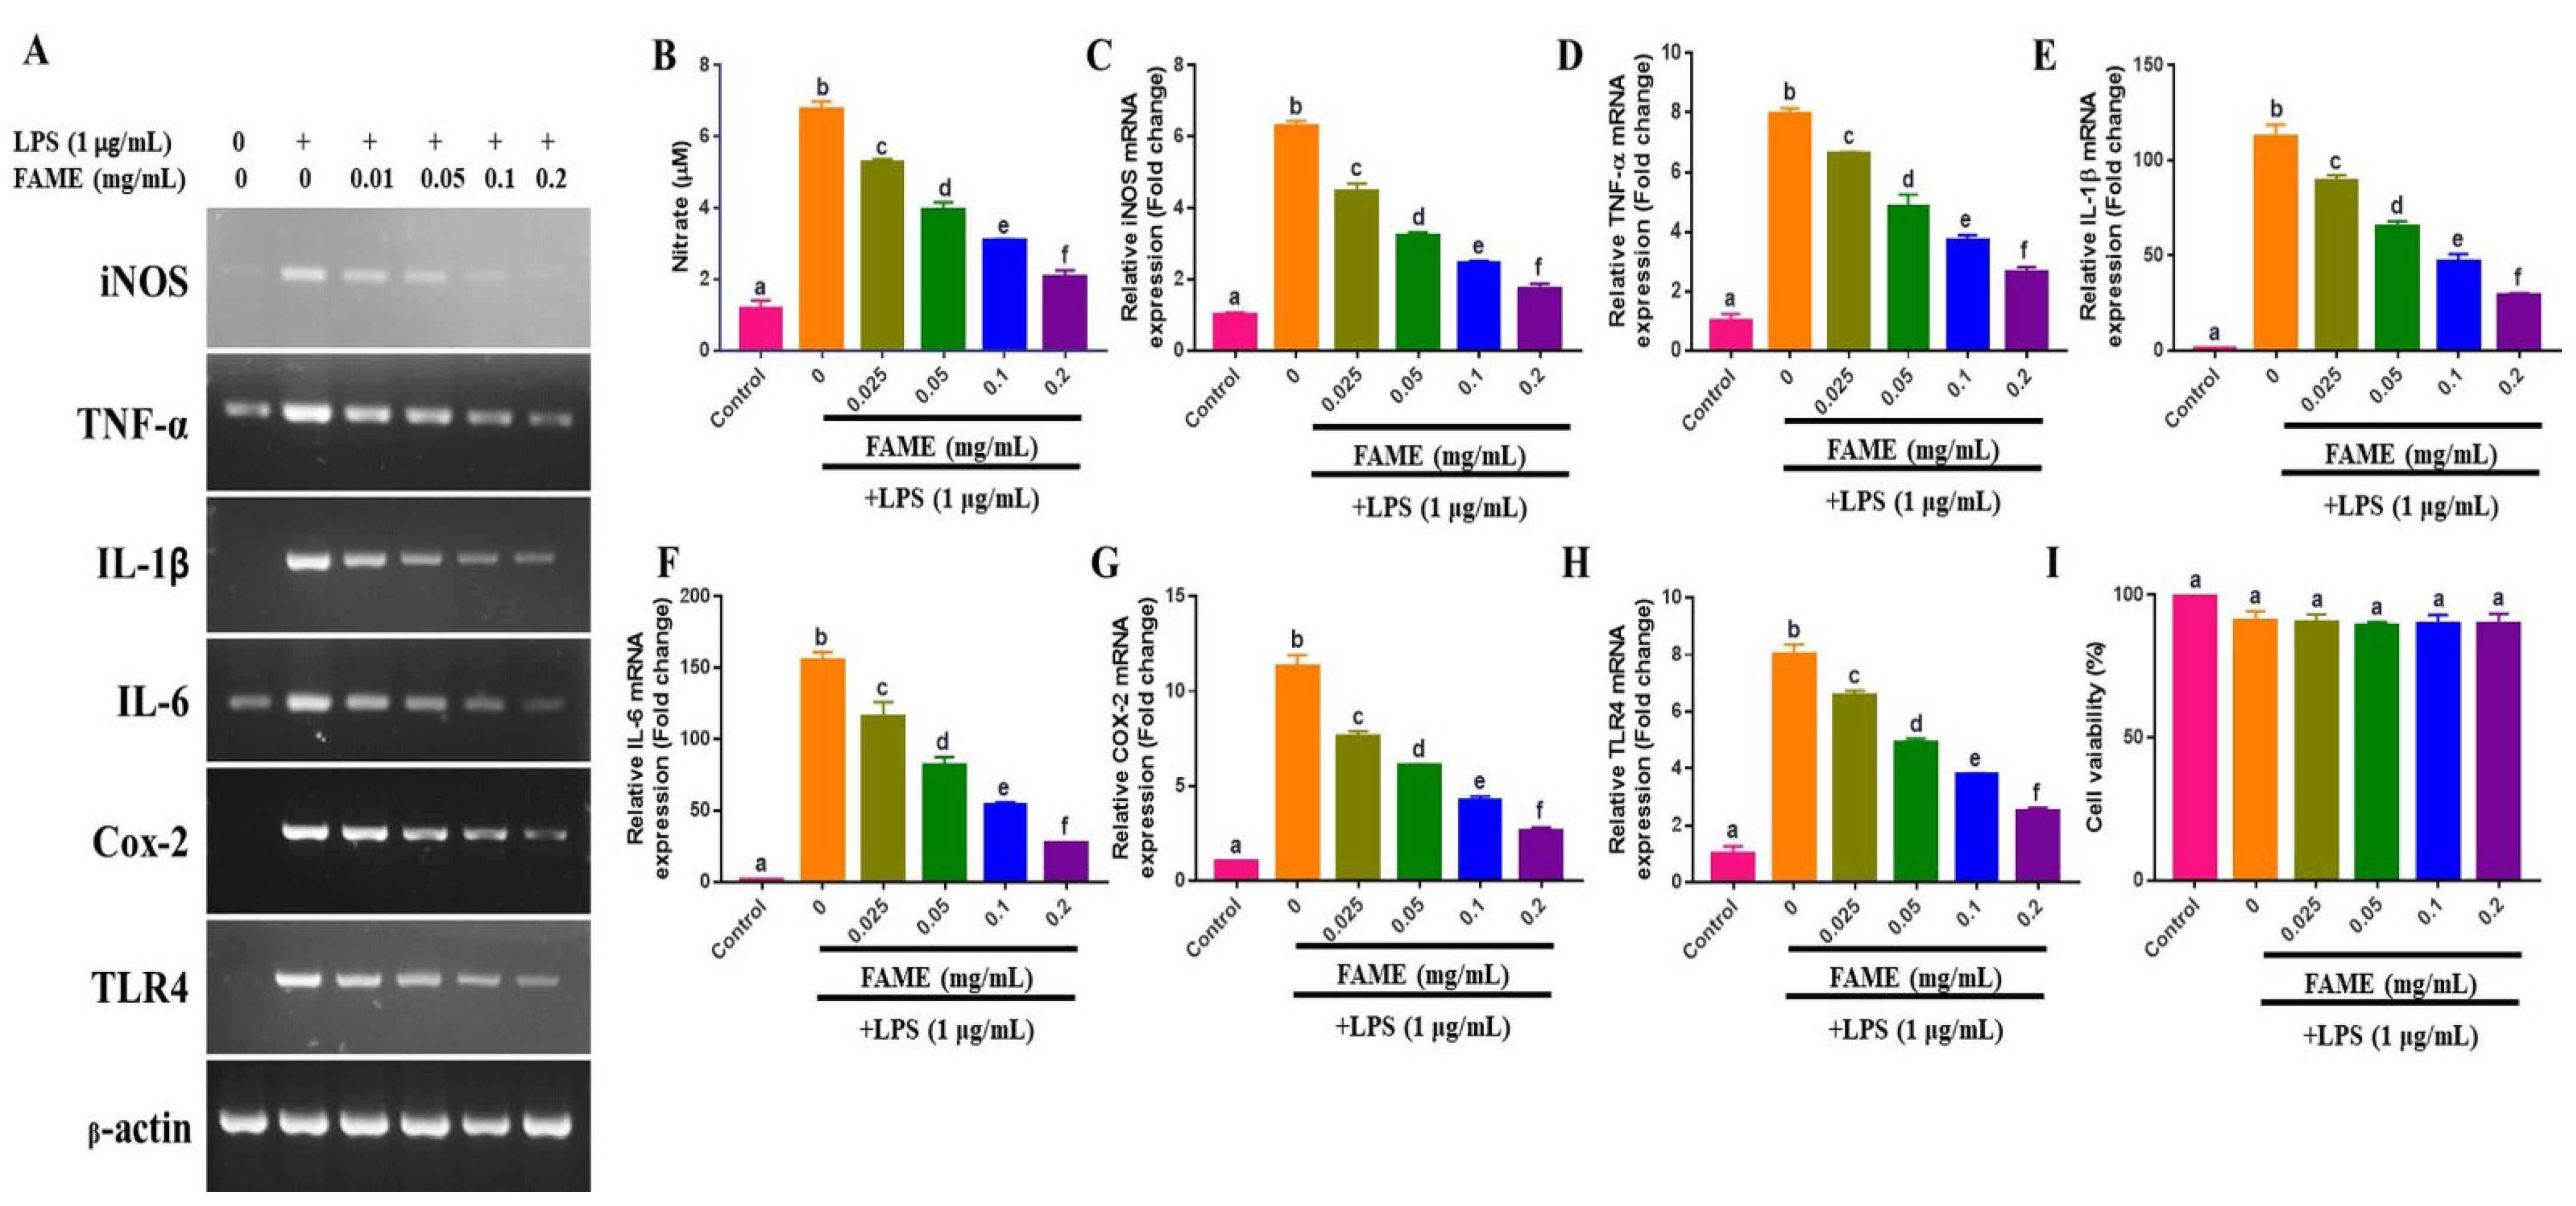
3.9. Effects of FAME on LPS-Induced NO Production and Proinflammatory Cytokine Expression in RAW 264.7 Cells
3.10. In Vivo Immunomodulatory Activities of FAME
3.10.1. Acute Oral Toxicity Test of FAME
3.10.2. Effect of FAME on Feed and Water Intake and on Body and Organ Weight
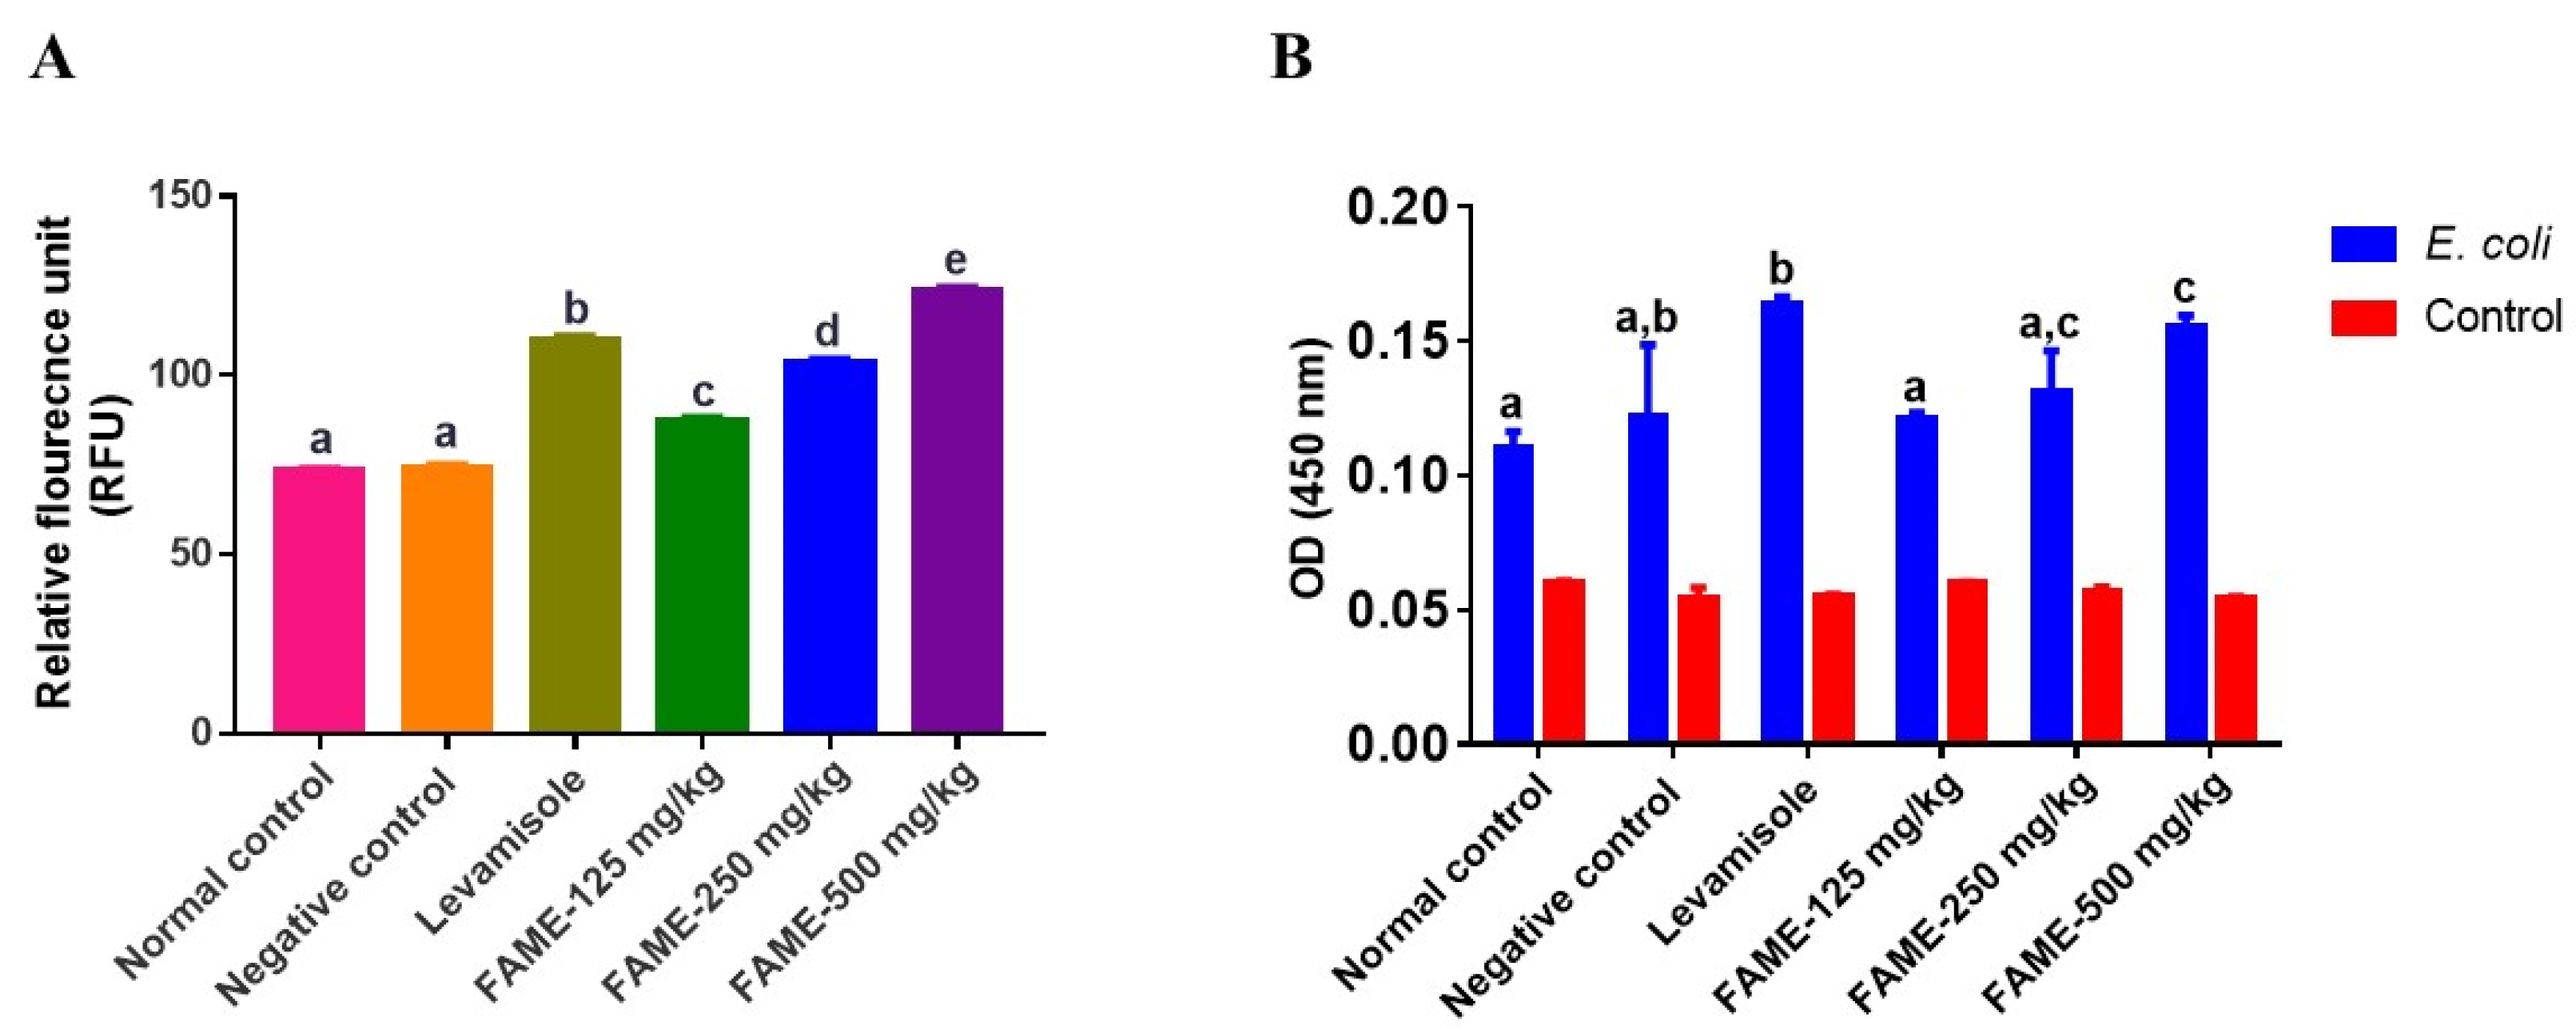
3.10.3. Effect of FAME on Neutrophil Migration and Phagocytosis
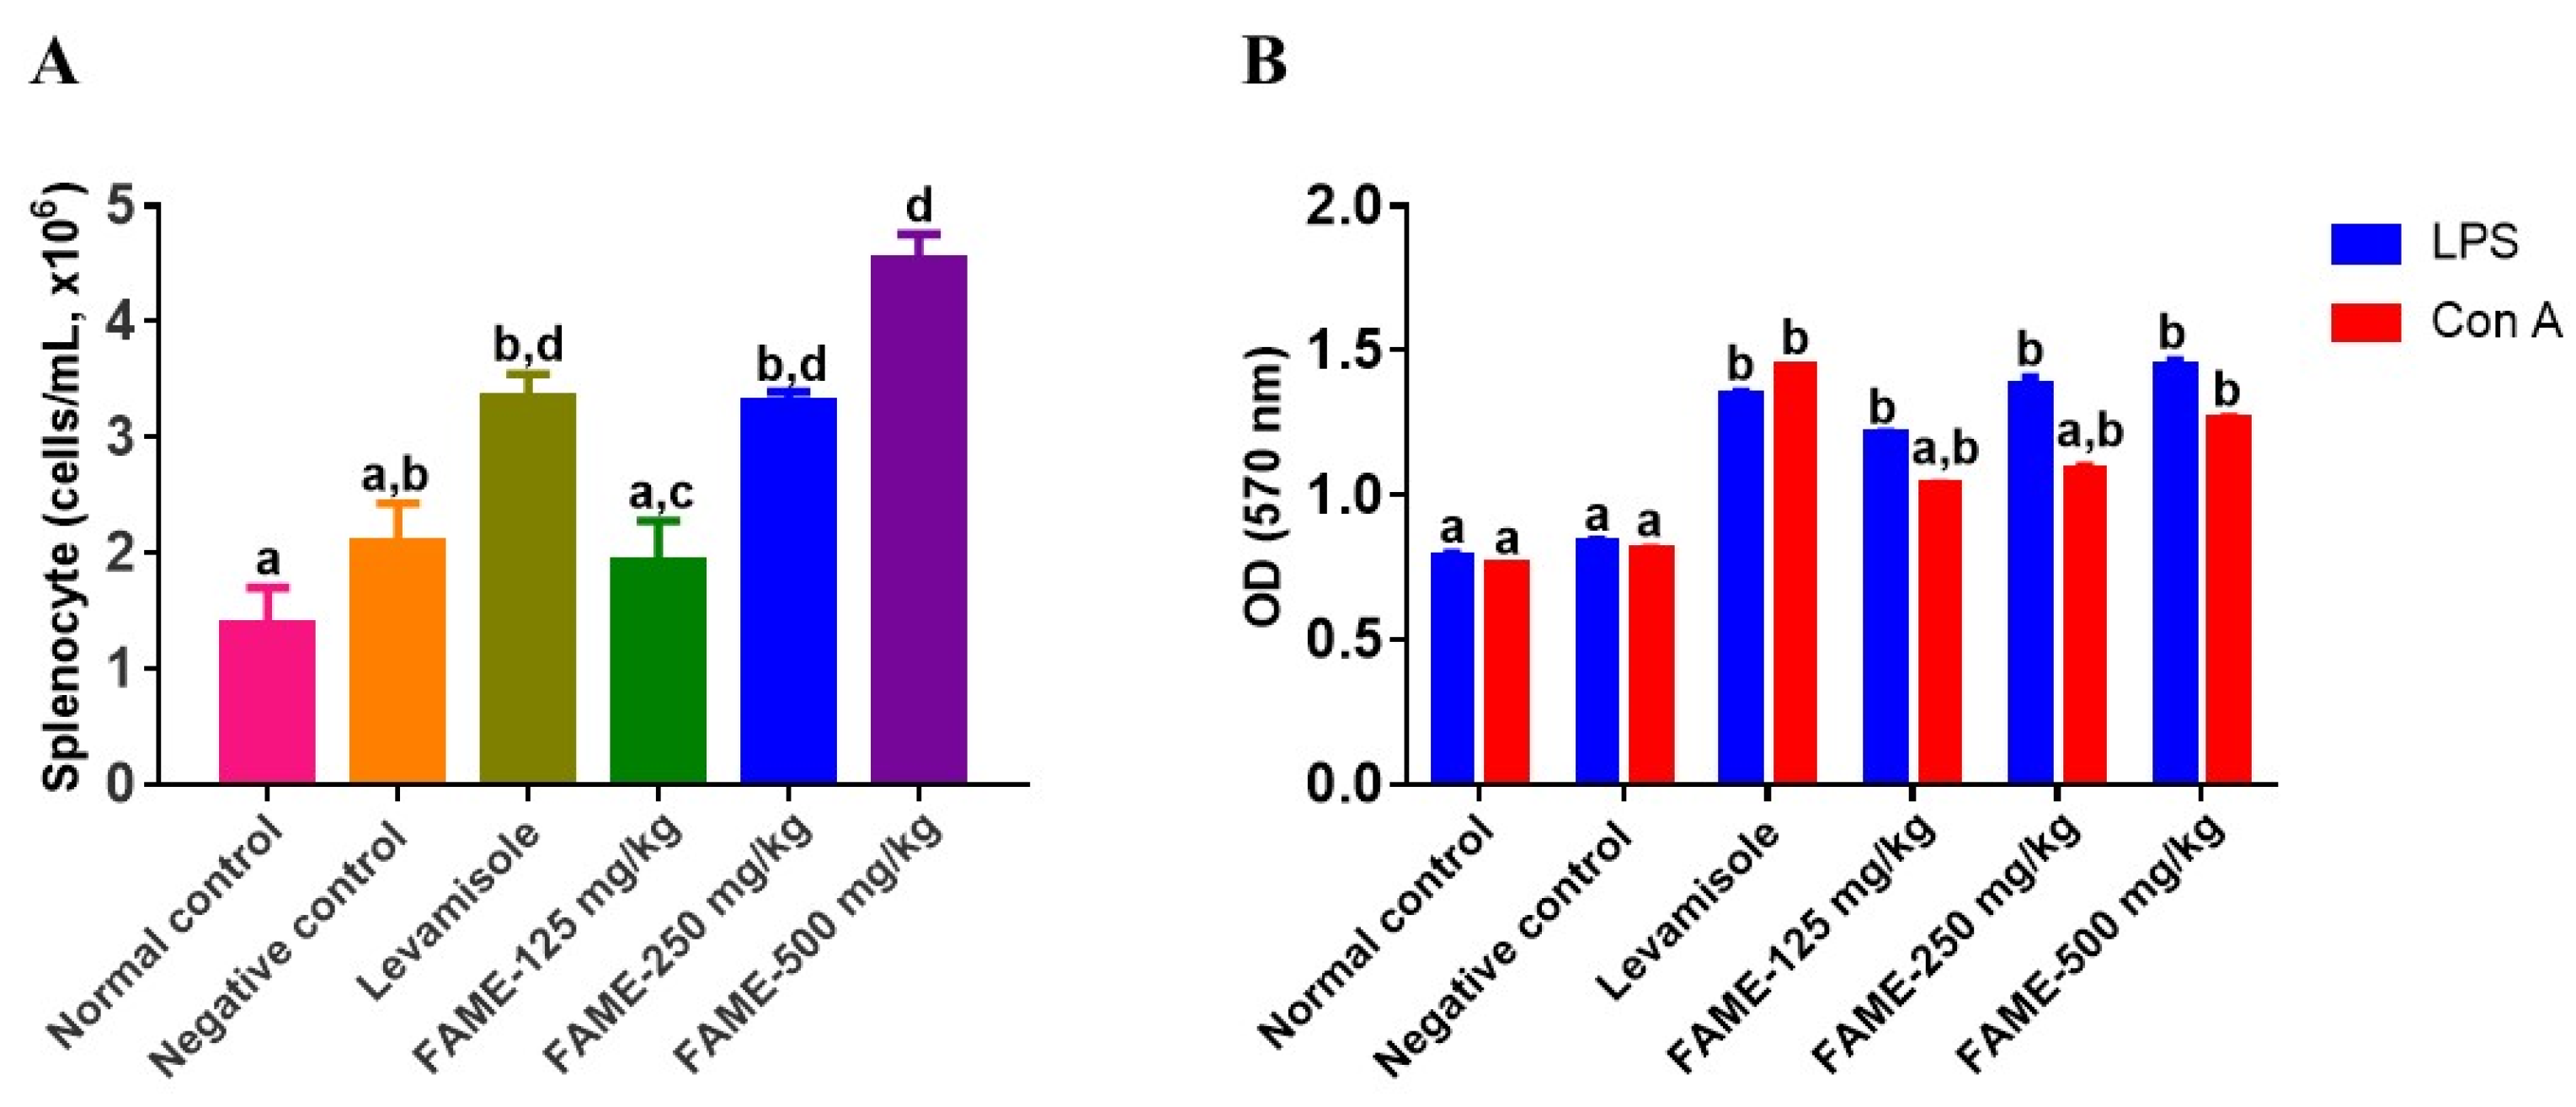
3.10.4. Effect of FAME on Splenocyte Proliferation
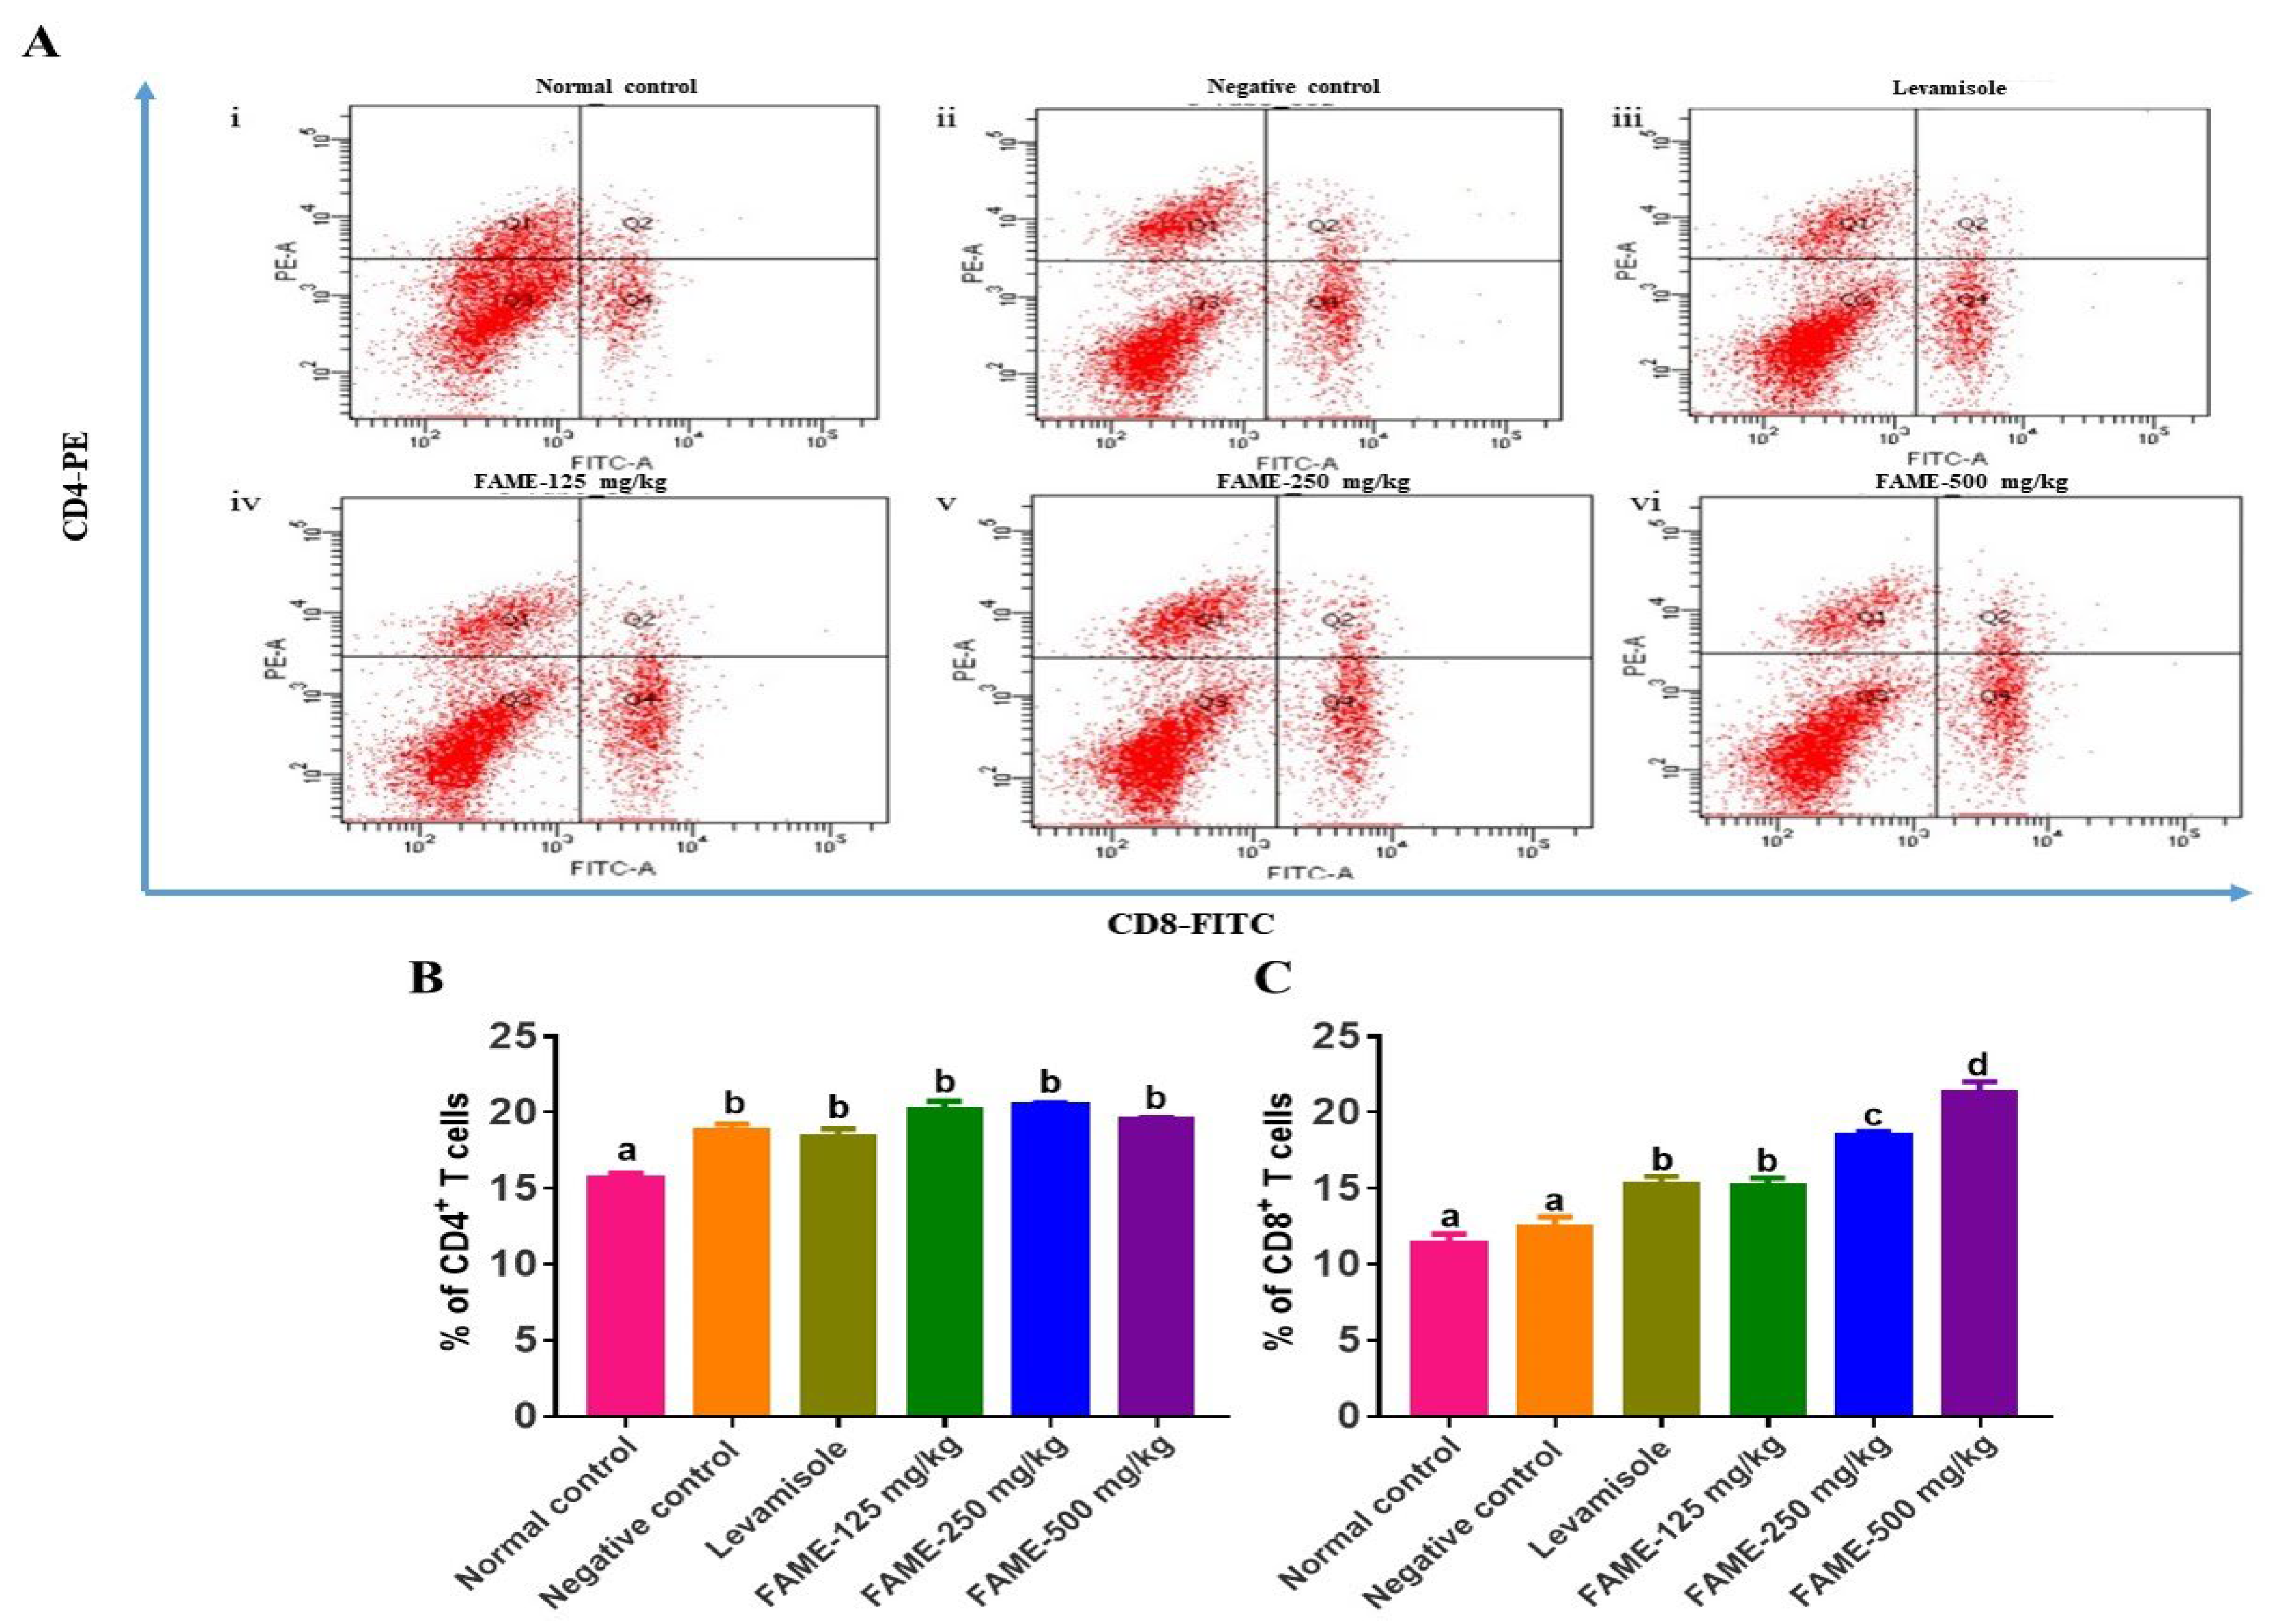
3.10.5. Effect of FAME on T-Lymphocyte Differentiation
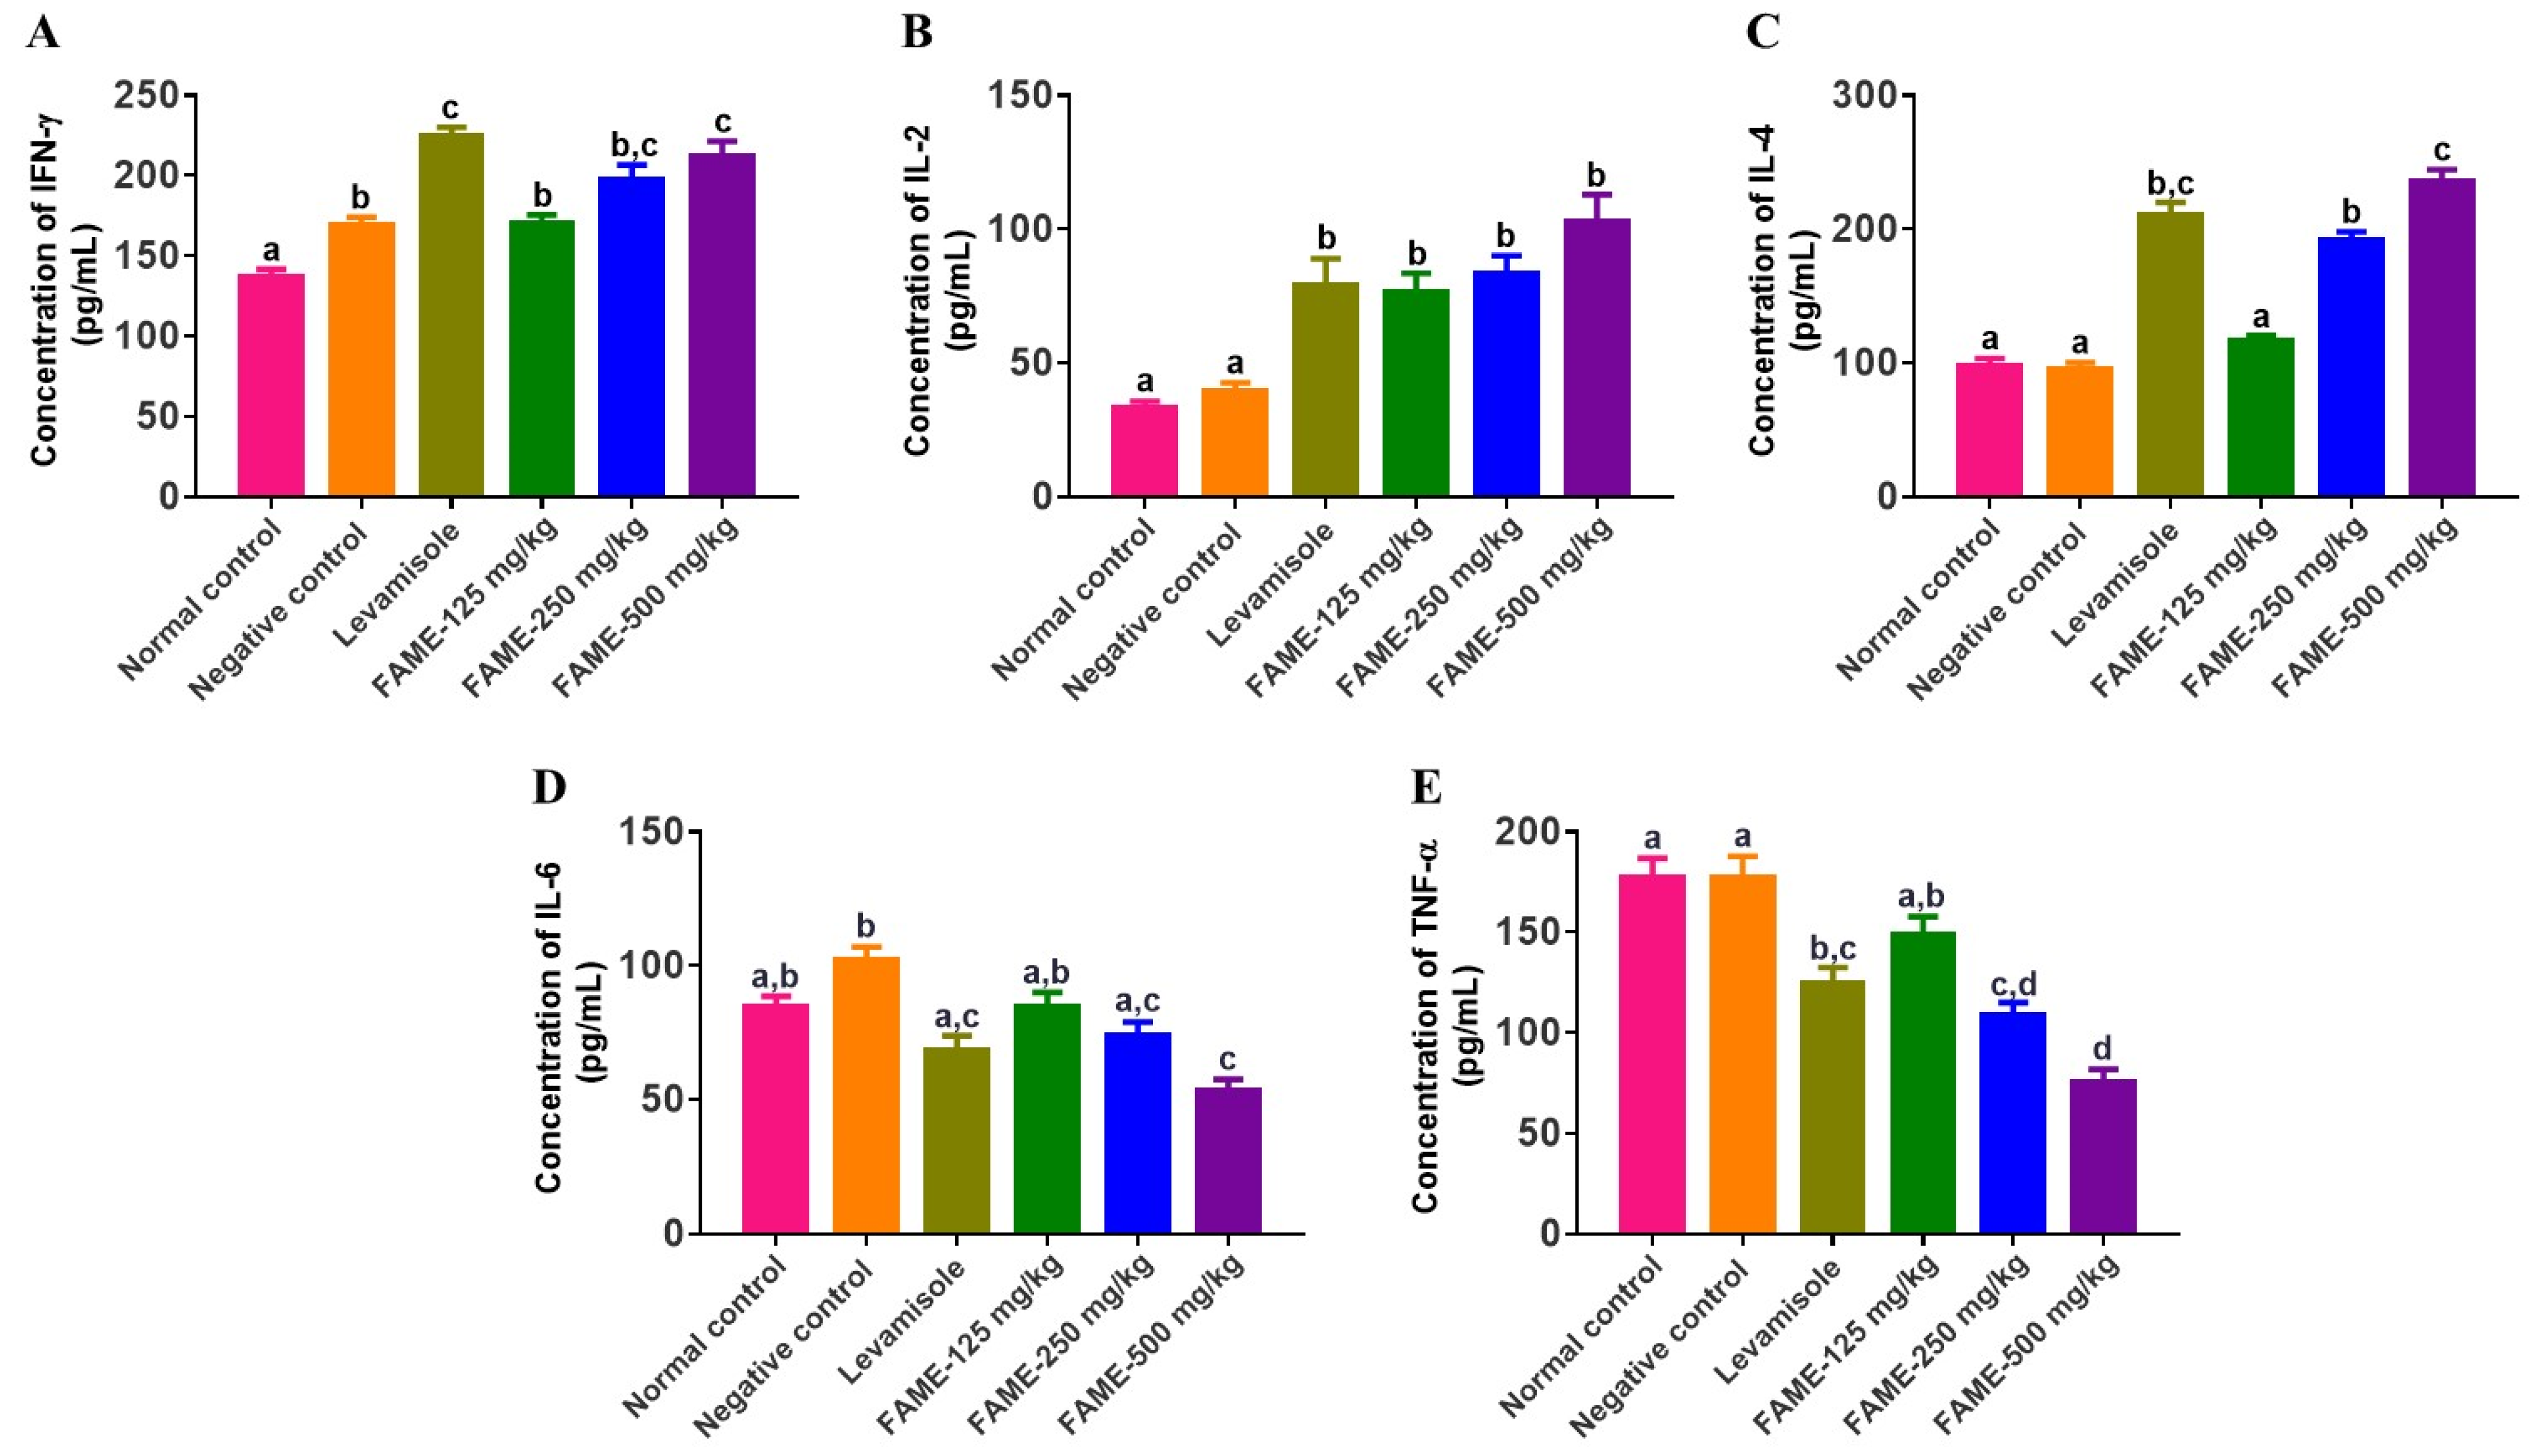
3.10.6. Effect of FAME on Cytokine Expression
4. Discussion
5. Conclusions
Supplementary Materials
Author Contributions
Funding
Institutional Review Board Statement
Informed Consent Statement
Data Availability Statement
Conflicts of Interest
References
- Agbarya, A.; Ruimi, N.; Epelbaum, R.; Ben-Arye, E.; Mahajna, J. Natural products as potential cancer therapy enhancers: A preclinical update. SAGE Open Med. 2014, 2, 2050312114546924. [Google Scholar] [CrossRef] [Green Version]
- Borowska, S.; Brzóska, M.M. Chokeberries (Aronia melanocarpa) and their products as a possible means for the prevention and treatment of noncommunicable diseases and unfavorable health effects due to exposure to xenobiotics. Compr. Rev. Food Sci. Food Saf. 2016, 15, 982–1017. [Google Scholar] [CrossRef] [Green Version]
- Broncel, M.; Kozirog, M.; Duchnowicz, P.; Koter-Michalak, M.; Sikora, J.; Chojnowska-Jezierska, J. Aronia melanocarpa extract reduces blood pressure, serum endothelin, lipid, and oxidative stress marker levels in patients with metabolic syndrome. Med. Sci. Monit. 2009, 16, CR28–CR34. [Google Scholar]
- Valcheva-Kuzmanova, S.; Gadjeva, V.; Ivanova, D.; Belcheva, A. Antioxidant activity of Aronia melanocarpa fruit juice in vitro. Acta Aliment. 2007, 36, 425–428. [Google Scholar] [CrossRef]
- Olas, B.; Wachowicz, B.; Nowak, P.; Kedzierska, M.; Tomczak, A.; Stochma, A.; Oleszek, W.; Jeziorski, A.; Piekarski, J. Studies on antioxidant properties of polyphenol-rich extract from berries of Aronia melanocarpa in blood platelets. Acta Physiol. Pol. 2008, 59, 823. [Google Scholar]
- Birhanu, B.T.; Kim, J.-Y.; Hossain, M.A.; Choi, J.-W.; Lee, S.-P.; Park, S.-C. An in vivo immunomodulatory and anti-inflammatory study of fermented Dendropanax morbifera Léveille leaf extract. BMC Complement. Altern. Med. 2018, 18, 222. [Google Scholar] [CrossRef]
- Peres, C.M.; Peres, C.; Hernández-Mendoza, A.; Malcata, F.X. Review on fermented plant materials as carriers and sources of potentially probiotic lactic acid bacteria—With an emphasis on table olives. Trends Food Sci. Technol. 2012, 26, 31–42. [Google Scholar] [CrossRef]
- Feng, Y.; Zhang, M.; Mujumdar, A.S.; Gao, Z. Recent research process of fermented plant extract: A review. Trends Food Sci. Technol. 2017, 65, 40–48. [Google Scholar] [CrossRef]
- Bao, W.; Huang, X.; Liu, J.; Han, B.; Chen, J. Influence of Lactobacillus brevis on metabolite changes in bacteria-fermented sufu. J. Food Sci. 2020, 85, 165–172. [Google Scholar] [CrossRef]
- Cui, Y.; Miao, K.; Niyaphorn, S.; Qu, X. Production of Gamma-Aminobutyric Acid from Lactic Acid Bacteria: A Systematic Review. Int. J. Mol. Sci. 2020, 21, 995. [Google Scholar] [CrossRef] [Green Version]
- Wu, Q.; Law, Y.-S.; Shah, N.P. Dairy Streptococcus thermophilus improves cell viability of Lactobacillus brevis NPS-QW-145 and its γ-aminobutyric acid biosynthesis ability in milk. Sci. Rep. 2015, 5, 12885. [Google Scholar] [CrossRef] [Green Version]
- Li, W.; Wei, M.; Wu, J.; Rui, X.; Dong, M. Novel fermented chickpea milk with enhanced level of γ-aminobutyric acid and neuroprotective effect on PC12 cells. PeerJ 2016, 4, e2292. [Google Scholar] [CrossRef] [Green Version]
- Cataldo, P.G.; Villena, J.; Elean, M.; Savoy de Giori, G.; Saavedra, L.; Hebert, E.M. Immunomodulatory Properties of a γ-Aminobutyric Acid-Enriched Strawberry Juice Produced by Levilactobacillus brevis CRL 2013. Front. Microbiol. 2020, 11, 1–14. [Google Scholar] [CrossRef] [PubMed]
- Ramos-Ruiz, R.; Poirot, E.; Flores-Mosquera, M. GABA, a non-protein amino acid ubiquitous in food matrices. Cogent Food Agric. 2018, 4, 1534323. [Google Scholar] [CrossRef]
- EFSA Panel on Dietetic Products, N. and A. (NDA) Scientific Opinion on the substantiation of health claims related to gamma-aminobutyric acid and cognitive function (ID 1768) pursuant to Article 13(1) of Regulation (EC) No 1924/2006. EFSA J. 2009, 7, 1274. [Google Scholar] [CrossRef] [Green Version]
- Kim, J.Y.; Lee, M.Y.; Ji, G.E.; Lee, Y.S.; Hwang, K.T. Production of γ-aminobutyric acid in black raspberry juice during fermentation by Lactobacillus brevis GABA100. Int. J. Food Microbiol. 2009, 130, 12–16. [Google Scholar] [CrossRef]
- Galdeano, C.M.; Cazorla, S.I.; Dumit, J.M.L.; Vélez, E.; Perdigón, G. Beneficial effects of probiotic consumption on the immune system. Ann. Nutr. Metab. 2019, 74, 115–124. [Google Scholar]
- Zubillaga, M.; Weill, R.; Postaire, E.; Goldman, C.; Caro, R.; Boccio, J. Effect of probiotics and functional foods and their use in different diseases. Nutr. Res. 2001, 21, 569–579. [Google Scholar] [CrossRef]
- Lee, L.-S.; Jung, K.H.; Choi, U.-K.; Cho, C.-W.; Kim, K.-I.; Kim, Y.-C. Isolation and identification of lactic acid producing bacteria from kimchi and their fermentation properties of soymilk. J. Korean Soc. Food Sci. Nutr. 2013, 42, 1872–1877. [Google Scholar] [CrossRef]
- Quah, Y.; Lee, S.-J.; Lee, E.-B.; Birhanu, B.T.; Ali, M.S.; Abbas, M.A.; Boby, N.; Im, Z.-E.; Park, S.-C. Cornus officinalis Ethanolic Extract with Potential Anti-Allergic, Anti-Inflammatory, and Antioxidant Activities. Nutrients 2020, 12, 3317. [Google Scholar] [CrossRef]
- Kamiloglu, S.; Capanoglu, E. Polyphenol Content in Figs (Ficus carica L.): Effect of Sun-Drying. Int. J. Food Prop. 2015, 18, 521–535. [Google Scholar] [CrossRef]
- Nieva Moreno, M.I.; Zampini, I.C.; Ordóñez, R.M.; Jaime, G.S.; Vattuone, M.A.; Isla, M.I. Evaluation of the cytotoxicity, genotoxicity, mutagenicity, and antimutagenicity of propolis from Tucuman, Argentina. J. Agric. Food Chem. 2005, 53, 8957–8962. [Google Scholar] [CrossRef]
- Giusti, M.M.; Wrolstad, R.E. Characterization and Measurement of Anthocyanins by UV-Visible Spectroscopy. Curr. Protoc. Food Anal. Chem. 2001, F1.2.1–F1.2.13. [Google Scholar] [CrossRef]
- Marsden, W.L.; Gray, P.P.; Nippard, G.J.; Quinlan, M.R. Evaluation of the DNS method for analysing lignocellulosic hydrolysates. J. Chem. Technol. Biotechnol. 1982, 32, 1016–1022. [Google Scholar] [CrossRef]
- Cebulak, T.; Oszmiański, J.; Kapusta, I.; Lachowicz, S. Effect of UV-C radiation, ultra-sonication electromagnetic field and microwaves on changes in polyphenolic compounds in chokeberry (Aronia melanocarpa). Molecules 2017, 22, 1161. [Google Scholar] [CrossRef] [Green Version]
- Lee, J.S.; Kim, D.H.; Liu, K.; Oh, T.K.; Lee, C.H. Identification of flavonoids using liquid chromatography with electrospray ionization and ion trap tandem mass spectrometry with an MS/MS library. Rapid Commun. Mass Spectrom. 2005, 19, 3539–3548. [Google Scholar] [CrossRef] [PubMed]
- Szliszka, E.; Skaba, D.; Czuba, Z.P.; Krol, W. Inhibition of Inflammatory Mediators by Neobavaisoflavone in Activated RAW264.7 Macrophages. Molecules 2011, 16, 3701. [Google Scholar] [CrossRef] [PubMed]
- Gal-Oz, S.T.; Maier, B.; Yoshida, H.; Seddu, K.; Elbaz, N.; Czysz, C.; Zuk, O.; Stranger, B.E.; Ner-Gaon, H.; Shay, T. ImmGen report: Sexual dimorphism in the immune system transcriptome. Nat. Commun. 2019, 10, 4295. [Google Scholar] [CrossRef]
- Oertelt-Prigione, S. The influence of sex and gender on the immune response. Autoimmun. Rev. 2012, 11, A479–A485. [Google Scholar] [CrossRef]
- Class, A. OECD Guideline for Testing of Chemicals; OECD: Paris, France, 2001. [Google Scholar]
- Ahmad, W.; Jantan, I.; Kumolosasi, E.; Bukhari, S.N.A. Immunostimulatory effects of the standardized extract of Tinospora crispa on innate immune responses in Wistar Kyoto rats. Drug Des. Dev. Ther. 2015, 9, 2961. [Google Scholar]
- Fredes, C.; Montenegro, G.; Zoffoli, J.P.; Santander, F.; Robert, P. Comparison of the total phenolic content, total anthocyanin content and antioxidant activity of polyphenol-rich fruits grown in Chile. Int. J. Agric. Nat. Resour. 2014, 41, 49–60. [Google Scholar] [CrossRef] [Green Version]
- Tajner-Czopek, A.; Gertchen, M.; Rytel, E.; Kita, A.; Kucharska, A.Z.; Sokół-Łętowska, A. Study of antioxidant activity of some medicinal plants having high content of caffeic acid derivatives. Antioxidants 2020, 9, 412. [Google Scholar] [CrossRef]
- Liang, Z.; Liang, H.; Guo, Y.; Yang, D. Cyanidin 3-O-galactoside: A Natural Compound with Multiple Health Benefits. Int. J. Mol. Sci. 2021, 22, 2261. [Google Scholar] [CrossRef] [PubMed]
- Naveed, M.; Hejazi, V.; Abbas, M.; Kamboh, A.A.; Khan, G.J.; Shumzaid, M.; Ahmad, F.; Babazadeh, D.; FangFang, X.; Modarresi-Ghazani, F.; et al. Chlorogenic acid (CGA): A pharmacological review and call for further research. Biomed. Pharmacother. 2018, 97, 67–74. [Google Scholar] [CrossRef]
- Khoo, H.E.; Azlan, A.; Tang, S.T.; Lim, S.M. Anthocyanidins and anthocyanins: Colored pigments as food, pharmaceutical ingredients, and the potential health benefits. Food Nutr. Res. 2017, 61, 1361779. [Google Scholar] [CrossRef] [PubMed] [Green Version]
- Al-Musayeib, N.; Perveen, S.; Fatima, I.; Nasir, M.; Hussain, A. Antioxidant, anti-glycation and anti-inflammatory activities of phenolic constituents from Cordia sinensis. Molecules 2011, 16, 10214–10226. [Google Scholar] [CrossRef] [PubMed] [Green Version]
- Lesjak, M.; Beara, I.; Simin, N.; Pintać, D.; Majkić, T.; Bekvalac, K.; Orčić, D.; Mimica-Dukić, N. Antioxidant and anti-inflammatory activities of quercetin and its derivatives. J. Funct. Foods 2018, 40, 68–75. [Google Scholar] [CrossRef]
- Zdunić, G.; Aradski, A.A.; Gođevac, D.; Živković, J.; Laušević, S.D.; Milošević, D.K.; Šavikin, K. In vitro hypoglycemic, antioxidant and antineurodegenerative activity of chokeberry (Aronia melanocarpa) leaves. Ind. Crop. Prod. 2020, 148, 112328. [Google Scholar] [CrossRef]
- Jang, G.H.; Kim, H.W.; Lee, M.K.; Jeong, S.Y.; Bak, A.R.; Lee, D.J.; Kim, J.B. Characterization and quantification of flavonoid glycosides in the Prunus genus by UPLC-DAD-QTOF/MS. Saudi J. Biol. Sci. 2018, 25, 1622–1631. [Google Scholar] [CrossRef]
- Criste, A.; Urcan, A.C.; Bunea, A.; Pripon Furtuna, F.R.; Olah, N.K.; Madden, R.H.; Corcionivoschi, N. Phytochemical composition and biological activity of berries and leaves from four Romanian sea buckthorn (Hippophae rhamnoides L.) varieties. Molecules 2020, 25, 1170. [Google Scholar] [CrossRef] [Green Version]
- Djouossi, M.G.; Tamokou, J.d.D.; Ngnokam, D.; Kuiate, J.-R.; Tapondjou, L.A.; Harakat, D.; Voutquenne-Nazabadioko, L. Antimicrobial and antioxidant flavonoids from the leaves of Oncoba spinosa Forssk.(Salicaceae). BMC Complement. Altern. Med. 2015, 15, 1–8. [Google Scholar] [CrossRef] [Green Version]
- Sholkamy, E.N.; Ahmed, M.S.; Yasser, M.M.; Mostafa, A.A. Antimicrobial quercetin 3-O-glucoside derivative isolated from Streptomyces antibioticus strain ess_amA8. J. King Saud Univ. 2020, 32, 1838–1844. [Google Scholar] [CrossRef]
- Kolaczkowska, E.; Kubes, P. Neutrophil recruitment and function in health and inflammation. Nat. Rev. Immunol. 2013, 13, 159–175. [Google Scholar] [CrossRef]
- Haque, M.A.; Jantan, I.; Abbas Bukhari, S.N. Tinospora species: An overview of their modulating effects on the immune system. J. Ethnopharmacol. 2017, 207, 67–85. [Google Scholar] [CrossRef] [PubMed]
- Diana, M.; Quílez, J.; Rafecas, M. Gamma-aminobutyric acid as a bioactive compound in foods: A review. J. Funct. Foods 2014, 10, 407–420. [Google Scholar] [CrossRef]
- Diez-Gutiérrez, L.; San Vicente, L.; Luis, L.J.; Villarán, M.d.C.; Chávarri, M. Gamma-aminobutyric acid and probiotics: Multiple health benefits and their future in the global functional food and nutraceuticals market. J. Funct. Foods 2020, 64, 103669. [Google Scholar] [CrossRef]
- Das, D.; Goyal, A. Antioxidant activity and γ-aminobutyric acid (GABA) producing ability of probiotic Lactobacillus plantarum DM5 isolated from Marcha of Sikkim. LWT Food Sci. Technol. 2015, 61, 263–268. [Google Scholar] [CrossRef]
- Nikmaram, N.; Dar, B.N.; Roohinejad, S.; Koubaa, M.; Barba, F.J.; Greiner, R.; Johnson, S.K. Recent advances in γ-aminobutyric acid (GABA) properties in pulses: An overview. J. Sci. Food Agric. 2017, 97, 2681–2689. [Google Scholar] [CrossRef] [Green Version]
- Yoshida, S.; Okano, K.; Tanaka, T.; Ogino, C.; Kondo, A. Homo-D-lactic acid production from mixed sugars using xylose-assimilating operon-integrated Lactobacillus plantarum. Appl. Microbiol. Biotechnol. 2011, 92, 67–76. [Google Scholar] [CrossRef]
- Messens, W.; De Vuyst, L. Inhibitory substances produced by Lactobacilli isolated from sourdoughs—A review. Int. J. Food Microbiol. 2002, 72, 31–43. [Google Scholar] [CrossRef]
- Schubert, K.; Olde Damink, S.W.M.; von Bergen, M.; Schaap, F.G. Interactions between bile salts, gut microbiota, and hepatic innate immunity. Immunol. Rev. 2017, 279, 23–35. [Google Scholar] [CrossRef]
- Vajdy, M. Immunomodulatory properties of vitamins, flavonoids and plant oils and their potential as vaccine adjuvants and delivery systems. Expert Opin. Biol. Ther. 2011, 11, 1501–1513. [Google Scholar] [CrossRef]
- Yahfoufi, N.; Alsadi, N.; Jambi, M.; Matar, C. The immunomodulatory and anti-inflammatory role of polyphenols. Nutrients 2018, 10, 1618. [Google Scholar] [CrossRef] [PubMed] [Green Version]
- Nkhata, S.G.; Ayua, E.; Kamau, E.H.; Shingiro, J.-B. Fermentation and germination improve nutritional value of cereals and legumes through activation of endogenous enzymes. Food Sci. Nutr. 2018, 6, 2446–2458. [Google Scholar] [CrossRef] [Green Version]
- Islam, M.A.; Khandker, S.S.; Kotyla, P.J.; Hassan, R. Immunomodulatory Effects of Diet and Nutrients in Systemic Lupus Erythematosus (SLE): A Systematic Review. Front. Immunol. 2020, 11, 1477. [Google Scholar] [CrossRef]
- Valledor, A.F.; Comalada, M.; Santamaría-Babi, L.F.; Lloberas, J.; Celada, A. Macrophage proinflammatory activation and deactivation: A question of balance. Adv. Immunol. 2010, 108, 1–20. [Google Scholar] [PubMed]
- Akira, S.; Uematsu, S.; Takeuchi, O. Pathogen recognition and innate immunity. Cell 2006, 124, 783–801. [Google Scholar] [CrossRef] [Green Version]
- Beutler, B.; Hoebe, K.; Du, X.; Ulevitch, R.J. How we detect microbes and respond to them: The Toll-like receptors and their transducers. J. Leukoc. Biol. 2003, 74, 479–485. [Google Scholar] [CrossRef] [PubMed] [Green Version]
- Vunta, H.; Davis, F.; Palempalli, U.D.; Bhat, D.; Arner, R.J.; Thompson, J.T.; Peterson, D.G.; Reddy, C.C.; Prabhu, K.S. The anti-inflammatory effects of selenium are mediated through 15-deoxy-Δ12, 14-prostaglandin J2 in macrophages. J. Biol. Chem. 2007, 282, 17964–17973. [Google Scholar] [CrossRef] [PubMed] [Green Version]
- Kruger, P.; Saffarzadeh, M.; Weber, A.N.R.; Rieber, N.; Radsak, M.; von Bernuth, H.; Benarafa, C.; Roos, D.; Skokowa, J.; Hartl, D. Neutrophils: Between host defence, immune modulation, and tissue injury. PLoS Pathog. 2015, 11, e1004651. [Google Scholar] [CrossRef] [Green Version]
- Filias, A.; Theodorou, G.L.; Mouzopoulou, S.; Varvarigou, A.A.; Mantagos, S.; Karakantza, M. Phagocytic ability of neutrophils and monocytes in neonates. BMC Pediatr. 2011, 11, 1–6. [Google Scholar] [CrossRef] [Green Version]
- Peiffer, D.S.; Wang, L.-S.; Zimmerman, N.P.; Ransom, B.W.S.; Carmella, S.G.; Kuo, C.-T.; Chen, J.-H.; Oshima, K.; Huang, Y.-W.; Hecht, S.S. Dietary consumption of black raspberries or their anthocyanin constituents alters innate immune cell traffickg in esophageal cancer. Cancer Immunol. Res. 2016, 4, 72–82. [Google Scholar] [CrossRef] [PubMed] [Green Version]
- Akbay, P.; Basaran, A.A.; Undeger, U.; Basaran, N. In vitro immunomodulatory activity of flavonoid glycosides from Urtica dioica L. Phyther. Res. 2003, 17, 34–37. [Google Scholar] [CrossRef] [PubMed]
- G Mercader, A.; B Pomilio, A. (Iso) flav (an) ones, chalcones, catechins, and theaflavins as anticarcinogens: Mechanisms, anti-multidrug resistance and QSAR Studies. Curr. Med. Chem. 2012, 19, 4324–4347. [Google Scholar] [CrossRef] [PubMed]
- Bronte, V.; Pittet, M.J. The spleen in local and systemic regulation of immunity. Immunity 2013, 39, 806–818. [Google Scholar] [CrossRef] [Green Version]
- Mendu, S.K.; Åkesson, L.; Jin, Z.; Edlund, A.; Cilio, C.; Lernmark, Å.; Birnir, B. Increased GABAA channel subunits expression in CD8+ but not in CD4+ T cells in BB rats developing diabetes compared to their congenic littermates. Mol. Immunol. 2011, 48, 399–407. [Google Scholar] [CrossRef] [PubMed] [Green Version]
- Jin, Z.; Mendu, S.K.; Birnir, B. GABA is an effective immunomodulatory molecule. Amino Acids 2013, 45, 87–94. [Google Scholar] [CrossRef] [PubMed] [Green Version]
- Luckheeram, R.V.; Zhou, R.; Verma, A.D.; Xia, B. CD4+ T cells: Differentiation and functions. Clin. Dev. Immunol. 2012, 2012, 925135. [Google Scholar] [CrossRef] [Green Version]
- Hosseinzade, A.; Sadeghi, O.; Naghdipour Biregani, A.; Soukhtehzari, S.; Brandt, G.S.; Esmaillzadeh, A. Immunomodulatory Effects of Flavonoids: Possible Induction of T CD4+ Regulatory Cells Through Suppression of mTOR Pathway Signaling Activity. Front. Immunol. 2019, 10, 51. [Google Scholar] [CrossRef] [Green Version]
- Cho, J.-H.; Boyman, O.; Kim, H.-O.; Hahm, B.; Rubinstein, M.P.; Ramsey, C.; Kim, D.M.; Surh, C.D.; Sprent, J. An intense form of homeostatic proliferation of naive CD8+ cells driven by IL-2. J. Exp. Med. 2007, 204, 1787–1801. [Google Scholar] [CrossRef] [PubMed]
- Bachmann, M.F.; Wolint, P.; Walton, S.; Schwarz, K.; Oxenius, A. Differential role of IL-2R signaling for CD8+ T cell responses in acute and chronic viral infections. Eur. J. Immunol. 2007, 37, 1502–1512. [Google Scholar] [CrossRef] [PubMed]
- Wills-Karp, M. Immunologic basis of antigen-induced airway hyperresponsiveness. Annu. Rev. Immunol. 1999, 17, 255–281. [Google Scholar] [CrossRef] [PubMed]
- Martin, D.A.; Taheri, R.; Brand, M.H.; Draghi, A., II; Sylvester, F.A.; Bolling, B.W. Anti-inflammatory activity of aronia berry extracts in murine splenocytes. J. Funct. Foods 2014, 8, 68–75. [Google Scholar] [CrossRef]
- Leyva-López, N.; Gutierrez-Grijalva, E.P.; Ambriz-Perez, D.L.; Heredia, J.B. Flavonoids as cytokine modulators: A possible therapy for inflammation-related diseases. Int. J. Mol. Sci. 2016, 17, 921. [Google Scholar] [CrossRef] [PubMed]


| Groups | Description |
|---|---|
| Group I | Normal control group: received only water |
| Group II | Negative control group: received water and SRBC treatment |
| Group III | Positive control group: received a known immunostimulator (levamisole, 10 mg/kg) |
| Group IV | Treatment group: received 125 mg/kg of FAME |
| Group V | Treatment group: received 250 mg/kg of FAME |
| Group VI | Treatment group: received 500 mg/kg of FAME |
| Targets | Unit | Before (0 Day) Fermentation | After (9 Days) Fermentation |
|---|---|---|---|
| Glutamic acid | μg/mL | 13251 ± 9.44 a | 2014 ± 5.51 b |
| GABA | μg/mL | N.D. a | 10412 ± 7.42 b |
| DPPH | mg/mL | 2.18 ± 0.48 a | 1.09 ± 0.28 b |
| Potassium | mg/mL | 9872.01 a | 10142.23 b |
| Calcium | mg/mL | 1442.05 a | 2014.09 b |
| Magnesium | mg/mL | 962.14 a | 1123.12 b |
| Sodium | mg/mL | 159.36 a | 282.14 b |
| Iron | mg/mL | 23.01 a | 25.54 b |
| Phosphorus | mg/mL | 16.26 a | 30.12 b |
| FermentationTime (Days) | pH | Acidity (%, w/v) | Reducing Sugar Content (%) | Polyphenol Content (μg/mL) | Flavonoid Content (μg/mL) | Viable Cell Count (CFU/mL × 106) | Anthocyanin Content (mg/100 mL) |
|---|---|---|---|---|---|---|---|
| 0 | 4.41 ± 0.01 a | 0.74 ± 0.02 e | 4.1 ± 0.03 a | 213.79 ± 3.69 f | 34.23 ± 1.95 d | 4.86 ± 6.2 e | 0.0802 f |
| 1 | 3.86 ± 0.01 c | 0.84 ± 0.01 c d | 1.74 ± 0.02 b | 226.26 ± 3.81 e | 35.22 ± 2.65 d | 1250 ± 61 a | 0.0814 e |
| 3 | 3.31 ± 0.02 f | 1.08 ± 0.04 a | 1.62 ± 0.04 c | 262.12 ± 4.01 d | 36.22 ± 2.14 c | 938 ± 31 b | 0.0866 d |
| 5 | 3.62 ± 0.01 c | 0.82 ± 0.02 d | 1.44 ± 0.02 d | 280.25 ± 3.21 c | 37.08 ± 1.54 b | 155 ± 4.2 c | 0.0882 c |
| 7 | 3.84 ± 0.01 d | 0.93 ± 0.02 b | 1.02 ± 0.03 e | 291.24 ± 2.22 b | 37.61 ± 1.41 a | 78 ± 2.6 d | 0.0902 b |
| 9 | 4.01 ± 0.01 b | 0.86 ± 0.01 c | 0.86 ± 0.02 f | 312.54 ± 3.54 a | 38.12 ± 1.66 a | 42 ± 3.6 d e | 0.0912 a |
| RT (min) | Formula | Δ ppm | Compounds | Activity |
|---|---|---|---|---|
| 2.90 | C16H18O9 | 0.990 | Neochlorogenic acid | Antioxidant [33] |
| 4.12 | C21H21O11 | 1.541 | Cyanidin-3-O-galactoside | Antioxidant and anti-inflammatory [34] |
| 4.26 | C16H18O9 | 2.032 | Chlorogenic acid | Anti-inflmmatory, antioxidant, and antibacterial [35] |
| 4.50 | C20H19O10 | 0.780 | Cyanidin-3-O-arabinoside | Antioxidant [36] |
| 4.77 | C24H21O13 | 0.857 | 5-Carboxypyranocyanidin 3-O-β-glucopyranoside | Antioxidant and anti-inflammatory [37] |
| 5.71 | C27H31O17 | 1.585 | Quercetin-di-hexoside | Antioxidant and anti-inflammatory [38] |
| 6.19 | C26H28O16 | 0.551 | Quercetin-3-O-vicianoside | Antioxidant [39] |
| 6.46 | C27H30O16 | 0.522 | Quercetin-3-O-robinobioside | Antibacterial [40] |
| 6.57 | C27H30O16 | 0.522 | Quercetin-3-O-rutinoside | Antioxidant [41] |
| 6.67 | C21H20O12 | 1.349 | Quercetin-3-O-galactoside | Antimicrobial and antioxidant [42] |
| 6.80 | C21H20O12 | 1.349 | Quercetin-3-O-glucoside | Antimicrobial [43] |
Publisher’s Note: MDPI stays neutral with regard to jurisdictional claims in published maps and institutional affiliations. |
© 2021 by the authors. Licensee MDPI, Basel, Switzerland. This article is an open access article distributed under the terms and conditions of the Creative Commons Attribution (CC BY) license (https://creativecommons.org/licenses/by/4.0/).
Share and Cite
Ali, M.S.; Lee, E.-B.; Lee, S.-J.; Lee, S.-P.; Boby, N.; Suk, K.; Birhanu, B.T.; Park, S.-C. Aronia melanocarpa Extract Fermented by Lactobacillus plantarum EJ2014 Modulates Immune Response in Mice. Antioxidants 2021, 10, 1276. https://doi.org/10.3390/antiox10081276
Ali MS, Lee E-B, Lee S-J, Lee S-P, Boby N, Suk K, Birhanu BT, Park S-C. Aronia melanocarpa Extract Fermented by Lactobacillus plantarum EJ2014 Modulates Immune Response in Mice. Antioxidants. 2021; 10(8):1276. https://doi.org/10.3390/antiox10081276
Chicago/Turabian StyleAli, Md. Sekendar, Eon-Bee Lee, Seung-Jin Lee, Sam-Pin Lee, Naila Boby, Kyoungho Suk, Biruk Tesfaye Birhanu, and Seung-Chun Park. 2021. "Aronia melanocarpa Extract Fermented by Lactobacillus plantarum EJ2014 Modulates Immune Response in Mice" Antioxidants 10, no. 8: 1276. https://doi.org/10.3390/antiox10081276
APA StyleAli, M. S., Lee, E.-B., Lee, S.-J., Lee, S.-P., Boby, N., Suk, K., Birhanu, B. T., & Park, S.-C. (2021). Aronia melanocarpa Extract Fermented by Lactobacillus plantarum EJ2014 Modulates Immune Response in Mice. Antioxidants, 10(8), 1276. https://doi.org/10.3390/antiox10081276