Article

Pterostilbene Changes Epigenetic Marks at Enhancer Regions of Oncogenes in Breast Cancer Cells

1
Food, Nutrition and Health Program, Faculty of Land and Food Systems, University of British Columbia, Vancouver, BC V6T 1Z4, Canada
2
Department of Biochemistry and Molecular Biology, University of British Columbia, Vancouver, BC V6T 1Z3, Canada
3
Department of Biological Chemistry and Molecular Pharmacology, Harvard Medical School, Boston, MA 02115, USA
4
Department of Biomedical Chemistry, Medical University of Lodz, 92-215 Lodz, Poland
*
Author to whom correspondence should be addressed.
Antioxidants 2021, 10(8), 1232; https://doi.org/10.3390/antiox10081232
Submission received: 6 June 2021 / Revised: 26 July 2021 / Accepted: 27 July 2021 / Published: 30 July 2021

Abstract

:
Epigenetic aberrations are linked to sporadic breast cancer. Interestingly, certain dietary polyphenols with anti-cancer effects, such as pterostilbene (PTS), have been shown to regulate gene expression by altering epigenetic patterns. Our group has proposed the involvement of DNA methylation and DNA methyltransferase 3B (DNMT3B) as vital players in PTS-mediated suppression of candidate oncogenes and suggested a role of enhancers as target regions. In the present study, we assess a genome-wide impact of PTS on epigenetic marks at enhancers in highly invasive MCF10CA1a breast cancer cells. Following chromatin immunoprecipitation (ChIP)-sequencing in MCF10CA1a cells treated with 7 μM PTS for 9 days, we discovered that PTS leads to increased binding of DNMT3B at enhancers of 77 genes, and 17 of those genes display an overlapping decrease in the occupancy of trimethylation at lysine 36 of histone 3 (H3K36me3), a mark of active enhancers. We selected two genes, PITPNC1 and LINC00910, and found that their enhancers are hypermethylated in response to PTS. These changes coincided with the downregulation of gene expression. Of importance, we showed that 6 out of 17 target enhancers, including PITPNC1 and LINC00910, are bound by an oncogenic transcription factor OCT1 in MCF10CA1a cells. Indeed, the six enhancers corresponded to genes with established or putative cancer-driving functions. PTS led to a decrease in OCT1 binding at those enhancers, and OCT1 depletion resulted in PITPNC1 and LINC00910 downregulation, further demonstrating a role for OCT1 in transcriptional regulation. Our findings provide novel evidence for the epigenetic regulation of enhancer regions by dietary polyphenols in breast cancer cells.

1. Introduction

Breast cancer is the most commonly diagnosed malignancy and the second leading cause of cancer-related deaths among women [1]. Epigenetic alterations are found frequently in breast cancer and are suggested to drive a number of sporadic cases [2]. Epigenetics refers to the control of gene expression without changes to the DNA sequence. The epigenetic code consists of DNA methylation, covalent histone modifications, noncoding RNA mechanisms, and chromatin remodeling complexes [3,4]. All components of the epigenetic machinery are important to influence gene expression; however, DNA methylation mainly occurs on the cytosine of CpG dinucleotides and is catalyzed by specific enzymes, namely, DNA methyltransferases (DNMTs), and they are particularly considered to stabilize gene transcription [3,4,5]. DNA methylation reactions are thought to provide stable, long-term regulation of gene expression over time [6], while at the same time are considered to be dynamic and responsive to external exposures [7]. During carcinogenesis, perturbations in the DNA methylation machinery occur, leading to aberrant DNA methylation patterns in sequences that are involved in the regulation of gene transcription, which subsequently affects the expression of genes related to cell differentiation, proliferation, metastasis, and other biological processes [8]. For decades, researchers were reporting on aberrant DNA methylation levels within promoters of genes while the role and regulation of other regulatory regions, e.g., enhancers, silencers, or insulators, were largely disregarded [9]. Studies over the last 20 years clearly demonstrate that the DNA methylation status of enhancer regions may impact their regulatory role in addition to histone marks [10].
Enhancers are usually 30–200 base pairs long and may be located upstream or downstream of their target genes [9,11]. The activity of enhancers is highly dependent on a cell type, physiological stimuli, and a specific developmental time point. These distant regulatory elements increase the likelihood of gene transcription by interacting with their target gene promoters via looping of DNA in association with transcription factors, RNA polymerase, and other cofactors [9,11]. Another way through which enhancers can impact the expression of target genes is through their own transcription and generating enhancer RNA (eRNA), which positively correlates with mRNA synthesis of the target genes [12]. Several classes of enhancers have been described, including active, intermediate, and poised, that are characterized by distinct histone marks [13]. For example, active enhancers are rich in acetylation of lysine 27 of histone H3 (H3K27ac), whereas poised enhancers are marked by trimethylation of H3K27 (H3K27me3) [9,13]. Of importance, H3K36me3 has been shown as a unique mark of active enhancers, distinguishing active from intermediate or poised enhancers [13]. It is crucial to emphasize that H3K36me3 is a mark generally associated with actively transcribed genes and transcriptional elongation; thereby, it is also present at other regions relevant to transcription [13]. Apart from distinct patterns of histone covalent modifications, active enhancers display less DNA methylation [10,14]. DNA hypomethylation was also proposed as a signature of eRNA-generating enhancers, thus active enhancers [15]. While our knowledge about the regulation of enhancers is constantly increasing, approaches to reverse aberrant enhancer activity in disease remain undiscovered.
Remarkably, the last decade of research has shown epigenetic activities exerted by compounds with polyphenolic structure, including stilbenoid polyphenols [16,17,18,19,20,21,22], accompanied by their potent anti-cancer effects [23,24,25]. Studies have shown loci-specific changes in DNA methylation and reversal of cancer-like DNA methylation patterns [16,17,18,19,20,21]. Among these compounds, Pterostilbene (PTS), a naturally present stilbenoid in the diet (e.g., blueberries, grapes, cranberries, peanuts, pistachios, cocoa), stands out due to its high bioavailability [26,27]. We and others previously observed changes in DNA methylation at candidate gene loci, including PTEN, APC, and BRCA1 in human cancer cells exposed to PTS or its analog resveratrol (RSV) [16,17,18]. These reports were strengthened by our genome-wide study to demonstrate remodeling of the DNA methylation patterns in breast cancer cells exposed to stilbenoids [20]. We observed increases and decreases in DNA methylation levels at thousands of CpG loci. These findings laid the framework for subsequent work to identify mechanisms underlying stilbenoid-mediated changes in loci-specific DNA methylation [20,28]. For the first time, we demonstrated that stilbenoid-mediated downregulation of an oncogene, MAML2, which is an activator of the NOTCH signaling pathway, is accompanied by increased DNA methylation at the MAML2 enhancer region [20]. DNMT3B was found to bind the MAML2 enhancer upon treatment with stilbenoids, suggesting a role for this DNA methyltransferase in methylating the enhancer [20]. We further showed that one-third of hypermethylation events in response to stilbenoids occur in gene bodies, and the majority of those loci within gene bodies are located in gene enhancers [20]. In the current study, we have therefore investigated how stilbenoids, specifically PTS, impact epigenetic marks at enhancer regions in MCF10CA1a breast cancer cells. To better understand the role of DNMT3B binding, DNA methylation, and histone modifications at enhancer regions in stilbenoids-mediated downregulation of gene transcription, we have performed chromatin immunoprecipitation (ChIP) followed by next-generation sequencing to analyze binding events of DNMT3B and occupancy of H3K36me3 at a genome-wide scale. We then elucidated whether altered DNMT3B and H3K36me3 enrichment are linked to changes in transcription factor binding and gene transcriptional activity.

2. Materials and Methods

2.1. Cell Culture and Treatment with Pterostilbene (PTS)

Human breast cancer cell line, MCF10CA1a, used in this study, was cultured in DMEM/F12 (1:1) medium (Gibco, Waltham, MA, USA) supplemented with 5% horse serum (Gibco, Waltham, MA, USA), 1 U/mL penicillin, and 1 μg/mL streptomycin (Gibco, Waltham, MA, USA), and grown in a humidified atmosphere of 5% carbon dioxide at 37 °C. The cell line was derived from tumor xenografts of MCF10A cells transformed with constitutively active Harvey-ras oncogene and represented lowly differentiated malignant tumor with high invasive potential. The cell line was obtained from Dr. Dorothy Teegarden, Purdue University, IN, USA. Pterostilbene (PTS, Cayman Chem., Ann Arbor, MI, USA) was resuspended in ethanol, and 10 mM stock solution was stored at −20 °C. Next, cells were plated at a density of 2–3 × 10⁵ per 10 cm tissue culture dish 24 h prior to treatment with PTS. Freshly diluted PTS was prepared prior to adding to the culture medium. Cells were treated with 7 μM PTS for 4 days. Cells were then split at 1:50 ratio and exposed to the compound for additional 4 days (9-day exposure). The concentration of 7 μM was determined in our previous studies as the IC50 concentration for 9-day treatment [20,29]. Please note that the IC50 dose reduces cell growth by 50% and leads to not more than 10% of dead cells compared to vehicle-treated cells (ethanol used as a solvent for PTS).

2.2. Chromatin Immunoprecipitation (ChIP) Sequencing (ChIP-Seq)

Chromatin immunoprecipitation was performed as previously described [20,30]. In brief, cells representing three biological replicates were fixed with 1% formaldehyde and incubated at 37 °C for 15 min. Fixed cells were lysed, followed by 15 s intervals of sonication (amplitude 40; Qsonica Q55), interspaced with 45 s rest, for 20 cycles on ice. Lysates were pre-cleared with protein G agarose and centrifuged to collect supernatants, which were divided into three fractions. One fraction was maintained as input. The second fraction served as negative control and was incubated overnight at 4 °C with IgG non-specific antibody (negative control, Santa-Cruz Biotechnology, Dallas, TX, USA). The third fraction was incubated overnight at 4 °C with the following antibodies: anti-DNMT3B rat antibody (Millipore, Burlington, VT, USA, MABE305), anti-trimethyl-Histone H3 Lys36 rabbit antibody (H3K36me3, Millipore, Burlington, VT, USA, ABE305), or anti-OCT1 mouse antibody (Millipore, Burlington, VT, USA, MAB5434). The following day, the DNA bound to antibodies was washed, eluted, and the antibodies were degraded using proteinase K treatment. Input and purified ChIP DNA were used to generate sequencing libraries using NEBNext Ultra DNA Library Prep Kit for Illumina reagents according to the manufacturer’s protocol. ChIP libraries were sequenced using PE150bp reads in HiSeq2500, as described previously [31,32].

2.3. Analysis of ChIP-Seq Data

As described previously, ChIP-seq data were analyzed using Bioconductor tool in R [31,32]. Adapter sequences were trimmed from sequencing reads using cutadapt [33], and reads were aligned to the GRCh37/hg19 human reference genome using the Burrows–Wheeler Aligner [34]. Duplicate and low-quality reads were filtered out. MACS2 peak calling software was used to identify distinct patterns of enrichment in control-treated versus PTS-treated samples and to generate fold enrichment tracks [35,36]. Briefly, the callpeak function was used to identify peaks in the control or treated samples, using the pooled ChIP-seq inputs as the background control and using 200 bp as the estimated fragment size and an effective genome size of 2,700,000,000. The broad option was used for calling H3K36me3 peaks. Differential peaks were called using the bdgdiff function. Fold enrichment over input tracks was generated from pileup tracks using the bdgcmp function and the -m FE option. To visualize accurate representation of our results, read-extended bigwig files of our obtained genomic data were implemented in the genome browser. Lastly, ChIPSeeker Bioconductor package was used to associate the identified peaks to their target genes. The ChIP quality control (CHIPQC) Bioconductor package calculated ChIP-seq specific quality metric for each sample and input in our experiment. CHIPQC further identifies both fragment-length peak and a read-length peak based on cross-coverage around the centers of binding sites. CHIPQC was used to both measure inequality of coverage across the genome via standardized Standard Deviation (SSD) and assess distribution of ChIP-seq signal over genomic regions.
To assign peaks to chromatin states, broad ChromHMM data from human mammary epithelial cells (HMEC) were used [37]. Peaks could correspond to the following chromatin states: active, weak, or poised promoters, strong or weak enhancers, putative insulators, active or weak transcription, Polycomb-repressed regions or heterochromatin. Active promoters, strong enhancers, and active transcription regions are linked to high expression levels, with the latter state determined based on the enrichment of histone marks along transcripts. The ChIP-seq data are available from Gene Expression Omnibus (accession number: GSE175639).

2.4. DNA Isolation and Pyrosequencing

DNA was isolated using standard phenol:chloroform extraction protocol. DNA bisulfite conversion was performed as previously described [20]. HotStar Taq DNA polymerase (Qiagen, Hilden, Germany) and biotinylated primers were used to amplify bisulfite converted DNA with primers specific for studied gene regulatory regions (please see Supplementary Table S1 for primer sequences). Pyrosequencing of the biotinylated DNA strands was performed in the PyroMark Q48 Autoprep instrument (Qiagen, Hilden, Germenay), as previously described [38]. Percentage of methylation at a single CpG site resolution was calculated using PyroMark Q48 software.

2.5. RNA Isolation, cDNA Synthesis and QPCR

TRIzol reagent (Invitrogen, Waltham, MA, USA) was used to isolate total RNA from MCF10CA1a cells treated with 7 μM PTS for 9 days. cDNA was synthesized using 1 μg of total RNA as a template and 20 U of AMV reverse transcriptase (Roche Diagnostics, Basel, Switzerland). The QPCR reaction was carried out in CFX96 Touch Real-Time PCR Detection System (Bio-Rad, Hercules, CA, USA) using 2 μL of cDNA, 10 μL of SsoFast EvaGreen Supermix (Bio-Rad), and 400 nM forward and reverse primers (please see Supplementary Table S1 for primer sequences), in a final volume of 20 μL. The amplification reactions were performed in biological triplicate under the following conditions: denaturation at 95 °C for 10 min, amplification for 40 cycles at: 95 °C for 10 s, annealing temperature for 10 s, 72 °C for 10 s; and final extension at 72 °C for 10 min. Genes transcript levels (quantification of the gene expression level) were quantified using the CFX Maestro Software (Bio-Rad, Hercules, CA, USA) with standard curve-based analysis. Relative gene expression levels of target genes are presented as gene of interest/GAPDH (reference gene).

2.6. Statistical Analysis

Unpaired t-test with two-tailed distribution was used for statistical analysis of QPCR and pyrosequencing data. Each value represents the mean ± S.D. of three independent experiments (biological replicates). The results were considered statistically significant when p < 0.05.

3. Results

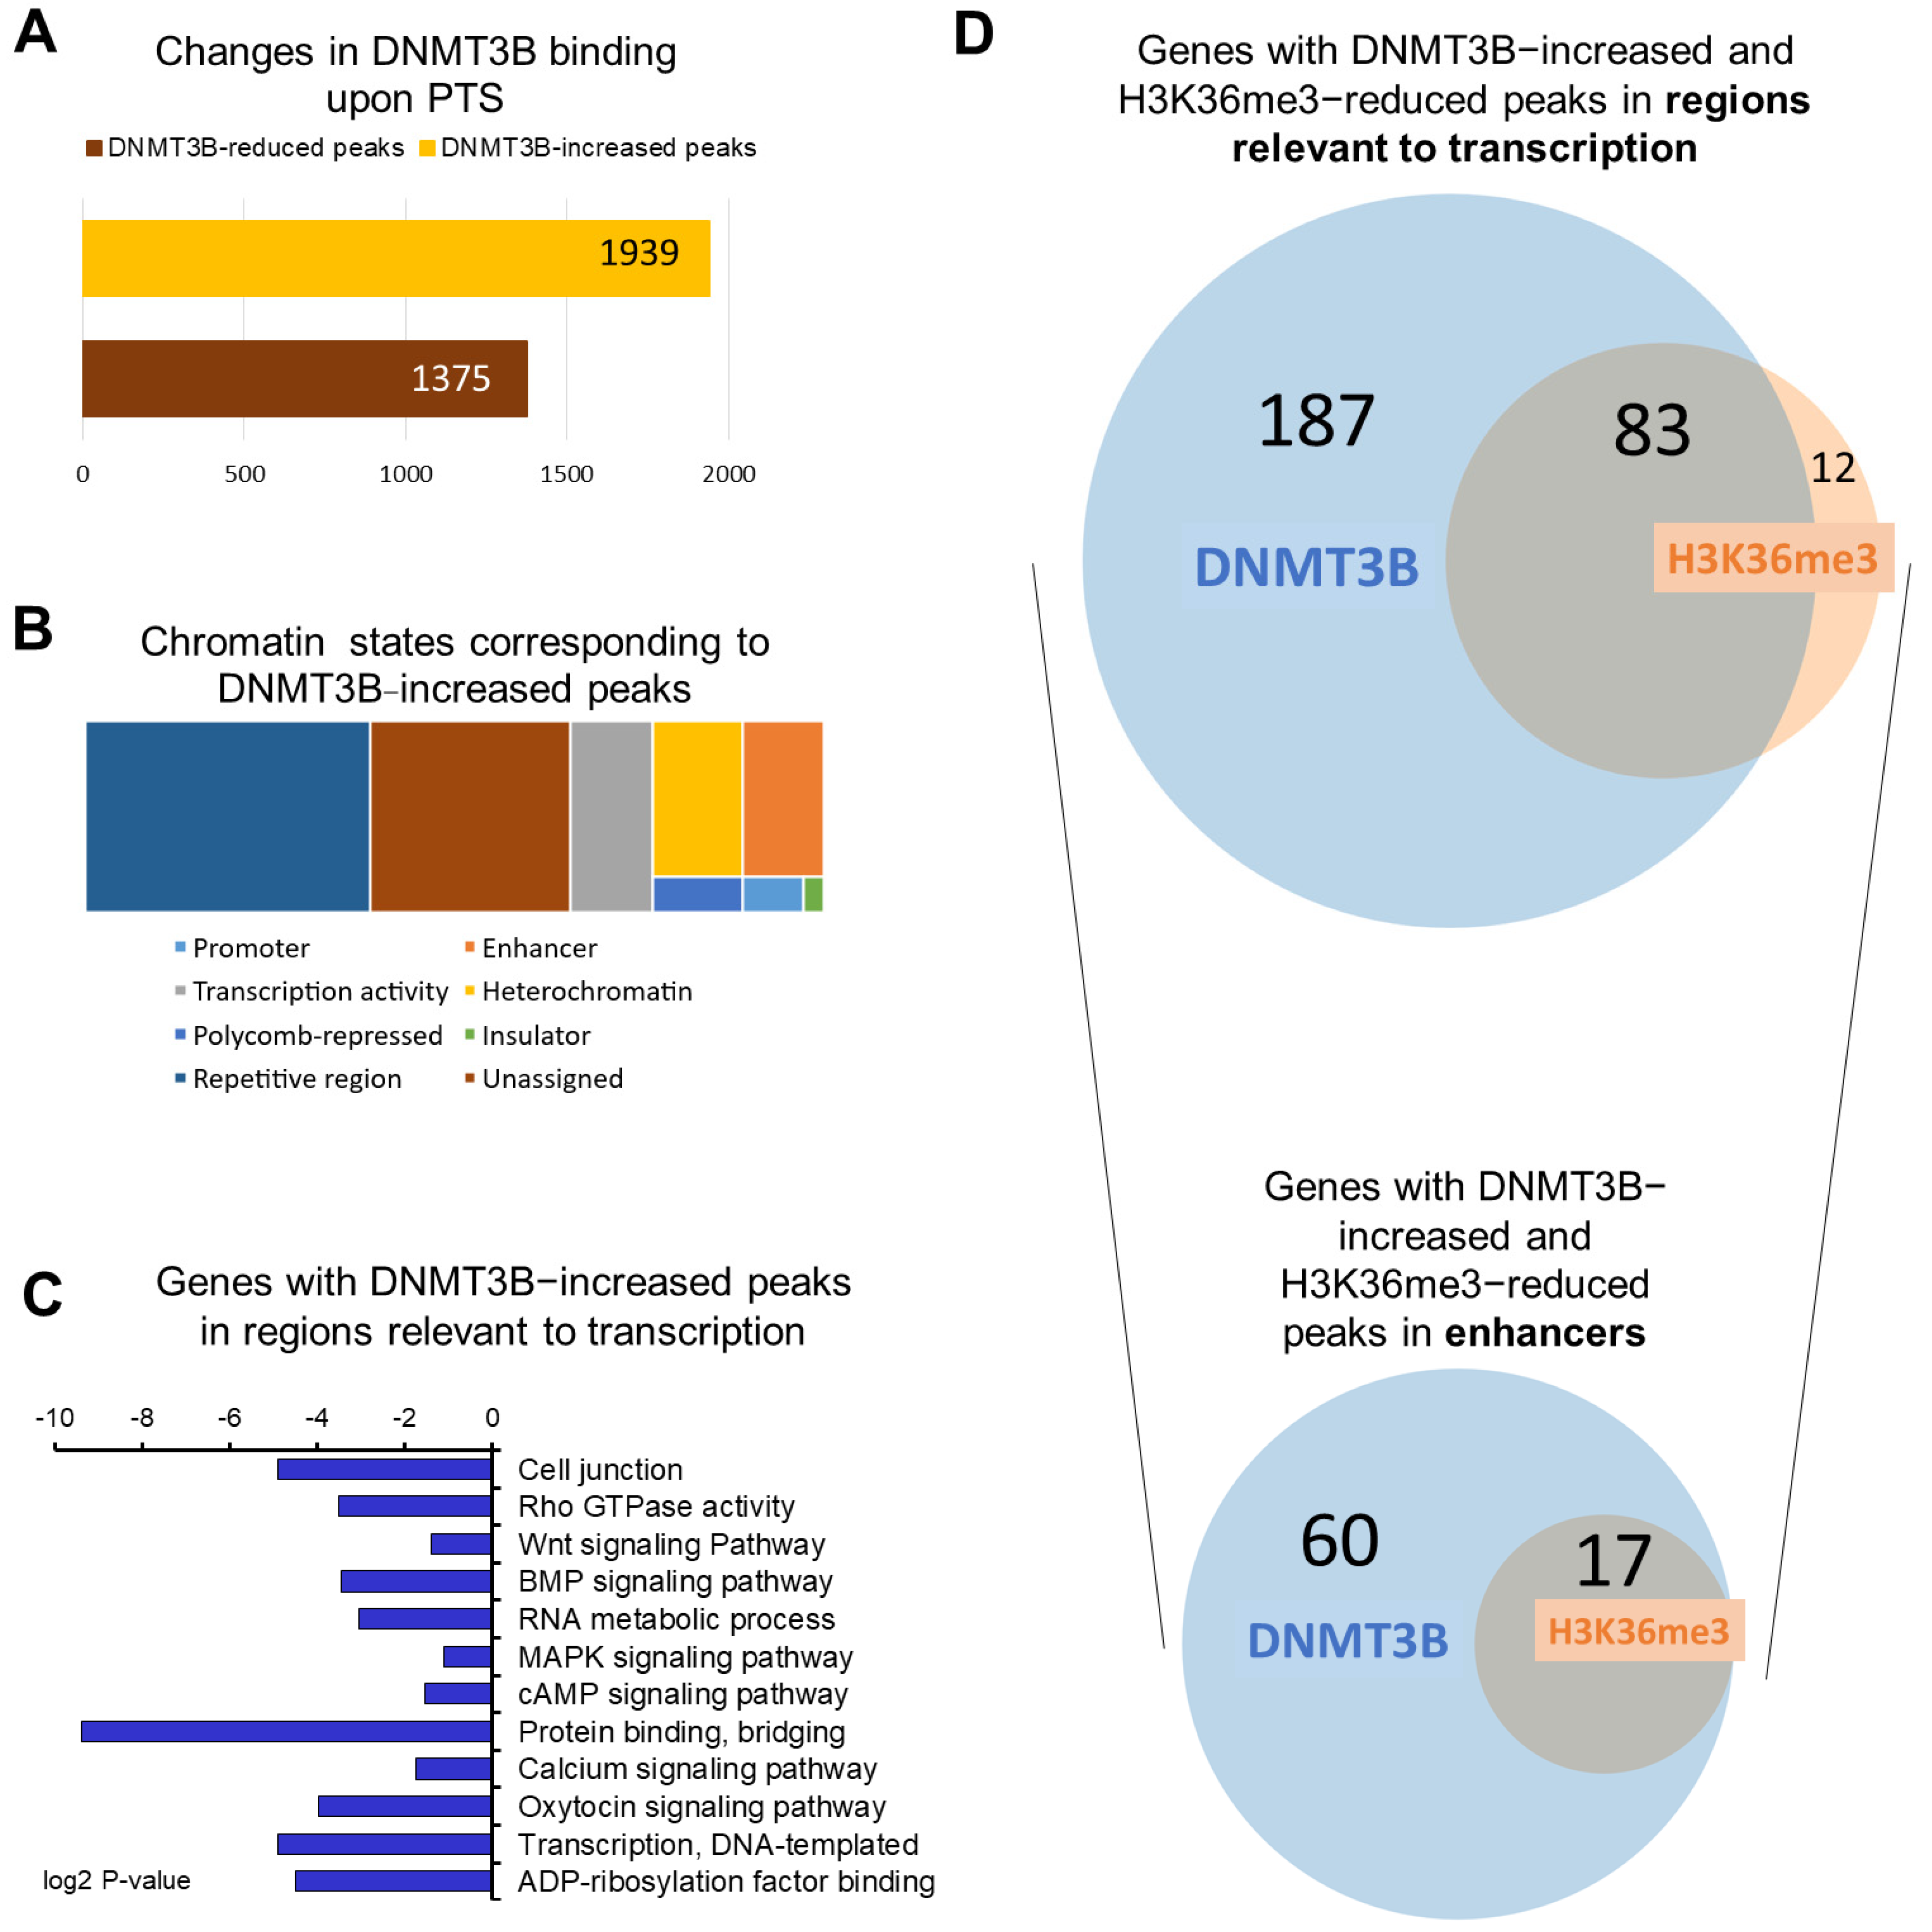
3.1. Overview of DNMT3B Binding in Highly Invasive MCF10CA1a Breast Cancer Cells in Response to Pterostilbene (PTS)

To understand a possible functional role of DNMT3B in mediating epigenetic effects of stilbenoid polyphenols, we performed ChIP for DNMT3B in invasive MCF10CA1a breast cancer cells upon 9-day treatment with PTS at 7 μM concentration, followed by next-generation sequencing. Upon analysis of DNMT3B ChIP-seq data, we identified statistically significant changes in DNMT3B binding in 3314 peaks throughout the genome. Of those peaks, 1939 peaks were enriched with DNMT3B upon PTS (Figure 1A).
Using the Broad ChromHMM track associated with human mammary epithelial cells (HMEC) available on the USCS Genome Browser, DNMT3B-increased peaks were annotated to corresponding chromatin states. The peaks were mostly located in repetitive elements (38.5% of peaks), which is in accordance with the well-established DNMT3B function in transcriptional repression of these elements, crucial for genomic stability [39]. While 27% of peaks were located in regions with unspecified chromatin state, the remaining 665 peaks were found in regions important for regulation of gene transcription, including promoters, enhancers, insulators, Polycomb-repressed regions, or heterochromatin. (Figure 1B).
Using gene ontology (GO) and KEGG tools in the DAVID knowledgebase database, we performed functional and signaling pathway analyses of genes that contained at least one of the 665 DNMT3B-enriched peaks within regions relevant to transcription (Figure 1C). We identified 270 unique genes in this group. We found that these genes are implicated in signaling pathways commonly upregulated in cancer (Wnt, MAPK, BMP, mTOR, NOTCH, PI3K/Akt), in DNA replication, recombination and repair, cell junction, actin cytoskeleton, regulation of transcription, and calcium ion transmembrane transport (Figure 1C). Thereafter we refer to the 270 genes as DNMT3B-enriched target genes.
A thorough analysis of the DNMT3B-enriched target genes revealed candidates with oncogenic functions, including NOTCH2NL, PANX1, PVT1, and JAK2. Of note, NOTCH2NL is an oncogene activating Notch signaling by direct interaction with NOTCH2, thereby promoting proliferation and self-renewal [40]. PANX1 overexpression has been associated with a worse prognosis in breast and liver cancer patients, which mechanistically is linked to PANX1-dependent enhancement of epithelial–mesenchymal transition and thus cell invasion [41,42]. PVT1 is a long noncoding RNA that is commonly overexpressed in breast cancer and has been implicated in the regulation of MYC oncogene [43,44], while JAK2 is a tyrosine kinase activating cancer-driving JAK/STAT signaling pathway [45].
Among 665 peaks assigned to chromatin states that are relevant to gene transcription, 201 peaks were located within promoters or enhancers, both of which are the core cis-regulatory elements. Interestingly, the majority of those 201 peaks are in enhancer regions (i.e., 173 peaks corresponding to 77 unique genes). The 77 genes with enhancers that gained DNMT3B binding upon PTS fell into several functional categories: (1) oncogenes such as PITPNC1 [46], NOTCH2NL [40], TNNT2 [47], and ZP4 [48], (2) long noncoding RNAs (lncRNAs) such as DANT2, LINC00910, and LOC102724511, (3) microRNAs miR4477A and miR4477B, (4) small noncoding RNAs RNVU1-18 and SNAR-A14), (5) pseudogenes LOC100130331, LOC102724580, and (6) epigenetic regulator SMARCA4, which is the ATPase of the chromatin-remodeling SWI/SNF complexes [49]. Many of those genes are linked to functions and processes that drive cancer. For instance, serine/threonine protein kinase NLK was demonstrated to localize in the nucleus of breast cancer cells and protect the cells from apoptosis [50]. The tumorigenic function of the SREBF1 transcription factor, which was found to be overexpressed and positively associated with metastasis and poor prognosis in breast cancer patients, has been linked to oncogenic activation of the PI3K/AKT/mTOR signaling pathway [51]. PITPNC1 has been shown to be overexpressed in metastatic breast, colon, and melanoma cancers [46], and SMARCA4 is a marker of poor prognosis in many types of cancer [49]. We also identified a group of noncoding RNAs with DNMT3B-enriched enhancers (e.g., LINC00910). Although understanding of functions of noncoding RNAs in carcinogenesis is limited, there is evidence indicating that noncoding RNAs impact a wide range of biological processes such as metabolism [52], immune response [53], and development [54], all of which have been found to be dysregulated during carcinogenesis.

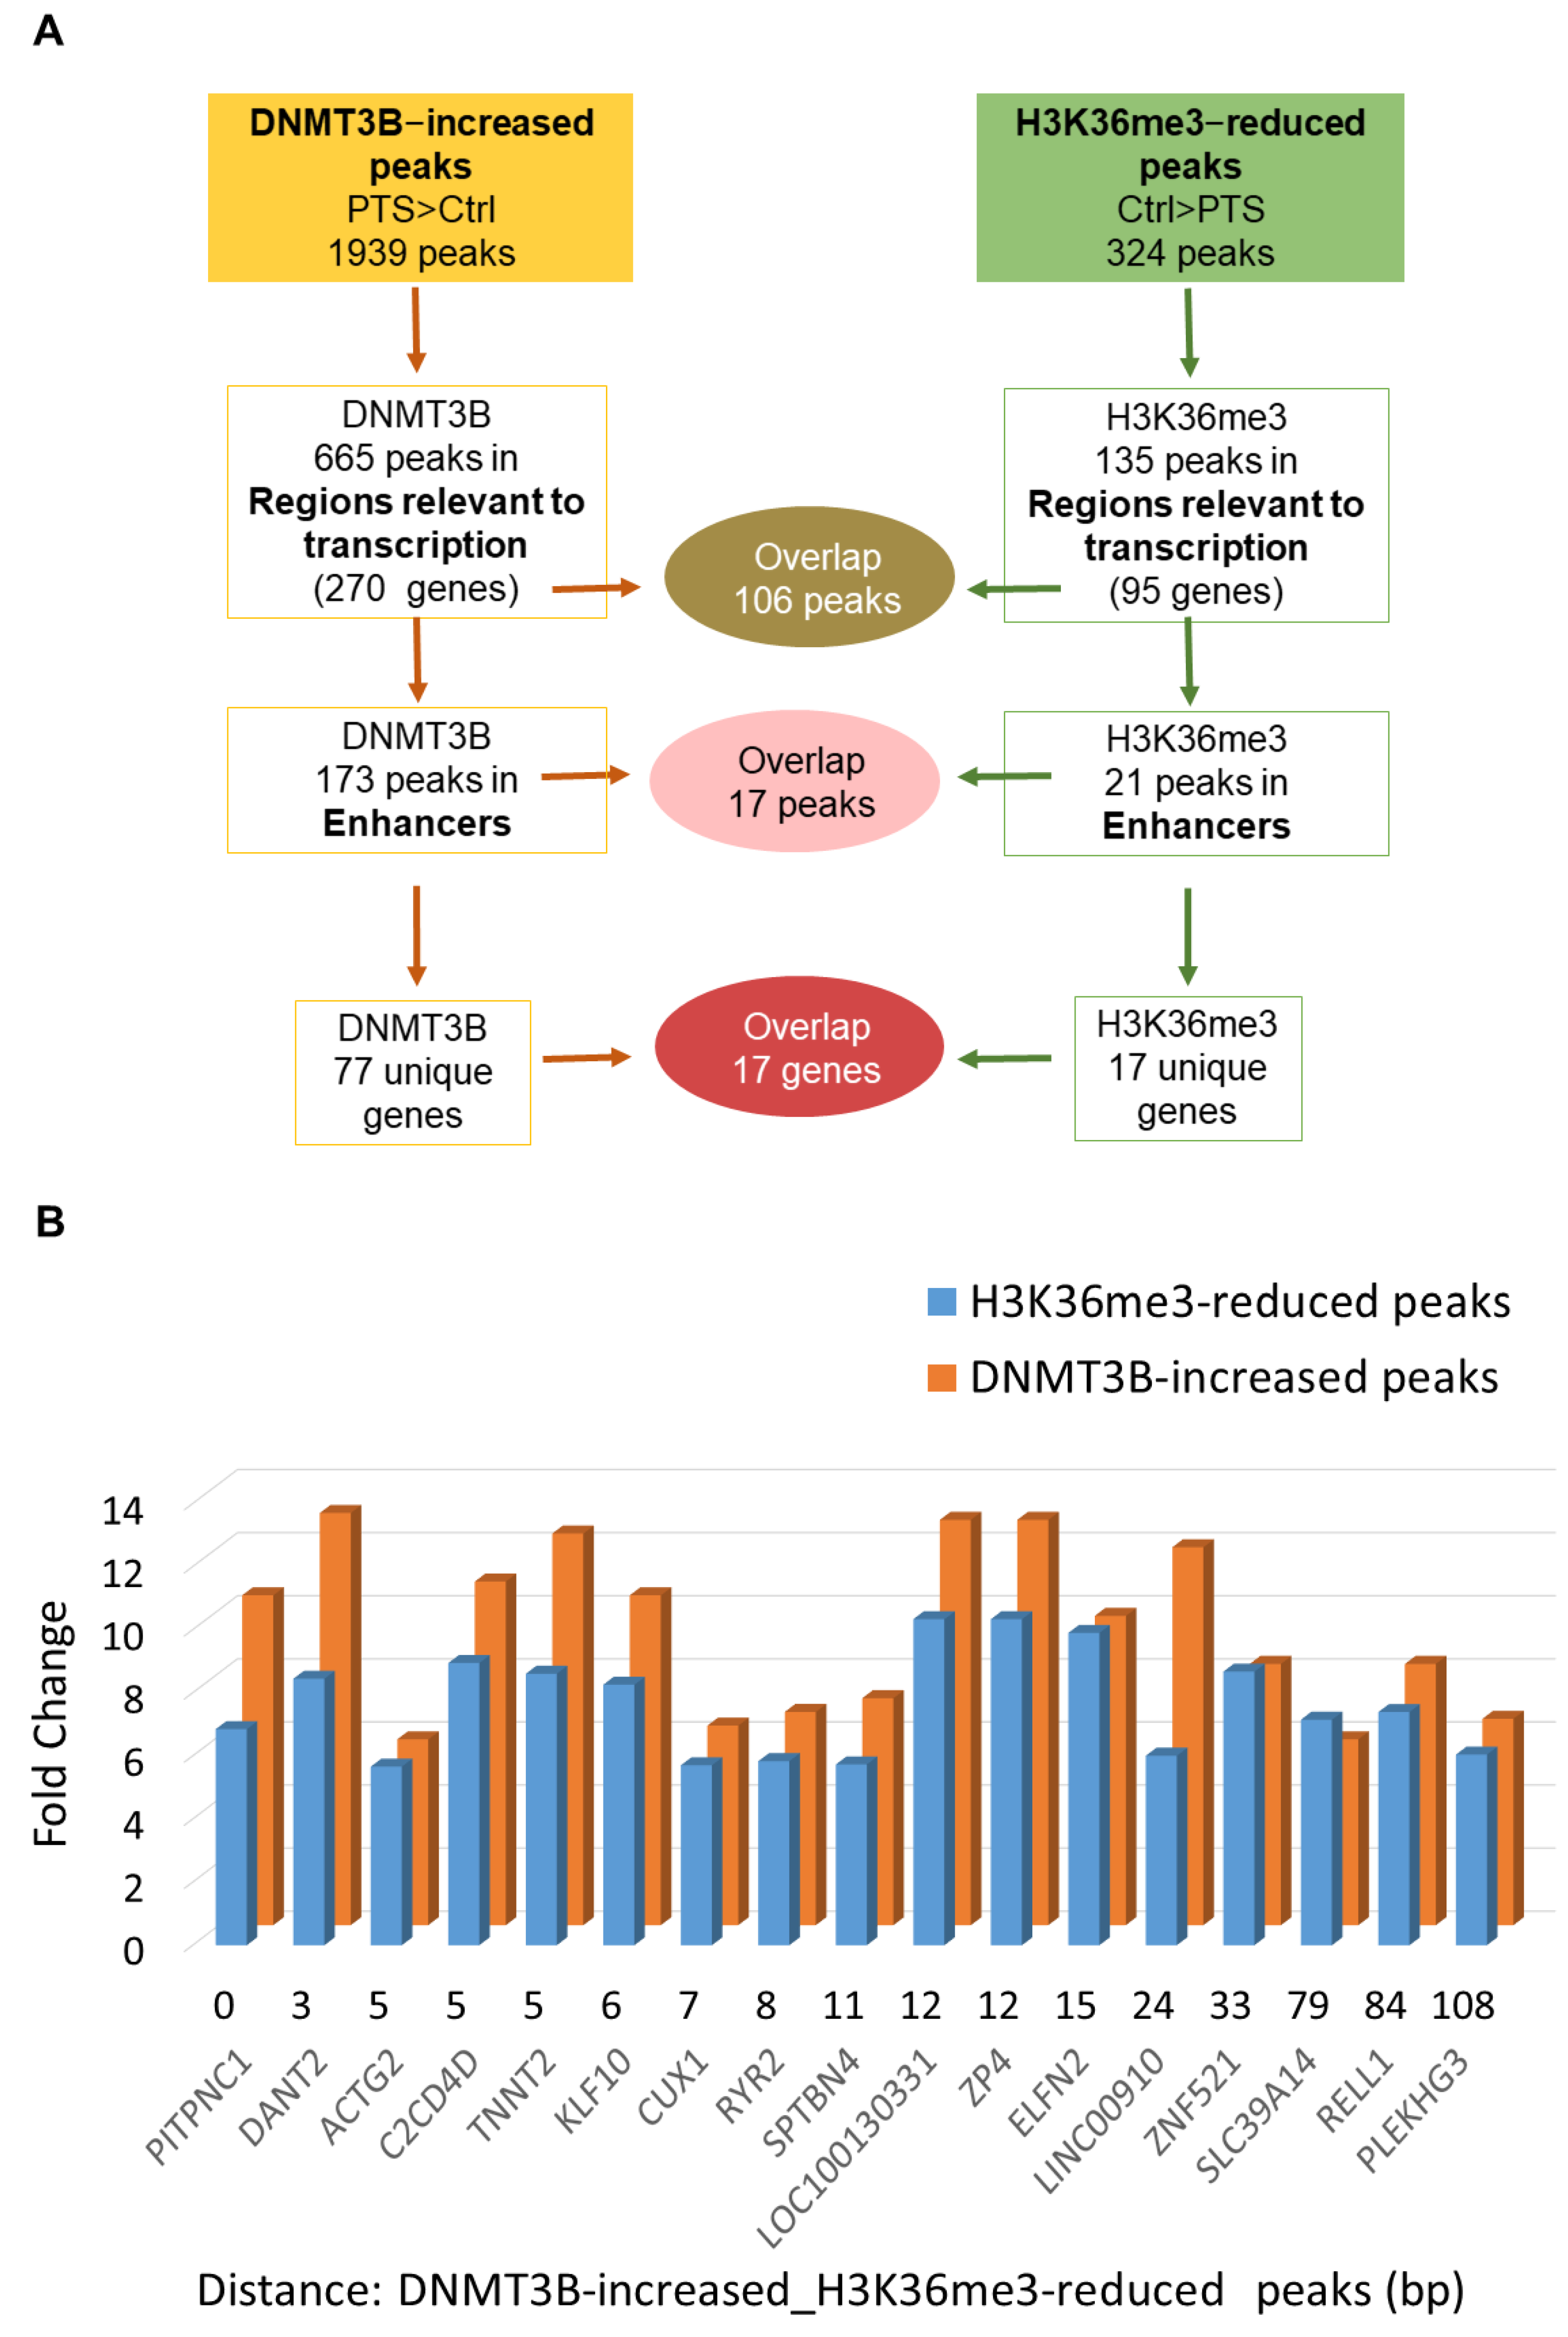
3.2. H3K36me3 Occupancy Is Reduced at Regions Enriched with DNMT3B in Response to PTS

In order to test whether DNMT3B binding is linked to changes in the activity of enhancers, we performed ChIP-seq with antibodies recognizing H3K27ac, a histone mark at active enhancers, in our preliminary experiment. However, we did not detect any apparent changes in H3K27ac upon PTS. Therefore, we proceeded with assessing PTS impact on the distribution of H3K36me3, which is a unique mark that can distinguish active enhancers from intermediate and poised enhancers and is associated with transcriptional activity [13]. Using ChIP-seq, we found 673 peaks, which showed statistically significant differential enrichment with H3K36me3 in response to PTS. Among those peaks, there were 324 peaks with a reduced enrichment in cells treated with PTS, as compared with vehicle-treated cells. The analysis of the chromatin states showed that 135/324 peaks are located in regions relevant to transcription and correspond to 95 unique genes. Our hypothesis, formulated based on our previous study [20], was that DNMT3B binds enhancers of oncogenes, catalyzes DNA methylation, and reduces the activity of enhancers upon PTS, which consequently downregulates gene expression. Thus, we focused on finding an overlap between genes with DNMT3B-increased peaks and genes with H3K36me3-reduced peaks, with the latter mark indicating reduced activity of an enhancer in a given gene. As shown in Figure 1D, we identified 83 genes that had reduced H3K36me3 mark and increased DNMT3B binding within regions relevant to transcription. Importantly, among genes with H3K36me3-reduced peaks, 17 genes were associated with changes in enhancers, and all 17 genes were also found within genes containing DNMT3B-increased peaks (Figure 1D and Figure 2A). For all of the 17 genes, reduced H3K36me3 occupancy and increased DNMT3B binding were detected within 200 bp in the same enhancer region (Figure 2B). We next focused on the 17 genes for further analysis and refer to these genes as ‘candidate genes with epigenetically targeted enhancers in response to PTS’ (Figure 2B). Among them, there were known oncogenes, PITPNC1 [46], TNNT2 [47], and ZP4 [48], and lncRNAs with a putative oncogenic role, such as DANT2 and LINC00910, that we mentioned in the previous paragraph. We also found several genes that may function as oncogenes within the context of breast cancer. For example, CUX1 encodes for a transcription factor that has been demonstrated to bind to the Snail promoter, which ultimately leads to increased epithelial-to-mesenchymal transition (EMT), tumor migration, and invasion [55]. Recently, active CUX1 has been shown to be upregulated in triple-negative breast cancer, and upon knockdown of CUX1, there was increased estrogen receptor ERα and drug sensitivity [56]. Another candidate, RYR2, encodes for a ryanodine receptor, a component of a calcium channel, and it has been previously demonstrated that altered cellular calcium homeostasis contributes to the EMT in breast cancer [57,58]. Indeed, it was described that upon the EMT of MDA-MB-468 breast cancer cells, there was a drastic increase in RYR2, indicating that this receptor may play an important role in the process.

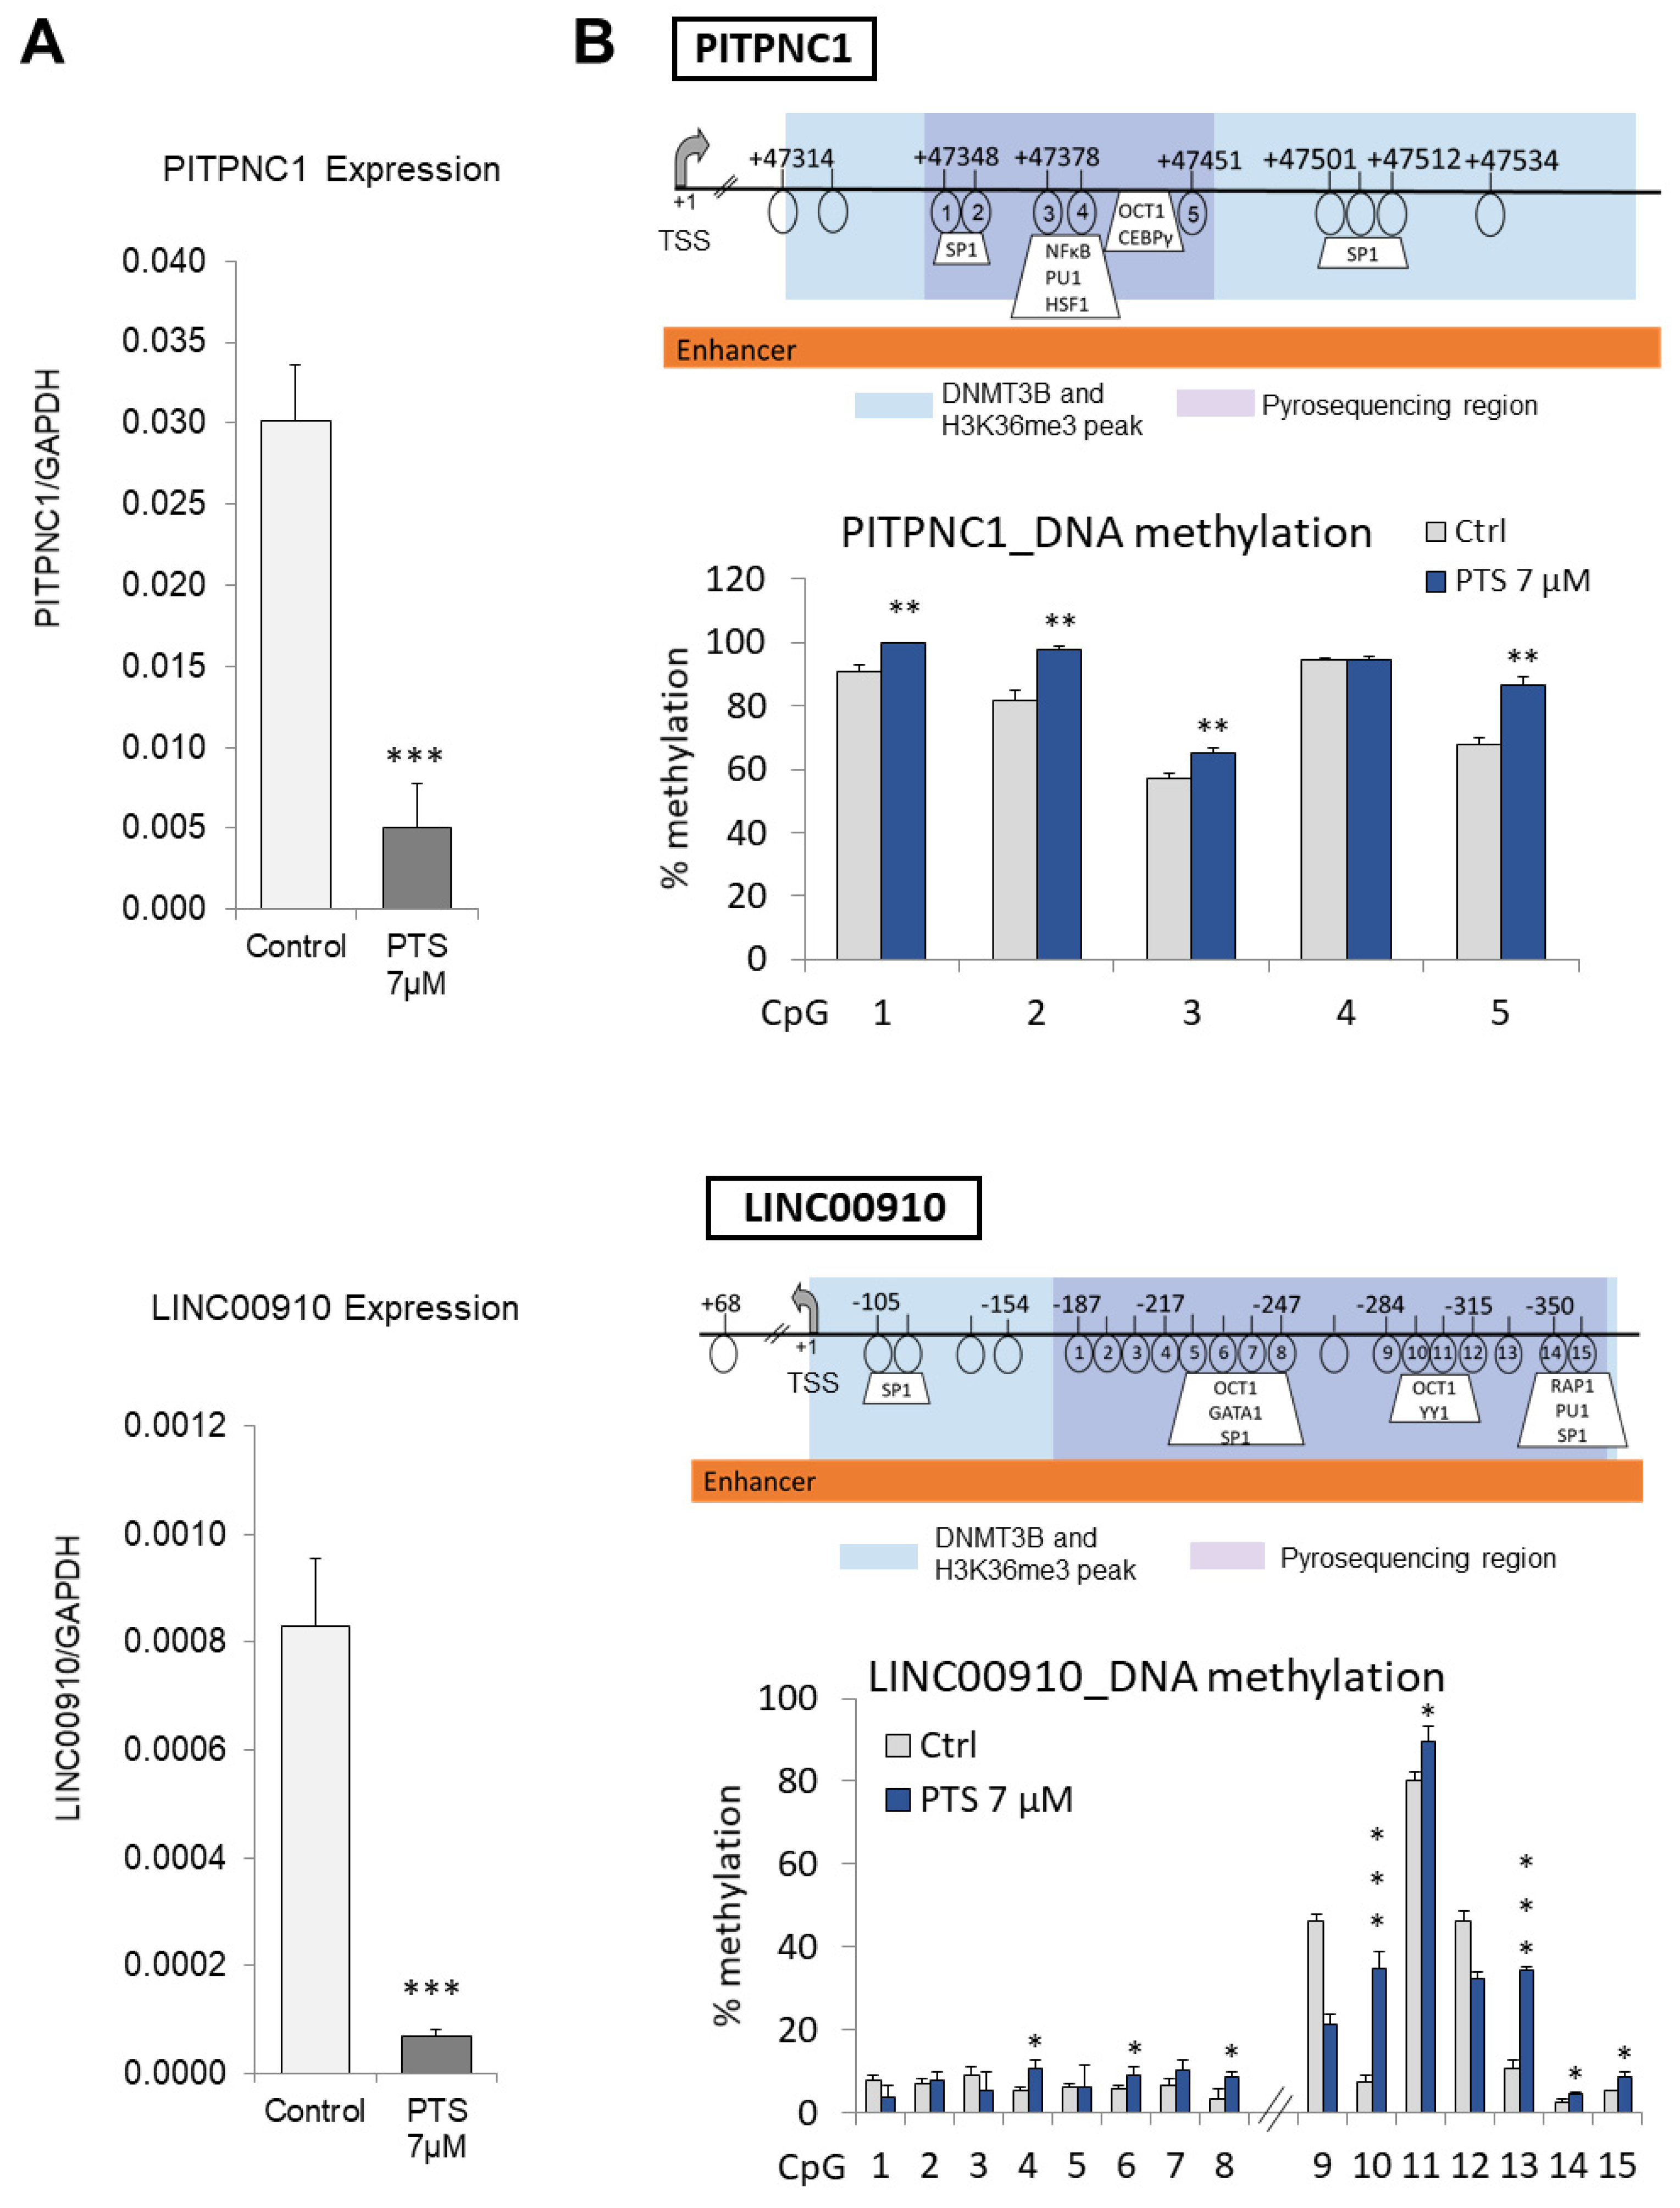
3.3. Candidate Genes with Enhancers That Are Characterized by Increased DNMT3B and Reduced H3K36me3 Occupancy Are Hypermethylated and Downregulated upon Exposure to PTS

Of the 17 ‘candidate genes with epigenetically targeted enhancers in response to PTS’, we selected two genes, PITPNC1 and LINC00910, for further analyses. In our selection, we took into account the magnitude of differential binding (fold change) and the highest proximity, within less than 30 base pairs, between peaks with increased binding of DNMT3B and decreased enrichment of H3K36me3 (Figure 2B). Another important criterion was the biological functions of the genes. As mentioned before, PITPNC1 is a reported oncogene in breast cancer [46], and LINC00910 is a putative oncogenic noncoding RNA. To test whether a decrease in enhancer activating H3K36me3 mark impacts gene transcription, we first assessed gene expression of PITPNC1 and LINC00910 following 9-day treatment of MCF10CA1a breast cancer cells with 7 μM PTS. Using QPCR, we detected that PTS treatment led to a robust decrease in expression of PITPNC by 83% and LINC00910 by 92%, compared to control cells (Figure 3A).
Gene downregulation and DNMT3B binding could suggest that DNA methylation within the enhancers of the tested genes underlies gene silencing. We next measured the DNA methylation status of PITPNC1 and LINC00910 by pyrosequencing. Gene maps show the exact positions of CpG sites in regions of differential occupancy of DNMT3B and H3K36me3 relative to the transcription start site (+1, TSS) (Figure 3B). The results confirmed that the enhancer of PITPNC1 with 5 CpG sites was significantly hypermethylated by 8–16% upon PTS treatment. The enhancer region of LINC00910, encompassing eight CpG sites, showed 2–28% hypermethylation across eight CpG loci (Figure 3B).

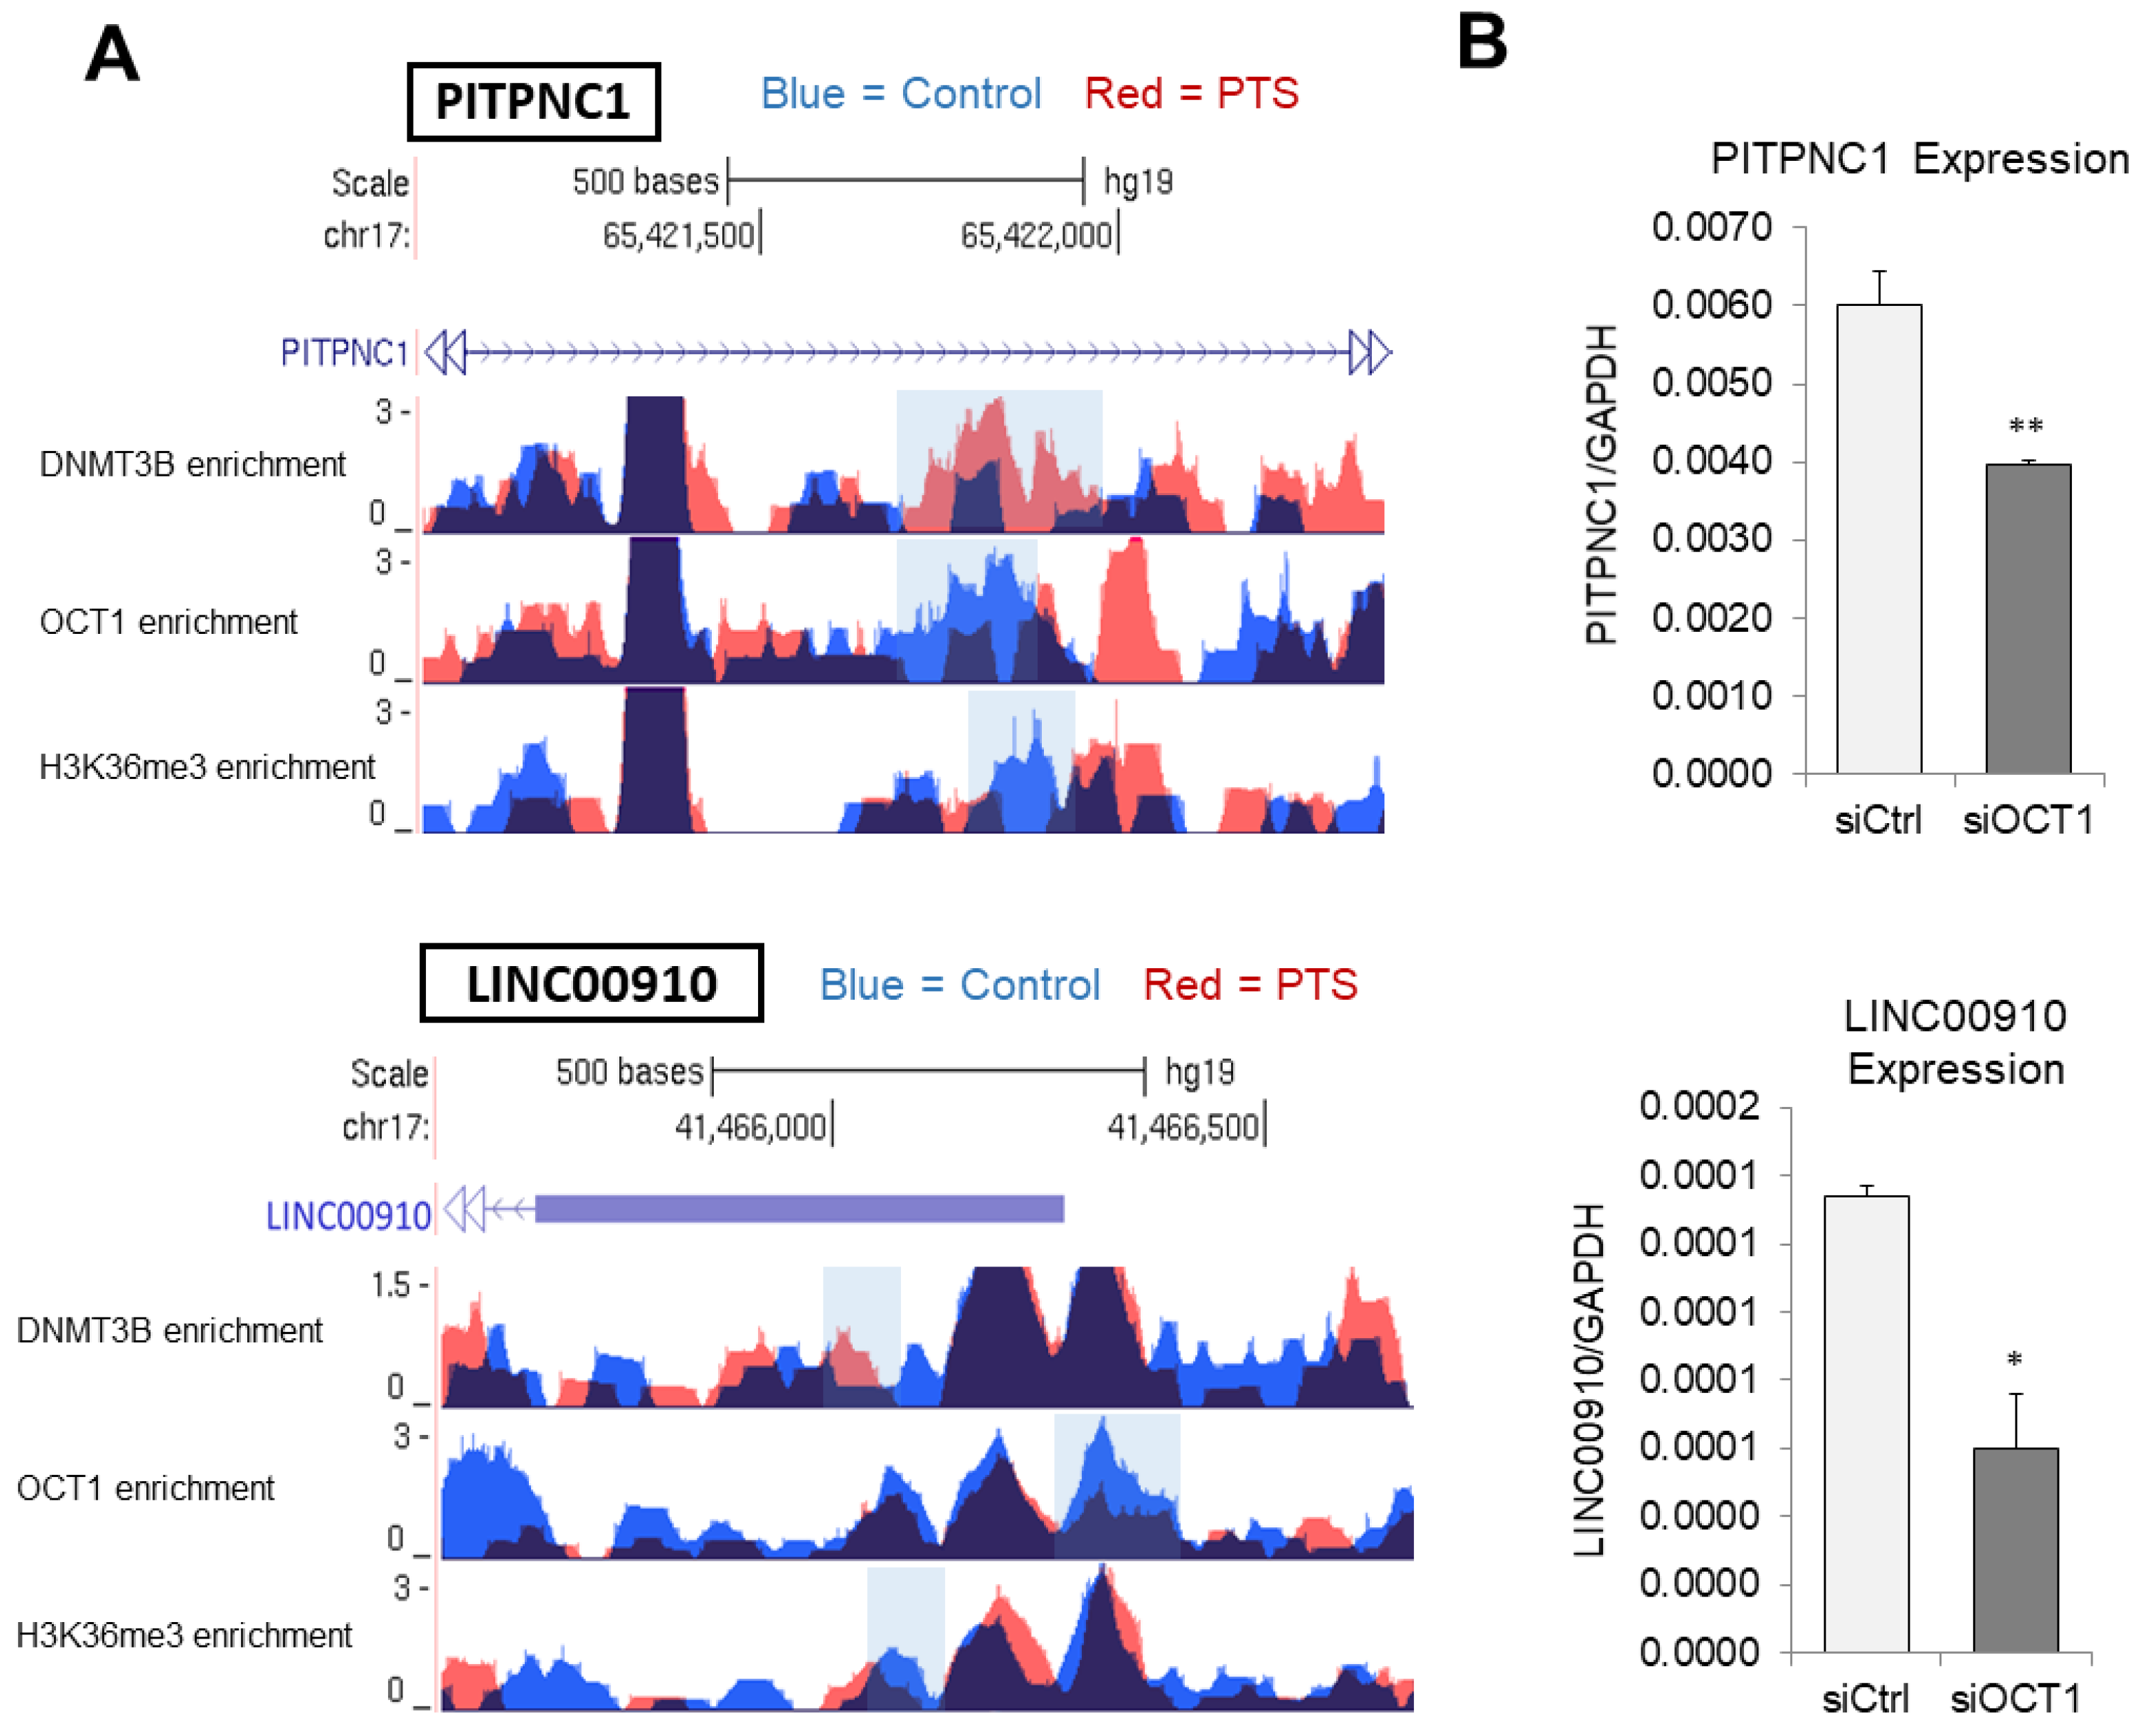
3.4. DNMT3B Enrichment and H3K36me3 Reduced Occupancy Coincide with a Decrease in OCT1 Binding at Target Enhancers in Response to PTS

Our previous genome-wide DNA methylation study showed that 80% of regions whose DNA methylation state increases in response to stilbenoids in breast cancer cells contain a putative OCT1 binding site [20]. Most importantly, we confirmed that increased binding of DNMT3B was associated with decreased occupancy of OCT1 at the hypermethylated MAML2 oncogene in response to PTS [20]. We therefore hypothesize that candidate genes with epigenetically targeted enhancers upon PTS are transcriptionally activated by OCT1 and OCT1 binding decreases coinciding with gene suppression in cells treated with PTS.
To understand these events, we performed ChIP sequencing following ChIP with OCT1-specific antibody. Among 106 peaks that were characterized by increased DNMT3B binding and reduced H3K36me3 mark and located in regions relevant to transcription (Figure 2A), 46% overlapped within 200 bp with an OCT1-reduced peak. Six peaks out of seventeen enhancer regions where epigenetic marks changed upon PTS (i.e., DNMT3B and H3K36me3) contained an overlapping OCT1-reduced peak (Supplementary Table S2). Genome browser tracks of the ChIP-seq data in Figure 4A show the overlap in increased DNMT3B enrichment, reduced OCT1 binding, and reduced H3K36me3 occupancy at enhancer regions of PITPNC1 and LINC00910, in MCF10CA1a cells treated with PTS (red peaks) as compared with control MCF10CA1a breast cancer cells (vehicle-treated, blue peaks).
To determine the role of OCT1 in the regulation of PITPNC1 and LINC00910 transcription, we tested the expression of the genes in MCF10CA1a cells with siRNA-mediated OCT1 depletion, which were generated in our previous study [20]. OCT1 depletion led to a profound downregulation of the two tested genes (Figure 4B). It indicates that OCT1 plays a role in driving the expression of PITPNC1 and LINC00910.

4. Discussion

A crucial role of enhancers in gene transcriptional activity has long been an area of interest, with a more recent focus on the contribution of epigenetic components, including DNA methylation, in regulating the activity of enhancer regions [10,14,15]. Dysregulation of DNA methylation patterns and aberrant expression of DNMTs have been observed across multiple cancer types [59,60]. For instance, tumor suppressor genes are often methylated and silenced during carcinogenesis, whereas oncogenes lose methylation within their regulatory regions, including enhancers, and become actively transcribed [5,20]. Our group has shown that stilbenoids mediate transcriptional repression of MAML2 through altering epigenetic patterns at the enhancer region of this oncogene [20]. DNMT3B was suggested to be a key player in MAML2 hypermethylation and silencing in response to stilbenoids.
In the present study, we therefore investigated epigenetic marks and the interaction of DNMT3B with DNA at enhancer regions in response to PTS in breast cancer cells. Following ChIP-seq, we found 173 DNMT3B-increased peaks within enhancer regions corresponding to 77 unique genes (Figure 1D and Figure 2A). Functional analyses show enrichment of these genes with oncogenic processes and pathways, for example, PITPNC1 is involved in metastasis [46], NOTCH2NL is from the NOTCH signaling pathway [40], and SREBF1 is a transcription factor linked to oncogenic PI3K/AKT/mTOR pathway [51]. Of importance, although DNMT3B’s role in the regulation of gene transcription appears to be context-dependent, the enzyme has previously been shown to target genes with oncogenic functions for methylation and silencing in different cancers, including breast cancer [61,62,63,64]. Interestingly, in our ChIP-seq data, reduced binding of DNMT3B in response to PTS seems to occur at different genes than the increased binding. Among genes associated with DNMT3B-reduced peaks within gene regulatory regions, we found strong candidates associated with inhibition of cancer proliferation, migration, and metastasis, and activation of apoptosis. For instance, we identified CHRDL1, the downregulation of which was associated with poor survival and mechanistically with cancer progression and metastasis, indicating the tumor-suppressing role of CHRDL1 [65]. Other interesting candidates were NOX5, whose activation was demonstrated to inhibit cancer stem cell formation through ROS generation [66], and SALL3, which was reported to directly inhibit DNMT3A activity and consequently cause DNA hypomethylation and activation of tumor suppressor genes [67]. Thus, our findings imply that DNMT3B may be implicated in the methylation and silencing of oncogenes in normal cells.
Interestingly, previous studies report delocalization of DNMT3B in cancer and link this phenomenon, at least partially, to oxidative stress and DNA repair mechanisms [68,69]. It is suggested that oxidative stress leads to DNA breaks and activation of the DNA repair pathway, which consequently recruits DNMT3B to sites of DNA damage [68,69]. When the repair system is overloaded, it may cause a permanent shift in DNMT3B localization, resulting in a transition from the silencing of oncogenes to the methylation and silencing of tumor suppressor genes. As PTS is known to regulate the antioxidant defense network [70,71,72], we could hypothesize that PTS, by decreasing oxidative stress, may alter DNMT3B localization and shift it back to regions where DNMT3B typically binds in normal cells [22]. This interesting concept will be further explored in our future studies.
We found that 17 of the enhancer regions with DNMT3B-increased binding in response to PTS overlap within 200 bp with reduced occupancy of H3K36me3 (Figure 2). H3K36me3 is a very important histone mark linked to transcriptional activation and elongation and distinguishing active from intermediate or poised enhancers [13]. H3K36me3 was found to be abundant along with phosphorylated RNA polymerase II at actively transcribed genes, and, as such, it is an excellent mark of transcribed genes [13]. Nearly 31% of genes with DNMT3B-increased peaks in regions relevant to transcription lost H3K36me3 in response to PTS (Figure 1D). This clearly indicates a decrease in the transcriptional activity of those genes upon PTS.
Genes assigned to the 17 enhancers included oncogenes and pro-metastatic genes (PITPNC1 [46], TNNT2 [47], ZP4 [48], CUX1 [55], RYR2 [57,58]), and putative oncogenes (DANT2 and LINC00910). Indeed, enrichment of ectopic H3K36me3 at oncogenes has previously been reported in different cancers, including breast cancer, and associated with gene upregulation [73,74,75,76,77]. Redistribution of H3K36me3 across intergenic regions and low-expressing genes was associated with aberrantly upregulated expression [78]. As H3K36me3 is known to antagonize Polycomb repressive complex 2 (PRC2)-mediated H3K27 methylation [79,80], perhaps loss of H3K36me3 at enhancers of oncogenes in response to PTS results in increased PRC2-mediated gene repression. Another interesting aspect is that genes expressed in a cell type-dependent manner are known to be targeted by de novo DNMT activity and methylated as a consequence [81]. DNA methylation eventually replaces dynamic histone marks to provide stable silencing of these genes upon differentiation [81]. Indeed, along with increased occupancy of DNMT3B, we observed DNA methylation and decreased expression of PITPNC1 and LINC00910 (Figure 3).
In addition, almost half of the overlapping DNMT3B-increased and H3K36me3-reduced peaks located in regions relevant to transcription (i.e., promoters, enhancers, insulators, Polycomb-repressed regions, or heterochromatin) also lost OCT1 binding in response to PTS (Figure 4A, Supplementary Table S2 with enhancers). This finding raised the possibility that OCT1 plays a role in the regulation of transcription of corresponding genes as all the changes refer to reduced transcription. Indeed, OCT1 depletion in MCF10CA1a breast cancer cells led to a profound downregulation of PITPNC1 and LINC00910 (Figure 4B) and exerted anti-cancer effects [20]. Taking into account that the overlapping DNMT3B-increased and H3K36me3-reduced peaks within regions relevant to transcription are assigned to genes enriched with cancer-driving functions and pathways (Figure 1C), our results are in agreement with existing literature. The pro-tumorigenic function of OCT1 has been demonstrated in different cancer types, and OCT1 has been shown to regulate genes associated with cell metabolic function, proliferation, oxidative stress, and immune modulation, all of which are interconnected with a process of tumorigenesis [82,83]. DNMT3B- and OCT1-mediated mechanisms, through which stilbenoids modify DNA methylation and impact the expression of genes involved in cancer, are an emerging research area.
The overlap between OCT1-reduced peaks and DNMT3B-increased and H3K36me3-reduced peaks also suggests that OCT1 may matter for specificity in DNMT3B binding to those regions. Indeed, several pieces of evidence indicate that DNMT3B recruitment may be directed by the recognition of transcription factors [39,84]. It was reported that certain transcription factors, for example, E2F6, NR6A1, and PU.1, act as positive regulators of DNMT3B recruitment, leading to silencing of their target genes [84], whereas CTCF and SP1 were shown to block de novo DNA methylation at the target regions [84].
In terms of DNMT3B recruitment to the target regions, another interesting hypothesis involves histone modifications, such as H3K36me3, as was suggested by other groups [85,86]. DNMT3B selectively bound the bodies of transcribed genes and led to their preferential methylation, which was mediated through recognition of H3K36me3 in mouse embryonic stem cells [85]. Recruitment of DNMT3B to cell-type-specific actively transcribed enhancers, followed by their hypermethylation, was also demonstrated to be mediated by recognition of H3K36me3 in human epidermal stem cells [86]. Depletion of SETD2, an enzyme responsible for H3K36me3, particularly affected DNA methylation at H3K36me3 sites, implying that H3K36me3 is key to guide loci-specific recruitment of DNMT3B [85]. On the other hand, as we mentioned before, loss of H3K36me3 may result in increased PRC2-mediated gene repression [79,80]. Therefore, the increase in DNMT3B binding and DNA methylation within regions of decreased H3K36me3 upon PTS may just be a consequence of decreased expression, irrespective of H3K36me3 recruitment activity of DNMT3B. Those interesting interactions between epigenetic enzymes and proteins and the consequences of such interactions for the regulation of gene expression should be further explored in vivo. Of importance, current technological advances in cell sorting allow for the isolation of single cells from tumors [87,88,89]. It makes the in vivo approach highly feasible. It would also be critical to elucidate whether DNMT3B plays similar roles in other cancers, especially other aggressive cancers characterized by activation of oncogenes (e.g., pancreatic cancer [90]), and whether PTS effects on DNMT3B binding and histone mark occupancy occur in different cancer types.

5. Conclusions

In summary, our study delivers new knowledge about the effects of dietary polyphenols on epigenetic marks and the interaction between DNA and epigenetic enzymes at enhancer regions. We show that PTS-mediated silencing of known or putative oncogenes involves the interaction between DNMT3B, H3K36me3, and OCT1, which opens the door to further investigations. Such epigenetic silencing of oncogenes may be an important contributor to the anti-cancer action of stilbenoid polyphenols. Insights into the mechanistic underpinnings of bioactive compounds eliciting anti-cancer effects are crucial in the development of effective cancer prevention strategies and novel approaches in support of existing therapies.

Supplementary Materials

The following are available online at https://www.mdpi.com/article/10.3390/antiox10081232/s1, Table S1: Pyrosequencing and QPCR primer sequences for PITPNC1 and LINC00910, Table S2: Overlapping peaks between DNMT3B increase, H3K36 decrease, and OCT1 reduction within enhancer regions.

Author Contributions

S.H.-Z., M.B., C.B. and B.S. conceptualized and designed the study. S.H.-Z., C.B., M.B., T.Y., A.K., K.R., K.L. and B.S. performed experiments and analyzed the data. B.J.E.M., L.J.H., J.H.D. and R.Y.Y. were collaborators on the analysis of raw ChIP sequencing data. S.H.-Z., M.B., C.B., T.Y. and B.S. wrote and revised the manuscript and prepared the figures. All authors have read and agreed to the published version of the manuscript.

Funding

This research was supported by the University of British Columbia VP Academic (#10R76632) Award, the Canadian Foundation for Innovation John R. Evans Leadership Fund and the BC Knowledge Development Fund (#37105), the Natural Sciences and Engineering Research Council Discovery Grant (RGPIN-2021-02969), and the Discovery Launch Supplement (DGECR-2021-00286), granted to B.S.; by grants to L.J.H. from the Canadian Institutes of Health Research (PJT-162253) and the Natural Sciences and Engineering Research Council (RGPIN-2018-04907); and by a grant to R.Y.Y. from the Natural Sciences and Engineering Research Council (RGPIN-2018-04598). B.J.E.M. and J.H.D. were supported by fellowships from the Natural Sciences and Engineering Research Council. K.R. was supported by the Undergraduate Student Research Award from the Natural Sciences and Engineering Research Council.

Institutional Review Board Statement

Not applicable.

Informed Consent Statement

Not applicable.

Data Availability Statement

GEO accession number: GSE175639.

Conflicts of Interest

The authors declare no conflict of interest.

References

  1. Sung, H.; Ferlay, J.; Siegel, R.L.; Laversanne, M.; Soerjomataram, I.; Jemal, A.; Bray, F. Global Cancer Statistics 2020: GLOBOCAN Estimates of Incidence and Mortality Worldwide for 36 Cancers in 185 Countries. CA Cancer J. Clin. 2021, 71, 209–249. [Google Scholar] [CrossRef] [PubMed]
  2. Stefansson, O.A.; Esteller, M. Epigenetic Modifications in Breast Cancer and Their Role in Personalized Medicine. Am. J. Pathol. 2013, 183, 1052–1063. [Google Scholar] [CrossRef] [Green Version]
  3. Baylin, S.B.; Jones, P.A. A decade of exploring the cancer epigenome—biological and translational implications. Nat. Rev. Cancer 2011, 11, 726–734. [Google Scholar] [CrossRef] [PubMed]
  4. Jones, P.A. Functions of DNA methylation: Islands, start sites, gene bodies and beyond. Nat. Rev. Genet. 2012, 13, 484–492. [Google Scholar] [CrossRef] [PubMed]
  5. Baylin, S.B.; Jones, P.A. Epigenetic Determinants of Cancer. Cold Spring Harb. Perspect. Biol. 2016, 8, a019505. [Google Scholar] [CrossRef] [Green Version]
  6. Cedar, H.; Bergman, Y. Linking DNA methylation and histone modification: Patterns and paradigms. Nat. Rev. Genet. 2009, 10, 295–304. [Google Scholar] [CrossRef]
  7. Martin, E.M.; Fry, R.C. Environmental Influences on the Epigenome: Exposure- Associated DNA Methylation in Human Populations. Annu. Rev. Public Health 2018, 39, 309–333. [Google Scholar] [CrossRef] [Green Version]
  8. Xiang, T.-X.; Yuan, Y.; Li, L.; Wang, Z.-H.; Dan, L.-Y.; Chen, Y.; Ren, G.-S.; Tao, Q. Aberrant promoter CpG methylation and its translational applications in breast cancer. Chin. J. Cancer 2013, 32, 12–20. [Google Scholar] [CrossRef]
  9. Kolovos, P.; Knoch, T.A.; Grosveld, F.G.; Cook, P.R.; Papantonis, A. Enhancers and silencers: An integrated and simple model for their function. Epigenet. Chrom. 2012, 5, 1. [Google Scholar] [CrossRef] [Green Version]
  10. Angeloni, A.; Bogdanovic, O. Enhancer DNA methylation: Implications for gene regulation. Essays Biochem. 2019, 63, 707–715. [Google Scholar] [CrossRef]
  11. Sur, I.; Taipale, I.S.J. The role of enhancers in cancer. Nat. Rev. Cancer 2016, 16, 483–493. [Google Scholar] [CrossRef]
  12. Ding, M.; Liu, Y.; Liao, X.; Zhan, H.; Liu, Y.; Huang, W. Enhancer RNAs (eRNAs): New Insights into Gene Transcription and Disease Treatment. J. Cancer 2018, 9, 2334–2340. [Google Scholar] [CrossRef] [Green Version]
  13. Zentner, G.E.; Tesar, P.J.; Scacheri, P.C. Epigenetic signatures distinguish multiple classes of enhancers with distinct cellular functions. Genome Res. 2011, 21, 1273–1283. [Google Scholar] [CrossRef] [Green Version]
  14. Luo, Z.; Lin, C. Enhancer, epigenetics, and human disease. Curr. Opin. Genet. Dev. 2016, 36, 27–33. [Google Scholar] [CrossRef]
  15. Pulakanti, K.; Pinello, L.; Stelloh, C.; Blinka, S.; Allred, J.; Milanovich, S.; Kiblawi, S.; Peterson, J.; Wang, A.; Yuan, G.-C.; et al. Enhancer transcribed RNAs arise from hypomethylated, Tet-occupied genomic regions. Epigenetics 2013, 8, 1303–1320. [Google Scholar] [CrossRef] [Green Version]
  16. Stefanska, B.; Rudnicka, K.; Bednarek, A.; Fabianowska-Majewska, K. Hypomethylation and induction of retinoic acid receptor beta 2 by concurrent action of adenosine analogues and natural compounds in breast cancer cells. Eur. J. Pharmacol. 2010, 638, 47–53. [Google Scholar] [CrossRef] [PubMed]
  17. Stefanska, B.; Salamé, P.; Bednarek, A.; Fabianowska-Majewska, K. Comparative effects of retinoic acid, vitamin D and resveratrol alone and in combination with adenosine analogues on methylation and expression of phosphatase and tensin homologue tumour suppressor gene in breast cancer cells. Br. J. Nutr. 2011, 107, 781–790. [Google Scholar] [CrossRef] [PubMed] [Green Version]
  18. Papoutsis, A.J.; Borg, J.L.; Selmin, O.I.; Romagnolo, D.F. BRCA-1 promoter hypermethylation and silencing induced by the aromatic hydrocarbon receptor-ligand TCDD are prevented by resveratrol in MCF-7 Cells. J. Nutr. Biochem. 2012, 23, 1324–1332. [Google Scholar] [CrossRef]
  19. Gracia, A.; Elcoroaristizabal, X.; Fernández-Quintela, A.; Miranda, J.; Bediaga, N.G.; De Pancorbo, M.M.; Rimando, A.M.; Portillo, M.P. Fatty acid synthase methylation levels in adipose tissue: Effects of an obesogenic diet and phenol compounds. Genes Nutr. 2014, 9, 411. [Google Scholar] [CrossRef] [PubMed] [Green Version]
  20. Lubecka, K.; Kurzava, L.; Flower, K.; Buvala, H.; Zhang, H.; Teegarden, D.; Camarillo, I.; Suderman, M.; Kuang, S.; Andrisani, O.; et al. Stilbenoids remodel the DNA methylation patterns in breast cancer cells and inhibit oncogenic NOTCH signaling through epigenetic regulation of MAML2 transcriptional activity. Carcinogens 2016, 37, 656–668. [Google Scholar] [CrossRef]
  21. Medina-Aguilar, R.; Perez-Plasencia, C.; Marchat, L.; Gariglio, P.; Garcia-Mena, J.; Cuevas, S.R.; Ruiz-Garcia, E.; La Vega, H.A.-D.; Juárez, J.H.; Flores-Pérez, A.; et al. Methylation Landscape of Human Breast Cancer Cells in Response to Dietary Compound Resveratrol. PLoS ONE 2016, 11, e0157866. [Google Scholar] [CrossRef] [PubMed]
  22. Beetch, M.; Harandi-Zadeh, S.; Shen, K.; Lubecka, K.; Kitts, D.D.; O’Hagan, H.; Stefanska, B. Dietary antioxidants remodel DNA methylation patterns in chronic disease. Br. J. Pharmacol. 2019, 177, 1382–1408. [Google Scholar] [CrossRef] [Green Version]
  23. Yang, Y.; Yan, X.; Duan, W.; Yan, J.; Yi, W.; Liang, Z.; Wang, N.; Li, Y.; Chen, W.; Yu, S.; et al. Pterostilbene Exerts Antitumor Activity via the Notch1 Signaling Pathway in Human Lung Adenocarcinoma Cells. PLoS ONE 2013, 8, e62652. [Google Scholar] [CrossRef] [PubMed] [Green Version]
  24. Kondratyuk, T.P.; Park, E.-J.; Marler, L.E.; Ahn, S.; Yuan, Y.; Choi, Y.; Yu, R.; van Breemen, R.; Sun, B.; Hoshino, J.; et al. Resveratrol derivatives as promising chemopreventive agents with improved potency and selectivity. Mol. Nutr. Food Res. 2011, 55, 1249–1265. [Google Scholar] [CrossRef] [PubMed] [Green Version]
  25. Grosso, G.; Buscemi, S.; Galvano, F.; Mistretta, A.; Marventano, S.; Vela, V.L.; Drago, F.; Gangi, S.; Basile, F.; Biondi, A. Mediterranean diet and cancer: Epidemiological evidence and mechanism of selected aspects. BMC Surg. 2013, 13, S14. [Google Scholar] [CrossRef] [Green Version]
  26. Manach, C.; Williamson, G.; Morand, C.; Scalbert, A.; Rémésy, C. Bioavailability and bioefficacy of polyphenols in humans. I. Review of 97 bioavailability studies. Am. J. Clin. Nutr. 2005, 81, 230S–242S. [Google Scholar] [CrossRef] [Green Version]
  27. Williamson, G.; Manach, C. Bioavailability and bioefficacy of polyphenols in humans. II. Review of 93 intervention studies. Am. J. Clin. Nutr. 2005, 81, 243S–255S. [Google Scholar] [CrossRef] [PubMed]
  28. Beetch, M.; Lubecka, K.; Shen, K.; Flower, K.; Harandi-Zadeh, S.; Suderman, M.; Flanagan, J.; Stefanska, B. Stilbenoid-Mediated Epigenetic Activation of Semaphorin 3A in Breast Cancer Cells Involves Changes in Dynamic Interactions of DNA with DNMT3A and NF1C Transcription Factor. Mol. Nutr. Food Res. 2019, 63, e1801386. [Google Scholar] [CrossRef]
  29. Beetch, M.; Boycott, C.; Harandi-Zadeh, S.; Yang, T.; Martin, B.; Dixon-McDougall, T.; Ren, K.; Gacad, A.; Dupuis, J.H.; Ullmer, M.; et al. Pterostilbene leads to DNMT3B-mediated DNA methylation and silencing of OCT1-targeted oncogenes in breast cancer cells. J. Nutr. Biochem. 2021, 108815. [Google Scholar] [CrossRef]
  30. Brown, S.E.; Suderman, M.; Hallett, M.; Szyf, M. DNA demethylation induced by the methyl-CpG-binding domain protein MBD3. Gene 2008, 420, 99–106. [Google Scholar] [CrossRef]
  31. Ciernia, A.V.; Laufer, B.I.; Hwang, H.; Dunaway, K.W.; Mordaunt, C.; Coulson, R.; Yasui, D.H.; LaSalle, J.M. Epigenomic Convergence of Neural-Immune Risk Factors in Neurodevelopmental Disorder Cortex. Cereb. Cortex 2019, 30, 640–655. [Google Scholar] [CrossRef]
  32. Laufer, B.I.; Hwang, H.; Ciernia, A.V.; Mordaunt, C.E.; LaSalle, J.M. Whole genome bisulfite sequencing of Down syndrome brain reveals regional DNA hypermethylation and novel disorder insights. Epigenetics 2019, 14, 672–684. [Google Scholar] [CrossRef] [Green Version]
  33. Martin, M. Cutadapt removes adapter sequences from high-throughput sequencing reads. EMBnet J. 2011, 17, 10–12. [Google Scholar] [CrossRef]
  34. Li, H.; Durbin, R. Fast and accurate short read alignment with Burrows-Wheeler transform. Bioinformation 2009, 25, 1754–1760. [Google Scholar] [CrossRef] [Green Version]
  35. Zhang, Y.; Liu, T.; Meyer, C.A.; Eeckhoute, J.; Johnson, D.S.; Bernstein, B.E.; Nussbaum, C.; Myers, R.M.; Brown, M.; Li, W.; et al. Model-based Analysis of ChIP-Seq (MACS). Genome Biol. 2008, 9, R137–R139. [Google Scholar] [CrossRef] [PubMed] [Green Version]
  36. Thomas, R.; Thomas, S.; Holloway, A.K.; Pollard, K.S. Features that define the best ChIP-seq peak calling algorithms. Briefings Bioinform. 2016, 18, 441–450. [Google Scholar] [CrossRef] [PubMed] [Green Version]
  37. Ernst, J.; Kheradpour, P.; Mikkelsen, T.S.; Shoresh, N.; Ward, L.; Epstein, C.B.; Zhang, X.; Wang, L.; Issner, R.; Coyne, M.; et al. Mapping and analysis of chromatin state dynamics in nine human cell types. Nat. Cell Biol. 2011, 473, 43–49. [Google Scholar] [CrossRef] [PubMed]
  38. Tost, J.; Gut, I.G. DNA methylation analysis by pyrosequencing. Nat. Protoc. 2007, 2, 2265–2275. [Google Scholar] [CrossRef]
  39. Gagliardi, M.; Strazzullo, M.; Matarazzo, M.R. DNMT3B Functions: Novel Insights from Human Disease. Front. Cell Dev. Biol. 2018, 6, 140. [Google Scholar] [CrossRef]
  40. Suzuki, I.K.; Gacquer, D.; Van Heurck, R.; Kumar, D.; Wojno, M.; Bilheu, A.; Herpoel, A.; Lambert, N.; Cheron, J.; Polleux, F.; et al. Human-Specific NOTCH2NL Genes Expand Cortical Neurogenesis through Delta/Notch Regulation. Cell 2018, 173, 1370–1384.e16. [Google Scholar] [CrossRef] [Green Version]
  41. Shi, G.; Liu, C.; Yang, Y.; Song, L.; Liu, X.; Wang, C.; Peng, Z.; Li, H.; Zhong, L. Panx1 promotes invasion-metastasis cascade in hepatocellular carcinoma. J. Cancer 2019, 10, 5681–5688. [Google Scholar] [CrossRef] [Green Version]
  42. Jalaleddine, N.; El-Hajjar, L.; Dakik, H.; Shaito, A.; Saliba, J.; Safi, R.; Zibara, K.; El-Sabban, M. Pannexin1 Is Associated with Enhanced Epithelial-To-Mesenchymal Transition in Human Patient Breast Cancer Tissues and in Breast Cancer Cell Lines. Cancers 2019, 11, 1967. [Google Scholar] [CrossRef] [PubMed] [Green Version]
  43. Wang, Y.; Zhou, J.; Wang, Z.; Wang, P.; Li, S. Upregulation of SOX2 activated LncRNA PVT1 expression promotes breast cancer cell growth and invasion. Biochem. Biophys. Res. Commun. 2017, 493, 429–436. [Google Scholar] [CrossRef]
  44. Sarver, A.L.; Murray, C.D.; Temiz, N.A.; Tseng, Y.-Y.; Bagchi, A. MYCandPVT1synergize to regulate RSPO1 levels in breast cancer. Cell Cycle 2016, 15, 881–885. [Google Scholar] [CrossRef] [Green Version]
  45. Perner, C.; Ernst, T.; Heidel, F.H. Roles of JAK2 in Aging, Inflammation, Hematopoiesis and Malignant Transformation. Cells 2019, 8, 854. [Google Scholar] [CrossRef] [Green Version]
  46. Halberg, N.; Sengelaub, C.A.; Navrazhina, K.; Molina, H.; Uryu, K.; Tavazoie, S.F. PITPNC1 Recruits RAB1B to the Golgi Network to Drive Malignant Secretion. Cancer Cell 2016, 29, 339–353. [Google Scholar] [CrossRef] [PubMed] [Green Version]
  47. Johnston, J.R.; Chase, P.B.; Pinto, J.R. Troponin through the looking-glass: Emerging roles beyond regulation of striated muscle contraction. Oncotarget 2017, 9, 1461–1482. [Google Scholar] [CrossRef] [PubMed] [Green Version]
  48. Costa, J.; Pereira, R.; Oliveira, J.; Alves, Â.; Marques-Magalhães, A.; Frutuoso, A.; Leal, C.; Barros, N.; Fernandes, R.; Almeida, D.Q.; et al. Structural and molecular analysis of the cancer prostate cell line PC3: Oocyte zona pellucida glycoproteins. Tissue Cell 2018, 55, 91–106. [Google Scholar] [CrossRef]
  49. Guerrero-Martínez, J.A.; Reyes, J.C. High expression of SMARCA4 or SMARCA2 is frequently associated with an opposite prognosis in cancer. Sci. Rep. 2018, 8, 2043. [Google Scholar] [CrossRef] [PubMed] [Green Version]
  50. Daams, R.; Massoumi, R. Nemo-Like Kinase in Development and Diseases: Insights from Mouse Studies. Int. J. Mol. Sci. 2020, 21, 9203. [Google Scholar] [CrossRef]
  51. Yi, J.; Zhu, J.; Wu, J.; Thompson, C.B.; Jiang, X. Oncogenic activation of PI3K-AKT-mTOR signaling suppresses ferroptosis via SREBP-mediated lipogenesis. Proc. Natl. Acad. Sci. USA 2020, 117, 31189–31197. [Google Scholar] [CrossRef] [PubMed]
  52. Zhao, Y.; Wu, J.; Liangpunsakul, S.; Wang, L. Long non-coding RNA in liver metabolism and disease: Current status. Liver Res. 2017, 1, 163–167. [Google Scholar] [CrossRef] [PubMed]
  53. Chen, Y.G.; Satpathy, A.; Chang, H.Y. Gene regulation in the immune system by long noncoding RNAs. Nat. Immunol. 2017, 18, 962–972. [Google Scholar] [CrossRef]
  54. Perry, R.B.-T.; Ulitsky, I. The functions of long noncoding RNAs in development and stem cells. Development 2016, 143, 3882–3894. [Google Scholar] [CrossRef] [Green Version]
  55. Kedinger, V.; Sansregret, L.; Harada, R.; Vadnais, C.; Cadieux, C.; Fathers, K.; Park, M.; Nepveu, A. p110 CUX1 Homeodomain Protein Stimulates Cell Migration and Invasion in Part through a Regulatory Cascade Culminating in the Repression of E-cadherin and Occludin. J. Biol. Chem. 2009, 284, 27701–27711. [Google Scholar] [CrossRef] [PubMed] [Green Version]
  56. Burton, L.J.; Hawsawi, O.; Sweeney, J.; Bowen, N.; Hudson, T.; Odero-Marah, V. CCAAT-displacement protein/cut homeobox transcription factor (CUX1) represses estrogen receptor-alpha (ER-α) in triple-negative breast cancer cells and can be antagonized by muscadine grape skin extract (MSKE). PLoS ONE 2019, 14, e0214844. [Google Scholar] [CrossRef] [PubMed]
  57. Hu, J.; Qin, K.; Zhang, Y.; Gong, J.; Li, N.; Lv, D.; Xiang, R.; Tan, X. Downregulation of transcription factor Oct4 induces an epithelial-to-mesenchymal transition via enhancement of Ca2+ influx in breast cancer cells. Biochem. Biophys. Res. Commun. 2011, 411, 786–791. [Google Scholar] [CrossRef] [PubMed]
  58. Davis, F.M.; Peters, A.A.; Grice, D.M.; Cabot, P.J.; Parat, M.-O.; Roberts-Thomson, S.J.; Monteith, G.R. Non-Stimulated, Agonist-Stimulated and Store-Operated Ca2+ Influx in MDA-MB-468 Breast Cancer Cells and the Effect of EGF-Induced EMT on Calcium Entry. PLoS ONE 2012, 7, e36923. [Google Scholar] [CrossRef] [Green Version]
  59. Zeng, X.-Q.; Wang, J.; Chen, S.-Y. Methylation modification in gastric cancer and approaches to targeted epigenetic therapy (Review). Int. J. Oncol. 2017, 50, 1921–1933. [Google Scholar] [CrossRef] [PubMed] [Green Version]
  60. Zhang, W.; Xu, J. DNA methyltransferases and their roles in tumorigenesis. Biomark. Res. 2017, 5, 1. [Google Scholar] [CrossRef] [PubMed] [Green Version]
  61. Hlady, R.A.; Novakova, S.; Opavska, J.; Klinkebiel, D.; Peters, S.L.; Bies, J.; Hannah, J.; Iqbal, J.; Anderson, K.M.; Siebler, H.M.; et al. Loss of Dnmt3b function upregulates the tumor modifier Ment and accelerates mouse lymphomagenesis. J. Clin. Investig. 2012, 122, 163–177. [Google Scholar] [CrossRef] [Green Version]
  62. Zheng, Y.; Zhang, H.; Wang, Y.; Li, X.; Lu, P.; Dong, F.; Pang, Y.; Ma, S.; Cheng, H.; Hao, S.; et al. Loss of Dnmt3b accelerates MLL-AF9 leukemia progression. Leukemia 2016, 30, 2373–2384. [Google Scholar] [CrossRef] [PubMed]
  63. Peralta-Arrieta, I.; Hernández-Sotelo, D.; Castro-Coronel, Y.; Leyva-Vazquez, M.A.; Illades-Aguiar, B. DNMT3B modulates the expression of cancer-related genes and downregulates the expression of the gene VAV3 via methylation. Am. J. Cancer Res. 2017, 7, 77–87. [Google Scholar] [PubMed]
  64. Roll, J.D.; Rivenbark, A.G.; Jones, W.D.; Coleman, W.B. DNMT3b overexpression contributes to a hypermethylator phenotype in human breast cancer cell lines. Mol. Cancer 2008, 7, 15. [Google Scholar] [CrossRef] [Green Version]
  65. Pei, Y.-F.; Zhang, Y.-J.; Lei, Y.; Wu, D.-W.; Ma, T.-H.; Liu, X.-Q. Hypermethylation of the CHRDL1 promoter induces proliferation and metastasis by activating Akt and Erk in gastric cancer. Oncotarget 2017, 8, 23155–23166. [Google Scholar] [CrossRef] [PubMed] [Green Version]
  66. Kim, S.-L.; Choi, H.S.; Kim, J.-H.; Jeong, D.K.; Kim, K.-S.; Lee, D.-S. Dihydrotanshinone-Induced NOX5 Activation Inhibits Breast Cancer Stem Cell through the ROS/Stat3 Signaling Pathway. Oxidative Med. Cell. Longev. 2019, 2019, 9296439. [Google Scholar] [CrossRef]
  67. Shikauchi, Y.; Saiura, A.; Kubo, T.; Niwa, Y.; Yamamoto, J.; Murase, Y.; Yoshikawa, H. SALL3 Interacts with DNMT3A and Shows the Ability To Inhibit CpG Island Methylation in Hepatocellular Carcinoma. Mol. Cell. Biol. 2009, 29, 1944–1958. [Google Scholar] [CrossRef] [Green Version]
  68. O’Hagan, H.; Wang, W.; Sen, S.; Shields, C.D.; Lee, S.; Zhang, Y.W.; Clements, E.G.; Cai, Y.; Van Neste, L.; Easwaran, H.; et al. Oxidative Damage Targets Complexes Containing DNA Methyltransferases, SIRT1, and Polycomb Members to Promoter CpG Islands. Cancer Cell 2011, 20, 606–619. [Google Scholar] [CrossRef] [Green Version]
  69. Maiuri, A.R.; Peng, M.; Podicheti, R.; Sriramkumar, S.; Kamplain, C.M.; Rusch, D.B.; Shields, C.E.D.; Sears, C.L.; O’Hagan, H.M. Mismatch Repair Proteins Initiate Epigenetic Alterations during Inflammation-Driven Tumorigenesis. Cancer Res. 2017, 77, 3467–3478. [Google Scholar] [CrossRef] [Green Version]
  70. Eräsalo, H.; Hämäläinen, M.; Leppänen, T.; Mäki-Opas, I.; Laavola, M.; Haavikko, R.; Yli-Kauhaluoma, J.; Moilanen, E. Natural Stilbenoids Have Anti-Inflammatory Properties in Vivo and Down-Regulate the Production of Inflammatory Mediators NO, IL6, and MCP1 Possibly in a PI3K/Akt-Dependent Manner. J. Nat. Prod. 2018, 81, 1131–1142. [Google Scholar] [CrossRef]
  71. Liu, Y.; You, Y.; Lu, J.; Chen, X.; Yang, Z. Recent Advances in Synthesis, Bioactivity, and Pharmacokinetics of Pterostilbene, an Important Analog of Resveratrol. Molecules 2020, 25, 5166. [Google Scholar] [CrossRef] [PubMed]
  72. Levenson, A.S.; Kumar, A. Pterostilbene as a Potent Chemopreventive Agent in Cancer. In Natural Products for Cancer Chemoprevention; Single Compounds and Combinations; Pezzuto, J.M., Vang, O., Eds.; Springer Nature Switzerland AG: Berlin/Heidelberg, Germany, 2020. [Google Scholar]
  73. Bu, J.; Chen, A.; Yan, X.; He, F.; Dong, Y.; Zhou, Y.; He, J.; Zhan, D.; Lin, P.; Hayashi, Y.; et al. SETD2-mediated crosstalk between H3K36me3 and H3K79me2 in MLL-rearranged leukemia. Leukemia 2017, 32, 890–899. [Google Scholar] [CrossRef]
  74. Lien, H.-C.; Jeng, Y.-M.; Jhuang, Y.-L.; Yuan, R.-H. Increased Trimethylation of histone H3K36 associates with biliary differentiation and predicts poor prognosis in resectable hepatocellular carcinoma. PLoS ONE 2018, 13, e0206261. [Google Scholar] [CrossRef] [PubMed]
  75. Yang, P.; Guo, L.; Duan, Z.J.; Tepper, C.G.; Xue, L.; Chen, X.; Kung, H.-J.; Gao, A.C.; Zou, J.X.; Chen, H.-W. Histone Methyltransferase NSD2/MMSET Mediates Constitutive NF-κB Signaling for Cancer Cell Proliferation, Survival, and Tumor Growth via a Feed-Forward Loop. Mol. Cell. Biol. 2012, 32, 3121–3131. [Google Scholar] [CrossRef] [PubMed] [Green Version]
  76. Rivenbark, A.G.; Coleman, W.B.; Stahl, B.D. Histone methylation patterns in human breast cancer. FASEB J. 2009, 23, 38.1. [Google Scholar] [CrossRef]
  77. Zhang, L.-Q.; Li, Q.-Z.; Jin, W.; Zuo, Y.; Guo, S.-C. Genome-wide analysis of H3K36me3 and its regulations to cancer-related genes expression in human cell lines. Biosystems 2018, 171, 59–65. [Google Scholar] [CrossRef]
  78. Tiedemann, R.L.; Hlady, R.A.; Hanavan, P.D.; Lake, D.F.; Tibes, R.; Lee, J.-H.; Choi, J.-H.; Ho, T.H.; Robertson, K.D. Dynamic reprogramming of DNA methylation in SETD2-deregulated renal cell carcinoma. Oncotarget 2015, 7, 1927–1946. [Google Scholar] [CrossRef] [Green Version]
  79. Finogenova, K.; Bonnet, J.; Poepsel, S.; Schäfer, I.B.; Finkl, K.; Schmid, K.; Litz, C.; Strauss, M.; Benda, C.; Müller, J. Structural basis for PRC2 decoding of active histone methylation marks H3K36me2/3. eLife 2020, 9, e61964. [Google Scholar] [CrossRef]
  80. Yuan, W.; Xu, M.; Huang, C.; Liu, N.; Chen, S.; Zhu, B. H3K36 Methylation Antagonizes PRC2-mediated H3K27 Methylation. J. Biol. Chem. 2011, 286, 7983–7989. [Google Scholar] [CrossRef] [PubMed] [Green Version]
  81. Alajem, A.; Roth, H.; Ratgauzer, S.; Bavli, D.; Motzik, A.; Lahav, S.; Peled, I.; Ram, O. DNA methylation patterns expose variations in enhancer-chromatin modifications during embryonic stem cell differentiation. PLoS Genet. 2021, 17, e1009498. [Google Scholar] [CrossRef]
  82. Vázquez-Arreguín, K.; Tantin, D. The Oct1 transcription factor and epithelial malignancies: Old protein learns new tricks. Biochim. Biophys. Acta Bioenerg. 2016, 1859, 792–804. [Google Scholar] [CrossRef] [PubMed] [Green Version]
  83. Shakya, A.; Cooksey, R.; Cox, J.E.; Wang, V.; McClain, D.; Tantin, D. Oct1 loss of function induces a coordinate metabolic shift that opposes tumorigenicity. Nat. Cell Biol. 2009, 11, 320–327. [Google Scholar] [CrossRef]
  84. Hervouet, E.; Peixoto, P.; Delage-Mourroux, R.; Boyer-Guittaut, M.; Cartron, P.-F. Specific or not specific recruitment of DNMTs for DNA methylation, an epigenetic dilemma. Clin. Epigenetics 2018, 10, 17. [Google Scholar] [CrossRef]
  85. Baubec, T.; Colombo, D.; Wirbelauer, C.; Schmidt, J.; Burger, L.; Krebs, A.; Akalin, A.; Schübeler, D. Genomic profiling of DNA methyltransferases reveals a role for DNMT3B in genic methylation. Nat. Cell Biol. 2015, 520, 243–247. [Google Scholar] [CrossRef]
  86. Rinaldi, L.; Datta, D.; Serrat, J.; Morey, L.; Solanas, G.; Avgustinova, A.; Blanco, E.; Pons, J.I.; Matallanas, D.; von Kriegsheim, A.; et al. Dnmt3a and Dnmt3b Associate with Enhancers to Regulate Human Epidermal Stem Cell Homeostasis. Cell Stem Cell 2016, 19, 491–501. [Google Scholar] [CrossRef] [Green Version]
  87. Brooks, D.L.; Seagroves, T.N. Fluorescence-Activated Cell Sorting of Murine Mammary Cancer Stem-Like Cell Subpopulations with HIF Activity. Methods Mol. Biol. 2018, 247–263. [Google Scholar] [CrossRef]
  88. Assi, M.; Dauguet, N.; Jacquemin, P. DIE-RNA: A Reproducible Strategy for the Digestion of Normal and Injured Pancreas, Isolation of Pancreatic Cells from Genetically Engineered Mouse Models and Extraction of High Quality RNA. Front. Physiol. 2018, 9, 129. [Google Scholar] [CrossRef] [Green Version]
  89. Porter, W.; Snowden, E.; Hahn, F.; Ferguson, M.; Tong, F.; Dillmore, W.S.; Blaesius, R. High accuracy gene expression profiling of sorted cell subpopulations from breast cancer PDX model tissue. PLoS ONE 2020, 15, e0238594. [Google Scholar] [CrossRef]
  90. Ischenko, I.; D’Amico, S.; Rao, M.; Li, J.; Hayman, M.J.; Powers, S.; Petrenko, O.; Reich, N.C. KRAS drives immune evasion in a genetic model of pancreatic cancer. Nat. Commun. 2021, 12, 1482. [Google Scholar] [CrossRef] [PubMed]
Figure 1. Overview of genome−wide changes of DNMT3B binding in response to PTS. (A) A bar chart depicting the number of changes in DNMT3B binding in MCF10CA1a breast cancer cells treated with 7 μM PTS for 9 days. DNMT3B binding was assessed by ChIP sequencing. (B) Chromatin states associated with DNMT3B-increased peaks were determined using Broad ChromHMM data from human mammary epithelial cells (HMEC) available on USCS Genome Browser (hg19). Peaks could correspond to active, weak, or poised promoters, strong or weak enhancers, putative insulators, active or weak transcription, Polycomb−repressed regions, heterochromatin, or repetitive regions. (C) The 270 genes with DNMT3B-increased peaks in regions relevant to transcription upon PTS (i.e., promoters, enhancers, insulators, Polycomb-repressed regions, or heterochromatin) were subjected to Gene Ontology (GO) function and Kyoto Encyclopedia of Genes and Genomes (KEGG) pathway analysis using DAVID Knowledgebase. (D) Venn diagrams present an overlap between genes with DNMT3B−increased and H3K36me3-reduced peaks that were located in regions relevant to transcription and specifically in enhancer regions. The proportionally scaled Venn diagrams were generated using tools on www.stefanjol.nl/venny (accessed on 28 May 2021).
Antioxidants 10 01232 g001
Figure 2. Characterization of regions and genes that contain overlapping DNMT3B-increased and H3K36me3-reduced peaks in response to PTS. (A) Schematic of the analysis of peaks and genes associated with DNMT3B-increased and H3K36me3-reduced peaks in MCF10CA1a breast cancer cells treated with 7 μM PTS for 9 days. The overlap between peaks located within regions relevant to transcription (i.e., promoters, enhancers, insulators, Polycomb-repressed regions, or heterochromatin) and specifically enhancers is depicted along with the number of corresponding genes. (B) The 17 overlapping peaks located in enhancer regions and the corresponding genes are shown in the bar chart that computes a difference (fold change) in DNMT3B binding and H3K36me3 enrichment between PTS-treated and control cells (vehicle-treated, ethanol), along with the distance between DNMT3B-increased and H3K36me3-reduced peaks in a given gene. The presented results are based on ChIP-seq analyses.
Antioxidants 10 01232 g002
Figure 3. Increased DNMT3B binding and reduced H3K36me3 occupancy is associated with PITPNC1 and LINC00910 downregulation and hypermethylation of the enhancer regions in response to PTS in breast cancer cells. (A) PITPNC1 and LINC00910 expression upon 9-day treatment of MCF10CA1a breast cancer cells with 7 μM PTS as determined by QPCR. (B) Average methylation status of CpG sites within PITPNC1 and LINC00910 enhancer regions as determined by pyrosequencing in MCF10CA1a breast cancer cells treated for 9 days with 7 μM PTS. Gene maps show transcription start site (TSS) indicated by +1, transcription factors predicted using Transfac, and pyrosequenced CpG sites circled and numbered. The blue-shaded fragment in the gene map represents the DNMT3B-increased and H3K36me3-reduced overlapping peaks. The purple-shaded regions refer to a region tested in pyrosequencing. All results represent mean ± SD of three independent experiments; *** p < 0.001, ** p < 0.01, * p < 0.05.
Antioxidants 10 01232 g003
Figure 4. Increased DNMT3B binding and reduced H3K36me3 occupancy is associated with PITPNC1 and LINC00910 downregulation and hypermethylation of the enhancer regions in response to PTS in breast cancer cells. (A) Genome browser tracks depicting DNMT3B, OCT1, and H3K36me3 enrichment in occupancy within PITPNC1 and LINC00910 enhancer regions in vehicle-treated (blue, control) and PTS-treated (red) MCF10CA1a breast cancer cells. The data are based on ChIP-seq analyses. The blue-shaded region represents the DNMT3B-increased, OCT1-reduced, and h3K36me3-reduced overlapping peaks. (B) Expression of PITPNC1 and LINC00910, as determined by QPCR in MCF10CA1a breast cancer cells with OCT1 knockdown, which was generated using siRNA. Cells transfected with scrambled siRNA (siCtrl) served as a control. All results represent mean ± SD of three independent experiments; ** p < 0.01, * p < 0.05.
Antioxidants 10 01232 g004
Publisher’s Note: MDPI stays neutral with regard to jurisdictional claims in published maps and institutional affiliations.

