Article

Encapsulation of Phenolic Compounds from a Grape Cane Pilot-Plant Extract in Hydroxypropyl Beta-Cyclodextrin and Maltodextrin by Spray Drying

by
Danilo Escobar-Avello
1,2,
Javier Avendaño-Godoy
3,
Jorge Santos
4,5,
Julián Lozano-Castellón
1,6,
Claudia Mardones
7,
Dietrich von Baer
7,
Javiana Luengo
3,
Rosa M. Lamuela-Raventós
1,6,
Anna Vallverdú-Queralt
1,6,* and
Carolina Gómez-Gaete
2,3,*
1
Department of Nutrition, Food Science and Gastronomy XaRTA, Faculty of Pharmacy and Food Sciences, Institute of Nutrition and Food Safety (INSA-UB), University of Barcelona, 08028 Barcelona, Spain
2
Unidad de Desarrollo Tecnológico, Universidad de Concepción, 4191996 Coronel, Chile
3
Departamento de Farmacia, Facultad de Farmacia, Universidad de Concepción, 4191996 Concepción, Chile
4
DEMad, Instituto Politécnico de Viseu, 3504-510 Viseu, Portugal
5
LEPABE—Faculty of Engineering, University of Porto, 4200-465 Porto, Portugal
6
Consorcio CIBER, M.P. Fisiopatología de la Obesidad y la Nutrición (CIBERObn), Instituto de Salud Carlos III (ISCIII), 28029 Madrid, Spain
7
Departamento de Análisis Instrumental, Facultad de Farmacia, Universidad de Concepción, 4070386 Concepción, Chile
*
Authors to whom correspondence should be addressed.
Antioxidants 2021, 10(7), 1130; https://doi.org/10.3390/antiox10071130
Submission received: 10 June 2021 / Revised: 7 July 2021 / Accepted: 13 July 2021 / Published: 15 July 2021

Abstract

:
Grape canes, the main byproducts of the viticulture industry, contain high-value bioactive phenolic compounds, whose application is limited by their instability and poorly solubility in water. Encapsulation in cyclodextrins allows these drawbacks to be overcome. In this work, a grape cane pilot-plant extract (GCPPE) was encapsulated in hydroxypropyl beta-cyclodextrin (HP-β-CD) by a spray-drying technique and the formation of an inclusion complex was confirmed by microscopy and infrared spectroscopy. The phenolic profile of the complex was analyzed by LC-ESI-LTQ-Orbitrap-MS and the encapsulation efficiency of the phenolic compounds was determined. A total of 42 compounds were identified, including stilbenes, flavonoids, and phenolic acids, and a complex of (epi)catechin with β-CD was detected, confirming the interaction between polyphenols and cyclodextrin. The encapsulation efficiency for the total extract was 80.5 ± 1.1%, with restrytisol showing the highest value (97.0 ± 0.6%) and (E)-resveratrol (32.7 ± 2.8%) the lowest value. The antioxidant capacity of the inclusion complex, determined by ORAC-FL, was 5300 ± 472 µmol TE/g DW, which was similar to the value obtained for the unencapsulated extract. This formulation might be used to improve the stability, solubility, and bioavailability of phenolic compounds of the GCPPE for water-soluble food and pharmaceutical applications.

1. Introduction

The generation of food and agricultural waste is a growing problem, with negative impacts on the economy, environment, and human health. Therefore, the integral valorization of these wastes by conversion into bioenergy or recovery of chemical compounds for biobased products is a technological challenge for achieving a circular economy. Alternative ways of disposing of food waste include the valorization of byproducts as a source of phenolic compounds used to fortify high-consumption foods or to formulate new functional foods [1].
Grape canes of V. vinifera L. produced during pruning are the main byproduct of viticulture, and millions of tons are generated worldwide every year [2,3]. With the aim of developing a circular economy by an integrated biorefinery strategy, grape canes are being investigated as a high-value resource due to their attractive chemical composition and potential industrial applications. These include SO2 substitution in wine to improve wine quality [4], usage as a cosmetic ingredient [5] and as a filler in food packaging [4,6], and for the recovery of hemicellulosic oligosaccharides, lignin, and cellulosic substrates [7]. Above all, however, grape canes have been studied for their nutraceutical applications, as they contain high-added-value phenolic compounds with wide-ranging biological properties.
Grape canes contain a complex mixture of phenolic compounds, including phenolic acids (hydroxybenzoic acid and hydroxycinnamic acids), flavonoids (mainly proanthocyanidins, flavonols, flavanonol and flavanones), and stilbenes (monomers, dimers, and oligomers). The most abundant phenolic compounds are proanthocyanidins and stilbene oligomers [8,9]. The phenolic composition of V. vinifera plants is genetically determined and strongly influenced by environmental conditions such as water stress [10]. Other determining factors, which particularly affect the stilbenes content, are the cultivar [11], the geographic region of cultivation [12], and the time, temperature, and humidity of storage after pruning [13]. Moreover, the yields of phenolic compounds such as resveratrol and ε-viniferin are highly dependent on variables of the extraction methods such as grape cane particle size, the type of solvent, temperature, duration, and the effects of light [14]. Furthermore, the phenolic profile of grape canes can also be altered by the extraction and scale-up process, where oxidation, degradation, or polymerization of proanthocyanidins have been observed, as well as the formation of phenolic aldehydes [2]. Phenolic compounds are known to be unstable and sensitive to high temperature, light, pH, and oxidative and degradative enzymes, which affects the phenolic profile of extracts. It is therefore important to find a strategy to protect phenolic compounds, and preserve their biological activities and properties. Enhancing their bioaccessibility and bioavailability and promoting their transport for absorption by the human body are also of great interest. Accordingly, new approaches, such as encapsulation with cyclodextrins, have been developed to overcome these drawbacks. [15].
Cyclodextrins are highly biocompatible and have been approved by the Food and Drug Administration (FDA) as safe for humans. Several research studies have described the complexation of phenolic compounds with cyclodextrins [15], which provides protection from environmental conditions and improves bioactive shelf-life. Cyclodextrins, which have a truncated cone-shaped structure, possess a hydrophobic interior and a hydrophilic outer surface. Complexation in cyclodextrins improves the water solubility of phenolic compounds, which is otherwise relatively poor. The stability of the complex is maintained via hydrophobic forces, van der Waals interactions and hydrogen bonding [15]. Therefore, encapsulation of the bioactive molecule by cyclodextrin alters the physicochemical properties of both agents. Nevertheless, the effect of cyclodextrins on the profile of phenolic compounds from grape canes after encapsulation needs further study.
In this context, we encapsulated a previously characterized grape cane pilot-plant extract [2] in HP-β-CD by a spray-drying technique, using maltodextrin (MD) as a coating material. The physicochemical properties and parameters of the encapsulation process were determined, and the complex formation was verified by scanning electron microscopy (SEM) and Fourier Transform Infrared Spectroscopy with diamond attenuated total reflectance (FTIR-ATR). In addition, the phenolic profile of the inclusion complex was investigated using LC-ESI-LTQ-Orbitrap-MS, and encapsulation efficiency and antioxidant capacity were determined. The microencapsulated extract is envisaged as a functional ingredient of food, cosmetics, biomaterials, and other biobased products.

2. Materials and Methods

2.1. Chemicals and Reagents

Gallic, 4-hydroxybenzoic, and ellagic acids, catechin, epicatechin, (E)-resveratrol, (E)-ε-viniferin, (E)-piceatannol, eriodictyol, taxifolin, quercetin, quercetin-3-O-glucoside, and quercetin-3-O-glucuronide were purchased from Sigma-Aldrich (St. Louis, MO, USA). Gallic acid and kaempferol-3-O-glucoside were acquired from Extrasynthèse (Genay, Auvergne-Rhône-Alpes, France). Isohopeaphenol and hopeaphenol were kindly given by the research group of Prof. Dr. Peter Winterhalter (Institute of Food Chemistry, Technical University Braunschweig, Lower Saxony, Germany). Light exposure was avoided when manipulating the standards.
HPLC-grade acetonitrile, formic acid, ethanol, and water were purchased from Merck (Darmstadt, Hesse, Germany). Ultrapure water was generated by a Milli-Q water purification system Millipore (Bedford, Massachusetts, USA). Potable ethanol (96%) from molasses employed for pilot-plant scale extraction was purchased from Oxiquim S.A. (Coronel, Concepción, Chile).
Hydroxypropyl beta-cyclodextrin (HP-β-CD, Kleptose®, HP oral grade) was purchased from Roquette Frères (Lestrem, Lillers, France). Maltodextrin (MD) (dextrose equivalent 16.5–19.5) was obtained from Merck KGaA, (Darmstadt, Hesse, Germany).

2.2. Pilot-Plant Scale Extraction

Grape cane extraction was performed on a pilot-plant scale (750 L) at 80 °C for 100 min, following our previously reported extraction process [2].
After winter pruning, we collected a total of 500 kg of wet sample grape canes (V. vinifera L. cv. Pinot noir) from plants in an organic vineyard at Viña De Neira, located in Ránquil, Itata Valley, Biobio Region, Chile. All samples were cut into 30–50 cm long pieces and stored for three months at room temperature (19 °C ± 5) and 30–70% relative humidity, according to previous reports by Riquelme et al. [16] and Patent [13]. We used 67 kg of dry grape canes from a total sample of 500 kg of wet samples for the pilot-plant extraction, before which grape canes were crushed in a Retsch grinder (model SM) at 300–2000 rpm until particle size was less than 1 cm. After extraction, the ethanol used as a solvent for the extraction was removed and recovered by distillation (absolute pressure 0.05 bar). The liquid extract was collected in a dark container and protected from light.

2.3. Preparation of Microcapsules by Spray-Drying

The GCPPE was in a mixed ethanol/water solution (30:70 v/v). HP-β-CD was used to prepare the microcapsules in a proportion of 2.2% w/v with the extract. MD in a proportion of 10% w/v was used as the coating material. HP-β-CD was slowly added to a beaker containing 200 mL of GCPPE to avoid its agglomeration. The mixture was continuously stirred at room temperature and protected from the light for 24 h, during which the encapsulation took place. Then, MD was added slowly, and the mixture was stirred for a few minutes [17]. The microencapsulated and unencapsulated GCPPE were dried using a Büchi Mini Spray Dryer B-290 (Büchi, Flawil, Switzerland). Inlet temperature was maintained at 130 °C, while the outlet air temperature was 71 °C. Air inlet and airflow were 35–40 m3/h and 473 L/h, respectively. The spray dryer was equipped with a nozzle tip diameter of 0.7 mm and a peristaltic pump operated at 6–7 mL/min. The dried powder was collected and stored in an amber airtight container at 4 °C until analysis.

2.4. Determination of the Physical Properties of the Microencapsulated Powders

2.4.1. Moisture Content and Total Solids

The moisture content of the samples was calculated from the weight loss after heating the sample to 105 °C for 6 h [18].

2.4.2. Process Yield (PY%)

The yield of the powder process was calculated considering the number of solids introduced into the spray drying system and the powder obtained at the end of the technological process [19]. The results were determined according to Equation (1):
PY   % = Powder   after   spray   dry Solids   introduced   in   the   feeding × 100

2.4.3. Bulk Density

To determine the bulk density, about 10 g of the spray-dried sample was weighed, placed in a 25 mL graduated test tube, and the occupied volume was recorded [18].

2.4.4. Angle of Repose

The angle of repose was determined using a fixed funnel by the following Equation (2) as in Dadi et al. [18]:
Angle   of   repose   ° = tan 1   H / R
where H is the height of the pile and R is its radius at the base.

2.4.5. Size Distribution

The particle size distribution was determined in a particle size analyzer by laser diffraction with a Mastersizer 3000 (Malvern Instruments, Worcestershire, UK). Samples were dispersed in MilliQ water (900 mL) under constant stirring (2300 RPM) using a Hydro EV dispersion unit to achieve a homogeneous suspension. The particle size distribution in the powder (span) was calculated using Equation (3):
S p a n = ( d 90   d 10 ) / d 50
where d90, d10, and d50 are the equivalent volume diameters at 90%, 10%, and 50% cumulative volume, respectively [20].

2.5. Scanning Electron Microscopy

The microcapsules and GCPPE were analyzed by scanning electron microscopy (SEM) using the JSM 6380 LV system (JEOL Techniques Ltd., Tokyo, Japan). The microscope was operated at 20 kV accelerating voltage. The samples were coated with a gold layer of about 150 Å in thickness, using an Edwards S 150 sputter coater (Agar Scientific, Standsted, UK) [21].

2.6. Fourier Transform Infrared Analysis

The FTIR absorption spectra of the individual samples of GCPPE, HP-β-CD, the inclusion complex (IC) (GCPPE+HP-β-CD+MD), and the physical mixture were analyzed separately. The physical mixture (PM) (GCPPE/HP-β-CD/MD) was prepared by accurately weighing HP-β-CD (100 mg), GCPPE (100 mg), and MD (20 mg), which were ground in a mortar until the mixture was homogeneous. The resulting physical mixture was immediately analyzed by FTIR-ATR.
The FTIR spectra were recorded using a Bruker Alpha T FTIR (Bruker, Germany) spectrophotometer equipped with a diamond attenuated total reflectance (ATR) unit. The 32 scans were acquired over a spectral range of 4000–500 cm−1 with a resolution of 4 cm−1 [22,23]. All spectra were acquired and processed using the OPUS 7.0 software.

2.7. LC-ESI-LTQ-Orbitrap-MS Analyses

Liquid chromatography (LC) analysis was conducted using an Accela chromatograph (Thermo Scientific, Hemel Hempstead, UK) equipped with a quaternary pump, photodiode array detector, and thermostated autosampler. Chromatographic separation was performed in an Atlantis T3 column 2.1 × 100 mm, 3µm (Waters, Milford, MA, USA). Gradient elution of analytes was performed utilizing H2O/0.1% HCOOH (solvent A) and CH3CN (solvent B) at a continuous flow rate of 0.350 mL/min, and an injection volume of 5 µL. The following gradient was applied: 0 min, 2% B; 0–2 min, 8% B; 2–12 min, 20% B; 12–13 min, 30% B; 13–14 min, 100% B; 14–17 min, 100% B; 17–18 min, 2% B and the column was equilibrated to the initial conditions for 5 min [24].
The LC equipment was coupled to an LTQ-Orbitrap Velos mass spectrometer (Thermo Scientific, Hemel Hempstead, UK) employed for accurate mass measurements and equipped with an electrospray ionization (ESI) source operating in negative mode. The working parameters were as follows: source voltage, 4 kV; sheath gas, 20 a.u. (arbitrary units); auxiliary gas, 10 a.u.; sweep gas, 2 a.u.; and capillary temperature, 275 °C. Default values were used for most of the other acquisition parameters (FT Automatic gain control target 5·105 for MS mode and 5·104 for MSn mode). Samples were analyzed in FTMS mode with a resolving power of 30,000 (FWHM at m/z 400) and data-dependent MS/MS events were acquired with a resolving power of 15,000. The most intense ions detected in the FTMS spectrum were chosen for the data-dependent scan. The parent ions were fragmented by high-energy C-trap dissociation by normalized collision energy of 35 V and an activation time of 10 ms. The mass range in FTMS mode was from m/z 100 to 1500. Instrument control and data recovery were conducted using Xcalibur 3.0 software (Thermo Fisher Scientific). The tentative identification of analytes was performed by comparing MS/MS spectra with fragments found in databases and the literature when no standard compound was available [25].
Individual compounds were semi-quantified using pure standards or the most similar compounds. Some analytes, such as glycosylated forms, dimers, or oligomers, were semi-quantified using the aglycone form of the monomer [2].

2.8. Encapsulation Efficiency

Encapsulation efficiency was calculated by considering the nonencapsulated compounds present in the GCPPE before the encapsulation process and the encapsulated compounds after the spray drying process. The identification and quantification of phenolic compounds from GCPPE were specified in a previous article [2] (see detail Supplementary Materials Table S1). Extraction of polyphenols from the microcapsules was performed according to the procedure of Robert et al. [26] with minor modifications. Before the analysis, samples were dissolved in highly pure deionized water containing 0.1% v/v formic acid (1 mg/mL). The GCPPE was centrifuged at 4000 rpm for 5 min at 4 °C. The supernatant was recovered, and the extraction procedure was repeated twice. The supernatants were combined and evaporated under nitrogen flow, and the residue was reconstituted in 0.1% aqueous formic acid (5 mL). The samples were filtered through 0.20 µm PTFE membrane filters (Waters Corporation, Milford, CT, USA) into an amber vial. Subsequently, both samples were analyzed using LC -ESI-LTQ-Orbitrap- MS to determine the individual degree of encapsulation according to the method described above (Section 2.7). We estimated the encapsulation efficiency (EE), according to Radünz et al. [27], based on Equation (4):
EE   % = Phenolic   compound   of   GCPPE     Phenolic   compound   of   the   capsule Phenolic   compound   of   GCPPE × 100

2.9. Antioxidant Capacity Assay

The assay of oxygen radical absorbance capacity using fluorescein (ORAC-FL) was carried out according to the method reported by Ou et al. [28]. The calibration curves were prepared with Trolox, and results reported as µmol Trolox equivalents (TE) by grams of dried weight (DW) (TE/g DW). All assays were performed in triplicate and protected from light.

2.10. Statistical Analysis

All samples were run at least three times, and results are expressed as means ± standard deviations. A p-value < 0.05 was considered statistically significant using Student’s t-test with 95% confidence. Statistical analyses were determined using GraphPad Prism 8.0.1 (GraphPad Software, San Diego, CA, USA).

3. Results and Discussion

3.1. Physical Characterization of the Microencapsulated Powder

Table 1 shows the physicochemical properties and process parameters for the GCPPE and inclusion complex (IC) (GCPPE+HP-β-CD+MD). The process yield obtained by spray-drying for IC (GCPPE+HP-β-CD+MD) was 83.8 ± 2.6%, which was two-fold higher than for GCPPE alone (38.4 ± 1.2%). Similarly, the total solids increased 2.6-fold for the microencapsulated formulation. The high yield of powdered microparticles can be attributed to the rapid formation of the drying crust, which prevents the powder from adhering to the drying chamber [29]. Our result constitutes an improvement on the yield (64.5 ± 1.5%) reported by Davidov-Pardo et al. [30], who microencapsulated a grape seed extract using MD. The high values obtained in our work are promising for the development of industrial-scale applications.
The particle size distribution and median particle diameter were smaller in the IC (GCPPE+HP-β-CD+MD) than in the GCPPE alone; the particle sizes were 10.9 μm and 17.5 μm, respectively. According to the literature, the diameter of spray-dried particles depends on the properties of the material, the drying conditions, the atomization method used, and the concentration and viscosity of the encapsulated material [31]. The span values of the IC (GCPPE+HP-β-CD+MD) and GCPPE were very similar, 6.14 and 6.15, respectively, and were higher than those reported for an aqueous grape skin extract microencapsulated with Arabic gum, polydextrose, and partially hydrolyzed guar gum, which ranged from 1.91 to 5.99 [32]. A lower span value is a desirable result, as it indicates a more homogeneous particle size distribution [32].
The bulk density was 0.10 ± 0.01 g/mL and 0.19 ± 0.01 g/mL for the GCPPE and IC (GCPPE+HP-β-CD+MD), respectively, being lower than the values reported for encapsulated rosemary essential oil (0.25–0.34 g/mL) [31] or soy milk (0.21–0.22 g/mL) [20]. The slightly higher bulk density of the IC (GCPPE+HP-β-CD+MD) vs. the GCPPE indicates an improved powder flow, as a more densely packed powder reflects weaker forces between the particles [20]. Density is an important factor for the packaging, transportation, and marketing of a microencapsulated product. A dry product with high density can be stored in a smaller container compared to a less dense product [31]. The flowability of the samples was also determined by the angle of repose, which was 34.8° ± 0.5 for the GCPPE and 36.9° ± 1.3 for the IC (GCPPE+HP-β-CD+MD), showing no statistical difference between them. A similar value was obtained in a study on the microencapsulation of bioactive products from a Moringa stenopetala leaf extract using MD, where the angle of repose was 37.26° ± 1.01 [18].

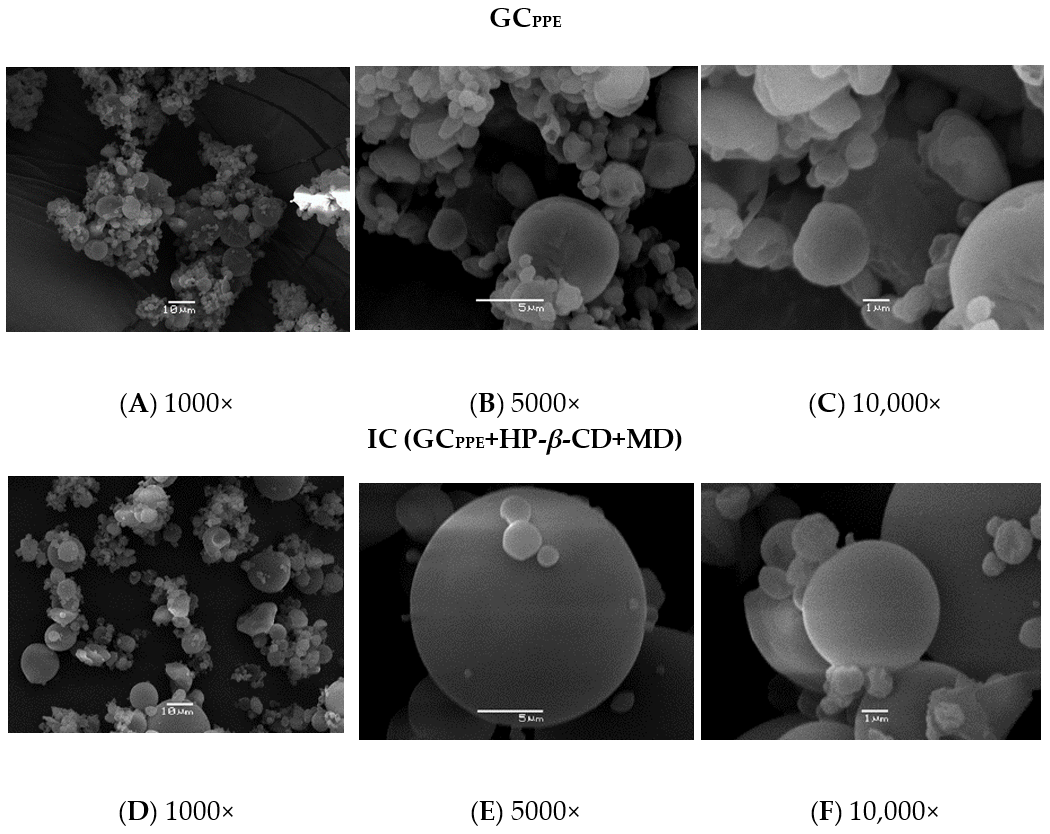
3.2. Surface Morphology: SEM Analysis

SEM can be used to determine the surface morphology of materials and is recognized as an auxiliary method for monitoring the formation of inclusion complexes. The structure and size of the GCPPE and IC (GCPPE+HP-β-CD+MD) in the solid state obtained from the spray-drying process were analyzed through microscopy. Microcapsules should preferably have a slightly spherical form and a uniform and smooth cover with minimum fractures and signs of collapse [33]. The SEM micrographs showed that the GCPPE was composed of a mixture of non-spherical particles with irregular surfaces and other larger spherical microparticles (Figure 1A–C). In contrast, the IC (GCPPE+HP-β-CD+MD) was spherical, and without visible pores on a smooth surface; microparticles of a variable size but with similar morphology were observed together (Figure 1D–F). These significant morphological changes are probably due to a loss of crystallinity of the guest molecule after its inclusion in the cyclodextrin [34]. The SEM results provided evidence for the formation of the IC (GCPPE+HP-β-CD+MD), which was subsequently supported by mass spectrometry and FTIR analysis.

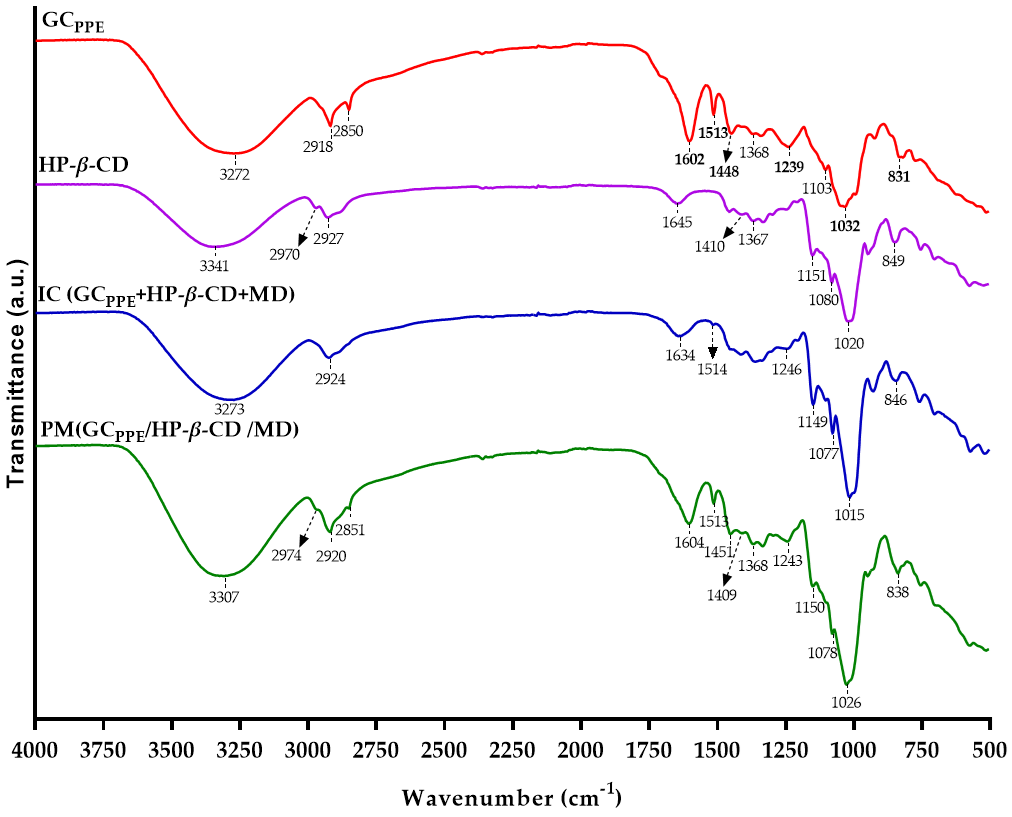
3.3. FTIR Analysis of Spray-Dried Powders

FTIR-ATR is a useful method to detect the formation of inclusion complexes, which are revealed by changes in the FTIR spectra, such as the reduction, disappearance, or shift of absorption bands, due to weak intermolecular interactions [35]. The FTIR spectra of the GCPPE, HP-β-CD, IC (GCPPE+HP-β-CD+MD), and physical mixture (PM) (GCPPE/HP-β-CD/MD) are shown in Figure 2.
The FTIR spectrum of the GCPPE (Figure 2, red) showed specific bands associated with phenolic compounds (in bold). The peaks at 1602 cm−1 and 1448 cm−1 were owing to the C=C stretching vibration of the phenolic aromatic ring and the C–H bending vibrations of the CH2 groups. The peak at 1239 cm−1 was assigned to C=O stretching of gallic or ellagic acid components due to the presence of hydrolyzable tannins [36]. The band at 1513 cm−1 was due to the C–C benzene skeletal vibrations of stilbenoids. The strong band at 1032 cm−1 is attributed to C–O stretching in phenolic compounds [22]. Moreover, the band at 831 cm−1 was due to the C-H out-of-plane bending vibrations of aromatic compounds. On the other hand, the signals at 2918 cm−1 and 2850 cm−1 were related to the CH2 asymmetric and symmetric stretch vibration in aliphatic hydrocarbons [37]. Additionally, a peak at 1103 cm−1 was observed owing to the C–H in-plane bending vibration [36].
The FTIR spectrum of HP-β-CD (Figure 2, purple) showed bands at 3341 cm−1 due to O–H stretching vibrations and 2927 cm−1 due to C–H stretching vibrations. The peaks at 1645 cm−1 correspond to the bending of H–O–H, at 1151 cm−1 to C–O vibration, and at 1020 cm1 to the C–O–C symmetric stretching vibration. The peak at 849 cm−1 was due to an α-type glycosidic bond [38]. The band at 1080 cm−1 was ascribed to C–C stretching vibrations, and the peak at 1410 cm−1 to C–C–H and O–C–H bending [39]. The presence of the hydroxypropyl group was recognized by a peak at 2970 cm−1 corresponding to the antisymmetric vibration of methyl groups. Additionally, a peak was observed at 1367 cm−1, which was ascribed to the bending vibration of the methyl group [40].
The spectrum of the IC (GCPPE+HP-β-CD+MD) (Figure 2, blue) shows that some of the characteristic peaks of the GCPPE and HP-β-CD have shifted, decreased, or disappeared. The bands at 1645 cm−1 and 1020 cm−1 of HP-β-CD have shifted to 1634 cm−1 and 1015 cm−1, respectively, in the IC. Two peaks of the GCPPE at 1239 cm−1 and 1513 cm−1, ascribed to the presence of hydrolysable tannins and stilbenes, respectively, have shifted to 1246 cm−1 and 1514 cm−1, showing a sharp reduction in intensity due to the complexation, whereas the peak at 2850 cm−1 disappeared. Furthermore, the bands of the GCPPE at 1602 cm−1 and 1448 cm−1, related to the phenolic aromatic ring, completely disappeared in the IC (GCPPE+HP-β-CD+MD). These findings may indicate that the phenolic rings became embedded in the HP-β-CD cavities.
The FTIR spectrum of the PM (Figure 2, green) showed a simple overlap between the individual components of GCPPE, HP-β-CD, and MD. Insignificant variations in intensity were detected, indicating a mixture of the three components without interactions between them.

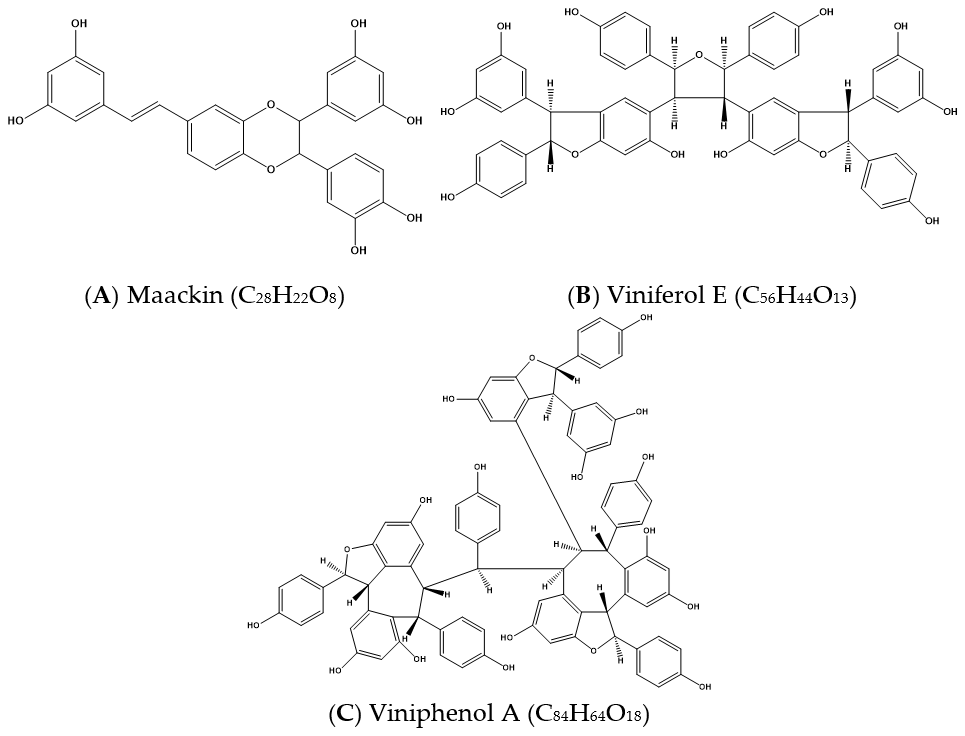
3.4. Phenolic Profile of the IC (GCPPE+HP-β-CD+MD) by LC-ESI-LTQ-Orbitrap-MS

We performed a targeted analysis of phenolic compounds in the IC (GCPPE+HP-β-CD+MD) using LC-ESI-LTQ-Orbitrap-MS. Table 2 shows 42 identified compounds with their accurate mass, theoretical mass, retention times (min), molecular formula, error (ppm) between the found mass and the accurate mass of each compound, and the MS/MS fragment ions with their respective intensities used for identification. The identification was further supported by comparisons with mass spectra databases and the literature. In addition, 13 phenolic compounds were identified by comparing the retention times and their masses with pure standards. We have reported the fragmentation patterns of most of these compounds in previous studies using an analytical [8] and pilot-scale extraction [2].
Of the 42 compounds identified in the present work, 22 had been previously detected in both the analytical and pilot-plant extractions [2,8]: gallic acid (m/z 169.0138, −2.41 ppm), monogalloyl-glucose (m/z 331.0662, −2.65 ppm), protocatechuic acid-O-hexoside (1) (m/z 315.0718, −1.07 ppm), protocatechuic acid (m/z 153.0190, −2.16 ppm), protocatechuic acid-O-hexoside (2) (m/z 315.0717, −1.30 ppm), syringic acid hexoside (m/z 359.0933, 2.21 ppm), catechin (m/z 289.0722, 1.43 ppm), epicatechin (m/z 289.0715, −1.00 ppm), restrytisol (A or B) (m/z 471.1441, −1.86 ppm), taxifolin (m/z 303.0508, −0.78 ppm), astilbin (m/z 449.1084, −1.12 ppm), stilbenoid heterodimer (caraphenol B/C) (m/z 469.1292, −0.06 ppm), eriodictyol-O-glucoside (m/z 449.1089, −0.04 ppm), stilbenoid dimer (m/z 469.1292, −0.07 ppm), pallidol (m/z 453.1349, 2.24 ppm), (E)-resveratrol (m/z 227.0715, 0.77 ppm), stilbenoid dimer (resveratrol dimer) (m/z 453.1351, 1.57 ppm), resvertarol-O-hexoside (m/z 615.1868, −0.62 ppm), eriodictyol (m/z 287.0558, −0.92 ppm), hopeaphenol (m/z 905.2607, −2.24 ppm), isohopeaphenol (m/z 905.2588, 2.15 ppm) and (E)-ε-viniferin (m/z 453.1348, 1.03 ppm). These findings indicate that these compounds are stable through each step of the production process, including microencapsulation.
On the other hand, seven compounds identified in the microencapsulated extract had previously been detected only in the analytical extraction [8]: procyanidin dimer (1) (m/z 577.1348, −0.69 ppm), procyanidin dimer (2) (m/z 577.1346, −0.35 ppm), epicatechin gallate (m/z 441.0821, −1.30 ppm), (E)-piceatannol (m/z 243.0665, 0.79 ppm), viniferin diglycoside (m/z 777.2397, −0.36 ppm), (E)-ω-viniferin (m/z 453.1346, 0.62 ppm), and stilbenoid tetramer (vitisin A/B/C/D) (m/z 905.2599, −3.05 ppm). Thus, although these compounds were not detected in the pilot-scale extraction, they were recovered after the microencapsulation process. Similar to our results, the incorporation of β-CD enabled an effective and selective recovery of flavan-3-ols [41] and stilbenes [42], resulting in a cleaner analytical extract phenolic profile. Additionally, three compounds previously detected in the pilot-scale extraction [2]: protocatechuic aldehyde (m/z 137.0241, −2.02 ppm), kaempferol-3-O-glucoside (m/z 447.0931, −0.49 ppm), and ethyl protocatechuate (m/z 181.0504, −1.02 ppm), were also recovered and identified in the microencapsulated extract.
Finally, ten compounds were identified only in the IC (GCPPE+HP-β-CD+MD), and not in the analytical or pilot extracts: five flavonoids, three stilbenes, an adduct of β-CD, and a complex of β-CD with (epi)catechin.
Flavonoids. The taxifolin isomer (m/z 303.0503, −2.32 ppm) showed ions at m/z 285.0390, owing to the initial loss of a water molecule and ions at m/z 177.0184 and 125.0237 due to cleavage of the C ring, respectively. Quercetin (m/z 301.0354, 0.06 ppm) was identified and confirmed by comparison with a pure standard. Myricetin (m/z 317.0301, −0.63 ppm), tentatively identified by its fragmentation pattern, produced ions at m/z 178.9981 (1,2A) and 151.0032 (1,3A) due to retro-Diels–Alder fragmentation [43], and at m/z 192.0058 due to the loss of the B ring. Although they were not identified in our previous studies, these compounds have been recovered, detected, and quantified by other authors using microwave-assisted, subcritical water, and conventional extraction techniques [44].
Dihydrokaempferol-O-rhamnoside (engeletin) (m/z 433.1139, −0.38 ppm), a compound previously reported in grape stems [45], was tentatively identified and showed fragment ions at m/z 269.0446, 287.0550, and 259.0603. An undefined tetrahydroxyisoflavanone (m/z 287.0561, −0.18 ppm) gave product ions at m/z 259.0602, 243.0652, and 201.0547, and was provisionally identified as 2,6,7,4′-tetrahydroxyisoflavanone, based on the exact mass and fragmentation pattern. However, as dihydrokaempferol and eriodictyol chalcone have similar structures, the identity of this compound could not be accurately defined using our spectrometric approach.
Stilbenes. A stilbenoid dimer (maackin, Figure 3A) (m/z 485.1242, 0.01 ppm) showed product ions at m/z 467.1125, 375.0865, and 363.0863, which were generated by the loss of a water molecule (18 Da), resorcinol (110 Da), and 2-hydroxy-4-methylenecyclohexa-2,5-dienone (122 Da), respectively [46]. This compound has a structure consisting of two piceatannol units, and the most likely assignment is maackin A, which was identified previously in V. vinifera stalks [47].
A stilbenoid tetramer (Figure 3B) (m/z 923.2680, 0.68 ppm) was tentatively identified as viniferol E and yielded product ions at m/z 905.2576, 881.2573, 801.2318, 783.2209 and 707.1898. The product ions at m/z 905.2576 and 881.2573 were due to a loss of H2O (18 Da) and C2H2O (42 Da), respectively, and at m/z 801.2318 probably to the loss of the group C7H6O2 (122 Da). The ion at m/z 801.2318 was further fragmented to ions at m/z 783.2209 and m/z 707.1898 by the loss of a water molecule (18 Da) and a phenol group (94 Da), respectively. Viniferol E was previously detected and quantified from grapevine canes by subcritical water extraction [48].
A stilbenoid hexamer, viniphenol A (Figure 3C) (m/z 679.1969 [M − 2H]2−, −1.12 ppm), was detected as a doubly charged ion with product ions at m/z 905.2584, 585.1543, 491.1126, 453.1333 and 359.0914. The product ion at m/z 905.2584 shows the presence of a stilbenoid tetramer molecule, probably formed by the loss of a stilbenoid dimer (454 Da) from the deprotonated hexamer. The high-intensity product ion at m/z 585.1543 could be attributed to the loss of a phenol group (94 Da) from the stilbenoid trimer (m/z 679). The product ion at m/z 585.1543 underwent fragmentation to ions at m/z 491.1126 and m/z 359.0914, which could be attributed to the loss of a phenol group (94 Da) and a stilbenoid dimer (226 Da), respectively. Finally, a low intensity stilbenoid dimer fragment was observed at m/z 453.1333. Viniphenol A was previously isolated from V. vinifera stalks by centrifugal partition chromatography, while its structure was proposed based on the analysis of spectroscopic data and molecular modeling under NMR conditions [47].
According to the supplier, the HP-β-CD used for encapsulation has a maximum β-CD impurity of 1.5%. The presence of [β-CD+ HCOO] (m/z 1179.3679, −0.04 ppm) and a complex of (epi)catechin with β-CD [β-CD +(epi)catechin] (m/z 1423.5708, −0.71 ppm) were detected and identified by comparison with the mass spectra reported by Żyżelewicz et al. [49]. The detection of this complex by mass spectrometry confirmed the interaction between polyphenols and cyclodextrins, in agreement with the SEM and FTIR analysis.

3.5. Encapsulation Efficiency

GCPPE is a complex mixture of various compounds that have different physical and chemical properties and abilities to form interactions and bind within the HP-β-CD cavity. As shown earlier, the phenolic compounds in the microencapsulated extract are phenolic acids and derivatives, flavonoids, and stilbenes. The individual EE (%) for twenty of these compounds was calculated and presented in Table 3. The other compounds were identified but not quantified due to their low amounts (see detail Supplementary Materials Table S1).
The average EE for all the analyzed compounds was 80.5 ± 1.1%. Several authors have studied the encapsulation of phenolic compounds from wine byproducts using different encapsulation materials. Davidov-Pardo et al. [30] reported a similar polyphenol EE of 82% for a commercial grape seed extract microencapsulated by spray drying using MD as the wall material. Moschona and Liakopoulou-Kyriakides [50] found a low EE of 55% to 79% for grape marc and lees phenolic extracts from white and red wine encapsulated with alginate and chitosan. Lavelli and Sri Harsha [51] also reported a low EE of 68% in a study where alginate hydrogel was used as an agent to encapsulate phenolic compounds from grape skin. Another study using grape skin extracts, encapsulated in water-in-oil-in-water (W/O/W) double emulsions, observed an improved EE of 87.74 ± 3.12% for anthocyanins [52]. The EE depends on a variety of factors, such as the technique used, the solubility and size of the guest molecule relative to the cavity of the host, the concentrations of the host and guest molecules, the binding constant within the guest and host, etc. [53]. As we did not find a similar study in the literature that employed the same raw material, encapsulant, and analytical methods to determine the concentration of guest molecules, we also analyzed the individual encapsulation of twenty compounds present in the IC (GCPPE+HP-β-CD+MD).
The average EE for the phenolic acids and derivatives was 81.5 ± 0.7%, the lowest value being obtained for protocatechuic acid-O-hexoside 1 (54.3 ± 2.4%) and the highest for hydroxybenzaldehyde (95.8 ± 0.6%). The EE for protocatechuic acid was 66.8 ± 9.8%, higher than the value reported by Taofiq et al. [54], who determined an EE of 50.3% for protocatechuic acid encapsulated by the atomization/coagulation technique, using sodium alginate in combination with calcium chloride (CaCl2) to promote alginate gelation. The EE for hydroxybenzaldehyde obtained here is higher than the value (46.50%) reported for p-hydroxybenzaldehyde in a β-CD inclusion complex [55].
The EE for gallic acid, 83.4 ± 0.6%, was slightly higher than the value reported by da Rosa et al. [56], who determined an EE of 80.0 ± 1.4% for microencapsulated gallic acid using β-CD and the lyophilization method. However, Olga et al. [53] obtained a higher EE of 89.22% in a complex with HP-β-CD, a result that was reduced to 77.34% when the gallic acid was co-encapsulated with trans-ferulic acid. The authors suggested a possible antagonistic relationship between the two phenols in the HP-β-CD cavity.
The EE of 87.6 ± 0.5% observed for ellagic acid pentoside was considerably higher than the 55.2% reported for ellagic acid (aglycone) encapsulated with polyvinyl alcohol [57]. The EE for caftaric acid—a hydroxycinnamic acid—was very high (87.1 ± 2.2%) in comparison with the values reported for other hydroxycinnamic acids, such as the essential oil-encapsulated chitosan-ρ-coumaric acid (42 ± 1%) [58] and chlorogenic acid (77.5%) in β-CD nanosponges [59], respectively. Finally, to our knowledge, this is the first time that the EE for ethyl protocatechuate (69.7 ± 5.5%) and protocatechuic aldehyde (75.6 ± 4.2%) has been reported.
The average EE for flavonoids was 85.2 ± 2.4%. The values for astilbin isomer (2) and astilbin (1) were particularly high, 92.0 ± 1.1% and 82.7 ± 2.3%, respectively. Zheng and Zhang [60] reported a lower EE of 80.1% for astilbin encapsulated with zein−caseinate nanoparticles by the antisolvent method.
Quercetin-3-O-glucuronide (88.0 ± 3.1%) and quercetin-O-glucoside (81.8 ± 7.0) also had high EE values. Tchabo et al. [61] obtained a lower EE (63.90–66.45%) for quercetin- 3-O-glucoside in a spray-dried mulberry leaf extract prepared with MD, yet the EE was higher (91.71–93.95%) when sodium carboxymethyl cellulose was used. To the best of our knowledge, no EE values have been previously reported for quercetin-3-O-glucuronide.
The EE for eriodictyol was 74.2 ± 4.7%, similar to the almost 70% reported for naringenin (another flavanone) in polymer PLGA nanoparticles prepared by an emulsion-diffusion-evaporation method [62].
The stilbene group had the lowest mean EE (78.6 ± 1.9%), mainly because of the low value obtained for (E)-resveratrol (32.7 ± 2.8%). Nevertheless, previous studies have shown that the cyclodextrin encapsulation of resveratrol increases its solubility, stability, and bioactivity (antioxidant and anticarcinogenic properties) [15]. Furthermore, the HP-β-CD complex exhibits a strong H-bonding interaction with molecules such as oxyresveratrol [63]. In our study, we found a high EE (97.0 ± 0.6%) for restrytisol (A or B), an oxidized resveratrol dimer, which may be related to the van der Waals force interaction and hydrogen bonding between the guest compound and the HP-β-CD.
A good EE was obtained for stilbene dimers such as pallidol (74.6 ± 3.8%), (E)-ε-viniferin (76.8 ± 3.5%), and an undefined resveratrol dimer (94.1 ± 2.1%). Previously, ε-viniferin, a resveratrol dimer, was encapsulated in phospholipid-based multi-lamellar liposomes called spherulites or onions. This formulation gave a lower EE (58 ± 3%) than in our study, but increased the water solubility of this stilbene more than five-fold and provided protection against its UV-induced isomerization [64]. Finally, the low EE (65.8 ± 8.6%) obtained for the stilbenoid tetramer is probably due to its large size and polar surface area.

3.6. Antioxidant Capacity

Several authors suggest that the antioxidant capacity of phenolic compounds is improved by encapsulation in cyclodextrins [15]. The ORAC value has been applied to standardize the antioxidant activity of herbal extracts and foods, and is widely used as an accurate indicator of antioxidant activity in vivo [65].
The antioxidant capacity of the IC (GCPPE+HP-β-CD+MD) by ORAC-FL was 5300 ± 472 µmol TE/g DW, similar to the 4612 ± 155 µmol TE/g DW reported in our previous GCPPE study [2]. The GCPPE microencapsulated with HP-β-CD retains its antioxidant capacity and its formulation may improve stability, solubility, and bioavailability for applications in the food, cosmetic and pharmaceutical industries.

4. Conclusions

Phenolic compounds from a grape cane pilot-plant extract were successfully encapsulated in an inclusion complex (GCPPE+HP-β-CD+MD). The microencapsulated extract was rich in stilbenes, especially oligomers, flavonoids, and phenolic acids. A complex of (epi)catechin and β-CD was detected by mass spectrometry, which confirmed the interaction between polyphenols and cyclodextrin. The formation of the inclusion complex was also supported by FTIR-ATR and SEM analyses. HP-β-CD provided a high EE for phenolic compounds, with a mean of 80.5 ± 1.1%, the highest values being obtained for restrytisol (97.0 ± 0.6%), stilbenoid heterodimer (1) (96.8 ± 0.4%) and hydroxybenzaldehyde (95.8 ± 0.6%), and the lowest for (E)-resveratrol (32.7 ± 2.8%). The antioxidant capacity of the inclusion complex was similar to the unencapsulated extract. Considering the protection afforded the phenolic compounds by the inclusion complex, it is expected that the formulation may improve their stability, solubility, and bioavailability in water-soluble applications for the food and pharmaceutical industries.

5. Patents

The preparation of grape canes before extraction in the pilot plant followed the procedure described in the Patent [13]. The formulation of the microparticles of phenolic compounds from the extract of grape canes of V. vinifera and the application of HP-β-CD to form the IC and the use of MD as a coating agent are described in the Patent [17].

Supplementary Materials

The following are available online at https://www.mdpi.com/article/10.3390/antiox10071130/s1, Table S1: Identification and quantification of phenolic compounds from GCPPE using LC-ESI-LTQ-Orbitrap-MS in negative mode.

Author Contributions

Conceptualization, D.E.-A., C.G.-G., C.M., J.L., D.v.B. and A.V.-Q.; methodology, D.E.-A., J.A.-G., J.S., J.L.-C., C.G.-G., J. L and A.V.-Q.; validation, A.V.-Q. and C.G.-G.; formal analysis, D.E.-A., J.A.-G., J.L.-C. and J.S.; investigation, D.E.-A., J.A.-G. and J.S.; resources, A.V.-Q., C.G.-G., R.M.L.-R., C.M., J.L. and D.v.B.; data curation, D.E.-A., J.A.-G. and J.S.; writing—original draft preparation, D.E.-A.; writing—review and editing, D.E.-A., A.V.-Q., C.G.-G., C.M., J.A.-G., D.v.B., R.M.L.-R. and J.S.; visualization, D.E.-A.; supervision, A.V.-Q., C.G.-G., R.M.L.-R. and C.M.; project administration, D.E.-A., A.V.-Q., C.G.-G., C.M. and R.M.L.-R.; funding acquisition, D.E.-A., C.M., A.V.-Q. and R.M.L.-R. All authors have read and agreed to the published version of the manuscript.

Funding

This research was supported by the Agencia Nacional de Investigación y Desarrollo (ANID)/PCI-REDES170051; ANID PIA/APOYO CCTE AFB170007; CORFO 14 IDL2- 30156, from Chile; CICYT [AGL2016-75329-R], CIBEROBN from the Instituto de Salud Carlos III, ISCIII from the Ministerio de Ciencia, Innovación y Universidades, (AEI/FEDER, UE) and Generalitat de Catalunya (GC) [2017SGR 196]. Danilo Escobar-Avello is grateful to ANID/Scholarship Program/DOCTORADO BECAS CHILE/2017—72180476. Javier Avendaño-Godoy is grateful to ANID/Scholarship Program/DOCTORADO NACIONAL/2020-21202096. Anna Vallverdú-Queralt thanks to the Ministry of Science, Innovation and Universities for the Ramon y Cajal contract (RYC-2016-19355).

Institutional Review Board Statement

Not applicable.

Informed Consent Statement

Not applicable.

Data Availability Statement

Data is contained within the article and Supplementary Materials.

Acknowledgments

The authors would like to thank the CCiT-UB for the mass spectrometry equipment and to Yamil Neira from Viña de Neira, who provided the grape cane samples.

Conflicts of Interest

Rosa M. Lamuela-Raventós reports receiving lecture fees from Cerveceros de España and Wine in moderation. She also received lecture fees and travel support from Adventia. The other authors declare no conflicts of interest. The funders had no role in the design of the study; in the collection, analyses, or interpretation of data; in the writing of the manuscript, or in the decision to publish the results.

References

  1. Melini, V.; Melini, F.; Luziatelli, F.; Ruzzi, M. Functional ingredients from agri-food waste: Effect of inclusion thereof on phenolic compound content and bioaccessibility in bakery products. Antioxidants 2020, 9, 1216. [Google Scholar] [CrossRef]
  2. Escobar-Avello, D.; Mardones, C.; Saéz, V.; Riquelme, S.; von Baer, D.; Lamuela-Raventós, R.M.; Vallverdú-Queralt, A. Pilot-plant scale extraction of phenolic compounds from grape canes: Comprehensive characterization by LC-ESI-LTQ-Orbitrap-MS. Food Res. Int. 2021, 143, 110265. [Google Scholar] [CrossRef] [PubMed]
  3. Sun, X.; Wei, X.; Zhang, J.; Ge, Q.; Liang, Y.; Ju, Y.; Zhang, A.; Ma, T.; Fang, Y. Biomass estimation and physicochemical characterization of winter vine prunings in the Chinese and global grape and wine industries. Waste Manag. 2020, 104, 119–129. [Google Scholar] [CrossRef]
  4. Troilo, M.; Difonzo, G.; Paradiso, V.M.; Summo, C.; Caponio, F. Bioactive Compounds from Vine Shoots, Grape Stalks, and Wine Lees: Their Potential Use in Agro-Food Chains. Foods 2021, 10, 342. [Google Scholar] [CrossRef] [PubMed]
  5. Malinowska, M.A.; Billet, K.; Drouet, S.; Munsch, T.; Unlubayir, M.; Tungmunnithum, D.; Giglioli-Guivarc’H, N.; Hano, C.; Lanoue, A. Grape cane extracts as multifunctional rejuvenating cosmetic ingredient: Evaluation of sirtuin activity, tyrosinase inhibition and bioavailability potential. Molecules 2020, 25, 2203. [Google Scholar] [CrossRef]
  6. Díaz-Galindo, E.P.; Nesic, A.; Cabrera-Barjas, G.; Mardones, C.; Von Baer, D.; Bautista-Baños, S.; Garcia, O.D. Physical-chemical evaluation of active food packaging material based on thermoplastic starch loaded with grape cane extract. Molecules 2020, 25, 1306. [Google Scholar] [CrossRef] [Green Version]
  7. Dávila, I.; Gullón, P.; Andrés, M.A.; Labidi, J. Coproduction of lignin and glucose from vine shoots by eco-friendly strategies: Toward the development of an integrated biorefinery. Bioresour. Technol. 2017, 244, 328–337. [Google Scholar] [CrossRef]
  8. Escobar-Avello, D.; Lozano-Castellón, J.; Mardones, C.; Pérez, A.J.; Saéz, V.; Riquelme, S.; Von Baer, D.; Vallverdú-Queralt, A. Phenolic profile of grape canes: Novel compounds identified by LC-ESI-LTQ-orbitrap-MS. Molecules 2019, 24, 3763. [Google Scholar] [CrossRef] [Green Version]
  9. Sáez, V.; Pastene, E.; Vergara, C.; Mardones, C.; Hermosín-gutiérrez, I.; Gómez-Alonso, S.; Gómez, M.V.; Theoduloz, C.; Riquelme, S.; Baer, D. Von Oligostilbenoids in Vitis vinifera L. Pinot Noir grape cane extract: Isolation, characterization, in vitro antioxidant capacity and anti-proliferative effect on cancer cells. Food Chem. 2018, 265, 101–110. [Google Scholar] [CrossRef] [PubMed]
  10. Pinasseau, L.; Vallverdú-Queralt, A.; Verbaere, A.; Roques, M.; Meudec, E.; Le Cunff, L.; Péros, J.-P.; Ageorges, A.; Sommerer, N.; Boulet, J.-C.; et al. Cultivar diversity of grape skin polyphenol composition and changes in response to drought investigated by LC-MS based metabolomics. Front. Plant Sci. 2017, 8. [Google Scholar] [CrossRef] [Green Version]
  11. Lambert, C.; Richard, T.; Renouf, E.; Bisson, J.; Waffo-Téguo, P.; Bordenave, L.; Ollat, N.; Mérillon, J.M.; Cluzet, S. Comparative analyses of stilbenoids in canes of major Vitis vinifera L. cultivars. J. Agric. Food Chem. 2013, 61, 11392–11399. [Google Scholar] [CrossRef]
  12. Vergara, C.; Von Baer, D.; Mardones, C.; Wilkens, A.; Wernekinck, K.; Damm, A.; Macke, S.; Gorena, T.; Winterhalter, P. Stilbene levels in grape cane of different cultivars in southern Chile: Determination by HPLC-DAD-MS/MS method. J. Agric. Food Chem. 2012, 60, 929–933. [Google Scholar] [CrossRef] [PubMed]
  13. Mardones, C.; Von Baer, D.; Vergara, C.; Escobar-Avello, D.; Fuentealba, C.; Riquelme, S. Un procedimiento para aumentar el contenido de estilbenos, esencialmente resveratrol, en sarmientos provenientes de las podas de Vitis vinífera. 2014. CL2014003417A1. Available online: https://patentscope.wipo.int/search/es/detail.jsf?docId=CL174158667 (accessed on 13 July 2021).
  14. Zwingelstein, M.; Draye, M.; Besombes, J.L.; Piot, C.; Chatel, G. Trans-Resveratrol and trans-ϵ-Viniferin in Grape Canes and Stocks Originating from Savoie Mont Blanc Vineyard Region: Pre-extraction Parameters for Improved Recovery. ACS Sustain. Chem. Eng. 2019, 7, 8310–8316. [Google Scholar] [CrossRef]
  15. Pinho, E.; Grootveld, M.; Soares, G.; Henriques, M. Cyclodextrins as encapsulation agents for plant bioactive compounds. Carbohydr. Polym. 2014, 101, 121–135. [Google Scholar] [CrossRef] [Green Version]
  16. Riquelme, S.; Sáez, V.; Escobar, D.; Vergara, C.; Fuentealba, C.; Bustamante, L.; von Baer, D.; Jara, P.; Lamperti, L.; Mardones, C. Bench-scale extraction of stilbenoids and other phenolics from stored grape canes (Vitis vinifera): Optimization process, chemical characterization, and potential protection against oxidative damage. J. Chil. Chem. Soc. 2019, 64, 4414–4420. [Google Scholar] [CrossRef]
  17. Mardones, C.; Escobar-Avello, D.; Luengo-Contreras, J.; Avendaño-Godoy, J.; Ortega-Medina, E. Formulación de micropartículas de extracto de sarmientos de Vitis vinífera útil en las industrias nutracéutica y cosmética, además de su proceso de elaboración y sus usos. 2017. CL2017002902A1. Available online: https://patentscope.wipo.int/search/es/detail.jsf?docId=CL250856147 (accessed on 13 July 2021).
  18. Dadi, D.W.; Emire, S.A.; Hagos, A.D.; Eun, J.B. Physical and Functional Properties, Digestibility, and Storage Stability of Spray- and Freeze-Dried Microencapsulated Bioactive Products from Moringa stenopetala Leaves Extract. Ind. Crops Prod. 2020, 156, 112891. [Google Scholar] [CrossRef]
  19. Leyva-Jiménez, F.J.; Lozano-Sánchez, J.; de la Luz Cádiz-Gurrea, M.; Fernández-Ochoa, Á.; Arráez-Román, D.; Segura-Carretero, A. Spray-drying microencapsulation of bioactive compounds from lemon verbena green extract. Foods 2020, 9, 1547. [Google Scholar] [CrossRef] [PubMed]
  20. Jinapong, N.; Suphantharika, M.; Jamnong, P. Production of instant soymilk powders by ultrafiltration, spray drying and fluidized bed agglomeration. J. Food Eng. 2008, 84, 194–205. [Google Scholar] [CrossRef]
  21. Gómez-Gaete, C.; Retamal, M.; Chávez, C.; Bustos, P.; Godoy, R.; Torres-Vergara, P. Development, characterization and in vitro evaluation of biodegradable rhein-loaded microparticles for treatment of osteoarthritis. Eur. J. Pharm. Sci. 2017, 96, 390–397. [Google Scholar] [CrossRef]
  22. García, D.E.; Delgado, N.; Aranda, F.L.; Toledo, M.A.; Cabrera-Barjas, G.; Sintjago, E.M.; Escobar-Avello, D.; Paczkowski, S. Synthesis of maleilated polyflavonoids and lignin as functional bio-based building-blocks. Ind. Crops Prod. 2018, 123, 154–163. [Google Scholar] [CrossRef]
  23. Santos, J.; Delgado, N.; Fuentes, J.; Fuentealba, C.; Vega-Lara, J.; García, D.E. Exterior grade plywood adhesives based on pine bark polyphenols and hexamine. Ind. Crops Prod. 2018, 122, 340–348. [Google Scholar] [CrossRef]
  24. Escobar-Avello, D.; Olmo-Cunillera, A.; Lozano-Castellón, J.; Marhuenda-Muñoz, M.; Vallverdú-Queralt, A. A Targeted Approach by High Resolution Mass Spectrometry to Reveal New Compounds in Raisins. Molecules 2020, 25, 1281. [Google Scholar] [CrossRef] [Green Version]
  25. Sasot, G.; Martínez-Huélamo, M.; Vallverdú-Queralt, A.; Mercader-Martí, M.; Estruch, R.; Lamuela-Raventós, R.M. Identification of phenolic metabolites in human urine after the intake of a functional food made from grape extract by a high resolution LTQ-Orbitrap-MS approach. Food Res. Int. 2017, 100, 435–444. [Google Scholar] [CrossRef]
  26. Robert, P.; Gorena, T.; Romero, N.; Sepulveda, E.; Chavez, J.; Saenz, C. Encapsulation of polyphenols and anthocyanins from pomegranate (Punica granatum) by spray drying. Int. J. Food Sci. Technol. 2010, 45, 1386–1394. [Google Scholar] [CrossRef]
  27. Radünz, M.; Hackbart, H.C.D.S.; Bona, N.P.; Pedra, N.S.; Hoffmann, J.F.; Stefanello, F.M.; Da Rosa Zavareze, E. Glucosinolates and phenolic compounds rich broccoli extract: Encapsulation by electrospraying and antitumor activity against glial tumor cells. Colloids Surf. B Biointerfaces 2020, 192. [Google Scholar] [CrossRef]
  28. Ou, B.; Chang, T.; Huang, D.; Prior, R.L. Determination of total antioxidant capacity by oxygen radical absorbance capacity (ORAC) using fluorescein as the fluorescence probe: First action 2012.23. J. AOAC Int. 2013, 96, 1372–1376. [Google Scholar] [CrossRef] [PubMed]
  29. Urzúa, C.; González, E.; Dueik, V.; Bouchon, P.; Giménez, B.; Robert, P. Olive leaves extract encapsulated by spray-drying in vacuum fried starch–gluten doughs. Food Bioprod. Process. 2017, 106, 171–180. [Google Scholar] [CrossRef]
  30. Davidov-Pardo, G.; Arozarena, I.; Marín-Arroyo, M.R. Optimization of a Wall Material Formulation to Microencapsulate a Grape Seed Extract Using a Mixture Design of Experiments. Food Bioprocess Technol. 2013, 941–951. [Google Scholar] [CrossRef]
  31. Fernandes, R.V.D.B.; Borges, S.V.; Botrel, D.A. Gum arabic/starch/maltodextrin/inulin as wall materials on the microencapsulation of rosemary essential oil. Carbohydr. Polym. 2014, 101, 524–532. [Google Scholar] [CrossRef] [PubMed]
  32. Siede Kuck, L.; Pelayo Zapata Noreña, C. Microencapsulation of grape (Vitis labrusca var. Bordo) skin phenolic extract using gum Arabic, polydextrose, and partially hydrolyzed guar gum as encapsulating agents. Food Chem. 2015. [Google Scholar] [CrossRef] [Green Version]
  33. Tolun, A.; Altintas, Z.; Artik, N. Microencapsulation of grape polyphenols using maltodextrin and gum arabic as two alternative coating materials: Development and characterization. J. Biotechnol. 2016, 239, 23–33. [Google Scholar] [CrossRef]
  34. Li, W.; Ran, L.; Liu, F.; Hou, R.; Zhao, W.; Li, Y.; Wang, C.; Dong, J. Preparation and Characterisation of Polyphenol-HP-β-Cyclodextrin Inclusion Complex that Protects Lamb Tripe Protein against Oxidation. Molecules 2019, 24, 4487. [Google Scholar] [CrossRef] [PubMed] [Green Version]
  35. Franco, P.; De Marco, I. Preparation of non-steroidal anti-inflammatory drug/β-cyclodextrin inclusion complexes by supercritical antisolvent process. J. CO2 Util. 2021, 44. [Google Scholar] [CrossRef]
  36. Grasel, F.D.S.; Ferrão, M.F.; Wolf, C.R. Development of methodology for identification the nature of the polyphenolic extracts by FTIR associated with multivariate analysis. Spectrochimica Acta Part A Mol. Biomol. Spectrosc. 2016, 153, 94–101. [Google Scholar] [CrossRef]
  37. Santos, J.; Pereira, J.; Ferreira, N.; Paiva, N.; Ferra, J.; Magalhães, F.D.; Martins, J.M.; Dulyanska, Y.; Carvalho, L.H. Valorisation of non-timber by-products from maritime pine (Pinus pinaster, Ait) for particleboard production. Ind. Crop. Prod. 2021, 168, 113581. [Google Scholar] [CrossRef]
  38. Rodríguez-López, M.I.; Mercader-Ros, M.T.; López-Miranda, S.; Pellicer, J.A.; Pérez-Garrido, A.; Pérez-Sánchez, H.; Núñez-Delicado, E.; Gabaldón, J.A. Thorough characterization and stability of HP-β-cyclodextrin thymol inclusion complexes prepared by microwave technology: A required approach to a successful application in food industry. J. Sci. Food Agric. 2019, 99, 1322–1333. [Google Scholar] [CrossRef] [PubMed]
  39. Reddy, C.K.; Jung, E.S.; Son, S.Y.; Lee, C.H. Inclusion complexation of catechins-rich green tea extract by β-cyclodextrin: Preparation, physicochemical, thermal, and antioxidant properties. LWT 2020, 131, 109723. [Google Scholar] [CrossRef]
  40. Yuan, C.; Liu, B.; Liu, H. Characterization of hydroxypropyl-β-cyclodextrins with different substitution patterns via FTIR, GC-MS, and TG-DTA. Carbohydr. Polym. 2015, 118, 36–40. [Google Scholar] [CrossRef]
  41. Ratnasooriya, C.C.; Rupasinghe, H.P.V. Extraction of phenolic compounds from grapes and their pomace using b -cyclodextrin. Food Chem. 2012, 134, 625–631. [Google Scholar] [CrossRef]
  42. Chemat, F.; Vian, M.A.; Cravotto, G. Green extraction of natural products: Concept and principles. Int. J. Mol. Sci. 2012, 13, 8615–8627. [Google Scholar] [CrossRef] [Green Version]
  43. Lin, Y.; Wu, B.; Li, Z.; Hong, T.; Chen, M.; Tan, Y.; Jiang, J.; Huang, C. Metabolite identification of myricetin in rats using HPLC coupled with ESI-MS. Chromatographia 2012, 75, 655–660. [Google Scholar] [CrossRef]
  44. Moreira, M.M.; Barroso, M.F.; Porto, J.V.; Ramalhosa, M.J.; Švarc-Gajić, J.; Estevinho, L.; Morais, S.; Delerue-Matos, C. Potential of Portuguese vine shoot wastes as natural resources of bioactive compounds. Sci. Total Environ. 2018, 634, 831–842. [Google Scholar] [CrossRef] [PubMed] [Green Version]
  45. Goufo, P.; Singh, R.K.; Cortez, I. A reference list of phenolic compounds (Including stilbenes) in grapevine (Vitis vinifera L.) roots, woods, canes, stems, and leaves. Antioxidants 2020, 9, 398. [Google Scholar] [CrossRef]
  46. Moss, R.; Mao, Q.; Taylor, D.; Saucier, C. Investigation of monomeric and oligomeric wine stilbenoids in red wines by ultra-high-performance liquid chromatography/electrospray ionization quadrupole time-of-flight mass spectrometry. Rapid Commun. Mass Spectrom. 2013, 27, 1815–1827. [Google Scholar] [CrossRef]
  47. Papastamoulis, Y.; Richard, T.; Nassra, M.; Badoc, A.; Krisa, S.; Harakat, D.; Monti, J.P.; Mérillon, J.M.; Waffo-Teguo, P. Viniphenol A, a complex resveratrol hexamer from Vitis vinifera stalks: Structural elucidation and protective effects against amyloid-β-induced toxicity in PC12 cells. J. Nat. Prod. 2014, 77, 213–217. [Google Scholar] [CrossRef]
  48. Gabaston, J.; Leborgne, C.; Valls, J.; Renouf, E.; Richard, T.; Waffo-Teguo, P.; Mérillon, J.M. Subcritical water extraction of stilbenes from grapevine by-products: A new green chemistry approach. Ind. Crops Prod. 2018, 126, 272–279. [Google Scholar] [CrossRef]
  49. Żyżelewicz, D.; Oracz, J.; Kaczmarska, M.; Budryn, G.; Grzelczyk, J. Preparation and characterization of inclusion complex of (+)-catechin with β-cyclodextrin. Food Res. Int. 2018, 113, 263–268. [Google Scholar] [CrossRef]
  50. Moschona, A.; Liakopoulou-Kyriakides, M. Encapsulation of biological active phenolic compounds extracted from wine wastes in alginate-chitosan microbeads. J. Microencapsul. 2018, 35, 229–240. [Google Scholar] [CrossRef]
  51. Lavelli, V.; Sri Harsha, P.S.C. Microencapsulation of grape skin phenolics for pH controlled release of antiglycation agents. Food Res. Int. 2019, 119, 822–828. [Google Scholar] [CrossRef]
  52. Xu, W.; Yang, Y.; Xue, S.J.; Shi, J.; Lim, L.T.; Forney, C.; Xu, G.; Bamba, B.S.B. Effect of in vitro digestion on water-in-oil-in-water emulsions containing anthocyanins from grape skin powder. Molecules 2018, 23, 2808. [Google Scholar] [CrossRef] [PubMed] [Green Version]
  53. Olga, G.; Styliani, C.; Ioannis, R.G. Coencapsulation of Ferulic and Gallic acid in hp-b-cyclodextrin. Food Chem. 2015, 185, 33–40. [Google Scholar] [CrossRef]
  54. Taofiq, O.; Heleno, S.A.; Calhelha, R.C.; Fernandes, I.P.; Alves, M.J.; Barros, L.; González-Paramás, A.M.; Ferreira, I.C.F.R.; Barreiro, M.F. Phenolic acids, cinnamic acid, and ergosterol as cosmeceutical ingredients: Stabilization by microencapsulation to ensure sustained bioactivity. Microchem. J. 2019, 147, 469–477. [Google Scholar] [CrossRef] [Green Version]
  55. Zeng, Z.; Fang, Y.; Ji, H. Side chain influencing the interaction between β-cyclodextrin and vanillin. Flavour Fragr. J. 2012, 27, 378–385. [Google Scholar] [CrossRef]
  56. Da Rosa, C.G.; Borges, C.D.; Zambiazi, R.C.; Nunes, M.R.; Benvenutti, E.V.; da Luz, S.R.; D’Avila, R.F.; Rutz, J.K. Microencapsulation of gallic acid in chitosan, β-cyclodextrin and xanthan. Ind. Crops Prod. 2013, 46, 138–146. [Google Scholar] [CrossRef]
  57. Bala, I.; Bhardwaj, V.; Hariharan, S.; Kharade, S.V.; Roy, N.; Kumar, M.N.V.R. Sustained release nanoparticulate formulation containing antioxidant-ellagic acid as potential prophylaxis system for oral administration. J. Drug Target. 2006, 14, 27–34. [Google Scholar] [CrossRef]
  58. Silva Damasceno, E.T.; Almeida, R.R.; de Carvalho, S.Y.B.; de Carvalho, G.S.G.; Mano, V.; Pereira, A.C.; de Lima Guimarães, L.G. Lippia origanoides Kunth. essential oil loaded in nanogel based on the chitosan and ρ-coumaric acid: Encapsulation efficiency and antioxidant activity. Ind. Crops Prod. 2018, 125, 85–94. [Google Scholar] [CrossRef]
  59. Ramírez-Ambrosi, M.; Caldera, F.; Trotta, F.; Berrueta, L.; Gallo, B. Encapsulation of apple polyphenols in β-CD nanosponges. J. Incl. Phenom. Macrocycl. Chem. 2014, 80, 85–92. [Google Scholar] [CrossRef]
  60. Zheng, D.; Zhang, Q.F. Bioavailability enhancement of astilbin in rats through zein− caseinate nanoparticles. J. Agric. Food Chem. 2019, 67, 5746–5753. [Google Scholar] [CrossRef] [PubMed]
  61. Tchabo, W.; Ma, Y.; Kaptso, G.K.; Kwaw, E.; Cheno, R.W.; Xiao, L.; Osae, R.; Wu, M.; Farooq, M. Process Analysis of Mulberry (Morus alba) Leaf Extract Encapsulation: Effects of Spray Drying Conditions on Bioactive Encapsulated Powder Quality. Food Bioprocess Technol. 2019, 12, 122–146. [Google Scholar] [CrossRef]
  62. Maity, S.; Chakraborti, A.S. Formulation, physico-chemical characterization and antidiabetic potential of naringenin-loaded poly D, L lactide-co-glycolide (N-PLGA) nanoparticles. Eur. Polym. J. 2020, 134, 109818. [Google Scholar] [CrossRef]
  63. He, J.; Zheng, Z.P.; Zhu, Q.; Guo, F.; Chen, J. Encapsulation mechanism of oxyresveratrol by β-cyclodextrin and hydroxypropyl-β-cyclodextrin and computational analysis. Molecules 2017, 22, 1801. [Google Scholar] [CrossRef] [PubMed] [Green Version]
  64. Courtois, A.; Garcia, M.; Krisa, S.; Atgié, C.; Sauvant, P.; Richard, T.; Faure, C. Encapsulation of ϵ-viniferin in onion-type multi-lamellar liposomes increases its solubility and its photo-stability and decreases its cytotoxicity on Caco-2 intestinal cells. Food Funct. 2019, 10, 2573–2582. [Google Scholar] [CrossRef] [PubMed]
  65. Jaffe, R.; Mani, J. Polyphenolics Evoke Healing Responses: Clinical Evidence and Role of Predictive Biomarkers, 2nd ed.; Elsevier Inc.: Amsterdam, The Netherlands, 2018; ISBN 9780128130063. [Google Scholar]
Figure 1. Scanning electron microscopy micrographs of the GCPPE (AC) and IC (GCPPE+HP-β-CD+MD) (DF) at different magnifications.
Antioxidants 10 01130 g001
Figure 2. FTIR-ATR spectra of the GCPPE (red), HP-β-CD (purple), IC (GCPPE+HP-β-CD+MD) (blue), and PM (GCPPE/HP-β-CD/MD) (green).
Antioxidants 10 01130 g002
Figure 3. Representative stilbenes tentatively identified in the microencapsulated extract. (A) Maackin (C28H22O8); (B) Viniferol E (C56H44O13); (C) Viniphenol A (C84H64O18).
Antioxidants 10 01130 g003
Table 1. Physical characteristics and process parameters for the grape cane phenolic extract (GCPPE) and inclusion complex (GCPPE+HP-β-CD+MD).
Process ParametersSize DistributionProperty of Powders
Moisture (%)Solids
(g)
PY
(%)
D50
(µm)
SpanBulk Density (g/mL)Angle of Repose(°)
GCPPE6.3 ± 1.5 a11.0 ± 0.1 a38.4 ± 1.2 a17.5 ± 0.4 a6.15 ± 0.1 a0.10 ± 0.01 a34.8 ± 0.5 a
IC (GCPPE+HP-β-CD+MD)7.2 ± 0.3 a28.9 ± 0.1 b83.8 ± 2.6 b10.9 ± 0.9 b6.14 ± 0.1 a0.19 ± 0.01 b36.9 ± 1.3 a
Results are expressed as means ± standard deviations, and values with different superscripts letters in a column indicate significant differences at p < 0.05.
Table 2. Identification of phenolic compounds in the IC (GCPPE+HP-β-CD+MD), an adduct of β-CD and a complex between β-CD with (epi)catechin using LC-ESI-LTQ-Orbitrap-MS in negative mode.
CompoundstR
(min)
Accurate Mass
[M − H]
Theo.
Mass
Error
(ppm)
MS/MS Ions (Intensity)Molecular
Formula
Gallic acid *4.33169.0138169.0142−2.41125.0236(100)C7H6O5
Monogalloyl-glucose5.79331.0662331.0671−2.65169.0134(100), 125.0238(5)C13H16O10
[β-CD+HCOO]7.211179.36791179.3680−0.04675.8472(100), 797.1872(80), 332.8267(80), 734.6646(80)C43H72O37
Protocatechuic acid-O-hexoside (1)7.35315.0718315.0722−1.07153.0186(100), 109.0288(10)C13H16O9
Protocatechuic acid7.55153.0190153.0193−2.16109.0288(100)C7H6O4
Protocatechuic acid-O-hexoside (2)8.46315.0717315.0722−1.30153.0189(100), 109.0290(10)C13H16O9
Syringic acid hexoside8.66359.0933359.09252.21197.0445(100)C15H20O10
Protocatechuic aldehyde9.32137.0241137.0244−2.0293.0338(100), 109.0285(70)C7H6O3
Procyanidin dimer (1)10.34577.1348577.1351−0.69425.0864(100), 407.0760(70), 451.1019(45), 289.0706(35)C30H26O12
Procyanidin dimer (2)10.77577.1346577.1351−0.35425.0861(100), 407.0757(60), 451.1017(35), 289.0705(25)C30H26O12
Catechin *11.29289.0722289.07181.43245.0817(100), 205.0504(40), 179.0348(20)C15H14O6
Complex [β-CD+(epi)catechin]13.001423.57081423.5718−0.711245.4839(100), 1303.5255(85), 1101.4424(60), 1365.5260(60), 1.083.4313(60)C57H84O41
Epicatechin *13.29289.0715289.0718−1.00245.0812(100), 205.0499(40), 179.0343(15)C15H14O6
Restrytisol (A or B)15.08471.1441471.1449−1.86255.0653(100), 377.1017(65), 349.1068(45)C28H24O7
Epicatechin gallate *16.86441.0821441.0827−1.30289.0705(100), 169.0136(30)C22H18O10
Taxifolin *17.00303.0508303.0510−0.78285.0397(100), 177.0186(15), 125.0238(10)C15H12O7
Astilbin (1)17.36449.1084449.1089−1.12303.0495(100), 285.0392(85), 151.0028(30)C21H22O11
Taxifolin isomer17.43303.0503303.0510−2.32285.0390(100), 177.0184(15), 125.0237(10)C15H12O7
Stilbenoid heterodimer (caraphenol B/C)17.78469.1292469.1293−0.06451.1189(100), 363.0875(35), 375.0872(30), 281.0452(2)C28H22O7
(E)-Piceatannol *17.95243.0665243.06630.79225.0551(100), 201.0552(75), 159.0447(20)C14H12O4
Kaempferol-3-O-glucoside *18.39447.0931447.0933−0.49284.0315(100), 285.0392(75), 327.0497(15), 255.0286(10)C21H20O11
Ethyl protocatechuate18.49181.0504181.0506−1.02153.0187(100), 152.0110(15), 109.0289(5)C9H10O4
Dihydrokaempferol-O-rhamnoside18.77433.1139433.1140−0.38269.0446(100), 287.0550(40), 259.0603(15)C21H22O10
Eriodictyol-O-glucoside19.01449.1089449.1089−0.04287.0552(100), 151.0031(5)C21H22O11
Stilbenoid dimer19.16469.1292469.1293−0.07363.0857(100), 375.0857(20), 451.1168(5)C28H22O7
Undefined (tetrahydroxyisoflavanone)19.18287.0561287.0561−0.18259.0602(100), 243.0652(20), 201.0547(5)C15H12O6
Viniferin diglycoside19.25777.2397777.2400−0.36615.1854(100), 453.1330(80)C40H42O16
Myricetin19.39317.0301317.0303−0.63178.9981(100), 151.0032(45), 192.0058(10)C15H10O8
Pallidol19.50453.1349453.13442.24359.0922(100), 265.0499(10)C28H22O6
(E)-resveratrol *20.23227.0715227.07140.77185.0607(100), 183.0816(35), 159.0814(30)C14H12O3
Stilbenoid dimer (resveratrol dimer)20.56453.1351453.13441.57359.0916(100), 289.0861(5)C28H22O6
Stilbenoid dimer (maackin)20.62485.1242485.12420.01375.0865(100), 467.1125(15), 363.0863(10)C28H22O8
Resveratrol-O-hexoside20.79615.1868615.1872−0.62453.1334(100)C34H32O11
Eriodictyol *20.97287.0558287.0561−0.92151.0031(100), 135.0446(5)C15H12O6
Stilbenoid tetramer (viniferol E)21.11923.2680923.26740.68905.2576(100), 707.1898(55), 801.2318(50), 881.2573(20), 783.2209(10)C56H44O13
Stilbenoid hexamer (viniphenol A)21.12679.1969[M − 2H]2−679.1974[M − 2H]2−−1.12585.1543(100), 491.1126(10), 359.0914(5), 905.2584(2.5), 453.1333(2)C84H64O18
Quercetin *21.16301.0354301.03540.06178.9987(100), 151.0038(80)C15H10O7
Hopeaphenol *21.34905.2607905.2627−2.24811.2152(100), 717.1741(65), 451.1173(10)C56H42O12
Isohopeaphenol *21.47905.2588905.25682.15811.2178(100), 717.1752(40)C56H42O12
(E)-ε-viniferin *21.59453.1348453.13441.03359.0928(100), 347.0923(50), 435.1238(25)C28H22O6
(E)-ω-viniferin21.72453.1346453.13440.62359.0927(100), 347.0925(50), 435.1234(30), 411.1233(20)C28H22O6
Stilbenoid tetramer
(vitisin A/B/C/D)
21.90905.2599905.2627−3.05799.2157(100), 887.2482(70), 811.2158(50), 359.0913(35), 545.1599(15)C56H42O12
* Compounds identified via matching with authentic standards. tR, retention times. Isomers are presented in brackets. Stilbenoid hexamer appeared as a doubly charged ion.
Table 3. Encapsulation efficiency (%).
CompoundsEE (%)
Phenolic Acids and Derivatives
Protocatechuic acid-O-hexoside (1)54.3 ± 2.4
Protocatechuic acid66.8 ± 9.8
Ethyl protocatechuate69.7 ± 5.5
Protocatechuic aldehyde75.6 ± 4.2
Gallic acid83.4 ± 0.6
Caftaric acid87.1 ± 2.2
Ellagic acid pentoside87.6 ± 0.5
Hydroxybenzaldehyde95.8 ± 0.6
Weighted Average81.5 ± 0.7
Flavonoids
Eriodictyol74.2 ± 4.7
Quercetin-O-glucoside81.8 ± 7.0
Quercetin-3-O-glucuronide88.0 ± 3.1
Astilbin (1)82.7 ± 2.3
Astilbin (2)92.0 ± 1.1
Weighted Average85.2 ± 2.4
Stilbenes
(E)-resveratrol32.7 ± 2.8
Stilbenoid tetramer (hopeaphenol/isohopeaphenol)65.8 ± 8.6
Pallidol74.6 ± 3.8
(E)-ε-viniferin76.8 ± 3.5
Stilbene dimer (resveratrol dimer)94.1 ± 2.1
Stilbenoid heterodimer (caraphenol B/C)96.8 ± 0.4
Restrytisol (A or B)97.0 ± 0.6
Weighted Average78.6 ± 1.9
Total Weighted Average80.5 ± 1.1
Results are given as means ± standard deviations. For each phenolic class, we calculated the weighted average of the concentration of the respective metabolites. The total weighted average was calculated by weighting all quantified compounds. All encapsulation efficiencies were calculated according to Equation (4) (Section 2.8).
Publisher’s Note: MDPI stays neutral with regard to jurisdictional claims in published maps and institutional affiliations.

