
Positive Associations of Dietary Intake and Plasma Concentrations of Vitamin E with Skeletal Muscle Mass, Heel Bone Ultrasound Attenuation and Fracture Risk in the EPIC-Norfolk Cohort


Abstract
1. Introduction
2. Materials and Methods
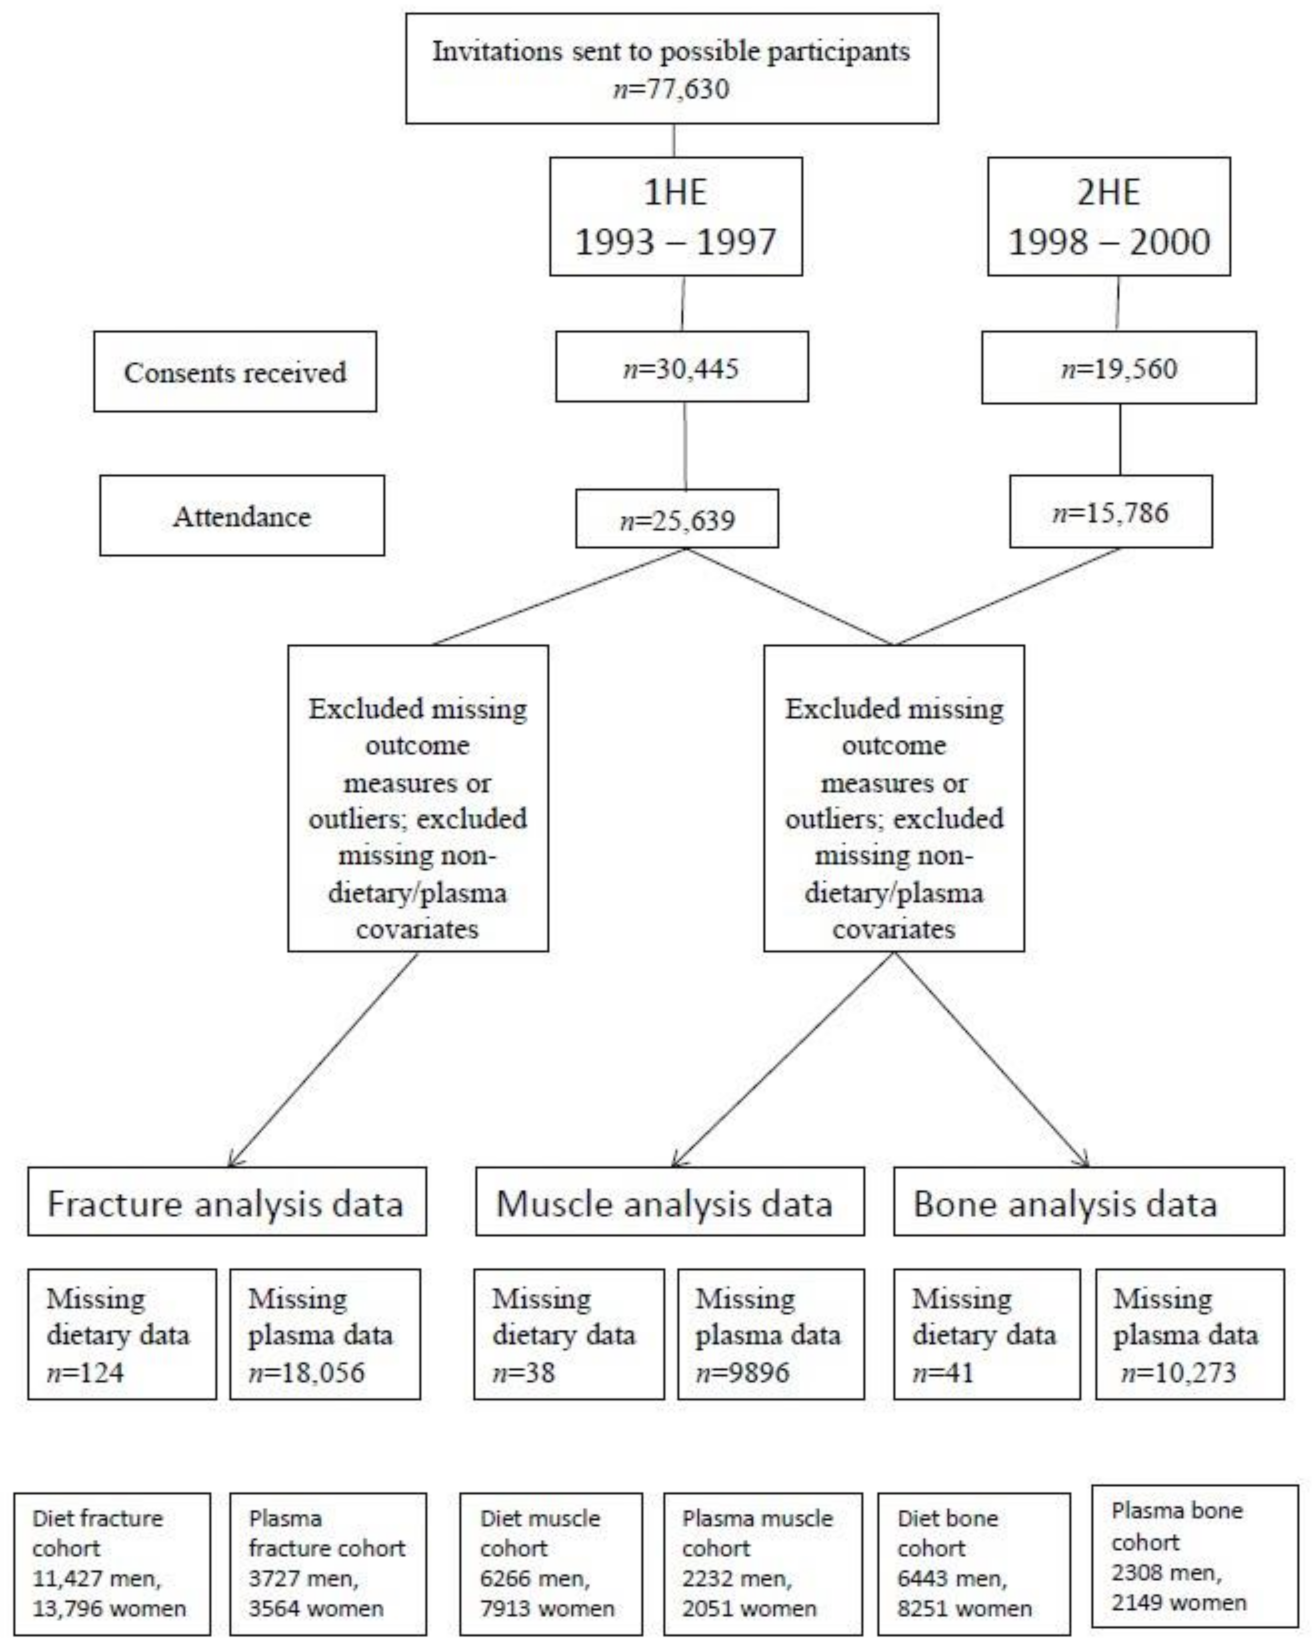
2.1. EPIC-Norfolk Study Design
2.2. Measurements of Body Composition
2.2.1. Height, Weight and BMI
2.2.2. Indices of Fat-Free Mass (FFM)
2.2.3. Bone Density Assessment
2.2.4. Fracture Incidence
2.3. Measurement of Vitamin E Intake
2.4. Blood Analysis
2.5. Measurement of Confounding Variables
2.6. Statistical Analysis
2.7. Cross-sectional Analyses
2.8. Longitudinal Analyses
3. Results
3.1. Characteristics of the Study Population
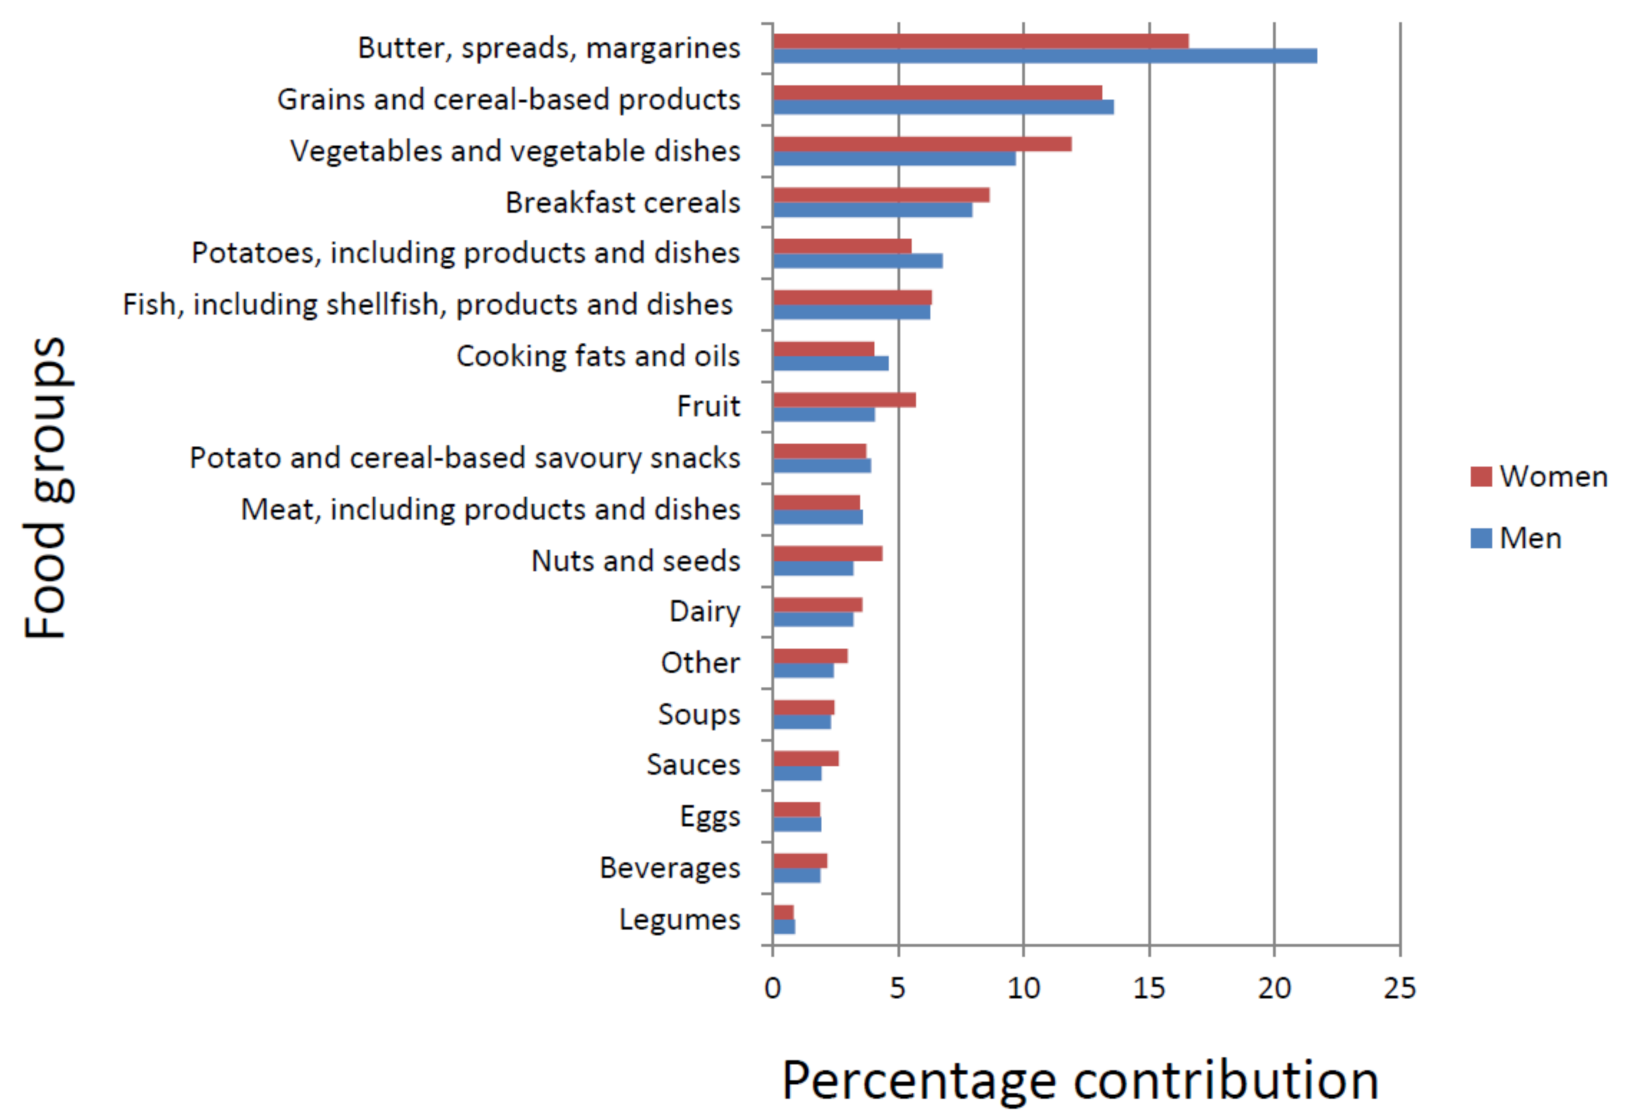
3.2. Food Sources of α- and γ-Tocopherols
3.3. Correlations between Dietary Vitamin E Intake and Plasma Concentrations
3.4. Associations between Dietary Vitamin E Intakes and Indices of SMM
3.5. Associations between Plasma Vitamin E Concentrations and Indices of SMM
3.6. Associations between Dietary Vitamin E Intakes and Bone Density Status
3.7. Associations between Plasma Vitamin E Concentrations and Bone Density Status
3.8. Associations between Dietary Vitamin E Intakes and Fracture Risk
3.9. Associations between Plasma Vitamin E Concentrations and Fracture Risk
4. Discussion
5. Conclusions
Author Contributions
Funding
Institutional Review Board Statement
Informed Consent Statement
Data Availability Statement
Acknowledgments
Conflicts of Interest
References
- Cruz-Jentoft, A.J.; Bahat, G.; Bauer, J.; Boirie, Y.; Bruyère, O.; Cederholm, T.; Cooper, C.; Landi, F.; Rolland, Y.; Sayer, A.A.; et al. Sarcopenia: Revised European consensus on definition and diagnosis. Age Ageing 2019, 48, 16–31. [Google Scholar] [CrossRef] [PubMed]
- Office for National Statistics National Population Projections: 2018-Based. Available online: https://www.ons.gov.uk/releases/nationalpopulationprojections2018based (accessed on 20 August 2020).
- Ethgen, O.; Beaudart, C.; Buckinx, F.; Bruyère, O.; Reginster, J.Y. The Future Prevalence of Sarcopenia in Europe: A Claim for Public Health Action. Calcif. Tissue Int. 2017, 100, 229–234. [Google Scholar] [CrossRef] [PubMed]
- Sousa, A.S.; Guerra, R.S.; Fonseca, I.; Pichel, F.; Ferreira, S.; Amaral, T.F. Financial impact of sarcopenia on hospitalization costs. Eur. J. Clin. Nutr. 2016, 70, 1046–1051. [Google Scholar] [CrossRef] [PubMed]
- International Osteoporosis Foundation Facts and Statistics. Available online: https://www.iofbonehealth.org/facts-statistics#category-14 (accessed on 12 October 2020).
- Skelton, D.A.; Greig, C.A.; Davies, J.M.; Young, A. Strength, power and related functional ability of healthy people aged 65–89 years. Age Ageing 1994, 23, 371–377. [Google Scholar] [CrossRef] [PubMed]
- Baumgartner, R.N.; Waters, D.L.; Gallagher, D.; Morley, J.E.; Garry, P.J. Predictors of skeletal muscle mass in elderly men and women. Mech. Ageing Dev. 1999, 107, 123–136. [Google Scholar] [CrossRef] [PubMed]
- Brotto, M.; Bonewald, L. Bone and muscle: Interactions beyond mechanical. Bone 2015, 80, 109–114. [Google Scholar] [CrossRef]
- Novotny, S.A.; Warren, G.L.; Hamrick, M.W. Aging and the muscle-bone relationship. Physiology 2015, 30, 8–16. [Google Scholar] [CrossRef]
- Hamrick, M.W. The skeletal muscle secretome: An emerging player in muscle–bone crosstalk. Bonekey Rep. 2012, 1, 1–5. [Google Scholar] [CrossRef]
- Hamrick, M.W. A Role for Myokines in Muscle-Bone Interactions Introduction: Basic Mechanisms of Muscle-Bone Interactions. Exerc. Sport Sci. Rev. 2013, 39, 43–47. [Google Scholar] [CrossRef]
- Bonewald, L.F. Does defective bone lead to defective muscle? J. Bone Miner. Res. 2015, 30, 593–595. [Google Scholar] [CrossRef]
- Karsenty, G.; Mera, P. Molecular bases of the crosstalk between bone and muscle. Bone 2018, 115, 43–49. [Google Scholar] [CrossRef] [PubMed]
- Szulc, P.; Beck, T.J.; Marchand, F.; Delmas, P.D. Low skeletal muscle mass is associated with poor structural parameters of bone and impaired balance in elderly men - The MINOS study. J. Bone Miner. Res. 2005, 20, 721–729. [Google Scholar] [CrossRef] [PubMed]
- Landi, F.; Liperoti, R.; Russo, A.; Giovannini, S.; Tosato, M.; Capoluongo, E.; Bernabei, R.; Onder, G. Sarcopenia as a risk factor for falls in elderly individuals: Results from the ilSIRENTE study. Clin. Nutr. 2012, 31, 652–658. [Google Scholar] [CrossRef] [PubMed]
- Verschueren, S.; Gielen, E.; O’Neill, T.W.; Pye, S.R.; Adams, J.E.; Ward, K.A.; Wu, F.C.; Szulc, P.; Laurent, M.; Claessens, F.; et al. Sarcopenia and its relationship with bone mineral density in middle-aged and elderly European men. Osteoporos. Int. 2013, 24, 87–98. [Google Scholar] [CrossRef] [PubMed]
- Cederholm, T.; Cruz-Jentoft, A.J.; Maggi, S. Sarcopenia and fragility fractures. Eur. J. Phys. Rehabil. Med. 2013, 49, 111–117. [Google Scholar]
- Kojima, G. Frailty as a predictor of fractures among community-dwelling older people: A systematic review and meta-analysis. Bone 2016, 90, 116–122. [Google Scholar] [CrossRef]
- Curtis, E.; Litwic, A.; Cooper, C.; Dennison, E. Determinants of Muscle and Bone Aging. J. Cell. Physiol. 2015, 230, 2618–2625. [Google Scholar] [CrossRef]
- Welch, A.A. Nutritional influences on age-related skeletal muscle loss. Proc. Nutr. Soc. 2014, 73, 16–33. [Google Scholar] [CrossRef]
- Ble, A.; Cherubini, A.; Volpato, S.; Bartali, B.; Walston, J.D.; Windham, B.G.; Bandinelli, S.; Lauretani, F.; Guralnik, J.M.; Ferrucci, L. Lower plasma vitamin E levels are associated with the frailty syndrome: The InCHIANTI study. J. Gerontol. A. Biol. Sci. Med. Sci. 2006, 61, 278–283. [Google Scholar] [CrossRef]
- Bartali, B.; Frongillo, E.A.; Bandinelli, S.; Lauretani, F.; Semba, R.D.; Fried, L.P.; Ferrucci, L. Low nutrient intake is an essential component of frailty in older persons. J. Gerontol. Ser. A Biol. Sci. Med. Sci. 2006, 61, 589–593. [Google Scholar] [CrossRef]
- Semba, R.D.; Blaum, C.; Guralnik, J.M.; Moncrief, D.T.; Ricks, M.O.; Fried, L.P. Carotenoid and vitamin E status are associated with indicators of sarcopenia among older women living in the community. Aging Clin. Exp. Res. 2003, 15, 482–487. [Google Scholar] [CrossRef] [PubMed]
- Semba, R.D.; Bartali, B.; Zhou, J.; Blaum, C.; Ko, C.-W.; Fried, L.P. Low serum micronutrient concentrations predict frailty among older women living in the community. J. Gerontol. A. Biol. Sci. Med. Sci. 2006, 61, 594–599. [Google Scholar] [CrossRef] [PubMed]
- Das, A.; Cumming, R.G.; Naganathan, V.; Blyth, F.; Ribeiro, R.V.; Le Couteur, D.G.; Handelsman, D.J.; Waite, L.M.; Simpson, S.J.; Hirani, V. Prospective associations between dietary antioxidant intake and frailty in older Australian men: The concord health and ageing in men project. J. Gerontol. Ser. A Biol. Sci. Med. Sci. 2020, 75, 348–356. [Google Scholar] [CrossRef] [PubMed]
- Welch, A.A.; Jennings, A.; Kelaiditi, E.; Skinner, J.; Steves, C.J. Cross-Sectional Associations Between Dietary Antioxidant Vitamins C, E and Carotenoid Intakes and Sarcopenic Indices in Women Aged 18–79 Years. Calcif. Tissue Int. 2020, 106, 331–342. [Google Scholar] [CrossRef]
- Mata-Granados, J.M.; Cuenca-Acebedo, R.; Luque De Castro, M.D.; Quesada Gómez, J.M. Lower vitamin e serum levels are associated with osteoporosis in early postmenopausal women: A cross-sectional study. J. Bone Miner. Metab. 2013, 31, 455–460. [Google Scholar] [CrossRef]
- Michaëlsson, K.; Wolk, A.; Byberg, L.; Ärnlöv, J.; Melhus, H. Intake and serum concentrations of α-tocopherol in relation to fractures in elderly women and men: 2 cohort studies. Am. J. Clin. Nutr. 2014, 99, 107–114. [Google Scholar] [CrossRef]
- Shi, W.Q.; Liu, J.; Cao, Y.; Zhu, Y.Y.; Guan, K.; Chen, Y.M. Association of dietary and serum Vitamin E with bone mineral density in middle-aged and elderly Chinese adults: A cross-sectional study. Br. J. Nutr. 2016, 115, 113–120. [Google Scholar] [CrossRef]
- Odai, T.; Terauchi, M.; Hirose, A.; Kato, K.; Miyasaka, N. Bone mineral density in premenopausal women is associated with the dietary intake of α-tocopherol: A cross-sectional study. Nutrients 2019, 11, 2474. [Google Scholar] [CrossRef]
- Jiang, Q.; Christen, S.; Shigenaga, M.K.; Ames, B.N. γ-Tocopherol, the major form of vitamin E in the US diet, deserves more attention. Am. J. Clin. Nutr. 2001, 74, 714–722. [Google Scholar] [CrossRef]
- Wagner, K.H.; Kamal-Eldin, A.; Elmadfa, I. Gamma-tocopherol - An underestimated vitamin? Ann. Nutr. Metab. 2004, 48, 169–188. [Google Scholar] [CrossRef]
- Khor, S.C.; Abdul Karim, N.; Wan Ngah, W.Z.; Mohd Yusof, Y.A.; Makpol, S. Vitamin E in Sarcopenia: Current Evidences on Its Role in Prevention and Treatment. Oxid. Med. Cell. Longev. 2014, 2014, 1–16. [Google Scholar] [CrossRef] [PubMed]
- Rondanelli, M.; Faliva, M.A.; Peroni, G.; Moncaglieri, F.; Infantino, V.; Naso, M.; Perna, S. Focus on pivotal role of dietary intake (Diet and supplement) and blood levels of tocopherols and tocotrienols in obtaining successful aging. Int. J. Mol. Sci. 2015, 16, 23227–23249. [Google Scholar] [CrossRef] [PubMed]
- Chung, E.; Mo, H.; Wang, S.; Zu, Y.; Elfakhani, M.; Rios, S.R.; Chyu, M.C.; Yang, R.S.; Shen, C.L. Potential roles of vitamin E in age-related changes in skeletal muscle health. Nutr. Res. 2018, 49, 23–36. [Google Scholar] [CrossRef] [PubMed]
- Hamidi, M.S.; Corey, P.N.; Cheung, A.M. Effects of vitamin E on bone turnover markers among US postmenopausal women. J. Bone Miner. Res. 2012, 27, 1368–1380. [Google Scholar] [CrossRef] [PubMed]
- Berdnikovs, S.; Abdala-Valencia, H.; McCary, C.; Somand, M.; Cole, R.; Garcia, A.; Bryce, P.; Cook-Mills, J.M. Isoforms of vitamin E have opposing immunoregulatory functions during inflammation by regulating leukocyte recruitment. J. Immunol. 2009, 182, 4395–4405. [Google Scholar] [CrossRef]
- Riboli, E. Nutrition and cancer: Background and rationale of the European Prospective Investigation into Cancer and Nutrition (EPIC). Ann. Oncol. 1992, 3, 783–791. [Google Scholar] [CrossRef]
- Day, N.; Oakes, S.; Luben, R.; Khaw, K.T.; Bingham, S.; Welch, A.; Wareham, N. EPIC-Norfolk: Study design and characteristics of the cohort. European Prospective Investigation of Cancer. Br. J. Cancer 1999, 80 (Suppl. 1), 95–103. [Google Scholar]
- Bennett, N.; Dodd, T.; Flatley, J.; Freeth, S.; Bolling, K. Health Survey for England 1993; HMSO: London, UK, 1995. [Google Scholar]
- Simpson, J.A.D.; Lobo, D.N.; Anderson, J.A.; Macdonald, I.A.; Perkins, A.C.; Neal, K.R.; Allison, S.P.; Rowlands, B.J. Body water compartment measurements: A comparison of bioelectrical impedance analysis with tritium and sodium bromide dilution techniques. Clin. Nutr. 2001, 20, 339–343. [Google Scholar] [CrossRef]
- Shanholtzer, B.A.; Patterson, S.M. Use of bioelectrical impedance in hydration status assessment: Reliability of a new tool in psychophysiology research. Int. J. Psychophysiol. 2003, 49, 217–226. [Google Scholar] [CrossRef]
- Studenski, S.A.; Peters, K.W.; Alley, D.E.; Cawthon, P.M.; McLean, R.R.; Harris, T.B.; Ferrucci, L.; Guralnik, J.M.; Fragala, M.S.; Kenny, A.M.; et al. The FNIH sarcopenia project: Rationale, study description, conference recommendations, and final estimates. J. Gerontol. Ser. A Biol. Sci. Med. Sci. 2014, 69 A, 547–558. [Google Scholar] [CrossRef]
- Welch, A.; Camus, J.; Dalzell, N.; Oakes, S.; Reeve, J.; Khaw, K.T. Broadband ultrasound attenuation (BUA) of the heel bone and its correlates in men and women in the EPIC-Norfolk cohort: A cross-sectional population-based study. Osteoporos. Int. 2004, 15, 217–225. [Google Scholar] [CrossRef]
- Khaw, K.T.; Reeve, J.; Luben, R.; Bingham, S.; Welch, A.; Wareham, N.; Oakes, S.; Day, N. Prediction of total and hip fracture risk in men and women by quantitative ultrasound of the calcaneus: EPIC-Norfolk prospective population study. Lancet 2004, 363, 197–202. [Google Scholar] [CrossRef]
- Moayyeri, A.; Kaptoge, S.; Dalzell, N.; Bingham, S.; Luben, R.N.; Wareham, N.J.; Reeve, J.; Khaw, K.T. Is QUS or DXA better for predicting the 10-year absolute risk of fracture? J. Bone Miner. Res. 2009, 24, 1319–1325. [Google Scholar] [CrossRef] [PubMed]
- Welch, A.A.; McTaggart, A.; Mulligan, A.A.; Luben, R.; Walker, N.; Khaw, K.T.; Day, N.E.; Bingham, S.A. DINER (Data Into Nutrients for Epidemiological Research) - a new data-entry program for nutritional analysis in the EPIC-Norfolk cohort and the 7-day diary method. Public Health Nutr 2001, 4, 1253–1265. [Google Scholar] [CrossRef] [PubMed]
- Lentjes, M.A.H.; McTaggart, A.; Mulligan, A.A.; Powell, N.A.; Parry-Smith, D.; Luben, R.N.; Bhaniani, A.; Welch, A.A.; Khaw, K.-T. Dietary intake measurement using 7 d diet diaries in British men and women in the European Prospective Investigation into Cancer-Norfolk study: A focus on methodological issues. Br. J. Nutr. 2014, 111, 516–526. [Google Scholar] [CrossRef]
- Lentjes, M.A.; Bhaniani, A.; Mulligan, A.A.; Khaw, K.-T.; Welch, A.A. Developing a database of vitamin and mineral supplements (ViMiS) for the Norfolk arm of the European Prospective Investigation into Cancer (EPIC-Norfolk). Public Health Nutr. 2011, 14, 459–471. [Google Scholar] [CrossRef]
- Thurnham, D.I.; Davies, J.A.; Crump, B.J.; Situnayake, R.D.; Davis, M. The use of different lipids to express serum tocopherol: Lipid ratios for the measurement of vitamin E status. Ann. Clin. Biochem. 1986, 23 Pt 5, 514–520. [Google Scholar] [CrossRef]
- Wareham, N.J.; Jakes, R.W.; Rennie, K.L.; Schuit, J.; Mitchell, J.; Hennings, S.; Day, N.E. Validity and repeatability of a simple index derived from the short physical activity questionnaire used in the European Prospective Investigation into Cancer and Nutrition (EPIC) study. Public Health Nutr. 2003, 6, 407–413. [Google Scholar] [CrossRef] [PubMed]
- Khaw, K.-T.; Jakes, R.; Bingham, S.; Welch, A.; Luben, R.; Day, N.; Wareham, N. Work and leisure time physical activity assessed using a simple, pragmatic, validated questionnaire and incident cardiovascular disease and all-cause mortality in men and women: The European Prospective Investigation into Cancer in Norfolk prospective pop. Int. J. Epidemiol. 2006, 35, 1034–1043. [Google Scholar] [CrossRef]
- Shohaimi, S.; Luben, R.; Wareham, N.; Day, N.; Bingham, S.; Welch, A.; Oakes, S.; Khaw, K.-T. Residential area deprivation predicts smoking habit independently of individual educational level and occupational social class. A cross sectional study in the Norfolk cohort of the European Investigation into Cancer (EPIC-Norfolk). J. Epidemiol. Community Health 2003, 57, 270–276. [Google Scholar] [CrossRef]
- Fish, R.; Geddes, L. Medical and Bioengineering Aspects of Electrical Injuries; Lawyers & Judges: Tucson, AZ, USA, 2003; ISBN 1930056087. [Google Scholar]
- Franssen, F.M.E.; Rutten, E.P.A.; Groenen, M.T.J.; Vanfleteren, L.E.; Wouters, E.F.M.; Spruit, M.A. New reference values for body composition by bioelectrical impedance analysis in the general population: Results from the UK biobank. J. Am. Med. Dir. Assoc. 2014, 15, 1–6. [Google Scholar] [CrossRef] [PubMed]
- Chiuve, S.E.; Sampson, L.; Willett, W.C. The association between a nutritional quality index and risk of chronic disease. Am. J. Prev. Med. 2011, 40, 505–513. [Google Scholar] [CrossRef] [PubMed]
- Lentjes, M.A.H.; Mulligan, A.A.; Welch, A.A.; Bhaniani, A.; Luben, R.N.; Khaw, K.T. Contribution of cod liver oil-related nutrients (vitamins A, D, E and eicosapentaenoic acid and docosahexaenoic acid) to daily nutrient intake and their associations with plasma concentrations in the EPIC-Norfolk cohort. J. Hum. Nutr. Diet. 2015, 28, 568–582. [Google Scholar] [CrossRef] [PubMed]
- COMA. Dietary Reference Values for Food Energy and Nutrients for the United Kingdom; Her Majesty’s Stationary Office (HMSO): London, UK, 1991; ISBN 0113213972. [Google Scholar]
- EFSA; NDA. Panel (EFSA Panel on Dietetic Products, Nutrition and Allergies) Scientific Opinion on Dietary Reference Values for vitamin E as α-tocopherol. EFSA J. 2015, 13, 1–72. [Google Scholar] [CrossRef]
- Gliszczynska-Swiglo, A.; Sikorska, E.; Khmelinskii, I.; Sikorski, M. Tocopherol content in edible plant oils. Pol. J. Food Nutr. Sci. 2007, 57, 157–161. [Google Scholar]
- Thomas, R.G.; Gebhardt, S.E. Nuts and Seeds As Sources of Alpha and Gamma Tocopherols. In Proceedings of the ICR/WCRF International Research Conference, Washington, DC, USA, 13–14 July 2006; p. 1. [Google Scholar]
- Jenab, M.; Salvini, S.; Van Gils, C.H.; Brustad, M.; Shakya-Shrestha, S.; Buijsse, B.; Verhagen, H.; Touvier, M.; Biessy, C.; Wallström, P.; et al. Dietary intakes of retinol, β-carotene, vitamin D and vitamin E in the european prospective investigation into cancer and nutrition cohort. Eur. J. Clin. Nutr. 2009, 63, S150–S178. [Google Scholar] [CrossRef]
- Zhao, Y.; Monahan, F.J.; McNulty, B.A.; Gibney, M.J.; Gibney, E.R. Effect of vitamin e intake from food and supplement sources on plasma α- and γ-tocopherol concentrations in a healthy Irish adult population. Br. J. Nutr. 2014, 112, 1575–1585. [Google Scholar] [CrossRef]
- Ruston, D.; Hoare, J.; Henderson, L.; Gregory, J.; Bates, C.J.; Prentice, A.; Birch, M.; Swan, G.; Farron, M. The National Diet & Nutrition Survey: Adults Aged 19 to 64 Years. Nutritional Status (Anthropometry and Blood Analytes), Blood Pressure and Physical Activity; Her Majesty’s Stationary Office (HMSO): London, UK, 2004; Volume 4, ISBN 0 11 621569 0. [Google Scholar]
- Boeing, H.; Bohlscheid-Thomas, S.; Voss, S.; Schneeweiss, S.; Wahrendorf, J. The relative validity of vitamin intakes derived from a food frequency questionnaire compared to 24-h recalls and biological measurements: Results from the EPIC pilot study in Germany. Int. J. Epidemiol. 1997, 26, 82–90. [Google Scholar] [CrossRef]
- Kardinaal, A.F.M.; Van’t Veer, P.; Brants, H.A.M.; Van Den Berg, H.; Van Schoonhoven, J.; Hermus, R.J.J. Relations between antioxidant vitamins in adipose tissue, plasma, and diet. Am. J. Epidemiol. 1995, 141, 440–450. [Google Scholar] [CrossRef]
- Andersen, L.F.; Solvoll, K.; Johansson, L.R.K.; Salminen, I.; Aro, A.; Drevon, C.A. Evaluation of a food frequency questionnaire with weighed records, fatty acids, and alpha-tocopherol in adipose tissue and serum. Am. J. Epidemiol. 1999, 150, 75–87. [Google Scholar] [CrossRef]
- Waniek, S.; di Giuseppe, R.; Esatbeyoglu, T.; Plachta-Danielzik, S.; Ratjen, I.; Jacobs, G.; Nöthlings, U.; Koch, M.; Schlesinger, S.; Rimbach, G.; et al. Vitamin E (α- and γ-Tocopherol) Levels in the Community: Distribution, Clinical and Biochemical Correlates, and Association with Dietary Patterns. Nutrients 2017, 10, 3. [Google Scholar] [CrossRef] [PubMed]
- Bartali, B.; Frongillo, E.A.; Guralnik, J.M.; Stipanuk, M.H.; Allore, H.G.; Cherubini, A.; Bandinelli, S.; Ferrucci, L.; Gill, T.M. Serum Micronutrient Concentrations and Decline in Physical Function Among Older Persons. JAMA 2008, 299. [Google Scholar] [CrossRef] [PubMed]
- Pilleron, S.; Weber, D.; Pérès, K.; Colpo, M.; Gomez-Cabrero, D.; Stuetz, W.; Dartigues, J.F.; Ferrucci, L.; Bandinelli, S.; Garcia-Garcia, F.J.; et al. Patterns of circulating fat-soluble vitamins and carotenoids and risk of frailty in four European cohorts of older adults. Eur. J. Nutr. 2018, 58, 379–389. [Google Scholar] [CrossRef] [PubMed]
- Cesari, M.; Phaor, M.; Bartali, B.; Cherubini, A.; Penninx, B.; Williams, G.; Atkinson, H.; Martin, A.; Guralnik, J.; Ferrucci, L. Antioxidants and physical performance in elderly persons: The Invecchiare in Chiant (InCHIANTI) study. Am. J. Clin. Nutr. 2004, 79, 289–294. [Google Scholar] [CrossRef] [PubMed]
- Yang, T.C.; Duthie, G.G.; Aucott, L.S.; Macdonald, H.M. Vitamin E homologues α- and γ-tocopherol are not associated with bone turnover markers or bone mineral density in peri-menopausal and post-menopausal women. Osteoporos. Int. 2016, 27, 2281–2290. [Google Scholar] [CrossRef]
- Macdonald, H.M.; New, S.A.; Golden, M.H.N.; Campbell, M.K.; Reid, D.M. Nutritional associations with bone loss during the menopausal transition: Evidence of a beneficial effect of calcium, alcohol, and fruit and vegetable nutrients and of a detrimental effect of fatty acids. Am. J. Clin. Nutr. 2004, 79, 155–165. [Google Scholar] [CrossRef]
- Ilesanmi-Oyelere, B.L.; Brough, L.; Coad, J.; Roy, N.; Kruger, M.C. The relationship between nutrient patterns and bone mineral density in postmenopausal women. Nutrients 2019, 11, 1262. [Google Scholar] [CrossRef]
- Holvik, K.; Gjesdal, C.G.; Tell, G.S.; Grimnes, G.; Schei, B.; Apalset, E.M.; Samuelsen, S.O.; Blomhoff, R.; Michaëlsson, K.; Meyer, H.E. Low serum concentrations of alpha-tocopherol are associated with increased risk of hip fracture. A NOREPOS study. Osteoporos. Int. 2014, 25, 2545–2554. [Google Scholar] [CrossRef]
- Pizzino, G.; Irrera, N.; Cucinotta, M.; Pallio, G.; Mannino, F.; Arcoraci, V.; Squadrito, F.; Altavilla, D.; Bitto, A. Oxidative Stress: Harms and Benefits for Human Health. Oxid. Med. Cell. Longev. 2017, 2017, 1–13. [Google Scholar] [CrossRef]
- Traber, M.G.; Leonard, S.W.; Bobe, G.; Fu, X.; Saltzman, E.; Grusak, M.A.; Booth, S.L. α-tocopherol disappearance rates from plasma depend on lipid concentrations: Studies using deuterium-labeled collard greens in younger and older adults. Am. J. Clin. Nutr. 2015, 101, 752–759. [Google Scholar] [CrossRef]
- Hosomi, A.; Arita, M.; Sato, Y.; Kiyose, C.; Ueda, T.; Igarashi, O.; Arai, H.; Inoue, K. Affinity for α-tocopherol transfer protein as a determinant of the biological activities of vitamin E analogs. FEBS Lett. 1997, 409, 105–108. [Google Scholar] [CrossRef]
- Mariotti, C.; Gellera, C.; Rimondi, M.; Mineri, R.; Uziel, G.; Zorzi, G.; Pareyson, D.; Piccolo, G.; Gambi, D.; Piacentini, S.; et al. Ataxia with isolated vitamin E deficiency: Neurological phenotype, clinical follow-up and novel mutations in TTPA gene in Italian families. Neurol. Sci. 2004, 25, 130–137. [Google Scholar] [CrossRef] [PubMed]
- Shiojiri, T.; Yokota, T.; Fujimori, N.; Mizusawa, H. Familial ataxia with isolated vitamin E deficiency not due to mutation of α-TTP. J. Neurol. 1999, 246, 982. [Google Scholar] [CrossRef] [PubMed]
- Wolf, G. How an increased intake of alpha-tocopherol can suppress the bioavailability of gamma-tocopherol. Nutr. Rev. 2006, 64, 295–299. [Google Scholar] [CrossRef] [PubMed]
- Burton, G.W.; Traber, M.G.; Acuff, R.V.; Walters, D.N.; Kayden, H.; Hughes, L.; Ingold, K.U. Human plasma and tissue alpha-tocopherol concentrations in response to supplementation with deuterated natural and synthetic vitamin E. Am. J. Clin. Nutr. 1998, 67, 669–684. [Google Scholar] [CrossRef]
- Parker, R.S.; Swanson, J.E. A novel 5’-carboxychroman metabolite of γ-tocopherol secreted by HepG2 cells and excreted in human urine. Biochem. Biophys. Res. Commun. 2000, 269, 580–583. [Google Scholar] [CrossRef]
- Azzi, A. Many tocopherols, one vitamin E. Mol. Aspects Med. 2017, 1–12. [Google Scholar] [CrossRef]
- Handelman, G.J.; Machlin, L.J.; Fitch, K.; Weiter, J.J.; Dratz, E.A. Oral alpha-tocopherol supplements decrease plasma gamma-tocopherol levels in humans. J. Nutr. 1985, 115, 807–813. [Google Scholar] [CrossRef]
- Schmölz, L.; Birringer, M.; Lorkowski, S.; Wallert, M. Complexity of vitamin E metabolism. World J. Biol. Chem. 2016, 7, 14–43. [Google Scholar] [CrossRef]
- Bates, C.J.; Mishra, G.D.; Prentice, A. γ-Tocopherol as a possible marker for nutrition-related risk: Results from four National Diet and Nutrition Surveys in Britain. Br. J. Nutr. 2004, 92, 137–150. [Google Scholar] [CrossRef]
- Achamrah, N.; Colange, G.; Delay, J.; Rimbert, A.; Folope, V.; Petit, A.; Grigioni, S.; Déchelotte, P.; Coëffier, M. Comparison of body composition assessment by DXA and BIA according to the body mass index: A retrospective study on 3655 measures. PLoS ONE 2018, 13, 1–13. [Google Scholar] [CrossRef]


| Diet Analysis Cohort * | Diet Analysis Cohort * | Diet Analysis Cohort † | ||||||||||
|---|---|---|---|---|---|---|---|---|---|---|---|---|
| (SMM) | (BUA) | (Fractures) | ||||||||||
| Men (n = 6266) | Women (n = 7913) | Men (n = 6443) | Women (n = 8251) | Men (n = 11,427) | Women (n = 13,796) | |||||||
| Age (years) | 62.8 | 9.0 | 61.5 | 9.0 | 62.9 | 9.0 | 61.5 | 9.0 | 59.6 | 9.3 | 58.9 | 9.3 |
| BMI (kg/m2) | 26.7 | 3.0 | 26.1 | 3.7 | 26.9 | 3.3 | 26.5 | 4.4 | 26.5 | 3.3 | 26.2 | 4.4 |
| Dietary α-tocopherol equivalents intake (mg/day) | 11.90 | 5.00 | 9.52 | 3.73 | 11.91 | 5.04 | 9.50 | 3.74 | 11.63 | 5.24 | 9.29 | 3.78 |
| Energy intake (kcal/day) | 2287 | 501 | 1736 | 378 | 2285 | 502 | 1732 | 380 | 2240 | 528 | 1695 | 395 |
| Protein intake (% energy) | 14.8 | 2.4 | 15.5 | 2.8 | ||||||||
| Calcium intake (mg/day) | 942 | 289 | 785 | 243 | 919 | 297 | 767 | 248 | ||||
| Vitamin D intake (µg/day) | 3.88 | 2.82 | 2.99 | 1.94 | 3.73 | 2.75 | 2.94 | 2.08 | ||||
| Vitamin E-containing supplement use, n (%) | 1000 | 16.0 | 2077 | 26.2 | 1024 | 15.9 | 2153 | 26.1 | 1587 | 13.9 | 3244 | 23.5 |
| Supplemental α-tocopherol equivalents (mg/day) | 37.27 | 91.86 | 35.99 | 77.52 | 37.73 | 93.61 | 35.12 | 75.72 | 35.10 | 85.16 | 35.29 | 78.73 |
| Vitamin D-containing supplement use, n (%) | 1612 | 25.0 | 2752 | 33.4 | 2551 | 22.3 | 4232 | 30.7 | ||||
| Supplemental vitamin D (μg/day) | 4.34 | 2.84 | 4.17 | 2.57 | 4.25 | 2.75 | 4.18 | 2.66 | ||||
| Calcium-containing supplement use, n (%) | 102 | 1.6 | 504 | 6.1 | 165 | 1.4 | 742 | 5.4 | ||||
| Supplemental calcium (mg/day) | 200 | 195 | 347 | 269 | 196 | 190 | 342 | 268 | ||||
| FFM (kg) | 61.6 | 5.8 | 40.6 | 4.5 | ||||||||
| FFMBMI | 2.32 | 0.26 | 1.59 | 0.26 | ||||||||
| BUA (dB/MHz) | 90.06 | 17.51 | 72.09 | 16.46 | ||||||||
| Total incident fractures, n (%) | 877 | 7.7 | 2092 | 15.2 | ||||||||
| Incident hip fractures, n (%) | 356 | 3.1 | 971 | 7.0 | ||||||||
| Incident spine fractures, n (%) | 223 | 2.0 | 357 | 2.6 | ||||||||
| Incident wrist fractures, n (%) | 155 | 1.4 | 504 | 3.6 | ||||||||
| Social class, n (%) | ||||||||||||
| Professional | 516 | 8.2 | 544 | 6.9 | 523 | 8.12 | 565 | 6.85 | 860 | 7.5 | 863 | 6.3 |
| Managerial | 2566 | 41.0 | 2919 | 36.9 | 2630 | 40.82 | 3016 | 36.55 | 4299 | 37.6 | 4722 | 34.2 |
| Skilled nonmanual | 782 | 12.5 | 1545 | 19.5 | 804 | 12.48 | 1600 | 19.39 | 1404 | 12.3 | 2684 | 19.4 |
| Skilled manual | 1401 | 22.4 | 1565 | 19.8 | 1440 | 22.35 | 1636 | 19.83 | 2840 | 24.8 | 2847 | 20.6 |
| Semiskilled | 771 | 12.3 | 937 | 11.8 | 803 | 12.46 | 1001 | 12.13 | 1501 | 13.1 | 1805 | 13.1 |
| Nonskilled | 145 | 2.3 | 262 | 3.3 | 153 | 2.37 | 282 | 3.42 | 334 | 2.9 | 536 | 3.9 |
| Missing | 85 | 1.4 | 141 | 1.8 | 90 | 1.4 | 151 | 1.83 | 189 | 1.6 | 339 | 2.5 |
| Smoking status, n (%) | ||||||||||||
| Current | 490 | 7.8 | 638 | 8.1 | 509 | 7.9 | 660 | 8.0 | 1391 | 12.2 | 1560 | 11.3 |
| Former | 3495 | 55.8 | 2547 | 32.2 | 3609 | 56.01 | 2697 | 32.69 | 6232 | 54.5 | 4446 | 32.2 |
| Never | 2281 | 36.4 | 4728 | 59.8 | 2325 | 36.09 | 4894 | 59.31 | 3804 | 33.3 | 7790 | 56.5 |
| Physical activity, n (%) | ||||||||||||
| Inactive | 1712 | 27.3 | 2043 | 25.8 | 1779 | 27.61 | 2165 | 26.24 | 3516 | 30.8 | 4174 | 30.3 |
| Moderately inactive | 1576 | 25.2 | 2575 | 32.5 | 1615 | 25.07 | 2695 | 32.66 | 2810 | 24.6 | 4429 | 32.1 |
| Moderately active | 1567 | 25.0 | 1920 | 24.3 | 1601 | 24.85 | 1980 | 24.00 | 2635 | 23.1 | 3074 | 22.3 |
| Active | 1411 | 22.5 | 1375 | 17.4 | 1448 | 22.47 | 1411 | 17.10 | 2466 | 21.6 | 2119 | 15.4 |
| Family history of osteoporosis, n (%) | ||||||||||||
| No | 6098 | 97.4 | 7413 | 93.7 | 6267 | 97.3 | 7731 | 93.7 | 11,121 | 97.3 | 12,988 | 94.1 |
| Yes | 166 | 2.6 | 500 | 6.3 | 176 | 2.7 | 520 | 6.3 | 306 | 2.7 | 808 | 5.9 |
| Corticosteroid use, n (%) | ||||||||||||
| Current or former (>3 months) | 260 | 4.2 | 402 | 5.1 | 270 | 4.2 | 422 | 5.1 | 349 | 3.0 | 478 | 3.5 |
| Never (<3 months) | 6006 | 95.8 | 7511 | 94.9 | 6173 | 95.8 | 7829 | 94.9 | 11,078 | 97.0 | 13,318 | 96.5 |
| Statin use, n (%) | ||||||||||||
| No | 5922 | 94.5 | 7623 | 96.3 | ||||||||
| Yes | 344 | 5.5 | 290 | 3.7 | ||||||||
| Menopausal status, n (%) | ||||||||||||
| Premenopausal | 472 | 6.0 | 482 | 5.8 | 233 | 16.9 | ||||||
| Perimenopausal (<1 y) | 265 | 3.4 | 272 | 3.3 | 750 | 5.4 | ||||||
| Perimenopausal (1–5 y) | 1389 | 17.6 | 1455 | 17.6 | 2473 | 17.9 | ||||||
| Postmenopausal | 5787 | 73.1 | 6042 | 73.2 | 8239 | 59.7 | ||||||
| HRT, n (%) | ||||||||||||
| Current | 1693 | 21.4 | 1757 | 21.3 | 2802 | 20.3 | ||||||
| Former | 1417 | 17.9 | 1482 | 18.0 | 1570 | 11.4 | ||||||
| Never | 4803 | 60.7 | 5012 | 60.7 | 9424 | 68.3 | ||||||
| Serum Analysis—SMM * | Serum Analysis—BUA * | Serum Analysis—Fractures † | ||||||||||
|---|---|---|---|---|---|---|---|---|---|---|---|---|
| Men (n = 2232) | Women (n = 2051) | Men (n = 2308) | Women (n = 2149) | Men (n = 3727) | Women (n = 3564) | |||||||
| Age (years) | 67.0 | 7.5 | 64.5 | 8.5 | 67.0 | 7.5 | 64.5 | 8.5 | 64.39 | 7.87 | 62.02 | 8.72 |
| BMI (kg/m2) | 26.8 | 3.0 | 26.3 | 3.7 | 27.0 | 3.4 | 26.8 | 4.3 | 26.74 | 3.33 | 26.39 | 4.20 |
| Dietary α-tocopherol equivalents intake (mg/day) | 11.35 | 4.70 | 9.30 | 3.56 | 11.38 | 4.72 | 9.28 | 3.59 | 11.02 | 4.76 | 9.12 | 3.69 |
| Serum α-tocopherol (μmol/L) | 26.44 | 7.74 | 28.39 | 8.35 | 26.47 | 7.88 | 28.42 | 8.34 | 26.36 | 7.90 | 28.53 | 8.50 |
| Serum chol-adjusted α-tocopherol (μmol/mmol) | 4.35 | 1.06 | 4.43 | 1.05 | 4.37 | 1.08 | 4.43 | 1.05 | 4.34 | 1.07 | 4.42 | 1.06 |
| Serum γ-tocopherol (μmol/L) | 1.83 | 0.90 | 1.83 | 0.91 | 1.83 | 0.90 | 1.84 | 0.93 | 1.86 | 0.90 | 1.88 | 0.94 |
| Serum chol-adjusted γ-tocopherol (μmol/mmol) | 0.30 | 0.14 | 0.28 | 0.13 | 0.30 | 0.14 | 0.29 | 0.13 | 0.31 | 0.14 | 0.29 | 0.14 |
| Serum α-tocopherol:γ-tocopherol ratio (chol-adjusted) | 17.97 | 16.27 | 20.61 | 29.31 | 17.96 | 16.53 | 20.41 | 28.73 | 17.55 | 15.29 | 19.92 | 25.35 |
| FFM (kg) | 61.31 | 5.80 | 40.45 | 4.66 | ||||||||
| FFMBMI | 2.30 | 0.25 | 1.56 | 0.25 | ||||||||
| BUA (dB/MHz) | 89.45 | 17.75 | 69.83 | 16.16 | ||||||||
| Total incident fractures, n (%) | 308 | 8.3 | 643 | 18.0 | ||||||||
| Incident hip fractures, n (%) | 129 | 3.5 | 313 | 8.8 | ||||||||
| Incident spine fractures, n (%) | 89 | 2.4 | 124 | 3.5 | ||||||||
| Incident wrist fractures, n (%) | 40 | 1.1 | 152 | 4.3 | ||||||||
| Energy intake (kcal/day) | 2217 | 488 | 1715 | 374 | 2218 | 489 | 1709 | 377 | 2161 | 502 | 1675 | 383 |
| Calcium intake (mg/day) | 924 | 283 | 780 | 250 | 900 | 283 | 764 | 249 | ||||
| Vitamin D intake (µg/day) | 3.95 | 2.72 | 3.04 | 1.97 | 3.85 | 2.71 | 3.02 | 2.21 | ||||
| Vitamin E-containing supplement use, n (%) | 350 | 15.7 | 512 | 25.0 | 360 | 15.6 | 534 | 24.8 | 503 | 13.5 | 806 | 22.6 |
| Supplemental α-tocopherol equivalents (mg/day) | 36.05 | 92.50 | 39.84 | 83.53 | 36.13 | 92.35 | 39.12 | 82.00 | 34.54 | 85.44 | 38.10 | 80.96 |
| Vitamin D-containing supplement use, n (%) | 596 | 26.7 | 657 | 32.0 | 607 | 26.3 | 682 | 31.7 | 893 | 24.0 | 1075 | 30.2 |
| Supplemental vitamin D (μg/day) | 4.35 | 2.78 | 4.30 | 2.71 | 4.35 | 2.77 | 4.35 | 2.74 | 4.27 | 2.70 | 4.25 | 2.80 |
| Calcium-containing supplement use, n (%) | 38 | 1.7 | 109 | 5.3 | 38 | 1.6 | 113 | 5.3 | 53 | 1.4 | 174 | 4.9 |
| Supplemental calcium (mg/day) | 195 | 193 | 334 | 250 | 195 | 193 | 338 | 248 | 230 | 219 | 314 | 249 |
| Social class, n (%) | ||||||||||||
| Professional | 179 | 8.02 | 114 | 5.56 | 181 | 7.84 | 120 | 5.58 | 258 | 6.92 | 192 | 5.39 |
| Managerial | 905 | 40.55 | 731 | 35.64 | 934 | 40.47 | 762 | 35.46 | 1382 | 37.08 | 1195 | 33.53 |
| Skilled nonmanual | 293 | 13.13 | 422 | 20.58 | 302 | 13.08 | 436 | 20.29 | 475 | 12.74 | 708 | 19.87 |
| Skilled manual | 493 | 22.09 | 403 | 19.65 | 509 | 22.05 | 422 | 19.64 | 926 | 24.85 | 711 | 19.95 |
| Semiskilled | 280 | 12.54 | 262 | 12.77 | 294 | 12.74 | 280 | 13.03 | 504 | 13.52 | 502 | 14.09 |
| Nonskilled | 48 | 2.15 | 68 | 3.32 | 51 | 2.21 | 76 | 3.54 | 115 | 3.09 | 145 | 4.07 |
| Missing | 34 | 1.52 | 51 | 2.49 | 37 | 1.60 | 53 | 2.47 | 67 | 1.8 | 111 | 3.11 |
| Smoking status, n (%) | ||||||||||||
| Current | 165 | 7.39 | 145 | 7.07 | 168 | 7.28 | 148 | 6.89 | 410 | 11.00 | 388 | 10.89 |
| Former | 1337 | 59.90 | 668 | 32.57 | 1394 | 60.40 | 711 | 33.09 | 2240 | 60.10 | 1171 | 32.86 |
| Never | 730 | 32.71 | 1238 | 60.36 | 746 | 32.32 | 1290 | 60.03 | 1077 | 28.90 | 2005 | 56.26 |
| Physical activity, n (%) | ||||||||||||
| Inactive | 705 | 31.59 | 581 | 28.33 | 740 | 32.06 | 614 | 28.57 | 1363 | 36.57 | 1212 | 34.01 |
| Moderately inactive | 537 | 24.06 | 678 | 33.06 | 545 | 23.61 | 714 | 33.22 | 883 | 23.69 | 1121 | 31.45 |
| Moderately active | 525 | 23.52 | 485 | 23.65 | 539 | 23.35 | 502 | 23.36 | 790 | 21.20 | 769 | 21.58 |
| Active | 465 | 20.83 | 307 | 14.97 | 484 | 20.97 | 319 | 14.84 | 691 | 18.54 | 462 | 12.96 |
| Family history of osteoporosis, n (%) | ||||||||||||
| No | 2177 | 97.58 | 1929 | 94.05 | 2249 | 97.44 | 2025 | 94.23 | 3645 | 97.8 | 3381 | 94.87 |
| Yes | 54 | 2.42 | 122 | 5.95 | 59 | 2.56 | 124 | 5.77 | 82 | 2.2 | 183 | 5.13 |
| Corticosteroid use, n (%) | ||||||||||||
| Current or former (>3 months) | 123 | 5.51 | 116 | 5.66 | 130 | 5.63 | 123 | 5.72 | 150 | 4.02 | 142 | 3.98 |
| Never (<3 months) | 2109 | 94.49 | 1935 | 94.34 | 2178 | 94.37 | 2026 | 94.28 | 3577 | 95.98 | 3422 | 96.02 |
| Menopausal status, n (%) | ||||||||||||
| Premenopausal | 31 | 1.51 | 33 | 1.54 | 287 | 8.05 | ||||||
| Perimenopausal (<1 y) | 44 | 2.15 | 44 | 2.05 | 155 | 4.35 | ||||||
| Perimenopausal (1–5 y) | 268 | 13.07 | 283 | 13.17 | 534 | 14.98 | ||||||
| Postmenopausal | 1708 | 83.28 | 1789 | 83.25 | 2588 | 72.62 | ||||||
| HRT, n (%) | ||||||||||||
| Current | 396 | 19.31 | 410 | 19.08 | 660 | 18.52 | ||||||
| Former | 348 | 16.97 | 370 | 17.22 | 390 | 10.94 | ||||||
| Never | 1307 | 63.73 | 1369 | 63.70 | 2514 | 70.54 | ||||||
| Men (n = 6266) | Dietary α-Tocopherol Equivalents Intake (mg/day) | FFM | FFMBMI | |||
|---|---|---|---|---|---|---|
| Quintile | Mean ± SD | Median | Unadjusted | Adjusted | Unadjusted | Adjusted |
| 1 (n = 1254) | 6.45 ± 1.19 | 6.72 | 60.56 ± 0.17 | 61.23 ± 0.16 | 2.25 ± 0.01 | 2.30 ± 0.01 |
| 2 (n = 1253) | 9.00 ± 0.54 | 9.03 | 61.29 ± 0.16 ** | 61.45 ± 0.14 | 2.31 ± 0.01 *** | 2.32 ± 0.01 * |
| 3 (n = 1253) | 10.93 ± 0.62 | 10.88 | 61.64 ± 0.17 *** | 61.67 ± 0.14 * | 2.32 ± 0.01 *** | 2.32 ± 0.01 * |
| 4 (n = 1253) | 13.45 ± 0.90 | 13.36 | 62.20 ± 0.16 *** | 61.86 ± 0.15 ** | 2.36 ± 0.01 *** | 2.34 ± 0.01 ** |
| 5 (n = 1253) | 19.67 ± 4.54 | 18.30 | 62.40 ± 0.16 *** | 61.86 ± 0.15 ** | 2.38 ± 0.01 *** | 2.34 ± 0.01 ** |
| Q5–Q1 diff 1 | 1.84 | 0.63 | 0.13 | 0.04 | ||
| % diff 2 | 3.04 | 1.03 | 5.78 | 1.74 | ||
| p trend | <0.001 | <0.001 | <0.001 | <0.001 | ||
| Women (n = 7913) | ||||||
| Quintile | Mean ± SD | Median | Unadjusted | Adjusted | Unadjusted | Adjusted |
| 1 (n = 1583) | 5.36 ± 0.99 | 5.58 | 39.95 ± 0.12 | 40.45 ± 0.12 | 1.52 ± 0.01 | 1.57 ± 0.01 |
| 2 (n = 1583) | 7.41 ± 0.44 | 7.42 | 40.30 ± 0.11 * | 40.47 ± 0.11 | 1.56 ± 0.01 *** | 1.57 ± 0.01 |
| 3 (n = 1582) | 8.94 ± 0.45 | 8.96 | 40.64 ± 0.11 *** | 40.65 ± 0.11 | 1.59 ± 0.01 *** | 1.59 ± 0.01 |
| 4 (n = 1583) | 10.74 ± 0.64 | 10.70 | 41.04 ± 0.11 *** | 40.80 ± 0.11 * | 1.62 ± 0.01 *** | 1.60 ± 0.01 ** |
| 5 (n = 1582) | 15.14 ± 3.55 | 14.13 | 41.31 ± 0.11 *** | 40.87 ± 0.12 * | 1.64 ± 0.01 *** | 1.60 ± 0.01 ** |
| Q5–Q1 diff 1 | 1.36 | 0.42 | 0.12 | 0.03 | ||
| % diff 2 | 3.4 | 1.04 | 7.89 | 1.91 | ||
| p trend | <0.001 | <0.001 | <0.001 | <0.001 | ||
| Men (n = 2232) | Plasma α-Tocopherol, Adjusted for Cholesterol (μmol/mmol) | FFM | FFMBMI | |||
|---|---|---|---|---|---|---|
| Quintile | Mean ± SD | Median | Unadjusted | Adjusted | Unadjusted | Adjusted |
| 1 (n = 447) | 3.17 ± 0.36 | 3.25 | 61.03 ± 0.27 | 61.13 ± 0.24 | 2.31 ± 0.01 | 2.31 ± 0.01 |
| 2 (n = 446) | 3.80 ± 0.13 | 3.80 | 61.13 ± 0.25 | 61.14 ± 0.24 | 2.31 ± 0.01 | 2.31 ± 0.01 |
| 3 (n = 447) | 4.23 ± 0.13 | 4.23 | 61.76 ± 0.28 | 61.72 ± 0.24 | 2.31 ± 0.01 | 2.32 ± 0.01 |
| 4 (n = 446) | 4.71 ± 0.15 | 4.70 | 61.24 ± 0.28 | 61.31 ± 0.24 | 2.31 ± 0.01 | 2.31 ± 0.01 |
| 5 (n = 446) | 5.86 ± 1.14 | 5.47 | 61.36 ± 0.29 | 61.23 ± 0.24 | 2.28 ± 0.01 * | 2.28 ± 0.01 |
| Q5-Q1 diff 1 | 0.33 | 0.10 | −0.03 | −0.03 | ||
| % diff 2 | 0.54 | 0.16 | −1.30 | −1.30 | ||
| p trend | 0.413 | <0.001 | 0.039 | <0.001 | ||
| Women (n = 2051) | Plasma α-Tocopherol, Adjusted for Cholesterol (μmol/mmol) | FFM | FFMBMI | |||
| Quintile | Mean ± SD | Median | Unadjusted | Adjusted | Unadjusted | Adjusted |
| 1 (n = 411) | 3.22 ± 0.39 | 3.32 | 40.41 ± 0.24 | 40.48 ± 0.23 | 1.58 ± 0.01 | 1.58 ± 0.01 |
| 2 (n = 410) | 3.86 ± 0.13 | 3.87 | 40.19 ± 0.23 | 40.22 ± 0.23 | 1.56 ± 0.01 | 1.56 ± 0.01 |
| 3 (n = 410) | 4.31 ± 0.13 | 4.30 | 40.34 ± 0.24 | 40.33 ± 0.23 | 1.54 ± 0.01 * | 1.54 ± 0.01 * |
| 4 (n = 410) | 4.79 ± 0.16 | 4.79 | 40.75 ± 0.22 | 40.70 ± 0.23 | 1.57 ± 0.01 | 1.57 ± 0.01 |
| 5 (n = 410) | 5.96 ± 1.03 | 5.61 | 40.58 ± 0.23 | 40.53 ± 0.23 | 1.55 ± 0.01 | 1.55 ± 0.01 |
| Q5-Q1 diff 1 | 0.17 | 0.05 | −0.03 | −0.03 | ||
| % diff 2 | 0.42 | 0.12 | −1.90 | −1.90 | ||
| p trend | 0.251 | 0.006 | 0.239 | <0.001 | ||
| Men (n = 2232) | Plasma γ-Tocopherol, Adjusted for Cholesterol (μmol/mmol) | FFM | FFMBMI | |||
| Quintile | Mean ± SD | Median | Unadjusted | Adjusted | Unadjusted | Adjusted |
| 1 (n = 447) | 0.15 ± 0.04 | 0.16 | 60.78 ± 0.28 | 60.94 ± 0.24 | 2.32 ± 0.01 | 2.32 ± 0.01 |
| 2 (n = 446) | 0.22 ± 0.01 | 0.22 | 60.96 ± 0.26 | 61.29 ± 0.24 | 2.33 ± 0.01 | 2.32 ± 0.01 |
| 3 (n = 447) | 0.28 ± 0.02 | 0.28 | 61.27 ± 0.28 | 61.24 ± 0.24 | 2.30 ± 0.01 | 2.30 ± 0.01 |
| 4 (n = 446) | 0.34 ± 0.02 | 0.34 | 61.58 ± 0.27 * | 61.53 ± 0.24 | 2.30 ± 0.01 | 2.31 ± 0.01 |
| 5 (n = 446) | 0.51 ± 0.14 | 0.47 | 61.94 ± 0.27 ** | 61.52 ± 0.24 | 2.27 ± 0.01 ** | 2.27 ± 0.01 ** |
| Q5-Q1 diff 1 | 1.16 | 0.58 | −0.05 | −0.05 | ||
| % diff 2 | 1.91 | 0.95 | −2.16 | −2.16 | ||
| p trend | 0.0007 | p < 0.0001 | 0.0009 | p < 0.0001 | ||
| Women (n = 2051) | Plasma γ-Tocopherol, Adjusted for Cholesterol (μmol/mmol) | FFM | FFMBMI | |||
| Quintile | Mean ± SD | Median | Unadjusted | Adjusted | Unadjusted | Adjusted |
| 1 (n = 411) | 0.14 ± 0.04 | 0.14 | 39.94 ± 0.22 | 39.93 ± 0.23 | 1.58 ± 0.01 | 1.58 ± 0.01 |
| 2 (n = 410) | 0.21 ± 0.02 | 0.21 | 40.40 ± 0.24 | 40.39 ± 0.23 | 1.58 ± 0.01 | 1.58 ± 0.01 |
| 3 (n = 410) | 0.26 ± 0.02 | 0.26 | 40.50 ± 0.23 | 40.52 ± 0.23 | 1.57 ± 0.01 | 1.57 ± 0.01 |
| 4 (n = 410) | 0.33 ± 0.02 | 0.33 | 40.81 ± 0.23 ** | 40.82 ± 0.23 ** | 1.54 ± 0.01 * | 1.54 ± 0.01 * |
| 5 (n = 410) | 0.48 ± 0.12 | 0.44 | 40.62 ± 0.23 * | 40.61 ± 0.23 * | 1.54 ± 0.01 ** | 1.54 ± 0.01 ** |
| Q5-Q1 diff 1 | 0.68 | 0.68 | −0.04 | −0.04 | ||
| % diff2 | 1.70 | 1.70 | −2.53 | −2.53 | ||
| p trend | 0.0254 | 0.0017 | 0.0013 | p < 0.0001 | ||
| Men (n = 2232) | Plasma α:γ-Tocopherol Ratio, Adjusted for Cholesterol | FFM | FFMBMI | |||
| Quintile | Mean ± SD | Median | Unadjusted | Adjusted | Unadjusted | Adjusted |
| 1 (n = 447) | 8.73 ± 1.48 | 8.99 | 62.22 ± 0.27 | 61.93 ± 0.24 | 2.29 ± 0.01 | 2.29 ± 0.01 |
| 2 (n = 446) | 12.13 ± 0.82 | 12.15 | 61.04 ± 0.26 ** | 60.97 ± 0.24 ** | 2.29 ± 0.01 | 2.29 ± 0.01 |
| 3 (n = 447) | 15.04 ± 0.90 | 14.96 | 61.37 ± 0.28 * | 61.39 ± 0.24 | 2.32 ± 0.01 | 2.32 ± 0.01 |
| 4 (n = 446) | 19.01 ± 1.46 | 18.87 | 61.11 ± 0.27 ** | 61.24 ± 0.24 * | 2.31 ± 0.01 | 2.31 ± 0.01 |
| 5 (n = 446) | 34.97 ± 30.04 | 26.65 | 60.78 ± 0.28 *** | 61.00 ± 0.24 ** | 2.31 ± 0.01 | 2.31 ± 0.01 |
| Q5-Q1 diff 1 | −1.44 | −0.93 | 0.02 | 0.02 | ||
| % diff 2 | −2.31 | −1.50 | 0.87 | 0.87 | ||
| p trend | 0.002 | p < 0.001 | 0.109 | p < 0.001 | ||
| Women (n = 2051) | Plasma α:γ-Tocopherol Ratio, Adjusted for Cholesterol | FFM | FFMBMI | |||
| Quintile | Mean ± SD | Median | Unadjusted | Adjusted | Unadjusted | Adjusted |
| 1 (n = 411) | 9.11 ± 1.60 | 9.44 | 40.51 ± 0.23 | 40.53 ± 0.23 | 1.54 ± 0.01 | 1.54 ± 0.01 |
| 2 (n = 410) | 12.74 ± 0.90 | 12.78 | 40.87 ± 0.23 | 40.88 ± 0.23 | 1.55 ± 0.01 | 1.55 ± 0.01 |
| 3 (n = 410) | 15.92 ± 1.04 | 15.83 | 40.37 ± 0.23 | 40.39 ± 0.23 | 1.55 ± 0.01 | 1.55 ± 0.01 |
| 4 (n = 410) | 20.47 ± 1.74 | 20.31 | 40.30 ± 0.23 | 40.27 ± 0.23 | 1.59 ± 0.01 ** | 1.59 ± 0.01 ** |
| 5 (n = 410) | 44.84 ± 50.09 | 31.67 | 40.22 ± 0.22 | 40.20 ± 0.23 | 1.58 ± 0.01 * | 1.58 ± 0.01 * |
| Q5-Q1 diff 1 | −0.29 | −0.33 | 0.04 | 0.04 | ||
| % diff 2 | −0.72 | −0.81 | 2.60 | 2.60 | ||
| p trend | 0.133 | 0.003 | 0.003 | p < 0.001 | ||
| Men (n = 6443) | Dietary α-Tocopherol Equivalents Intake (mg/day) | BUA | ||
|---|---|---|---|---|
| Quintile | Mean ± SD | Median | Unadjusted | Adjusted |
| 1 (n = 1289) | 6.45 ± 1.19 | 6.71 | 88.73 ± 0.50 | 89.03 ± 0.52 |
| 2 (n = 1289) | 8.99 ± 0.53 | 9.01 | 90.06 ± 0.48 | 90.07 ± 0.49 |
| 3 (n = 1288) | 10.93 ± 0.63 | 10.89 | 90.64 ± 0.48 ** | 90.64 ± 0.48 * |
| 4 (n = 1289) | 13.46 ± 0.90 | 13.38 | 90.51 ± 0.49 * | 90.39 ± 0.49 |
| 5 (n = 1288) | 19.71 ± 4.63 | 18.30 | 90.34 ± 0.49 * | 90.15 ± 0.52 |
| Q5-Q1 diff 1 | 1.61 | 1.12 | ||
| % diff 2 | 1.81 | 1.26 | ||
| p trend | 0.044 | <0.001 | ||
| Women (n = 8251) | ||||
| Quintile | Mean ± SD | Median | Unadjusted | Adjusted |
| 1 (n = 1651) | 5.33 ± 0.98 | 5.54 | 70.85 ± 0.41 | 71.84 ± 0.39 |
| 2 (n = 1650) | 7.38 ± 0.44 | 7.38 | 71.66 ± 0.40 | 72.16 ± 0.35 |
| 3 (n = 1650) | 8.91 ± 0.46 | 8.93 | 71.13 ± 0.40 | 71.53 ± 0.35 |
| 4 (n = 1650) | 10.72 ± 0.64 | 10.68 | 73.23 ± 0.41 *** | 72.45 ± 0.35 |
| 5 (n = 1650) | 15.13 ± 3.56 | 14.12 | 73.57 ± 0.41 *** | 72.47 ± 0.38 |
| Q5–Q1 diff 1 | 2.72 | 0.63 | ||
| % diff 2 | 3.84 | 0.88 | ||
| p trend | <0.001 | <0.001 | ||
| Men (n = 2308) | Plasma α-Tocopherol, Adjusted for Cholesterol (μmol/mmol) | BUA | ||
|---|---|---|---|---|
| Quintile | Mean ± SD | Median | Unadjusted | Adjusted |
| 1 (n = 462) | 3.17 ± 0.36 | 3.26 | 88.97 ± 0.82 | 89.11 ± 0.82 |
| 2 (n = 462) | 3.80 ± 0.13 | 3.80 | 89.01 ± 0.81 | 88.87 ± 0.82 |
| 3 (n = 461) | 4.24 ± 0.13 | 4.24 | 89.22 ± 0.83 | 89.01 ± 0.82 |
| 4 (n = 462) | 4.72 ± 0.15 | 4.70 | 89.84 ± 0.83 | 89.84 ± 0.82 |
| 5 (n = 461) | 5.90 ± 1.20 | 5.50 | 90.19 ± 0.84 | 90.38 ± 0.83 |
| Q5–Q1 diff 1 | 1.22 | 1.27 | ||
| % diff 2 | 1.37 | 1.42 | ||
| p trend | 0.209 | <0.001 | ||
| Women (n = 2149) | Plasma α-Tocopherol, Adjusted for Cholesterol (μmol/mmol) | BUA | ||
| Quintile | Mean ± SD | Median | Unadjusted | Adjusted |
| 1 (n = 430) | 3.22 ± 0.41 | 3.33 | 68.74 ± 0.81 | 69.29 ± 0.66 |
| 2 (n = 430) | 3.86 ± 0.13 | 3.87 | 69.22 ± 0.79 | 69.47 ± 0.66 |
| 3 (n = 430) | 4.31 ± 0.13 | 4.30 | 69.38 ± 0.72 | 69.25 ± 0.66 |
| 4 (n = 430) | 4.80 ± 0.16 | 4.80 | 70.86 ± 0.78 | 70.72 ± 0.66 |
| 5 (n = 429) | 5.96 ± 1.02 | 5.63 | 70.95 ± 0.78 * | 70.44 ± 0.67 |
| Q5–Q1 diff 1 | 2.21 | 1.15 | ||
| % diff 2 | 3.22 | 1.66 | ||
| p trend | 0.015 | <0.001 | ||
| Men (n = 2308) | Plasma γ-Tocopherol, Adjusted for Cholesterol (μmol/mmol) | BUA | ||
| Quintile | Mean ± SD | Median | Unadjusted | Adjusted |
| 1 (n = 462) | 0.15 ± 0.04 | 0.16 | 88.93 ± 0.79 | 88.68 ± 0.83 |
| 2 (n = 462) | 0.22 ± 0.02 | 0.23 | 89.16 ± 0.86 | 89.09 ± 0.82 |
| 3 (n = 461) | 0.28 ± 0.02 | 0.28 | 89.10 ± 0.84 | 88.94 ± 0.82 |
| 4 (n = 462) | 0.35 ± 0.02 | 0.34 | 89.50 ± 0.82 | 89.80 ± 0.82 |
| 5 (n = 461) | 0.51 ± 0.14 | 0.47 | 90.54 ± 0.82 | 90.69 ± 0.82 |
| Q5–Q1 diff 1 | 1.61 | 2.01 | ||
| % diff 2 | 1.81 | 2.27 | ||
| p trend | 0.141 | p < 0.001 | ||
| Women (n = 2149) | Plasma γ-Tocopherol, Adjusted for Cholesterol (μmol/mmol) | BUA | ||
| Quintile | Mean ± SD | Median | Unadjusted | Adjusted |
| 1 (n = 430) | 0.14 ± 0.04 | 0.14 | 69.45 ± 0.79 | 68.46 ± 0.67 |
| 2 (n = 430) | 0.21 ± 0.02 | 0.21 | 69.22 ± 0.78 | 68.86 ± 0.66 |
| 3 (n = 430) | 0.27 ± 0.02 | 0.26 | 68.93 ± 0.78 | 69.03 ± 0.66 |
| 4 (n = 430) | 0.33 ± 0.02 | 0.33 | 70.34 ± 0.76 | 70.69 ± 0.66 |
| 5 (n = 429) | 0.49 ± 0.13 | 0.44 | 71.21 ± 0.78 | 72.12 ± 0.66 |
| Q5–Q1 diff 1 | 1.76 | 3.66 | ||
| % diff 2 | 2.53 | 5.35 | ||
| p trend | 0.046 | p < 0.001 | ||
| Men (n = 2308) | Plasma α:γ-Tocopherol Ratio, Adjusted for Cholesterol | BUA | ||
| Quintile | Mean ± SD | Median | Unadjusted | Adjusted |
| 1 (n = 462) | 8.73 ± 1.46 | 9.00 | 89.44 ± 0.82 | 89.67 ± 0.83 |
| 2 (n = 462) | 12.10 ± 0.82 | 10.70 | 89.56 ± 0.81 | 89.67 ± 0.82 |
| 3 (n = 461) | 14.97 ± 0.88 | 13.51 | 89.78 ± 0.85 | 89.76 ± 0.82 |
| 4 (n = 462) | 18.91 ± 1.45 | 16.59 | 89.51 ± 0.82 | 89.31 ± 0.82 |
| 5 (n = 461) | 35.15 ± 30.64 | 21.69 | 88.95 ± 0.82 | 88.79 ± 0.83 |
| Q5–Q1 diff 1 | −0.49 | −0.88 | ||
| % diff 2 | −0.55 | −0.98 | ||
| p trend | 0.602 | p < 0.001 | ||
| Women (n = 2149) | Plasma α:γ-Tocopherol Ratio, Adjusted for Cholesterol | BUA | ||
| Quintile | Mean ± SD | Median | Unadjusted | Adjusted |
| 1 (n = 430) | 9.06 ± 1.62 | 9.42 | 70.31 ± 0.79 | 71.02 ± 0.66 |
| 2 (n = 430) | 12.67 ± 0.90 | 12.75 | 70.03 ± 0.74 | 70.97 ± 0.66 |
| 3 (n = 430) | 15.81 ± 1.02 | 15.75 | 69.32 ± 0.78 | 69.31 ± 0.66 |
| 4 (n = 430) | 20.35 ± 1.76 | 20.13 | 69.68 ± 0.80 | 69.10 ± 0.66 |
| 5 (n = 429) | 44.22 ± 57.93 | 31.23 | 69.81 ± 0.79 | 68.74 ± 0.68 |
| Q5–Q1 diff 1 | −0.50 | −2.28 | ||
| % diff 2 | −0.71 | −3.21 | ||
| p trend | 0.731 | p < 0.001 | ||
| Men (n = 11,427) | Total Fractures | Hip Fracture | Spine Fracture | Wrist Fracture | |||||||||||||||||||
|---|---|---|---|---|---|---|---|---|---|---|---|---|---|---|---|---|---|---|---|---|---|---|---|
| N | Mean | SD | Median | Incidence | HR | 95% CI | Incidence | HR | 95% CI | Incidence | HR | 95% CI | Incidence | HR | 95% CI | ||||||||
| Dietary α-tocopherol equivalents intake (mg/day) | Q1 | 2286 | 5.95 | 1.25 | 6.23 | 188/2286 | 1.00 | Ref. | 80/2286 | 1.00 | Ref. | 49/2286 | 1.00 | Ref. | 33/2286 | 1.00 | Ref. | ||||||
| Q2 | 2285 | 8.65 | 0.59 | 8.67 | 161/2285 | 0.79 * | 0.64 | 0.98 | 74/2285 | 0.89 | 0.64 | 1.23 | 47/2285 | 0.94 | 0.62 | 1.41 | 20/2285 | 0.51 * | 0.29 | 0.90 | |||
| Q3 | 2286 | 10.65 | 0.61 | 10.62 | 176/2286 | 0.94 | 0.76 | 1.17 | 62/2286 | 0.86 | 0.61 | 1.22 | 49/2286 | 1.10 | 0.73 | 1.67 | 32/2286 | 0.80 | 0.48 | 1.34 | |||
| Q4 | 2285 | 13.22 | 0.92 | 13.11 | 158/2285 | 0.86 | 0.68 | 1.08 | 72/2285 | 1.08 | 0.76 | 1.53 | 33/2285 | 0.77 | 0.48 | 1.24 | 38/2285 | 0.88 | 0.53 | 1.47 | |||
| Q5 | 2285 | 19.71 | 4.92 | 18.22 | 194/2285 | 1.06 | 0.84 | 1.34 | 68/2285 | 1.05 | 0.73 | 1.52 | 45/2285 | 1.09 | 0.68 | 1.75 | 32/2285 | 0.68 | 0.38 | 1.19 | |||
| 877/11,427 | 356/11,427 | 223/11,427 | 155/11,427 | ||||||||||||||||||||
| p trend | p < 0.001 | p < 0.001 | 0.21 | 0.11 | |||||||||||||||||||
| Women (n = 13,796) | Total Fractures | Hip Fracture | Spine Fracture | Wrist Fracture | |||||||||||||||||||
| N | Mean | SD | Median | Incidence | HR | 95% CI | Incidence | HR | 95% CI | Incidence | HR | 95% CI | Incidence | HR | 95% CI | ||||||||
| Dietary α-tocopherol equivalents intake (mg/day) | Q1 | 2760 | 5.04 | 1.03 | 5.25 | 479/2760 | 1.00 | Ref. | 228/2760 | 1.00 | Ref. | 89/2760 | 1.00 | Ref. | 108/2760 | 1.00 | Ref. | ||||||
| Q2 | 2759 | 7.14 | 0.45 | 7.15 | 438/2759 | 0.93 | 0.81 | 1.06 | 177/2759 | 0.81 * | 0.66 | 0.99 | 80/2759 | 0.94 | 0.68 | 1.28 | 104/2759 | 1.05 | 0.80 | 1.39 | |||
| Q3 | 2759 | 8.70 | 0.46 | 8.68 | 427/2759 | 0.93 | 0.81 | 1.07 | 212/2759 | 1.04 | 0.85 | 1.27 | 63/2759 | 0.77 | 0.55 | 1.09 | 102/2759 | 1.08 | 0.81 | 1.44 | |||
| Q4 | 2759 | 10.55 | 0.66 | 10.50 | 377/2759 | 0.88 | 0.76 | 1.02 | 175/2759 | 0.93 | 0.75 | 1.16 | 67/2759 | 0.90 | 0.63 | 1.28 | 104/2759 | 1.20 | 0.89 | 1.63 | |||
| Q5 | 2759 | 15.01 | 3.48 | 14.01 | 371/2759 | 0.90 | 0.77 | 1.06 | 179/2759 | 1.02 | 0.81 | 1.29 | 58/2759 | 0.82 | 0.55 | 1.21 | 86/2759 | 1.07 | 0.77 | 1.50 | |||
| 2092/13,796 | 971/13,796 | 357/13,796 | 504/13,796 | ||||||||||||||||||||
| p trend | p < 0.001 | p < 0.001 | 0.09 | p < 0.01 | |||||||||||||||||||
| Men (n = 3727) | Total Fractures | Hip Fractures | Spine Fractures | Wrist Fractures | |||||||||||||||
|---|---|---|---|---|---|---|---|---|---|---|---|---|---|---|---|---|---|---|---|
| Mean | SD | Median | Incidence | HR | 95% CI | Incidence | HR | 95% CI | Incidence | HR | 95% CI | Incidence | HR | 95% CI | |||||
| Plasma α-tocopherol, adjusted for cholesterol (μmol/mmol) | 3.13 | 0.39 | 3.23 | 67/746 | 1.00 | Ref. | 31/746 | 1.00 | Ref. | 20/746 | 1.00 | Ref. | 4/746 | 1.00 | Ref. | ||||
| 3.79 | 0.13 | 3.79 | 52/745 | 0.79 | 0.54 | 1.13 | 20/745 | 0.62 | 0.35 | 1.11 | 16/745 | 0.84 | 0.43 | 1.62 | 10/745 | 2.41 | 0.75 | 7.72 | |
| 4.22 | 0.13 | 4.22 | 61/746 | 0.90 | 0.63 | 1.27 | 25/746 | 0.82 | 0.48 | 1.39 | 18/746 | 0.87 | 0.46 | 1.65 | 10/746 | 2.29 | 0.71 | 7.35 | |
| 4.70 | 0.16 | 4.69 | 65/745 | 0.88 | 0.63 | 1.24 | 27/745 | 0.78 | 0.47 | 1.32 | 17/745 | 0.78 | 0.41 | 1.50 | 8/745 | 1.76 | 0.52 | 5.87 | |
| 5.88 | 1.12 | 5.51 | 63/745 | 0.86 | 0.61 | 1.23 | 26/745 | 0.79 | 0.46 | 1.35 | 18/745 | 0.81 | 0.42 | 1.56 | 8/745 | 1.79 | 0.53 | 6.05 | |
| p trend | 0.028 | 0.007 | 0.460 | 0.787 | |||||||||||||||
| Plasma γ-tocopherol, adjusted for cholesterol (μmol/mmol) | 0.15 | 0.04 | 0.16 | 60/746 | 1.00 | Ref. | 23/746 | 1.00 | Ref. | 20/746 | 1.00 | Ref. | 7/746 | 1.00 | Ref. | ||||
| 0.23 | 0.02 | 0.23 | 52/745 | 0.85 | 0.58 | 1.24 | 24/745 | 1.03 | 0.58 | 1.85 | 13/745 | 0.63 | 0.31 | 1.28 | 9/745 | 1.25 | 0.46 | 3.39 | |
| 0.28 | 0.02 | 0.28 | 61/746 | 0.97 | 0.68 | 1.40 | 27/746 | 1.09 | 0.62 | 1.94 | 21/746 | 1.00 | 0.54 | 1.85 | 6/746 | 0.83 | 0.28 | 2.53 | |
| 0.35 | 0.02 | 0.35 | 75/745 | 1.21 | 0.85 | 1.71 | 30/745 | 1.22 | 0.69 | 2.14 | 21/745 | 0.98 | 0.53 | 1.83 | 9/745 | 1.28 | 0.47 | 3.49 | |
| 0.52 | 0.13 | 0.48 | 60/745 | 0.94 | 0.65 | 1.37 | 25/745 | 1.04 | 0.57 | 1.86 | 14/745 | 0.60 | 0.29 | 1.22 | 9/745 | 1.31 | 0.47 | 3.63 | |
| p trend | 0.029 | 0.008 | 0.425 | 0.776 | |||||||||||||||
| Plasma α-tocopherol:γ-tocopherol ratio, adjusted for cholesterol | 8.56 | 1.43 | 8.87 | 60/746 | 1.00 | Ref. | 28/746 | 1.00 | Ref. | 13/746 | 1.00 | Ref. | 7/746 | 1.00 | Ref. | ||||
| 11.90 | 0.77 | 11.93 | 64/745 | 1.00 | 0.70 | 1.42 | 31/745 | 0.94 | 0.56 | 1.57 | 19/745 | 1.53 | 0.74 | 3.17 | 5/745 | 0.67 | 0.21 | 2.12 | |
| 14.71 | 0.87 | 14.66 | 76/746 | 1.18 | 0.84 | 1.66 | 28/746 | 0.85 | 0.50 | 1.45 | 25/746 | 2.00* | 1.00 | 4.00 | 11/746 | 1.42 | 0.55 | 3.68 | |
| 18.53 | 1.39 | 18.40 | 50/745 | 0.86 | 0.59 | 1.26 | 15/745 | 0.55 | 0.29 | 1.04 | 19/745 | 1.65 | 0.79 | 3.43 | 8/745 | 1.13 | 0.40 | 3.16 | |
| 34.08 | 27.74 | 25.88 | 58/745 | 0.96 | 0.66 | 1.40 | 27/745 | 0.96 | 0.55 | 1.68 | 13/745 | 1.09 | 0.49 | 2.44 | 9/745 | 1.24 | 0.44 | 3.45 | |
| p trend | 0.027 | 0.007 | 0.490 | 0.765 | |||||||||||||||
| Women (n = 3564) | Total Fractures | Hip Fractures | Spine Fracture | Wrist Fracture | |||||||||||||||
| Mean | SD | Median | Incidence | HR | 95% CI | Incidence | HR | 95% CI | Incidence | HR | 95% CI | Incidence | HR | 95% CI | |||||
| Plasma α-tocopherol, adjusted for cholesterol (μmol/mmol) | 3.20 | 0.42 | 3.32 | 138/713 | 1.00 | Ref. | 66/713 | 1.00 | Ref. | 24/713 | 1.00 | Ref. | 37/713 | 1.00 | Ref. | ||||
| 3.86 | 0.13 | 3.86 | 124/713 | 0.87 | 0.68 | 1.11 | 66/713 | 0.99 | 0.70 | 1.39 | 25/713 | 1.05 | 0.60 | 1.84 | 26/713 | 0.67 | 0.40 | 1.12 | |
| 4.30 | 0.12 | 4.29 | 125/713 | 0.98 | 0.77 | 1.25 | 62/713 | 1.08 | 0.76 | 1.52 | 23/713 | 1.04 | 0.58 | 1.84 | 34/713 | 0.98 | 0.61 | 1.56 | |
| 4.78 | 0.17 | 4.77 | 132/713 | 1.03 | 0.81 | 1.31 | 56/713 | 0.93 | 0.65 | 1.33 | 27/713 | 1.20 | 0.69 | 2.10 | 36/713 | 1.04 | 0.65 | 1.65 | |
| 5.97 | 1.04 | 5.61 | 124/712 | 0.94 | 0.73 | 1.20 | 63/712 | 1.04 | 0.73 | 1.49 | 25/712 | 1.03 | 0.57 | 1.85 | 19/712 | 0.56 * | 0.32 | 0.98 | |
| p trend | 0.010 | 0.013 | 0.665 | 0.075 | |||||||||||||||
| Plasma γ-tocopherol, adjusted for cholesterol (μmol/mmol) | 0.14 | 0.04 | 0.15 | 125/713 | 1.00 | Ref. | 62/713 | 1.00 | Ref. | 26/713 | 1.00 | Ref. | 32/713 | 1.00 | Ref. | ||||
| 0.21 | 0.02 | 0.21 | 132/713 | 1.11 | 0.87 | 1.42 | 60/713 | 1.01 | 0.71 | 1.45 | 23/713 | 0.91 | 0.52 | 1.62 | 31/713 | 1.04 | 0.63 | 1.71 | |
| 0.27 | 0.02 | 0.27 | 125/713 | 1.09 | 0.84 | 1.40 | 57/713 | 0.97 | 0.67 | 1.41 | 29/713 | 1.13 | 0.65 | 1.96 | 33/713 | 1.17 | 0.71 | 1.92 | |
| 0.33 | 0.02 | 0.33 | 143/713 | 1.29 * | 1.01 | 1.65 | 76/713 | 1.36 | 0.96 | 1.93 | 28/713 | 1.20 | 0.69 | 2.09 | 30/713 | 1.04 | 0.62 | 1.75 | |
| 0.50 | 0.13 | 0.46 | 118/712 | 1.07 | 0.82 | 1.39 | 58/712 | 1.05 | 0.72 | 1.52 | 18/712 | 0.75 | 0.40 | 1.40 | 26/712 | 1.00 | 0.58 | 1.70 | |
| p trend | 0.009 | 0.011 | 0.486 | 0.108 | |||||||||||||||
| Plasma α-tocopherol:γ-tocopherol ratio, adjusted for cholesterol | 8.91 | 1.66 | 9.30 | 131/713 | 1.00 | Ref. | 69/713 | 1.00 | Ref. | 23/713 | 1.00 | Ref. | 29/713 | 1.00 | Ref. | ||||
| 12.53 | 0.89 | 12.58 | 130/713 | 0.96 | 0.76 | 1.23 | 70/713 | 1.01 | 0.72 | 1.41 | 23/713 | 1.02 | 0.57 | 1.83 | 23/713 | 0.73 | 0.42 | 1.28 | |
| 15.64 | 0.99 | 15.56 | 123/713 | 0.90 | 0.70 | 1.15 | 43/713 | 0.61 * | 0.41 | 0.89 | 29/713 | 1.30 | 0.75 | 2.26 | 42/713 | 1.40 | 0.87 | 2.26 | |
| 20.06 | 1.70 | 19.87 | 138/713 | 0.98 | 0.77 | 1.25 | 71/713 | 0.97 | 0.69 | 1.36 | 25/713 | 1.02 | 0.57 | 1.82 | 31/713 | 0.93 | 0.56 | 1.56 | |
| 42.51 | 50.07 | 30.12 | 121/712 | 0.84 | 0.65 | 1.10 | 60/712 | 0.83 | 0.58 | 1.19 | 24/712 | 0.97 | 0.53 | 1.79 | 27/712 | 0.84 | 0.48 | 1.44 | |
| p trend | 0.007 | 0.011 | 0.507 | 0.099 | |||||||||||||||
| Measure of Interest | Dietary α-Tocopherol Equivalents Intake (mg/day) | % Difference 1 | Serum Cholesterol-Adjusted α-Tocopherol (μmol/mmol) | % Difference 1 | Serum Cholesterol-Adjusted γ-Tocopherol (μmol/mmol) | % Difference 1 | Serum Cholesterol-Adjusted α-tocopherol:γ-Tocopherol Ratio | % Difference 1 | |
|---|---|---|---|---|---|---|---|---|---|
| FFM | Men | positive *** | 1.03 | positive *** | 0.16 | positive *** | 0.95 | negative *** | −1.50 |
| Women | positive *** | 1.04 | positive ** | 0.12 | positive ** | 1.70 | negative ** | −0.81 | |
| FFMBMI | Men | positive *** | 1.74 | negative *** | −1.30 | negative *** | −2.16 | positive *** | 0.87 |
| Women | positive *** | 1.91 | negative *** | −1.90 | negative *** | −2.53 | positive *** | 2.60 | |
| BUA | Men | positive *** | 1.26 | positive *** | 1.42 | positive *** | 2.27 | negative *** | −0.98 |
| Women | positive *** | 0.88 | positive *** | 1.66 | positive *** | 5.35 | negative *** | −3.21 | |
| Total fracture risk 2 | Men | positive *** | positive * | positive * | positive * | ||||
| Women | positive *** | positive * | negative ** | positive ** | |||||
| Hip fracture risk 2 | Men | positive *** | positive ** | negative ** | positive ** | ||||
| Women | positive *** | positive * | negative * | positive * | |||||
| Spine fracture risk 2 | Men | N.S. | N.S. | N.S. | N.S. | ||||
| Women | N.S. | N.S. | N.S. | N.S. | |||||
| Wrist fracture risk 2 | Men | N.S. | N.S. | N.S. | N.S. | ||||
| Women | negative ** | N.S. | N.S. | N.S. | |||||
Publisher’s Note: MDPI stays neutral with regard to jurisdictional claims in published maps and institutional affiliations. |
© 2021 by the authors. Licensee MDPI, Basel, Switzerland. This article is an open access article distributed under the terms and conditions of the Creative Commons Attribution (CC BY) license (http://creativecommons.org/licenses/by/4.0/).
Share and Cite
Mulligan, A.A.; Hayhoe, R.P.G.; Luben, R.N.; Welch, A.A. Positive Associations of Dietary Intake and Plasma Concentrations of Vitamin E with Skeletal Muscle Mass, Heel Bone Ultrasound Attenuation and Fracture Risk in the EPIC-Norfolk Cohort. Antioxidants 2021, 10, 159. https://doi.org/10.3390/antiox10020159
Mulligan AA, Hayhoe RPG, Luben RN, Welch AA. Positive Associations of Dietary Intake and Plasma Concentrations of Vitamin E with Skeletal Muscle Mass, Heel Bone Ultrasound Attenuation and Fracture Risk in the EPIC-Norfolk Cohort. Antioxidants. 2021; 10(2):159. https://doi.org/10.3390/antiox10020159
Chicago/Turabian StyleMulligan, Angela A., Richard P. G. Hayhoe, Robert N. Luben, and Ailsa A. Welch. 2021. "Positive Associations of Dietary Intake and Plasma Concentrations of Vitamin E with Skeletal Muscle Mass, Heel Bone Ultrasound Attenuation and Fracture Risk in the EPIC-Norfolk Cohort" Antioxidants 10, no. 2: 159. https://doi.org/10.3390/antiox10020159
APA StyleMulligan, A. A., Hayhoe, R. P. G., Luben, R. N., & Welch, A. A. (2021). Positive Associations of Dietary Intake and Plasma Concentrations of Vitamin E with Skeletal Muscle Mass, Heel Bone Ultrasound Attenuation and Fracture Risk in the EPIC-Norfolk Cohort. Antioxidants, 10(2), 159. https://doi.org/10.3390/antiox10020159