
1,5-Benzodiazepin-2(3H)-ones: In Vitro Evaluation as Antiparkinsonian Agents

 ,
,  , ,
, ,  and
and 
Abstract
:1. Introduction
2. Materials and Methods
2.1. General
2.2. NMR Parameters
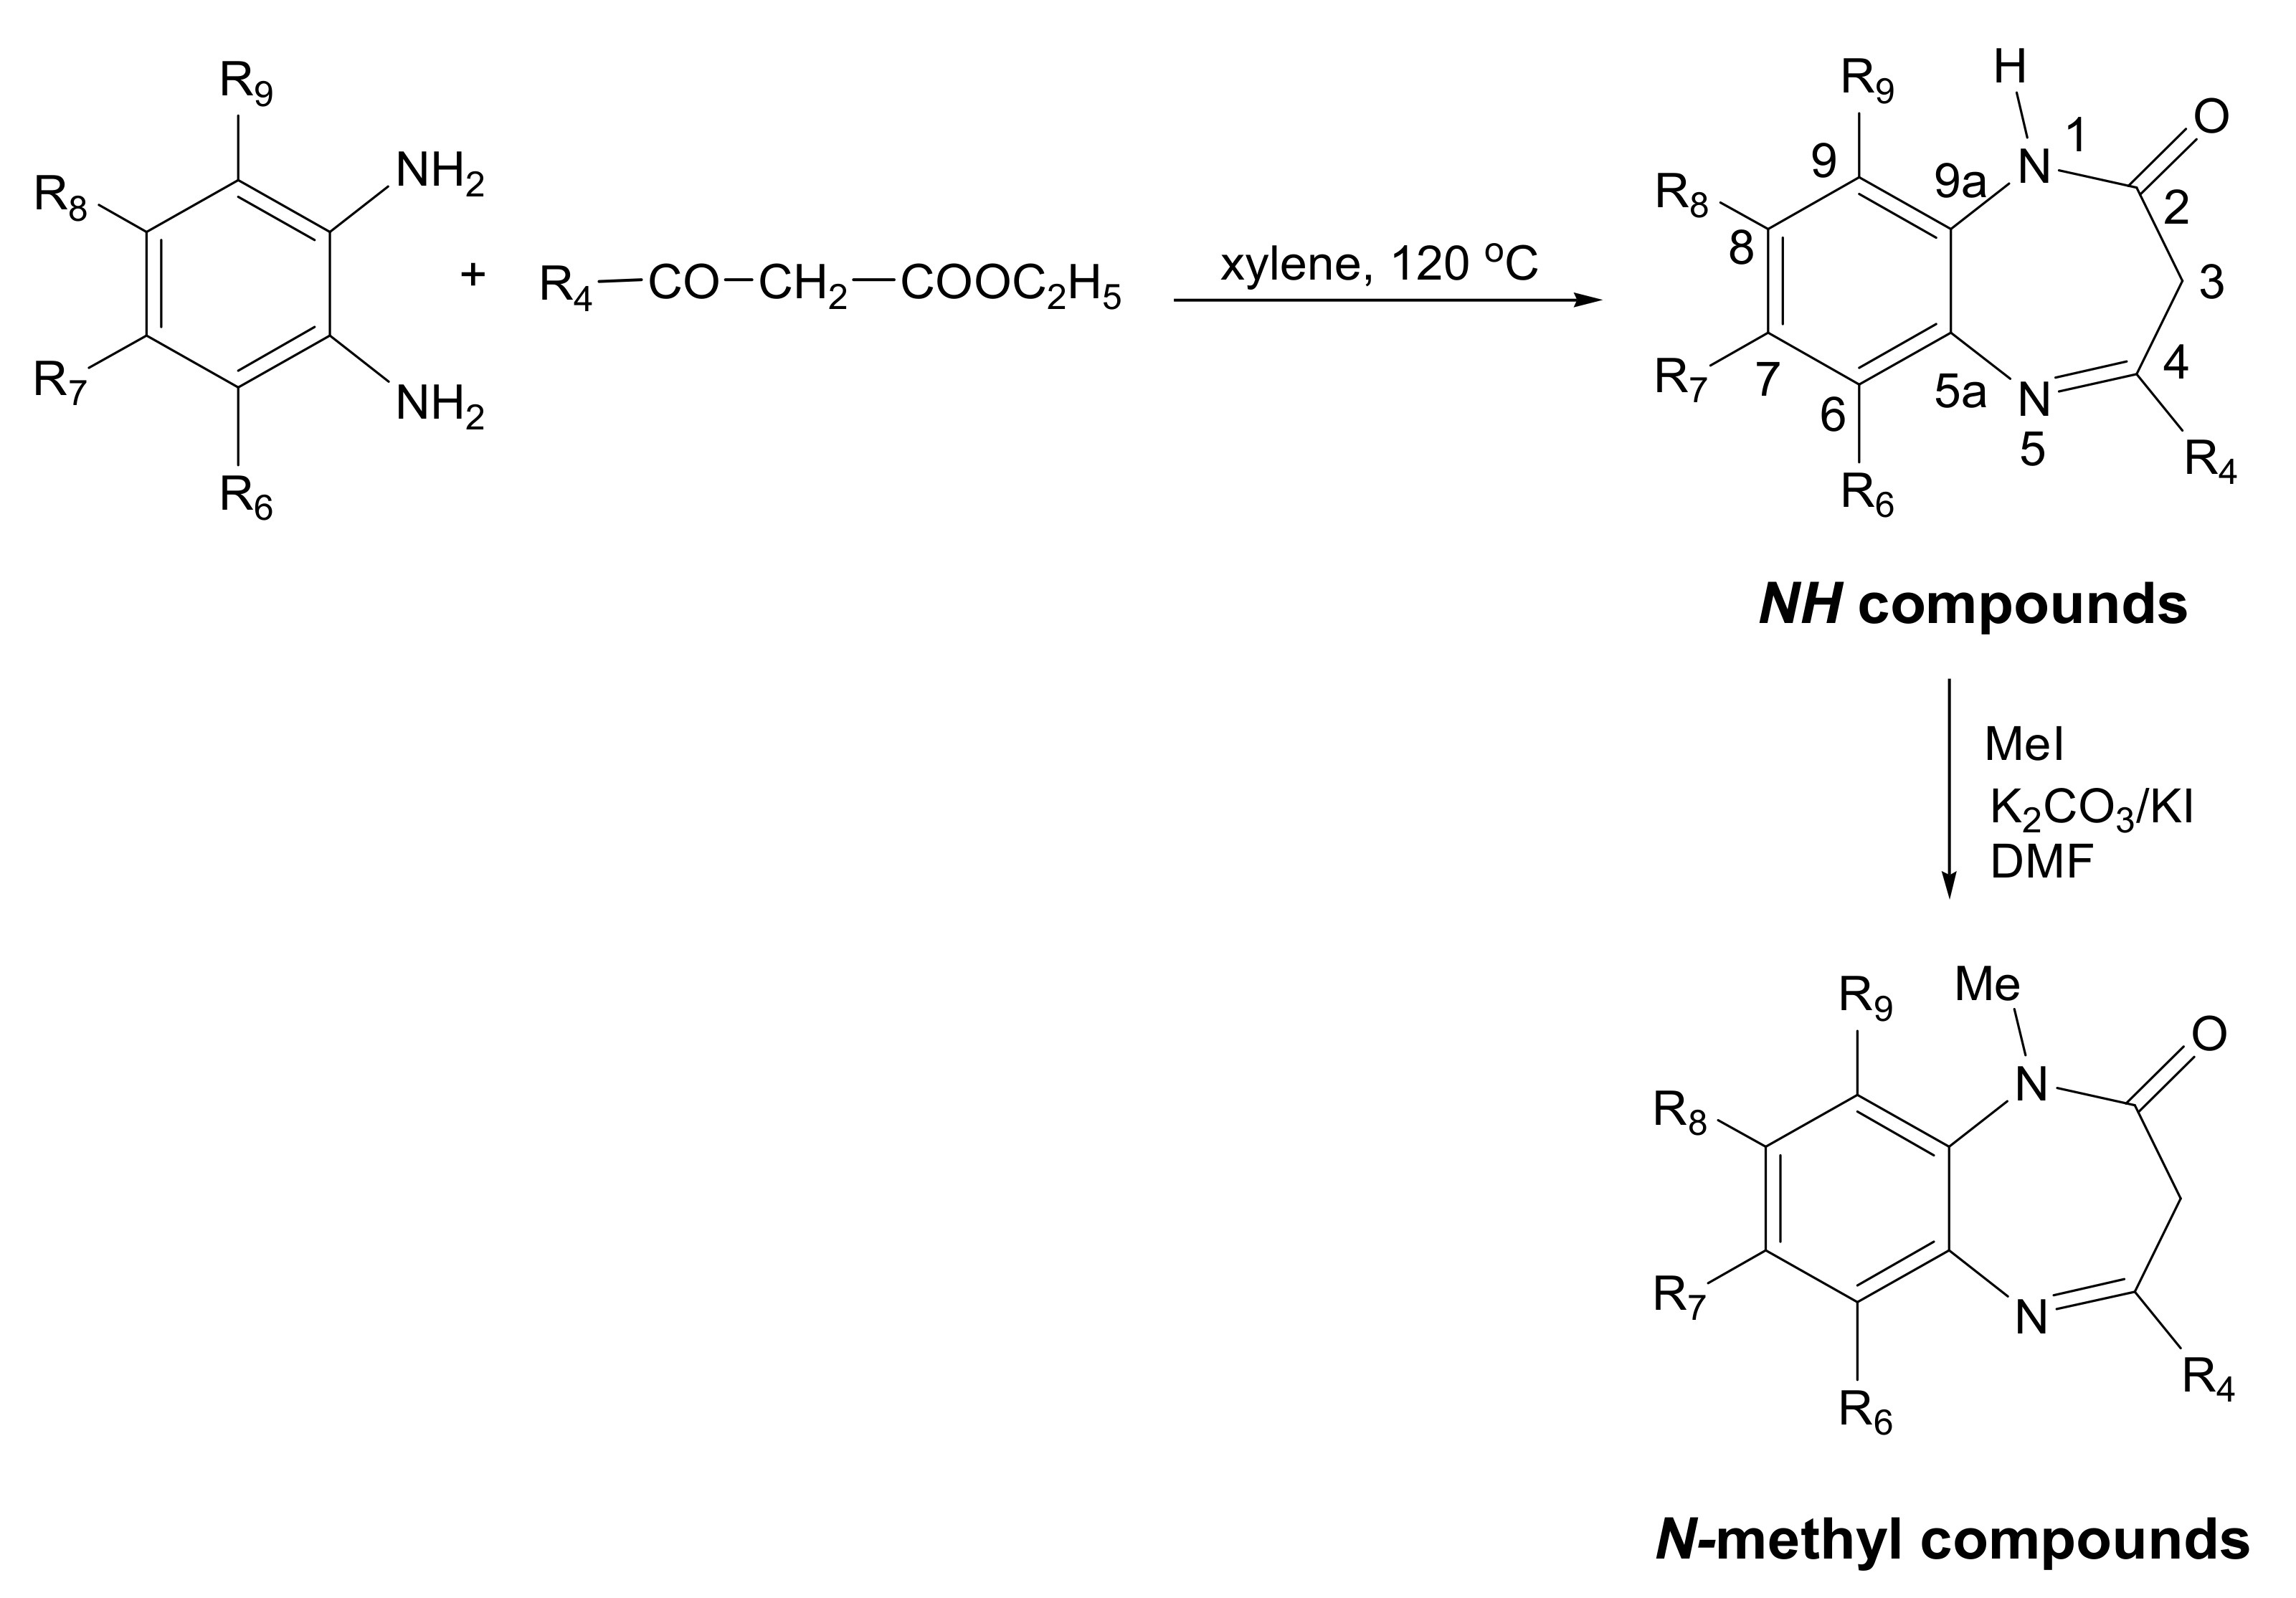
2.3. Preparation of Compounds 1–23
2.3.1. 7,8-Difluoro-4-phenyl-1H-1,5-benzodiazepin-2(3H)-one (9)
2.3.2. 7,8-Difluoro-1-methyl-4-phenyl-1H-1,5-benzodiazepin-2(3H)-one (10)
2.3.3. 8-Fluoro-4-phenyl-1H-1,5-benzodiazepin-2(3H)-one (11) and 7-Fluoro-4-phenyl-H-1,5-benzodiazepin-2(3H)-one (13)
2.3.4. 8-Fluoro-1-methyl-4-phenyl-1H-1,5-benzodiazepin-2(3H)-one (12)
2.3.5. 7-Fluoro-1-methyl-4-phenyl-1H-1,5-benzodiazepin-2(3H)-one (14)
2.3.6. 7,9-Difluoro-4-phenyl-1H-1,5-benzodiazepin-2(3H)-one (15) and 6,8-Difluoro-4-phenyl-1H-1,5-benzodiazepin-2(3H)-one (17)
2.3.7. 7,9-Difluoro-1-methyl-4-phenyl-1H-1,5-benzodiazepin-2(3H)-one (16)
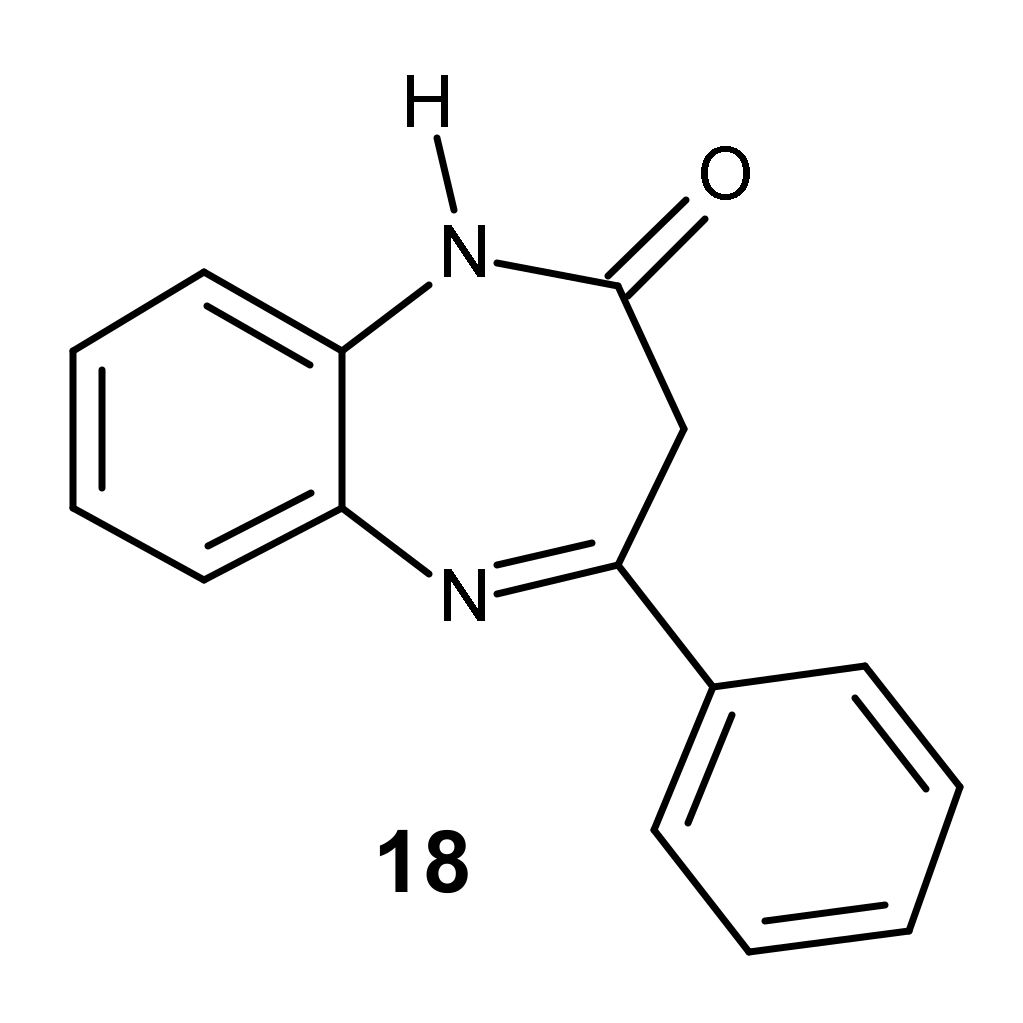
2.3.8. 4-Phenyl-1H-1,5-benzodiazepin-2(3H)-one (18)
2.3.9. 1-Methyl-4-phenyl-1H-1,5-benzodiazepin-2(3H)-one (19)
2.3.10. 4-(3,4,5-Trimethoxyphenyl)-1H-1,5-benzodiazepin-2(3H)-one (20)
2.3.11. 7,8-Dimethyl-4-(3,4,5-trimethoxyphenyl)-1H-1,5-benzodiazepin-2(3H)-one (21)
2.3.12. 7,8-Difluoro-4-(3,4,5-trimethoxyphenyl)-1H-1,5-benzodiazepin-2(3H)-one (22)
2.3.13. 7,8-Dichloro-4-(3,4,5-trimethoxyphenyl)-1H-1,5-benzodiazepin-2(3H)-one (23)
2.4. Radical Scavenger Capacity Determination
2.4.1. 2,2′-Azino-bis (3-ethylbenzothiazoline-6-sulfonic Acid) (ABTS) Assay
2.4.2. Ferric Reducing Antioxidant Power (FRAP) Assay
2.4.3. 2,2-Diphenyl-1-picrylhydrazyl (DPPH) Assay
2.5. Cell Culture
2.6. Cytotoxicity Activity In Vitro in SH-SY5Y and HepG2 Cell Lines
2.7. SH-SY5Y Cell Neuroprotection Assay
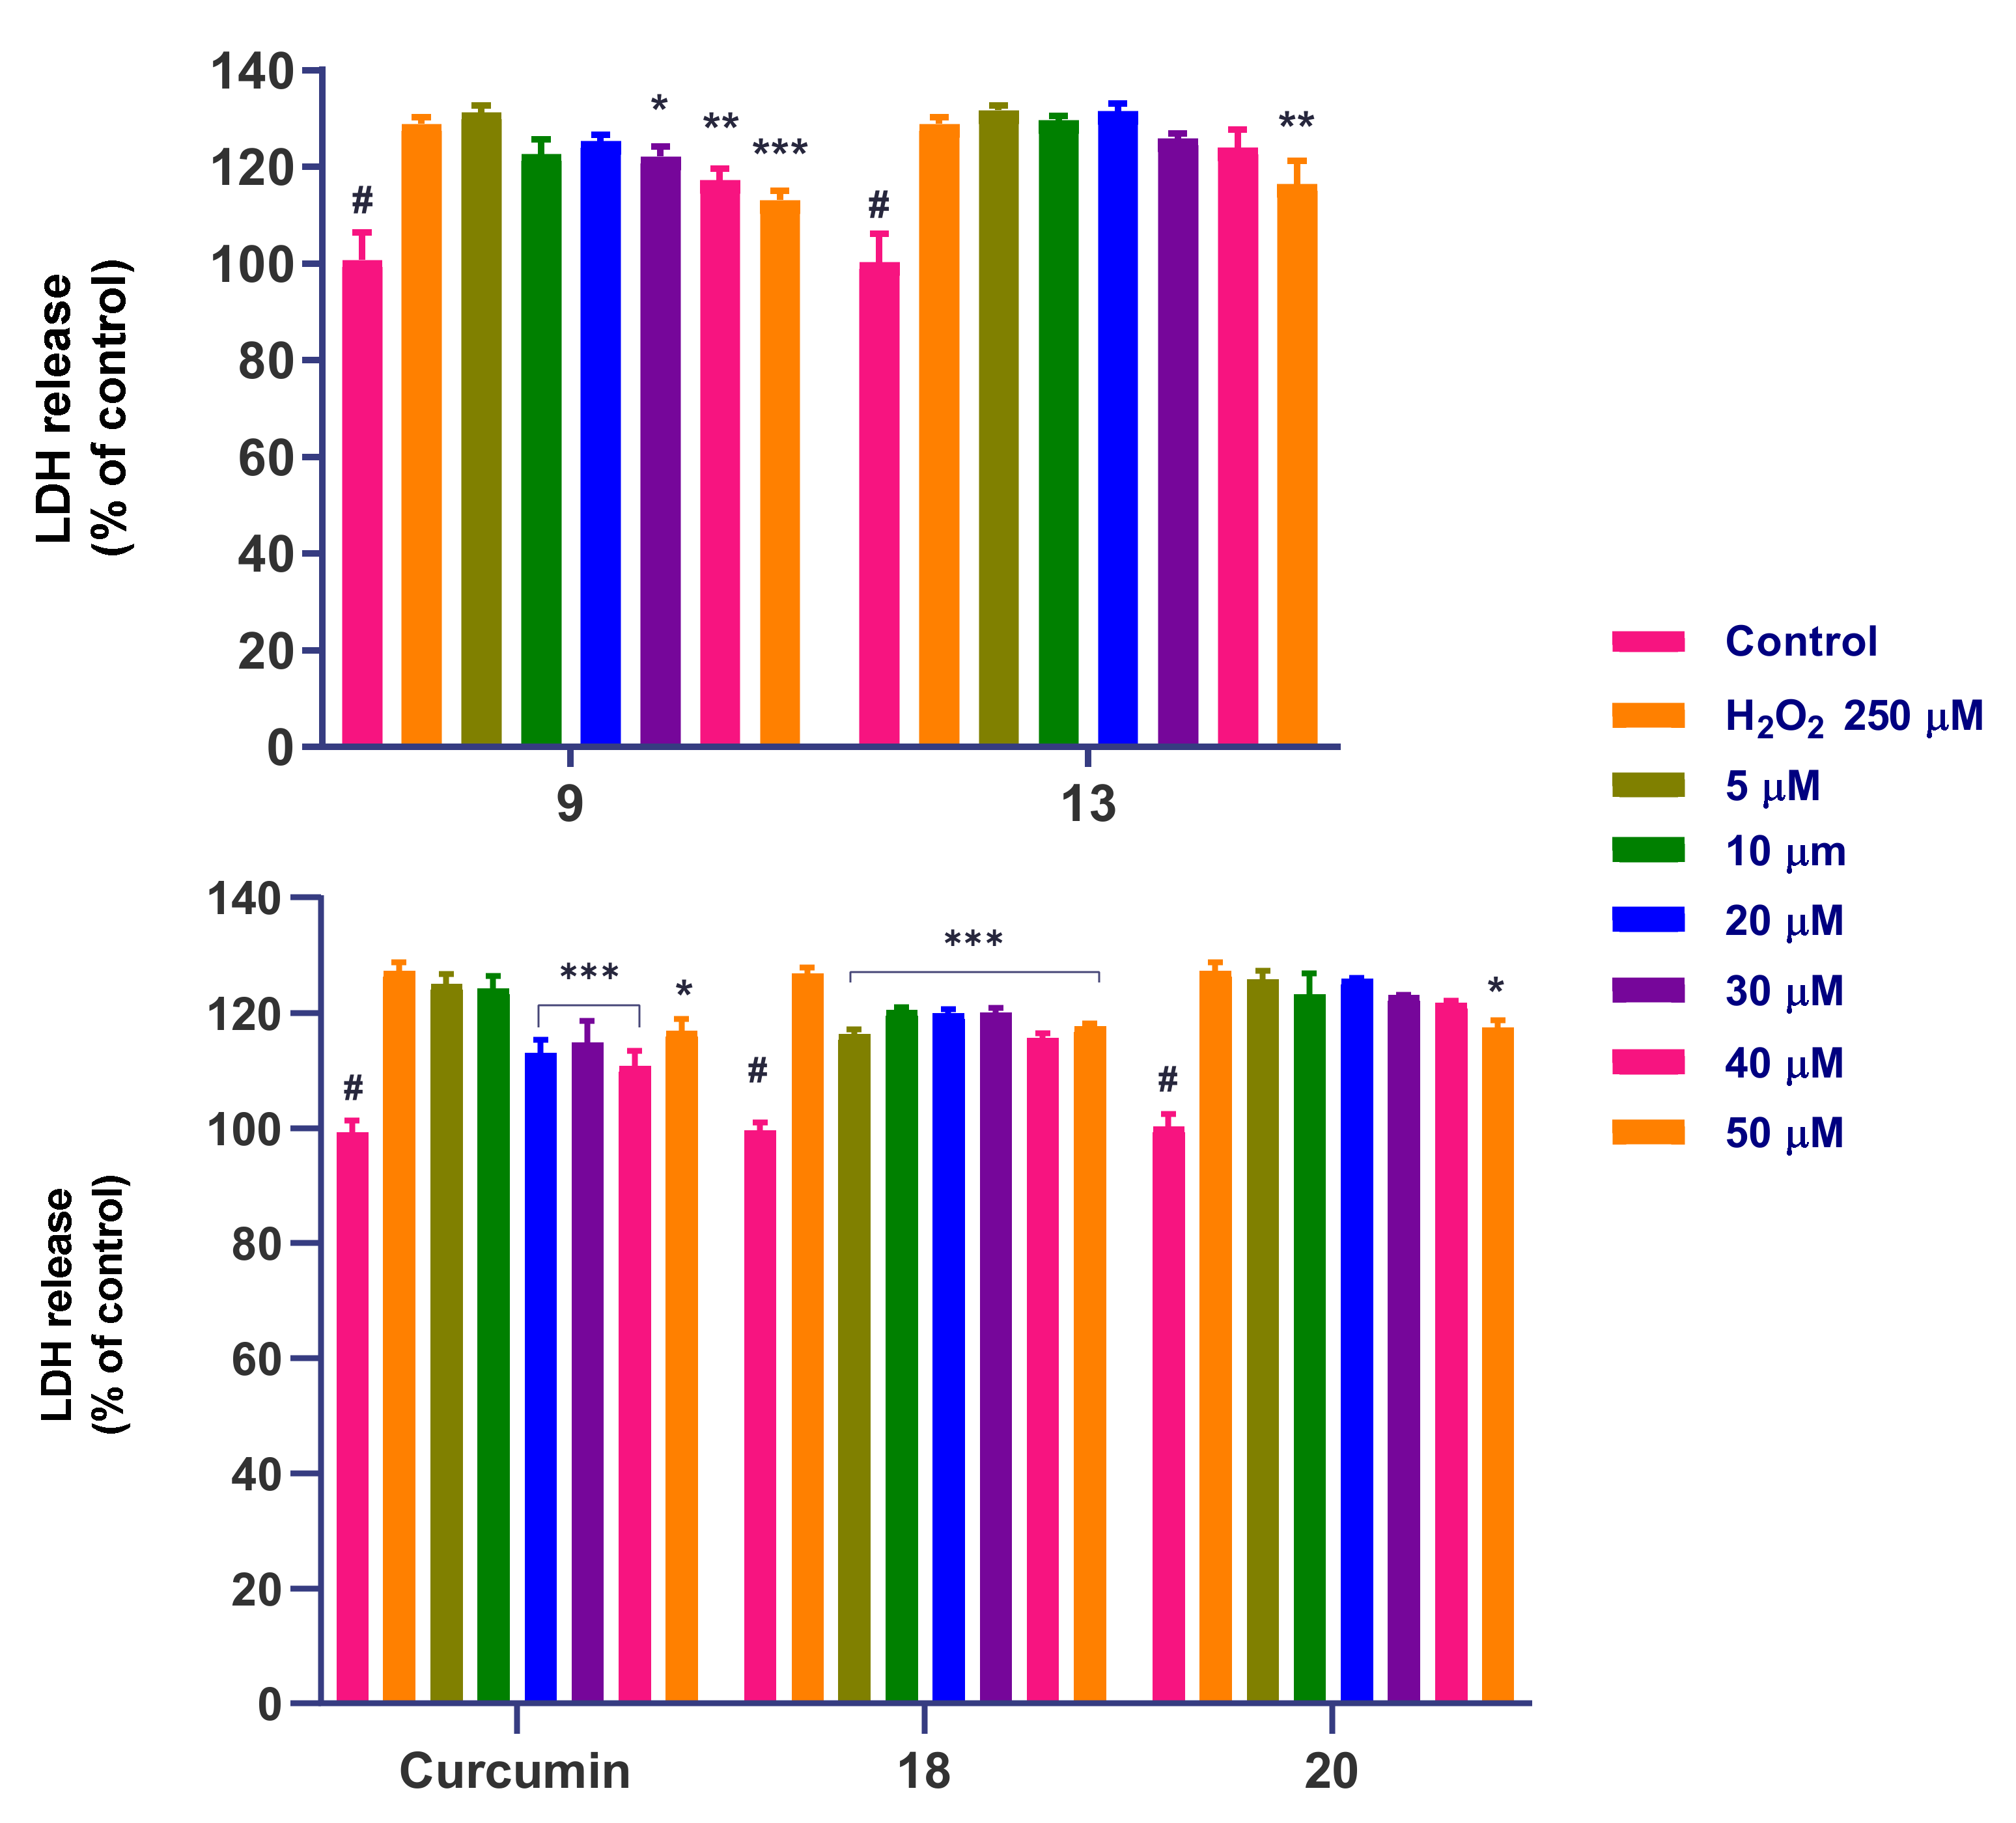
2.8. Lactate Dehydrogenase (LDH) Cell V2bility Assay
2.9. Kinetic Solubility by UV Spectrometry Assay
2.10. Estimation of Intracellular Reactive Oxygen Species (ROS)
2.11. Determination of Mitochondrial Superoxide (MitoSOX) Levels
2.12. Determination of the Mitochondrial Membrane Potential ΔΨm (MMP)
2.13. Determination of Apoptosis and Necrosis by Flow Cytometry
2.14. Evaluation of Caspase-3 Activity
2.15. Determination of Lipid Peroxidation (Malondialdehyde, MDA)
2.16. Determination of the Reduced GSH/Oxidized GSSG Glutathione Ratio
2.17. Determination of Intracellular Glutathione (GSH) Recovery
2.18. Fluorescence Microscopy Experiments
2.19. Statistical Analysis
3. Results
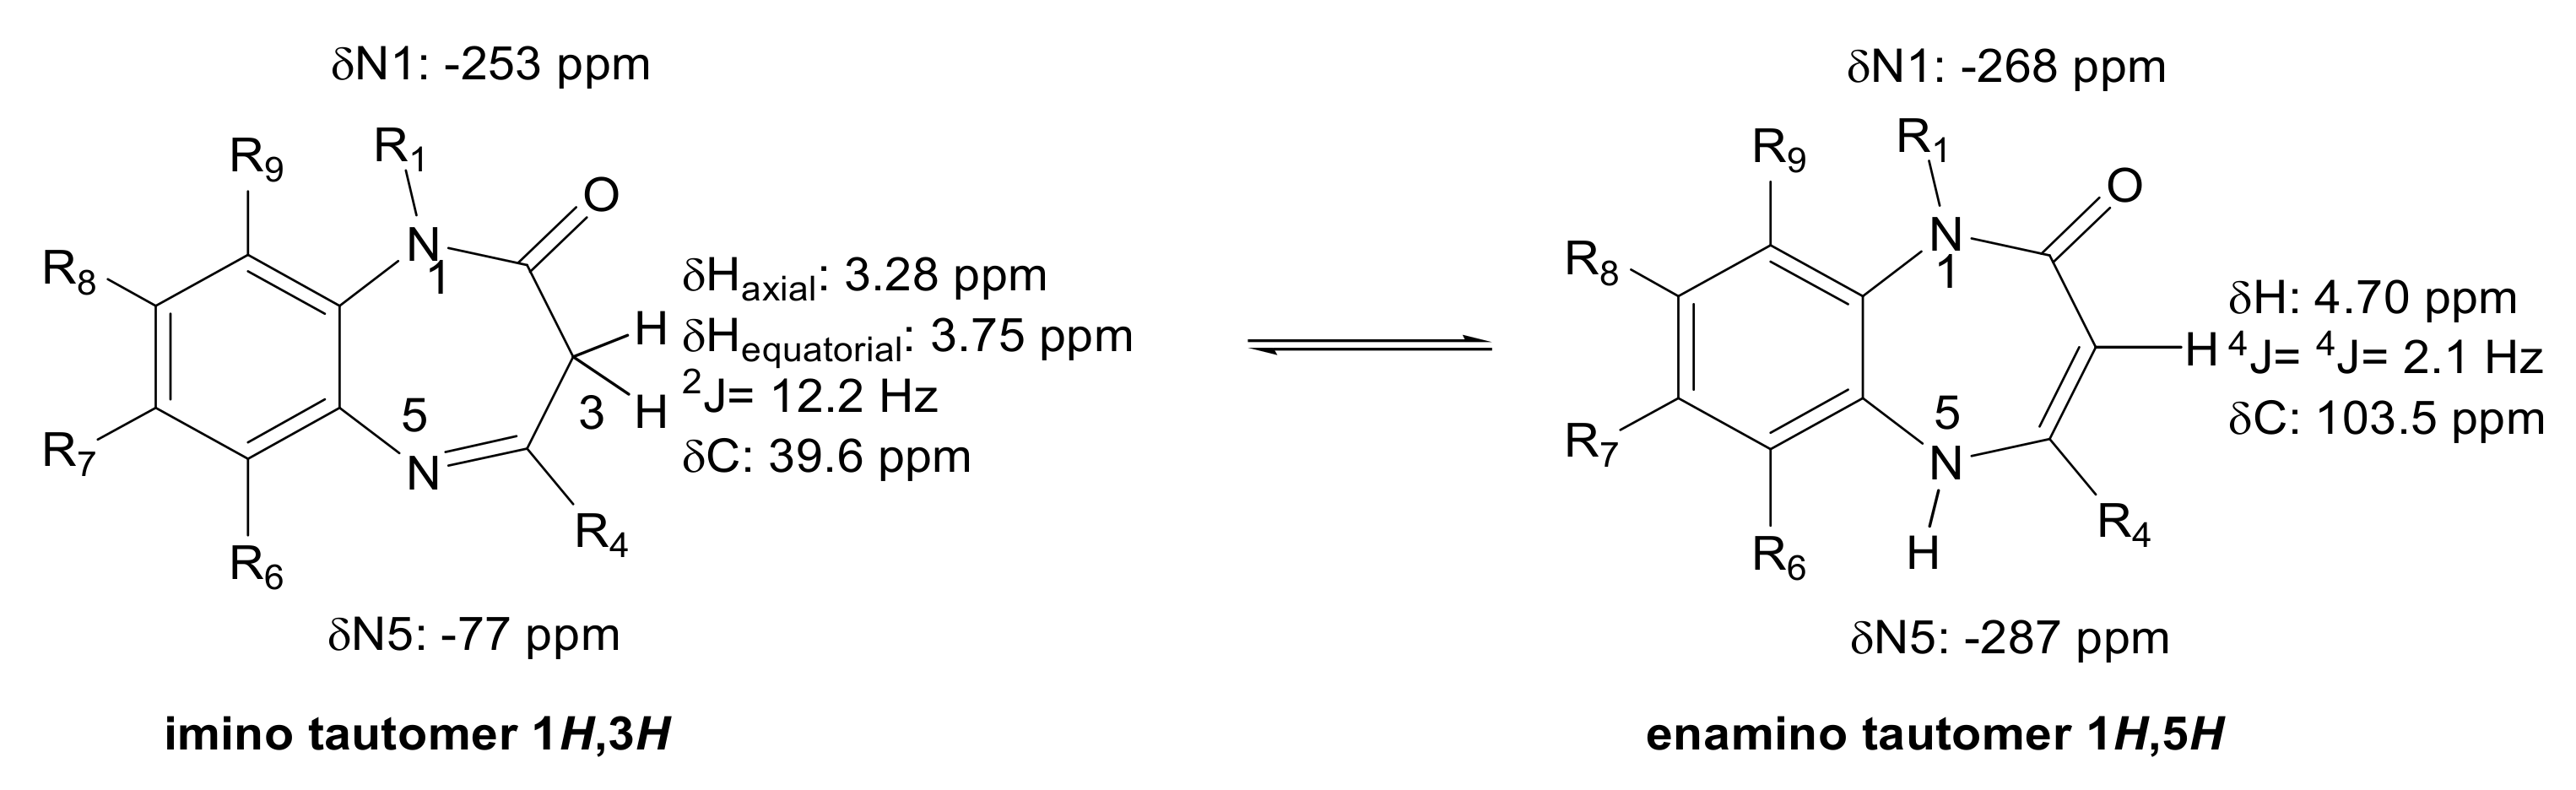
3.1. Synthesis and Structure Characterization
3.2. Antioxidant (AOX) Properties
3.3. Calculation of Physicochemical Properties
3.4. Determination of Kinetic Solubility
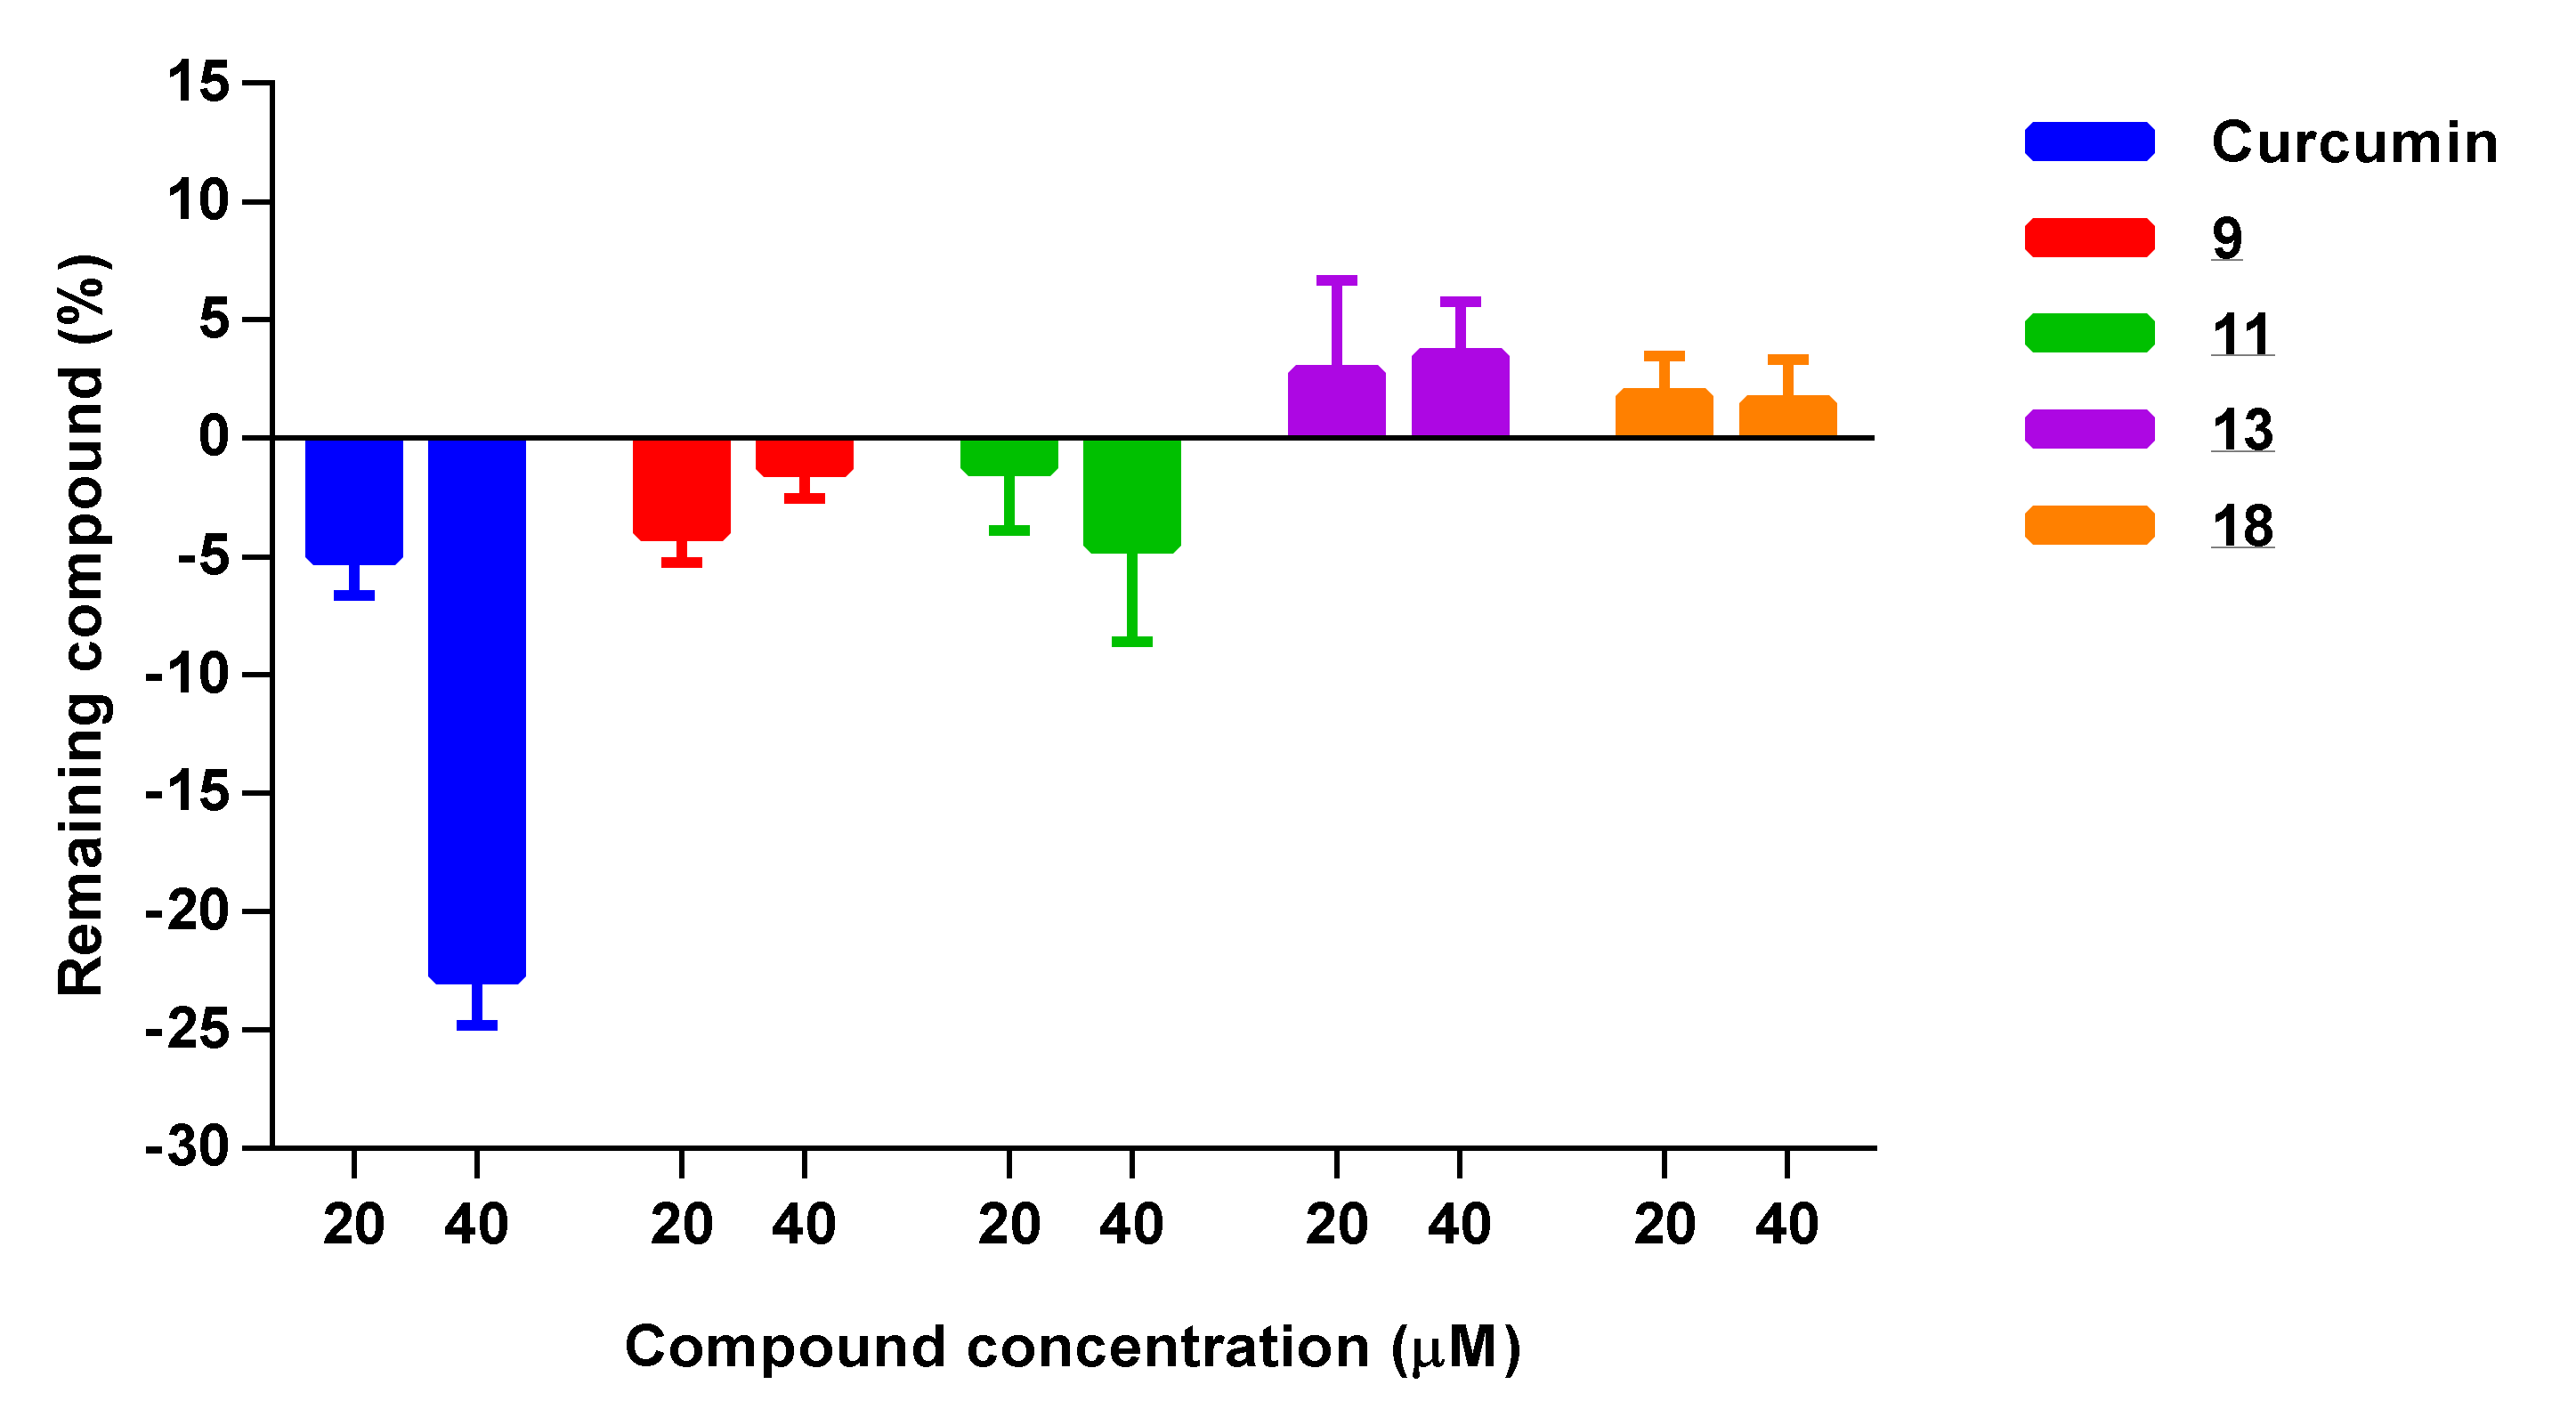
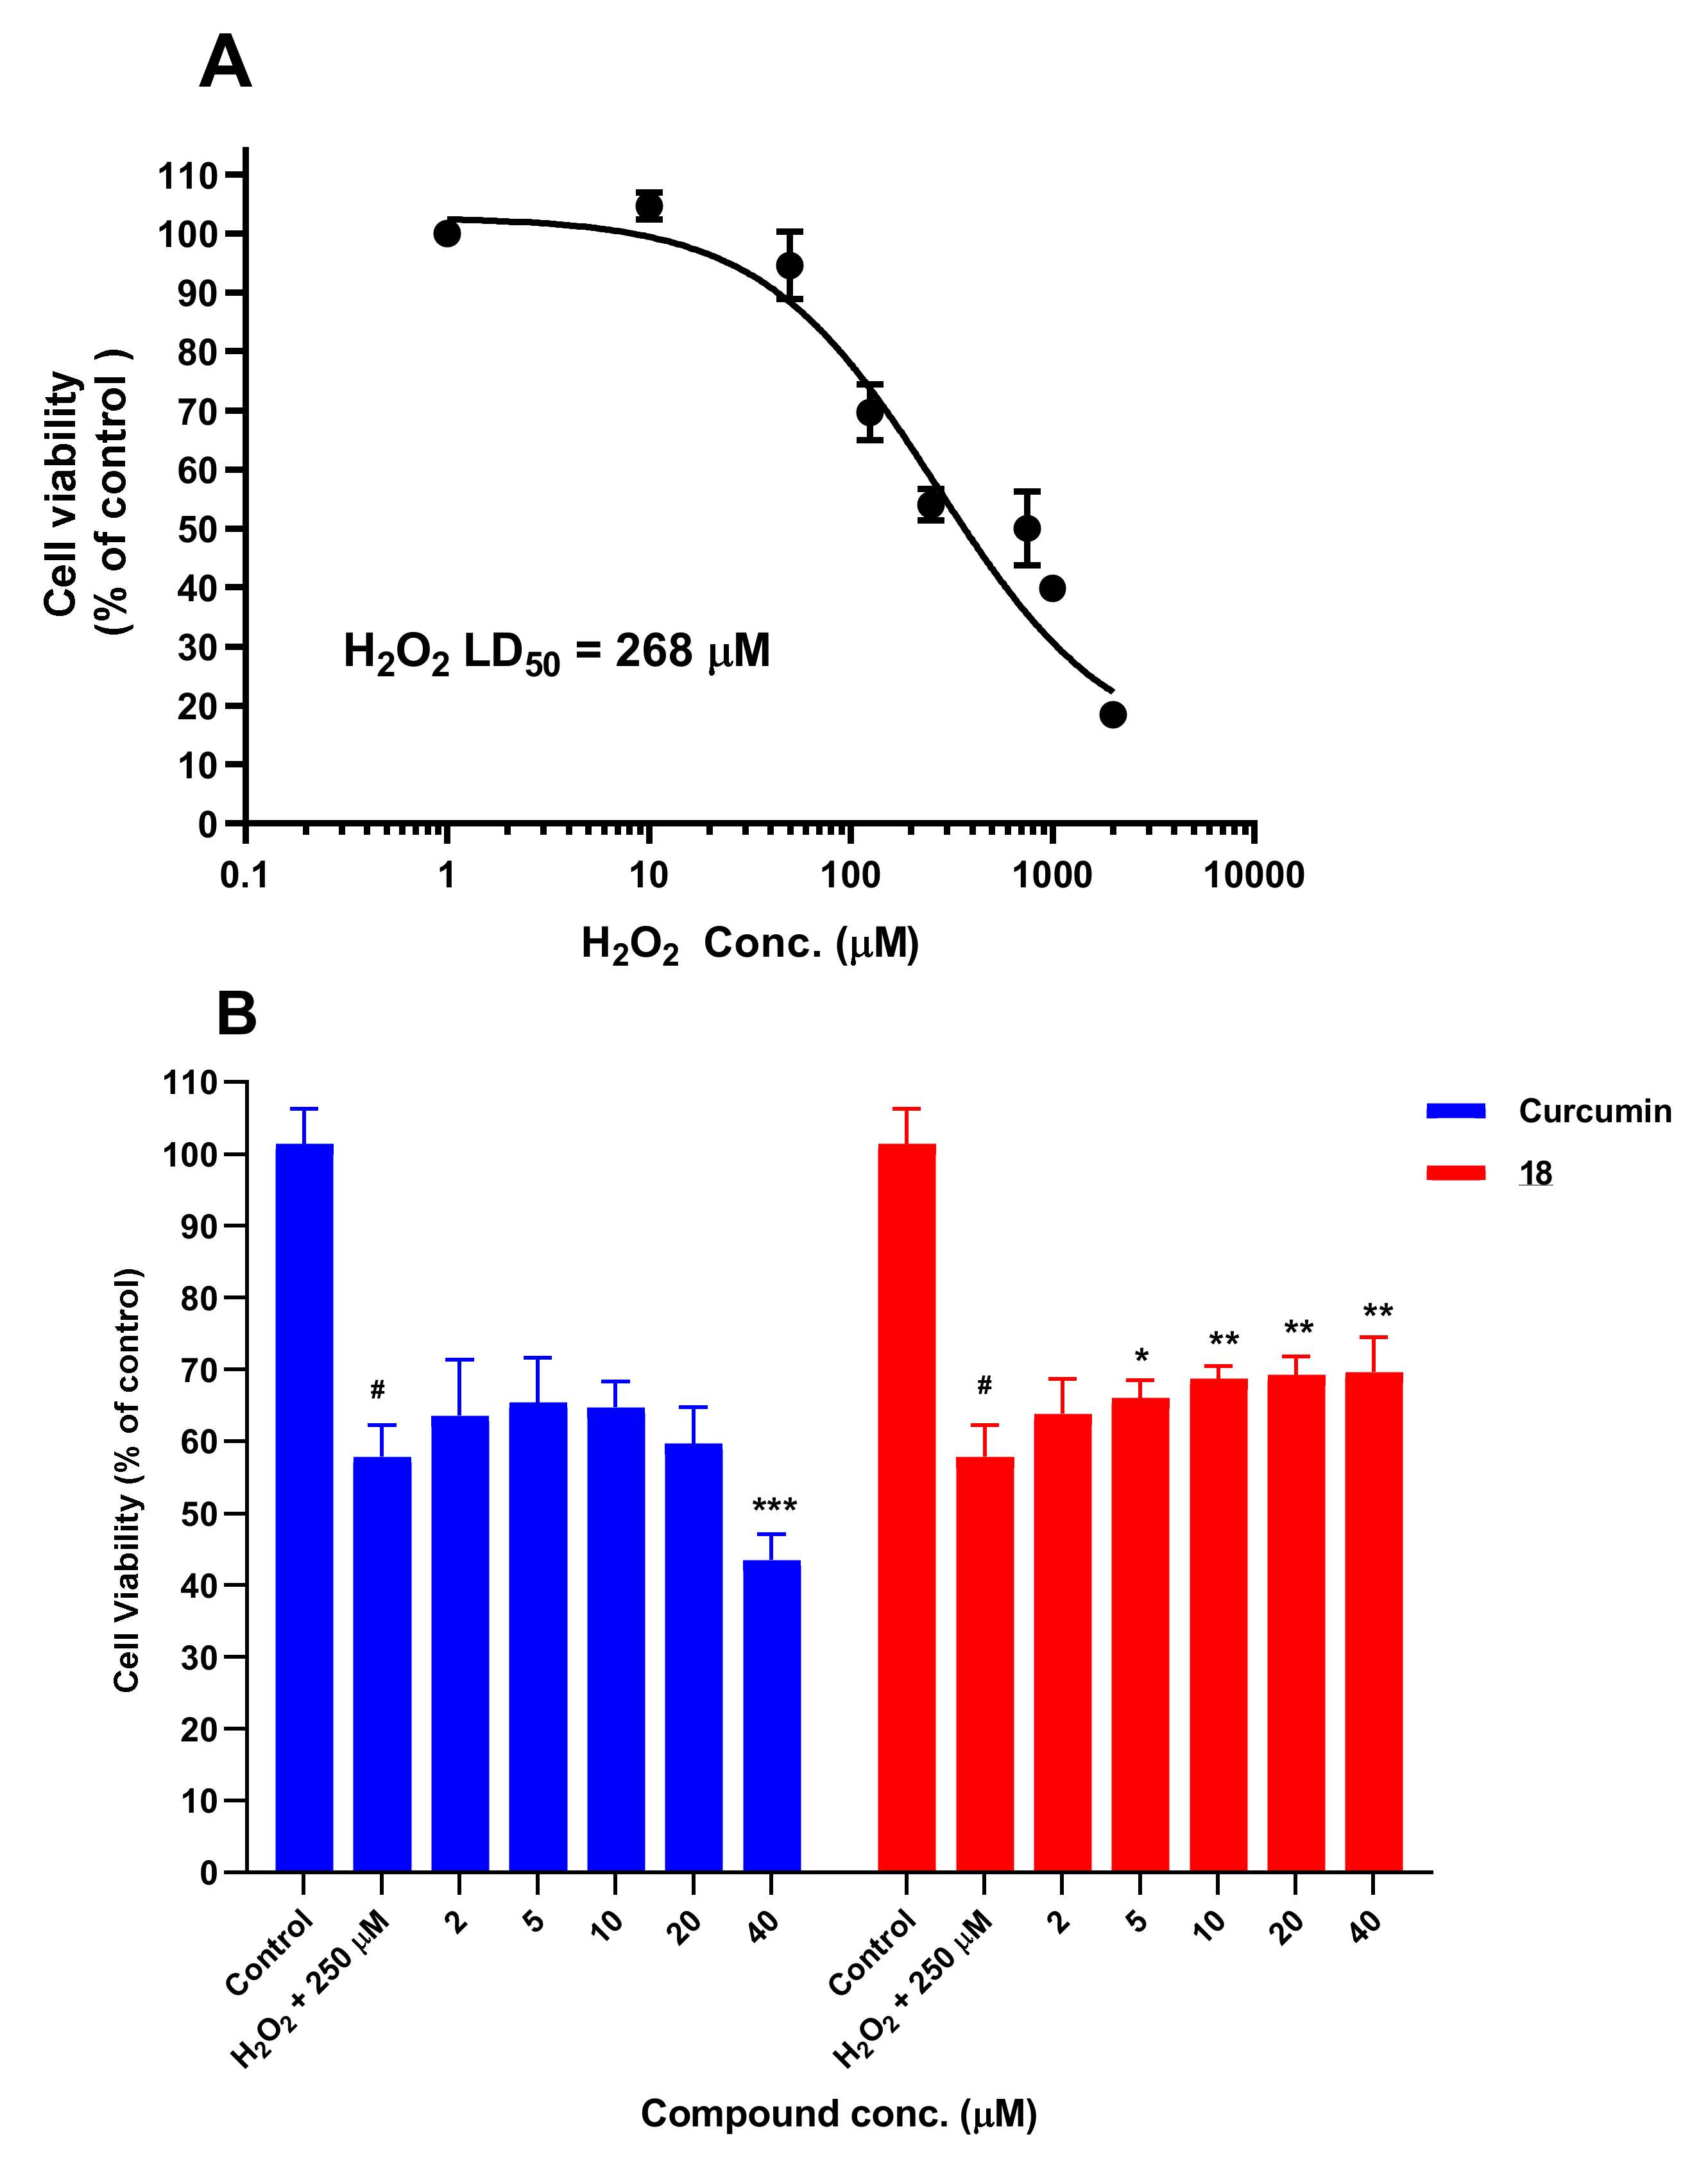
3.5. Chemical Reactivity with H2O2 and MTT
3.5.1. Chemical Reactivity with H2O2
3.5.2. Chemical Reactivity with MTT
3.6. Cytotoxicity Studies
3.7. Neuroprotection Studies
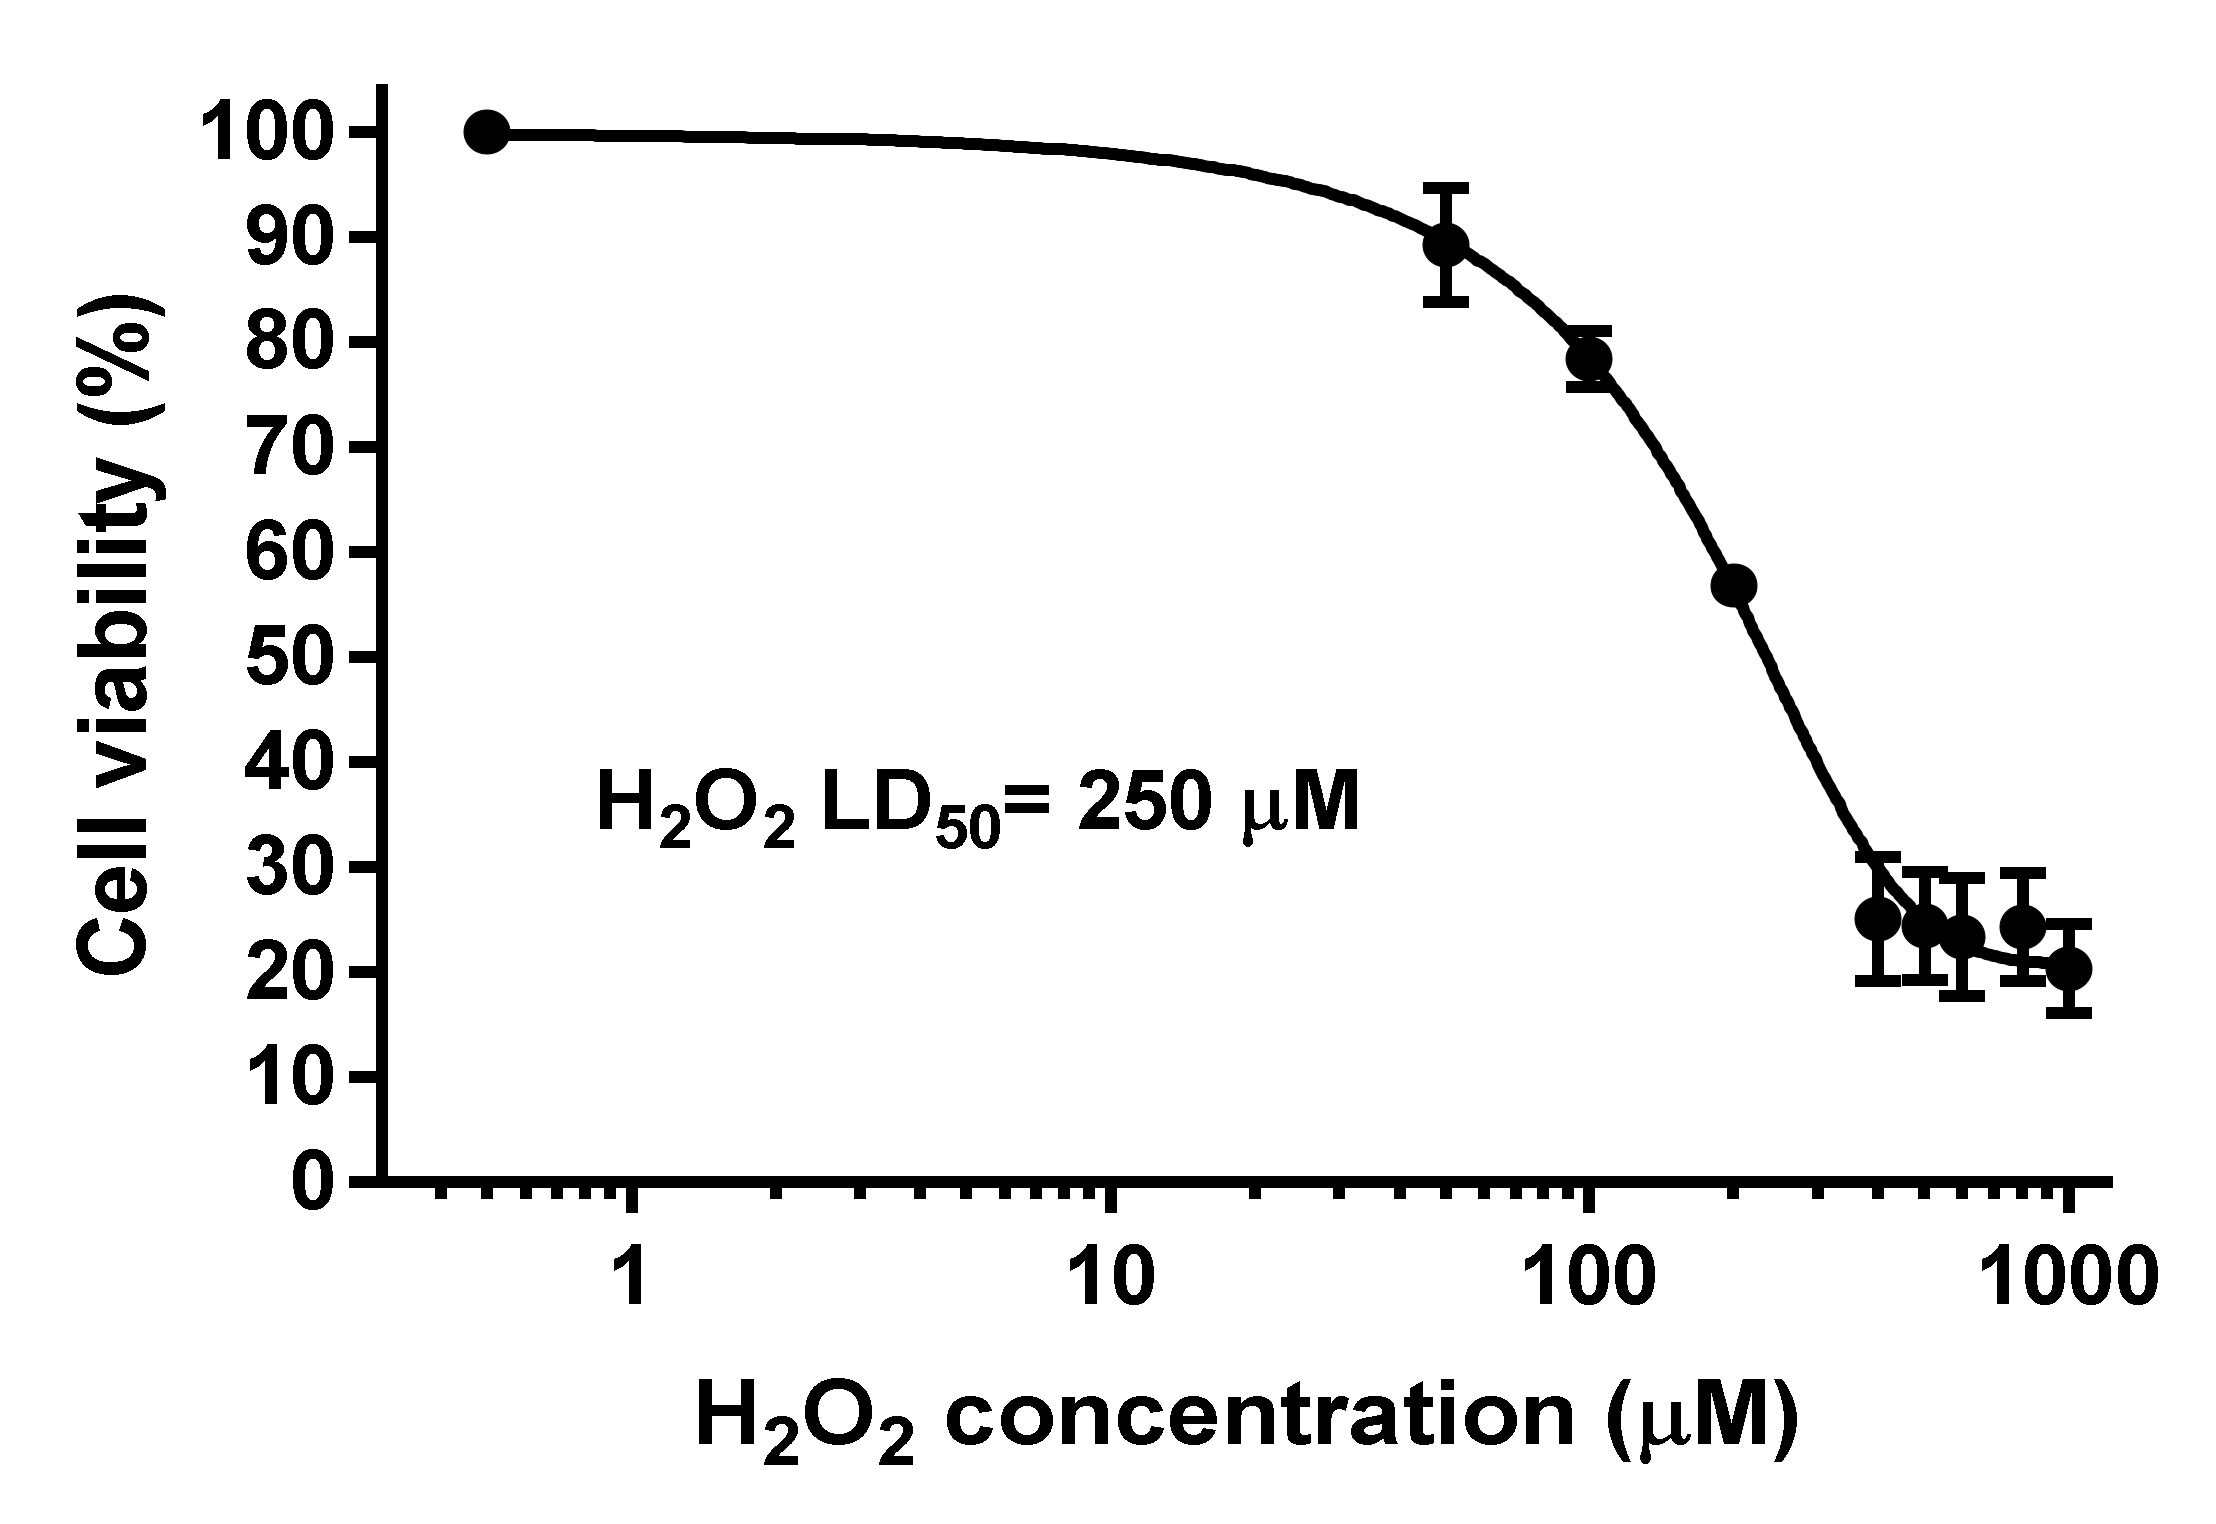
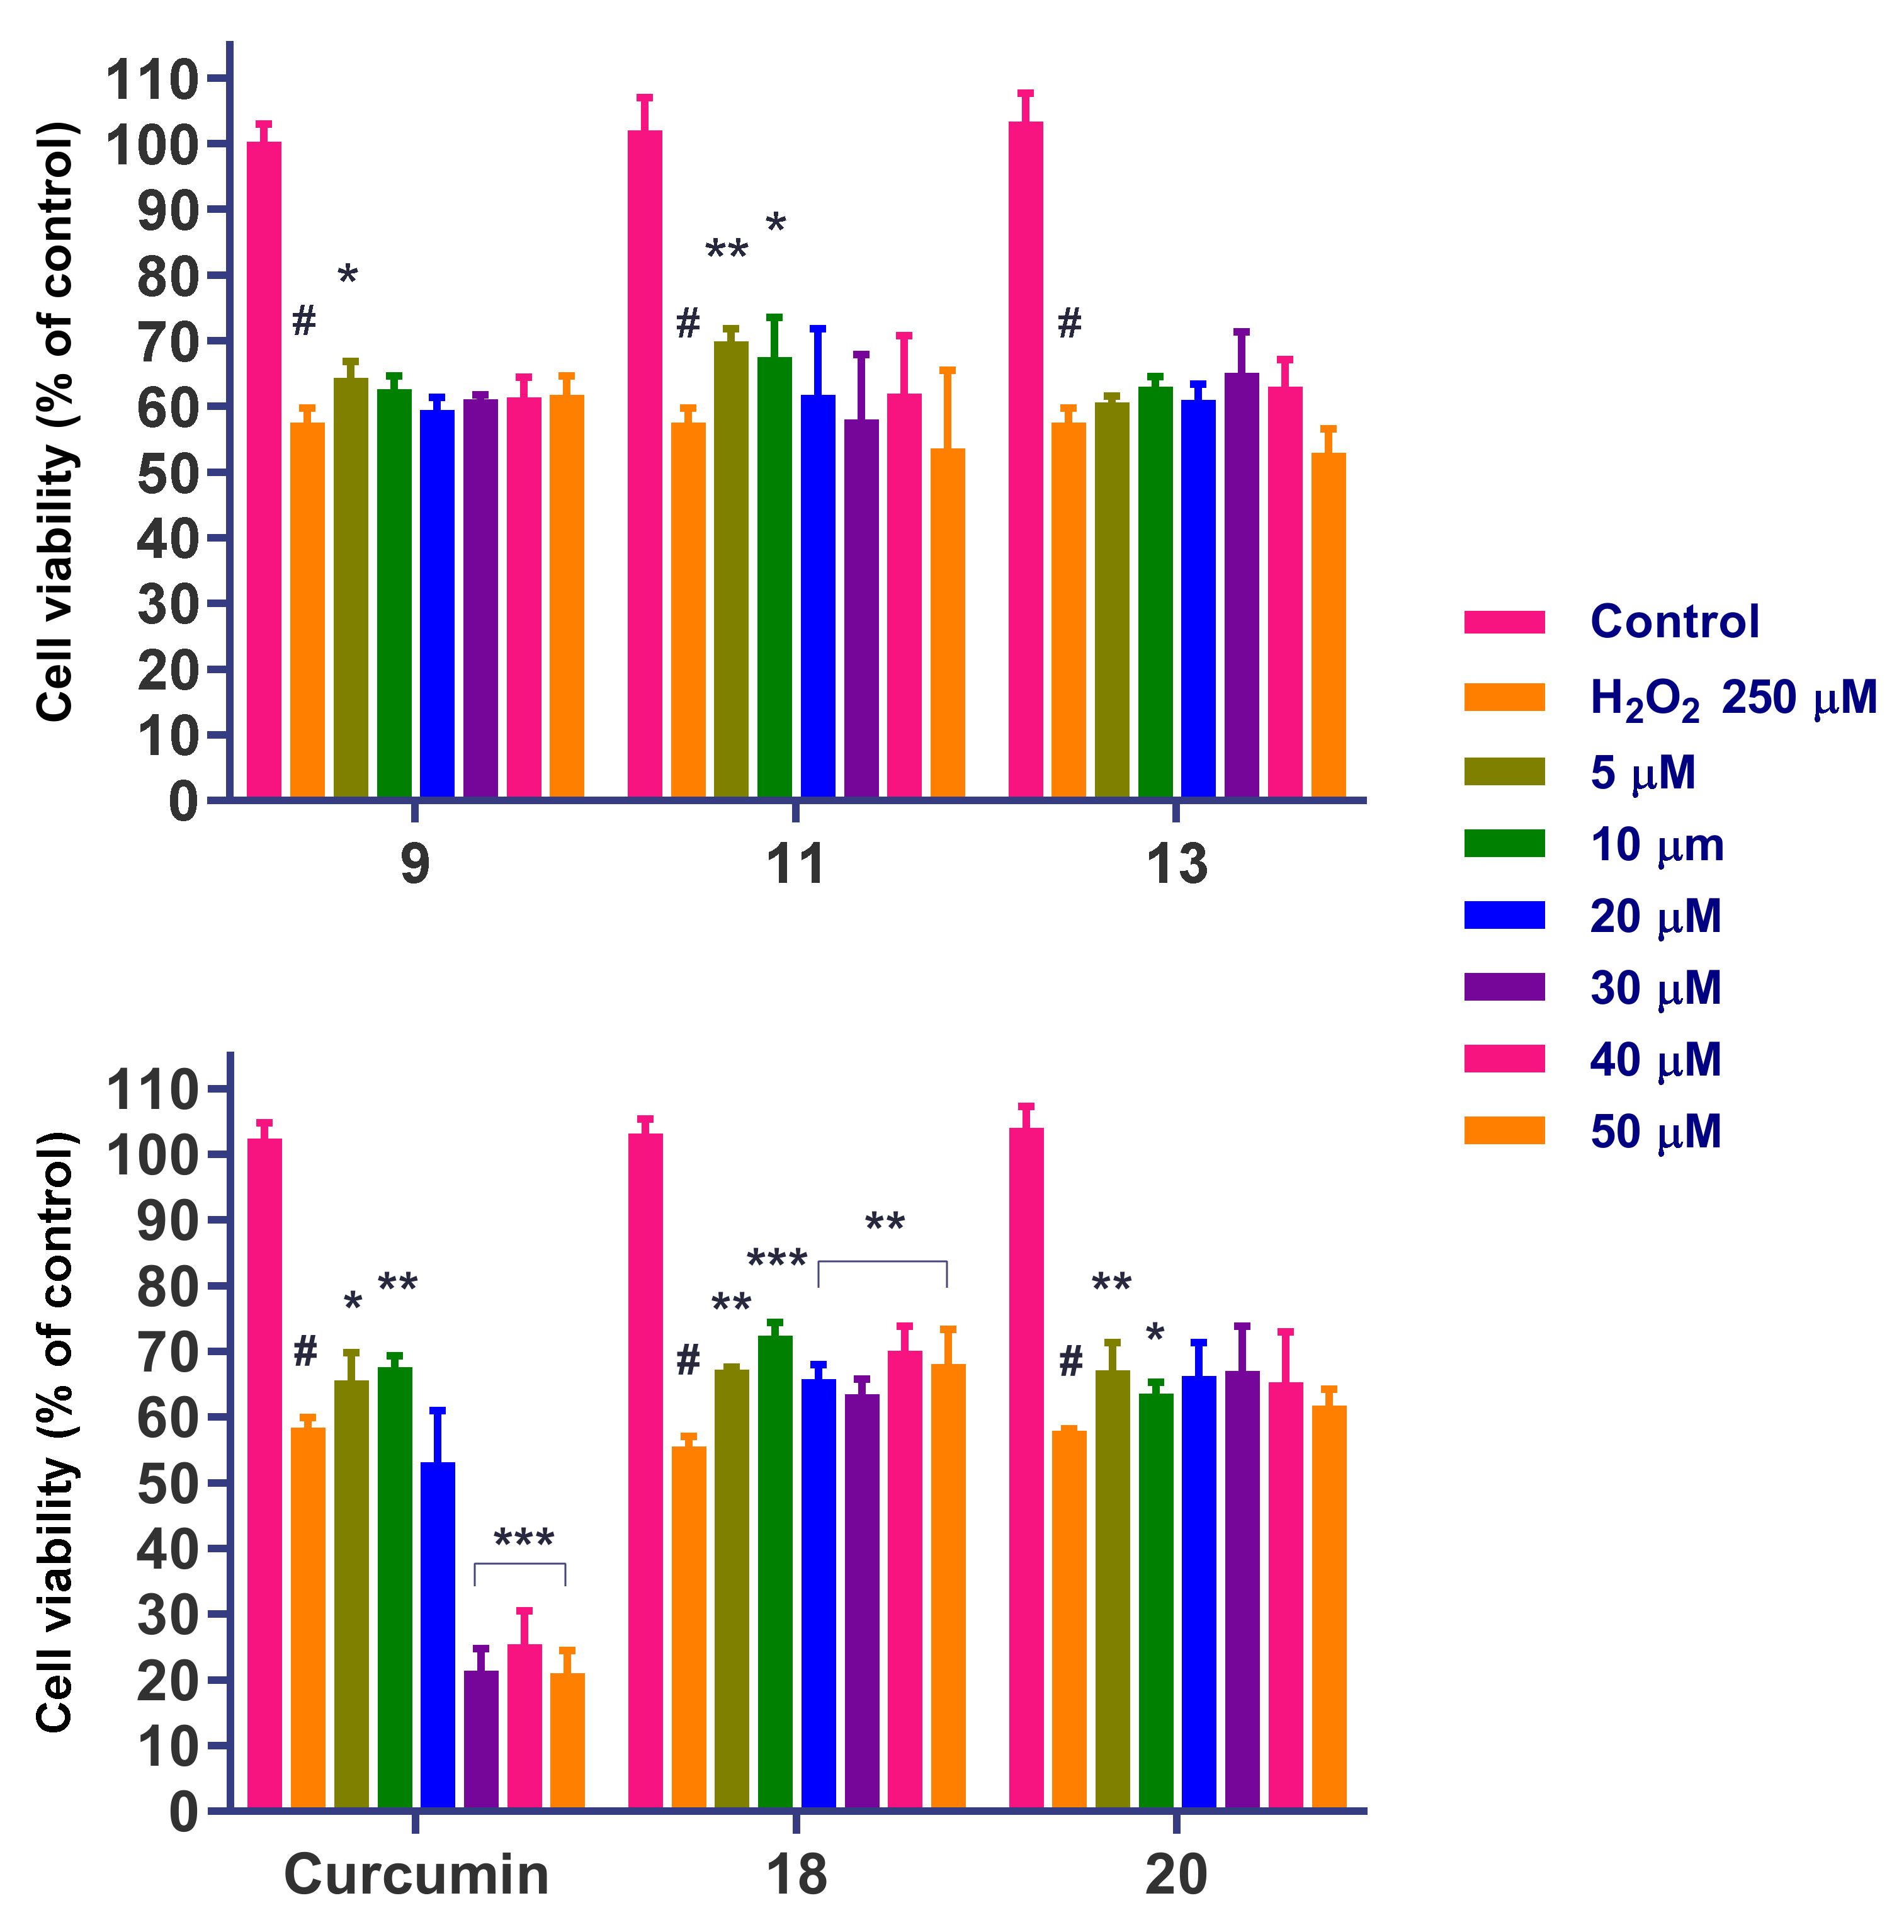
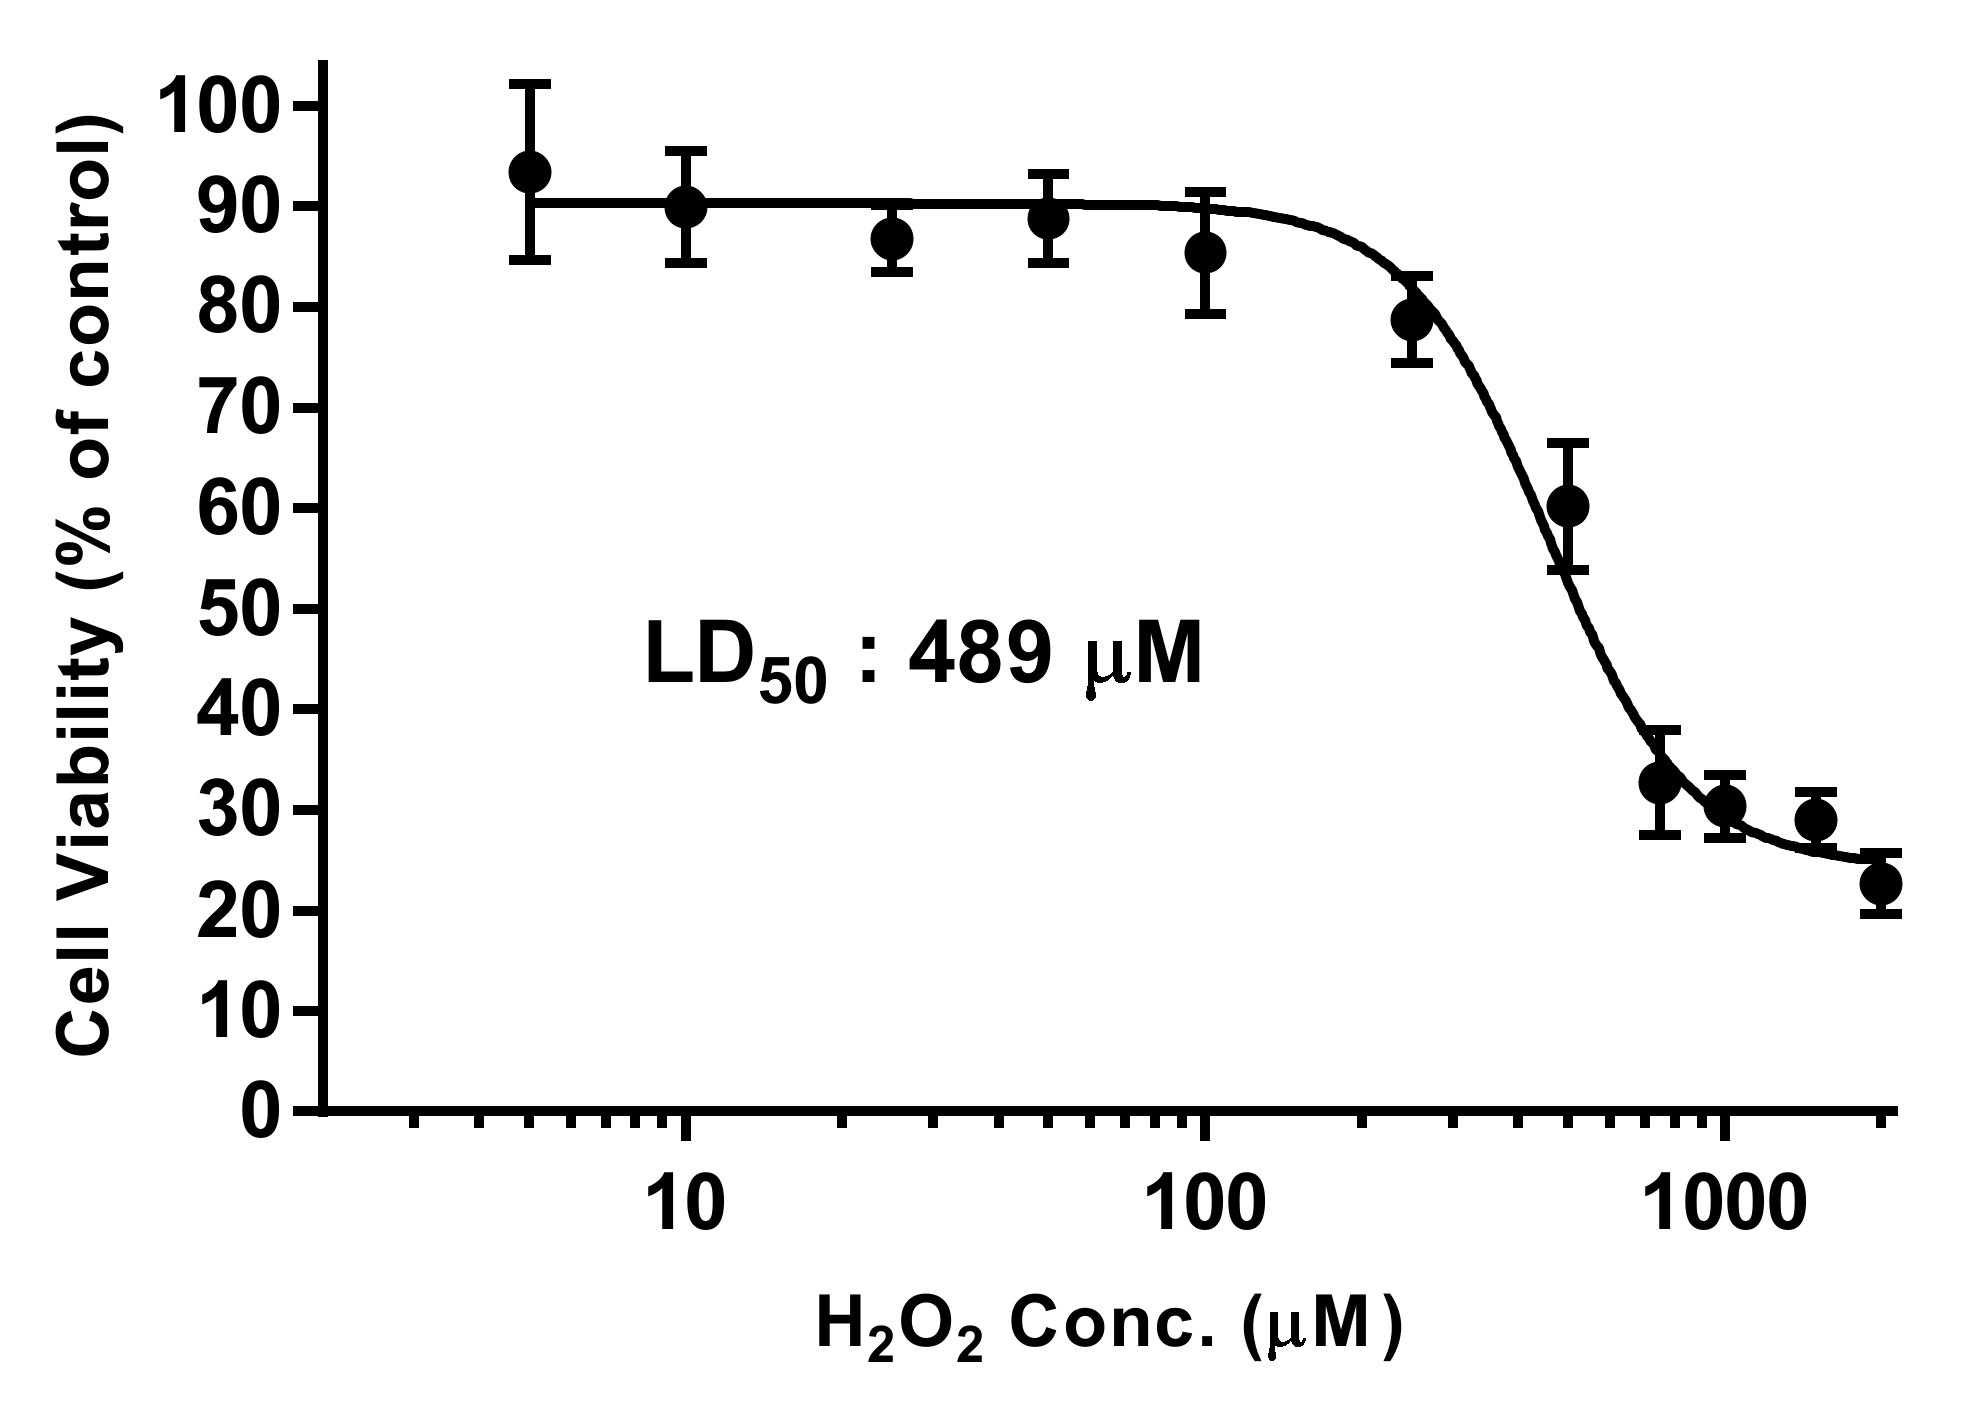
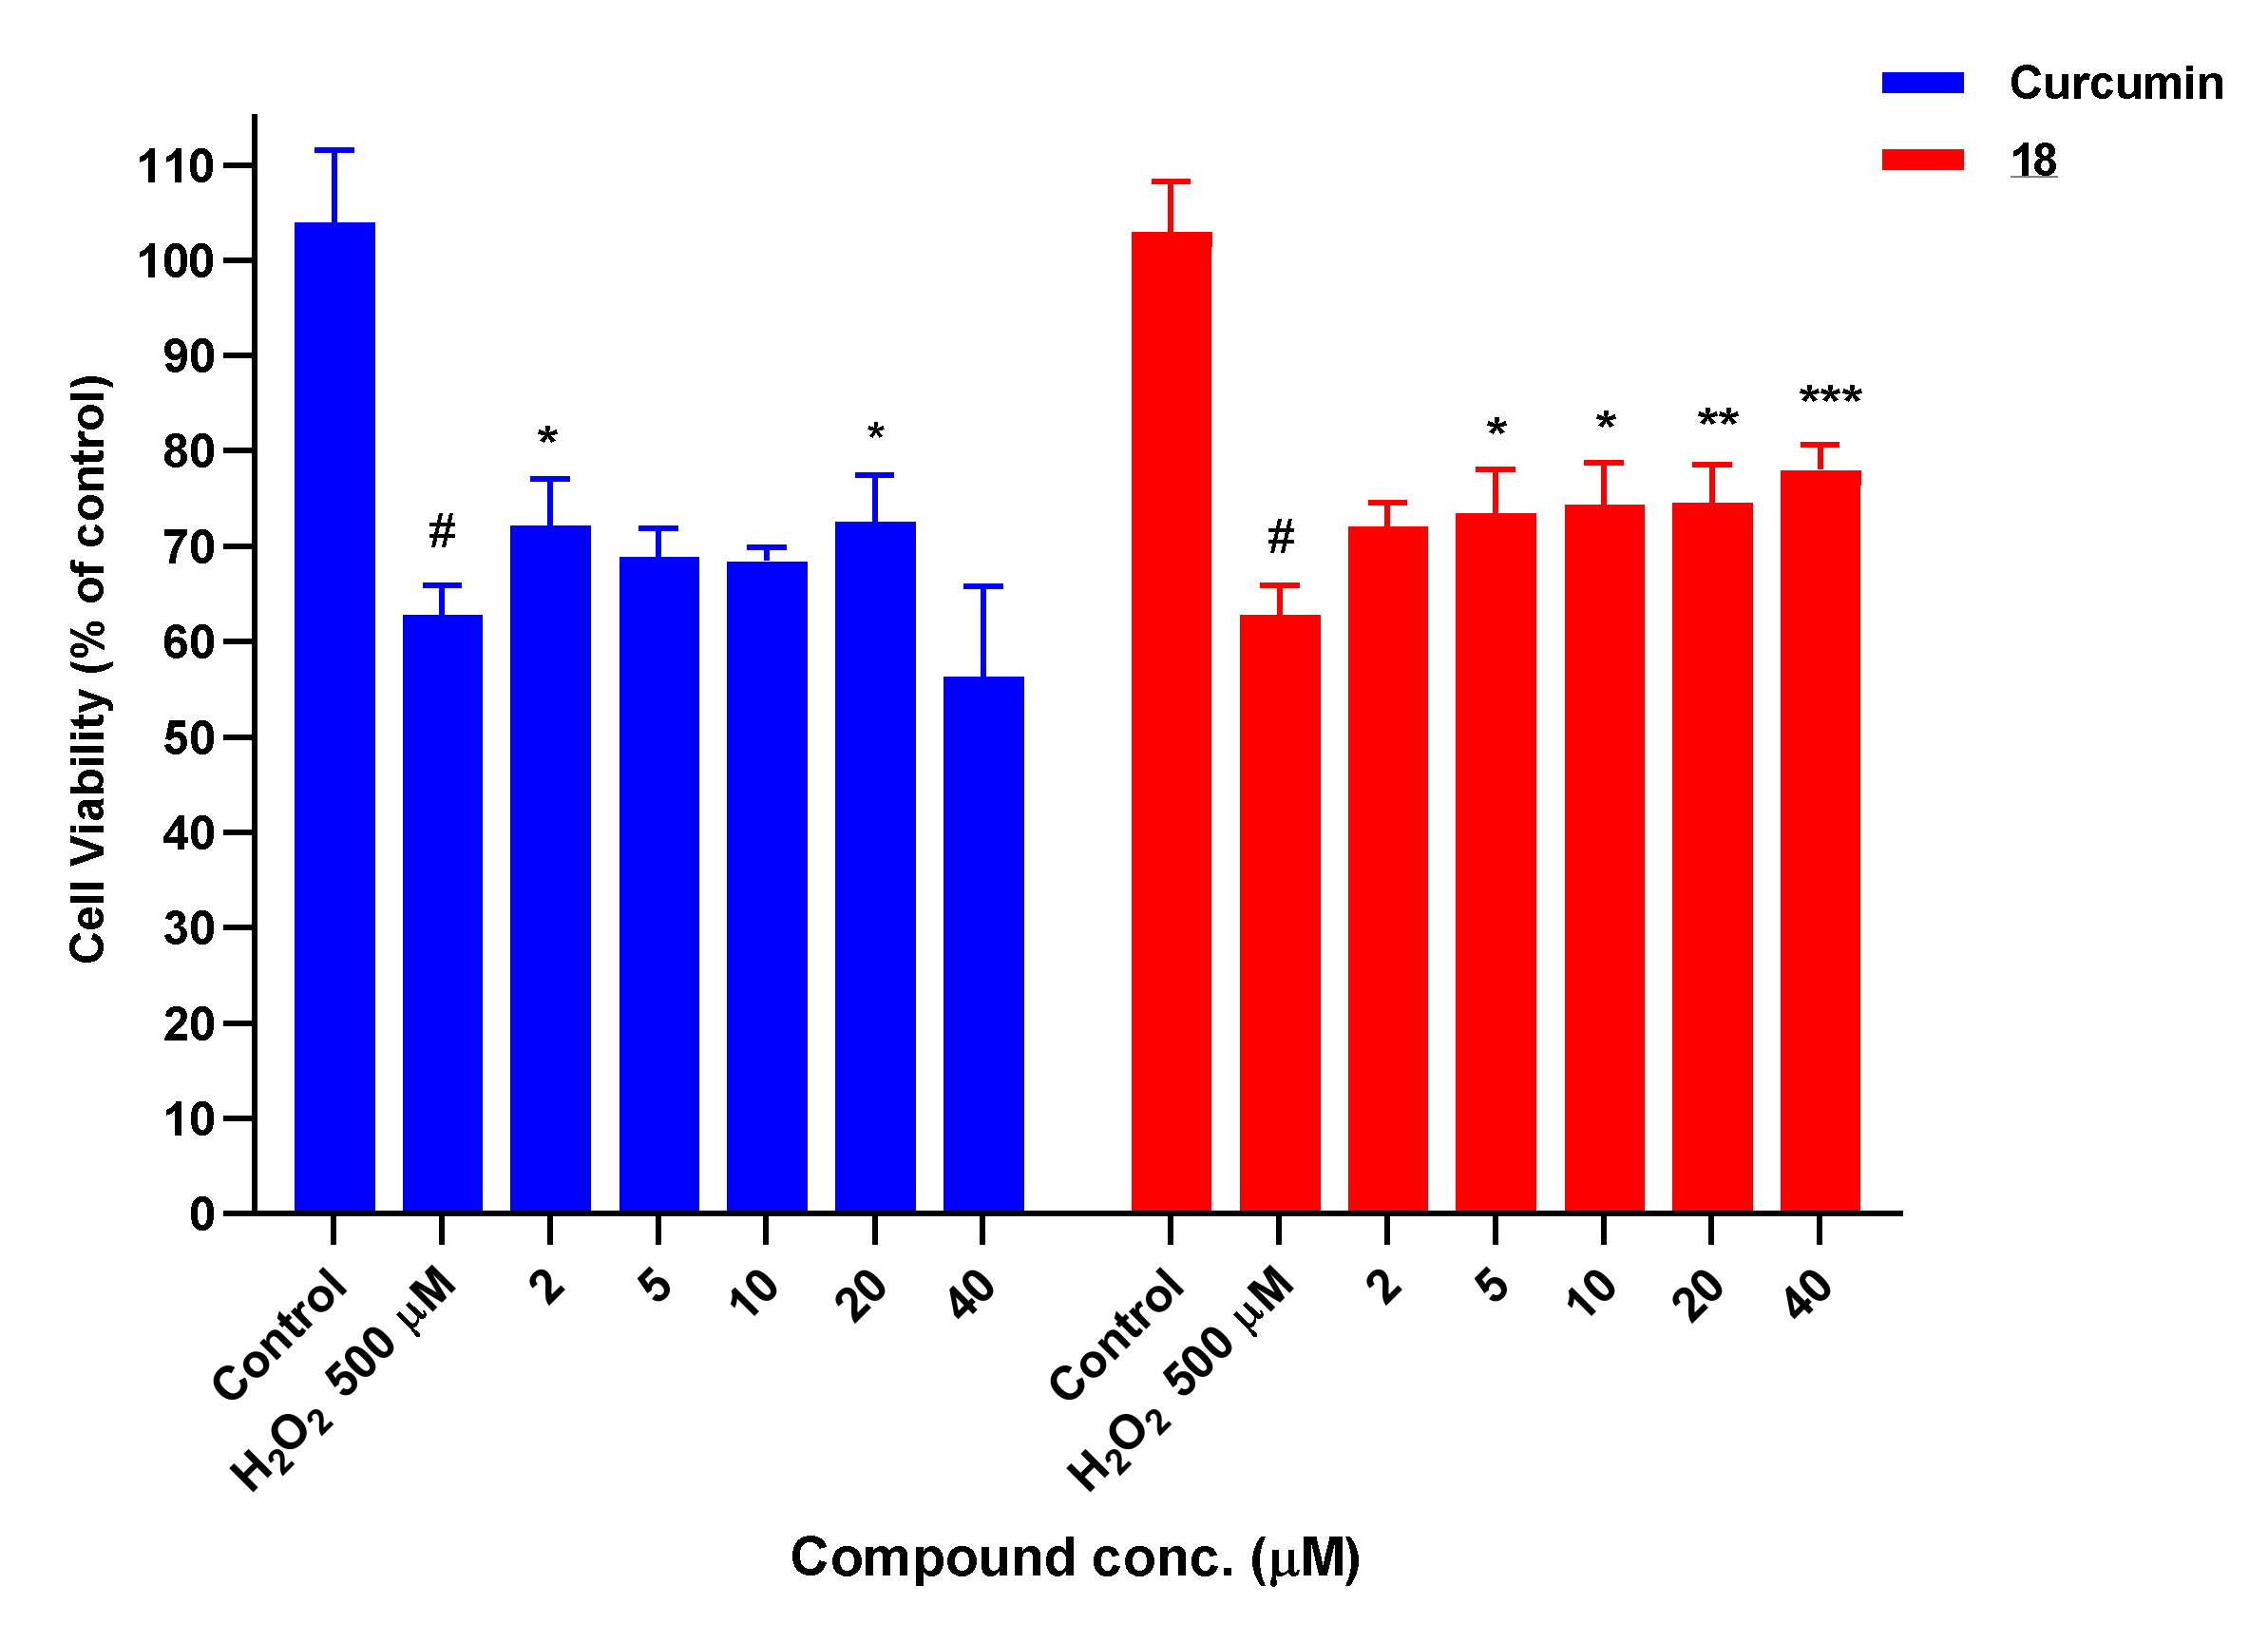
3.7.1. Neuroprotection against H2O2-Induced Oxidative Stress
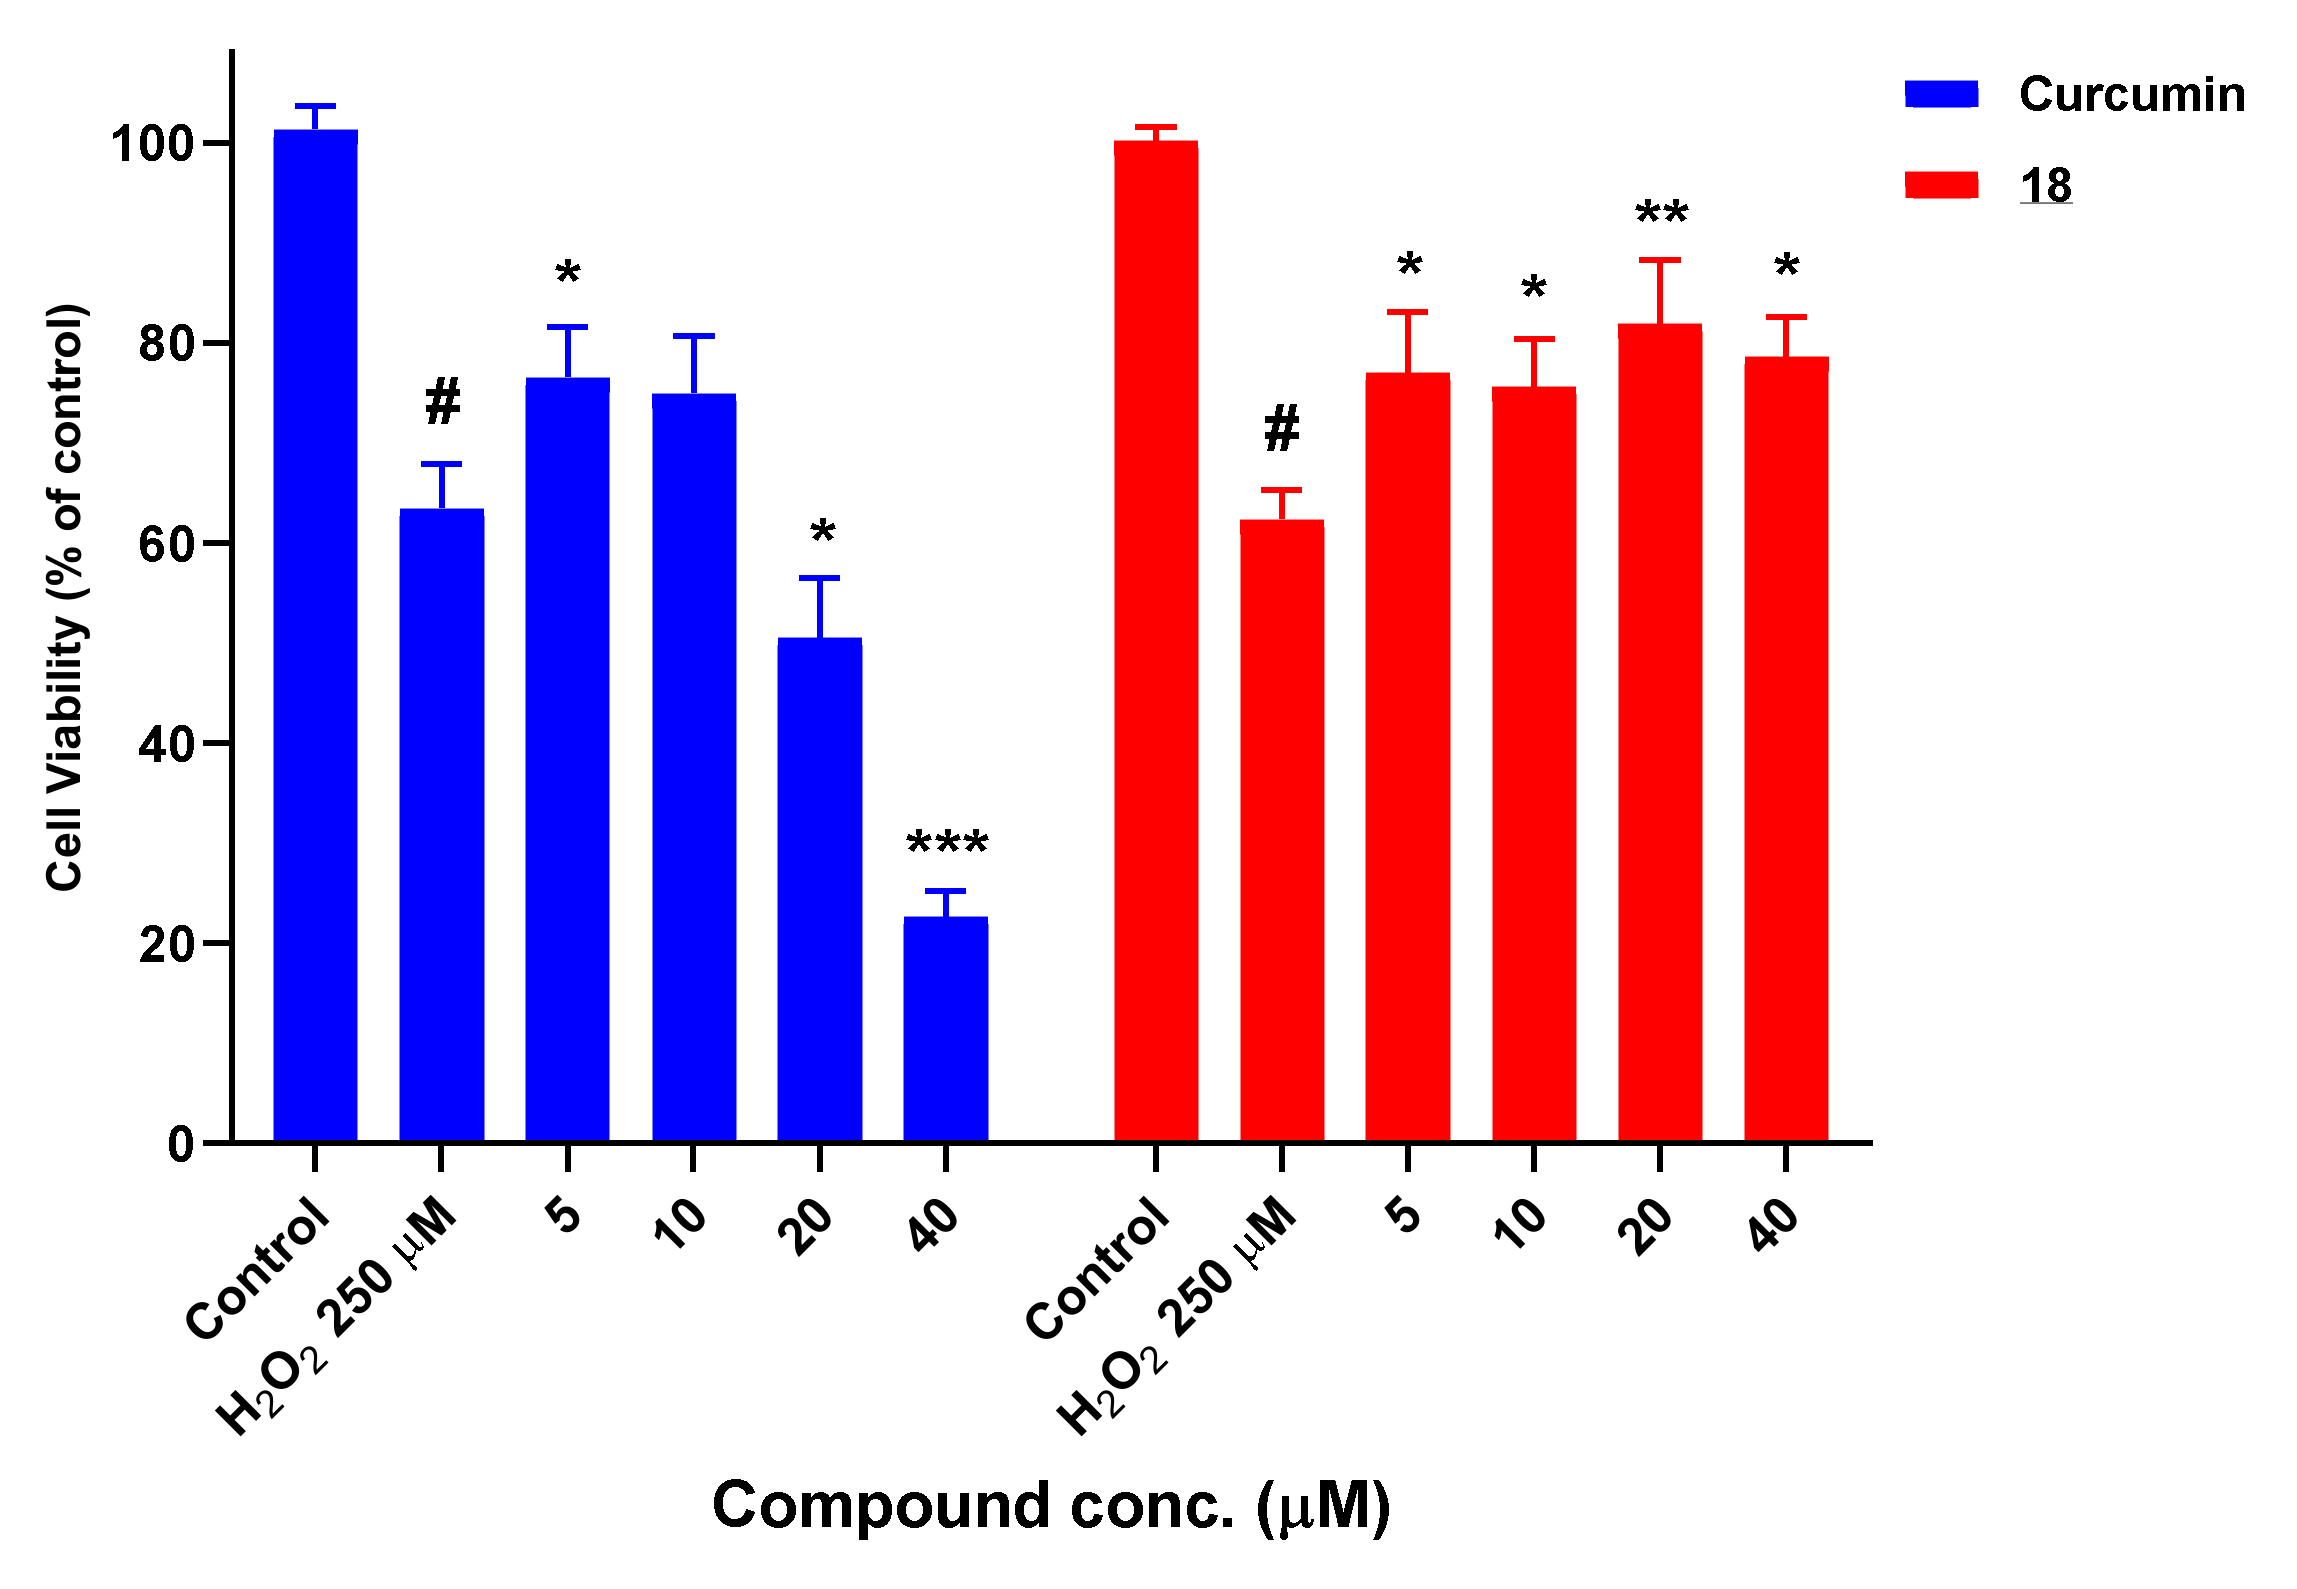
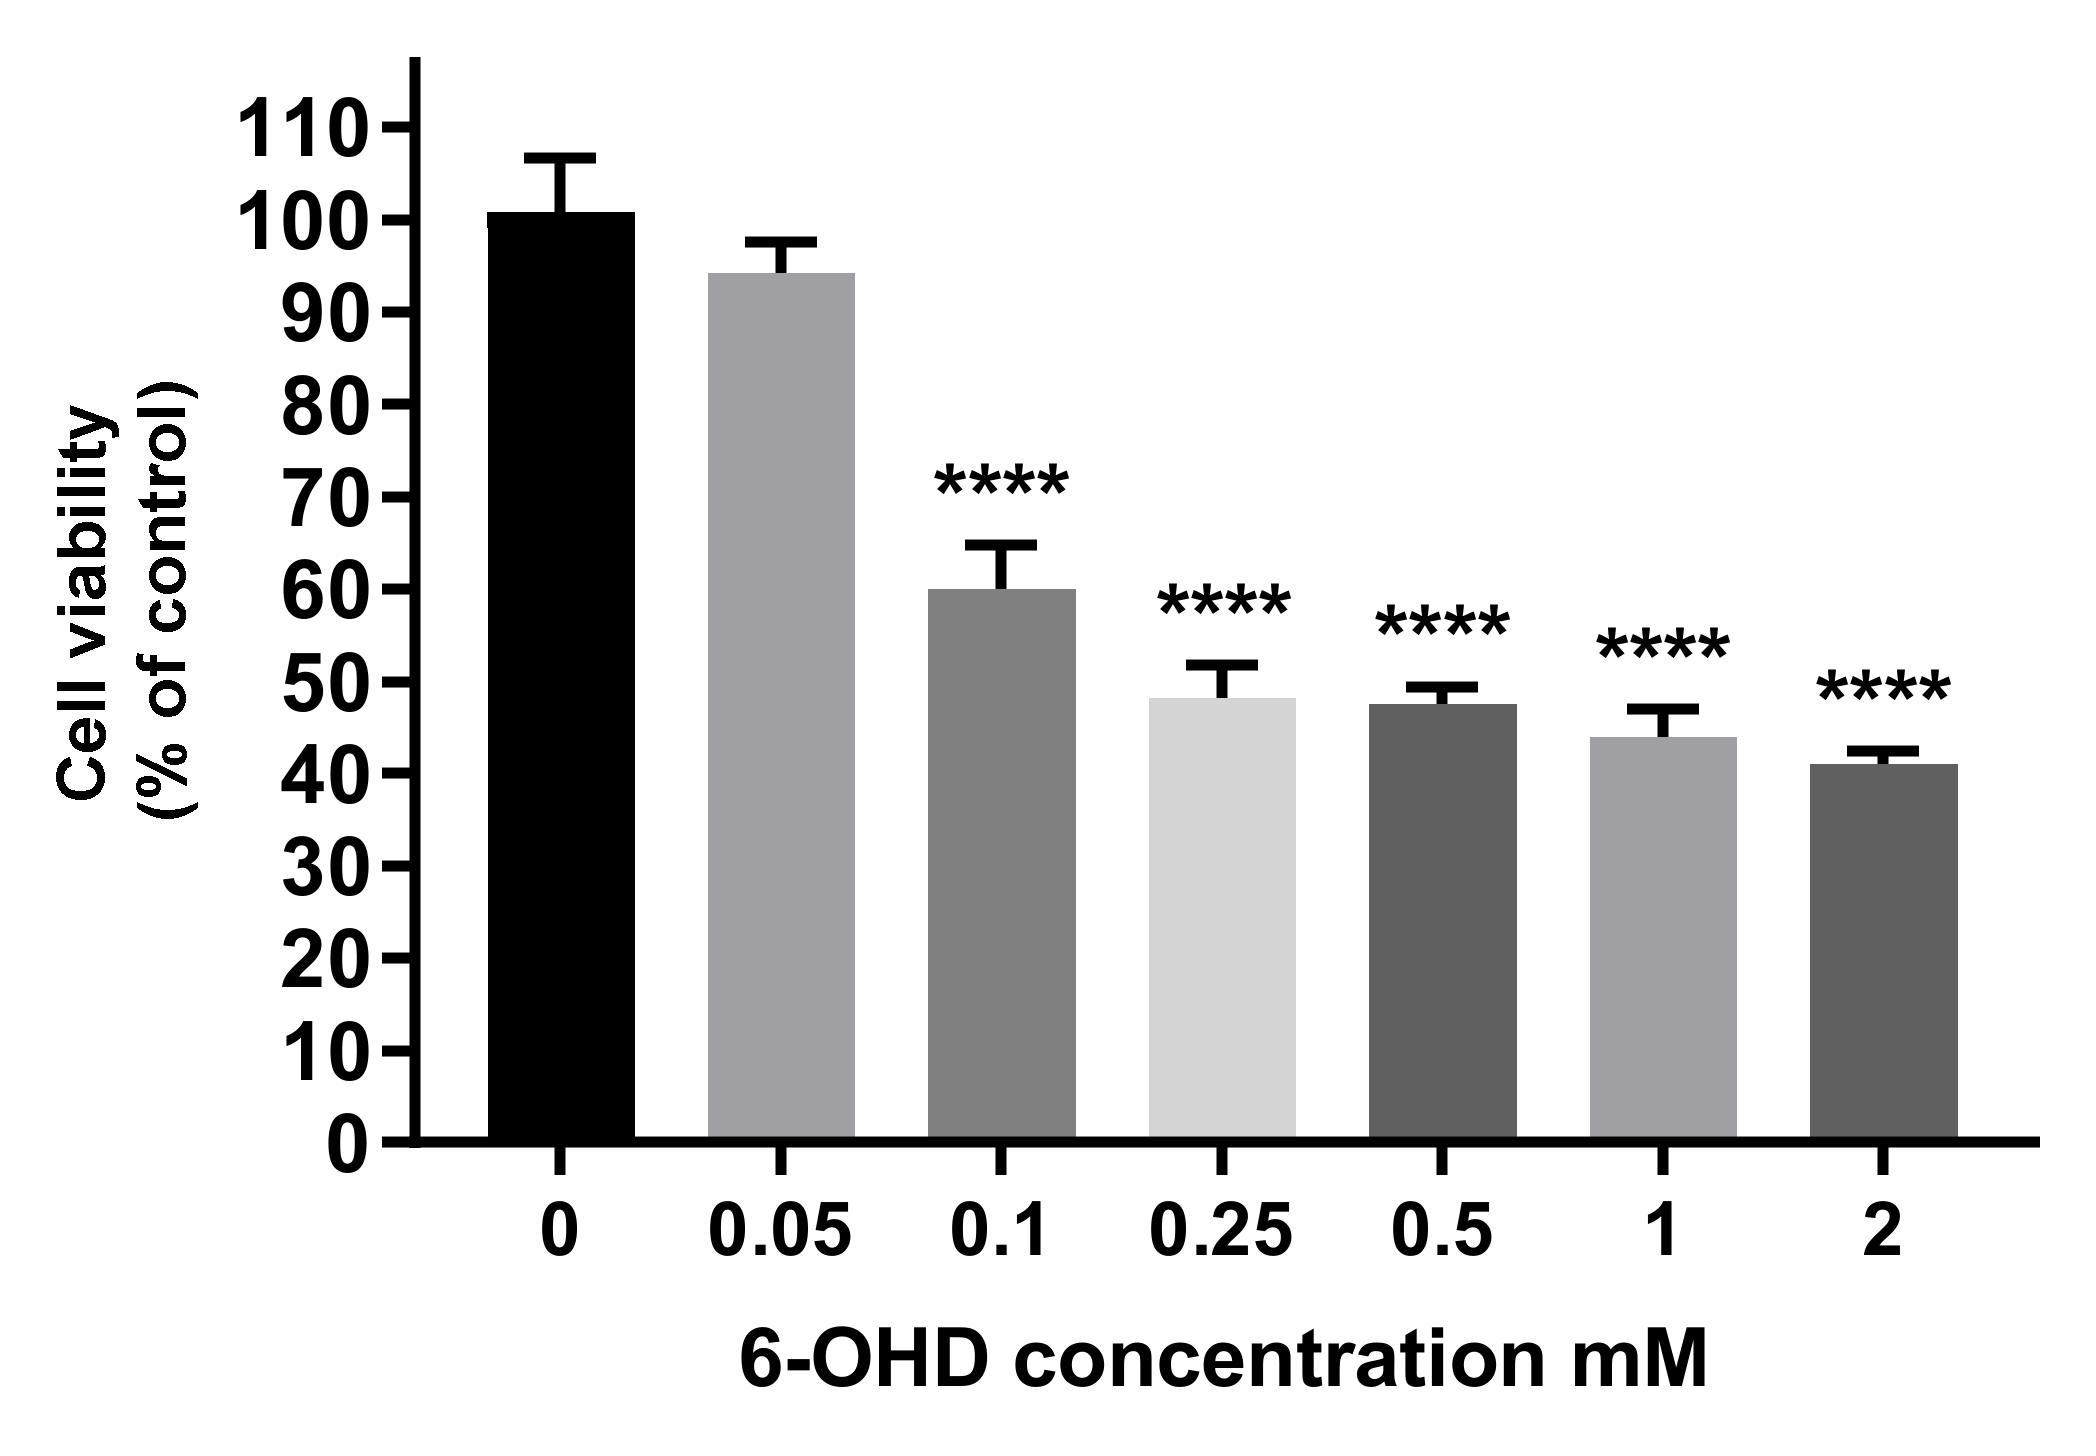
3.7.2. Neuroprotection Studies in the 6-OHD Neurotoxicity-Induced Model
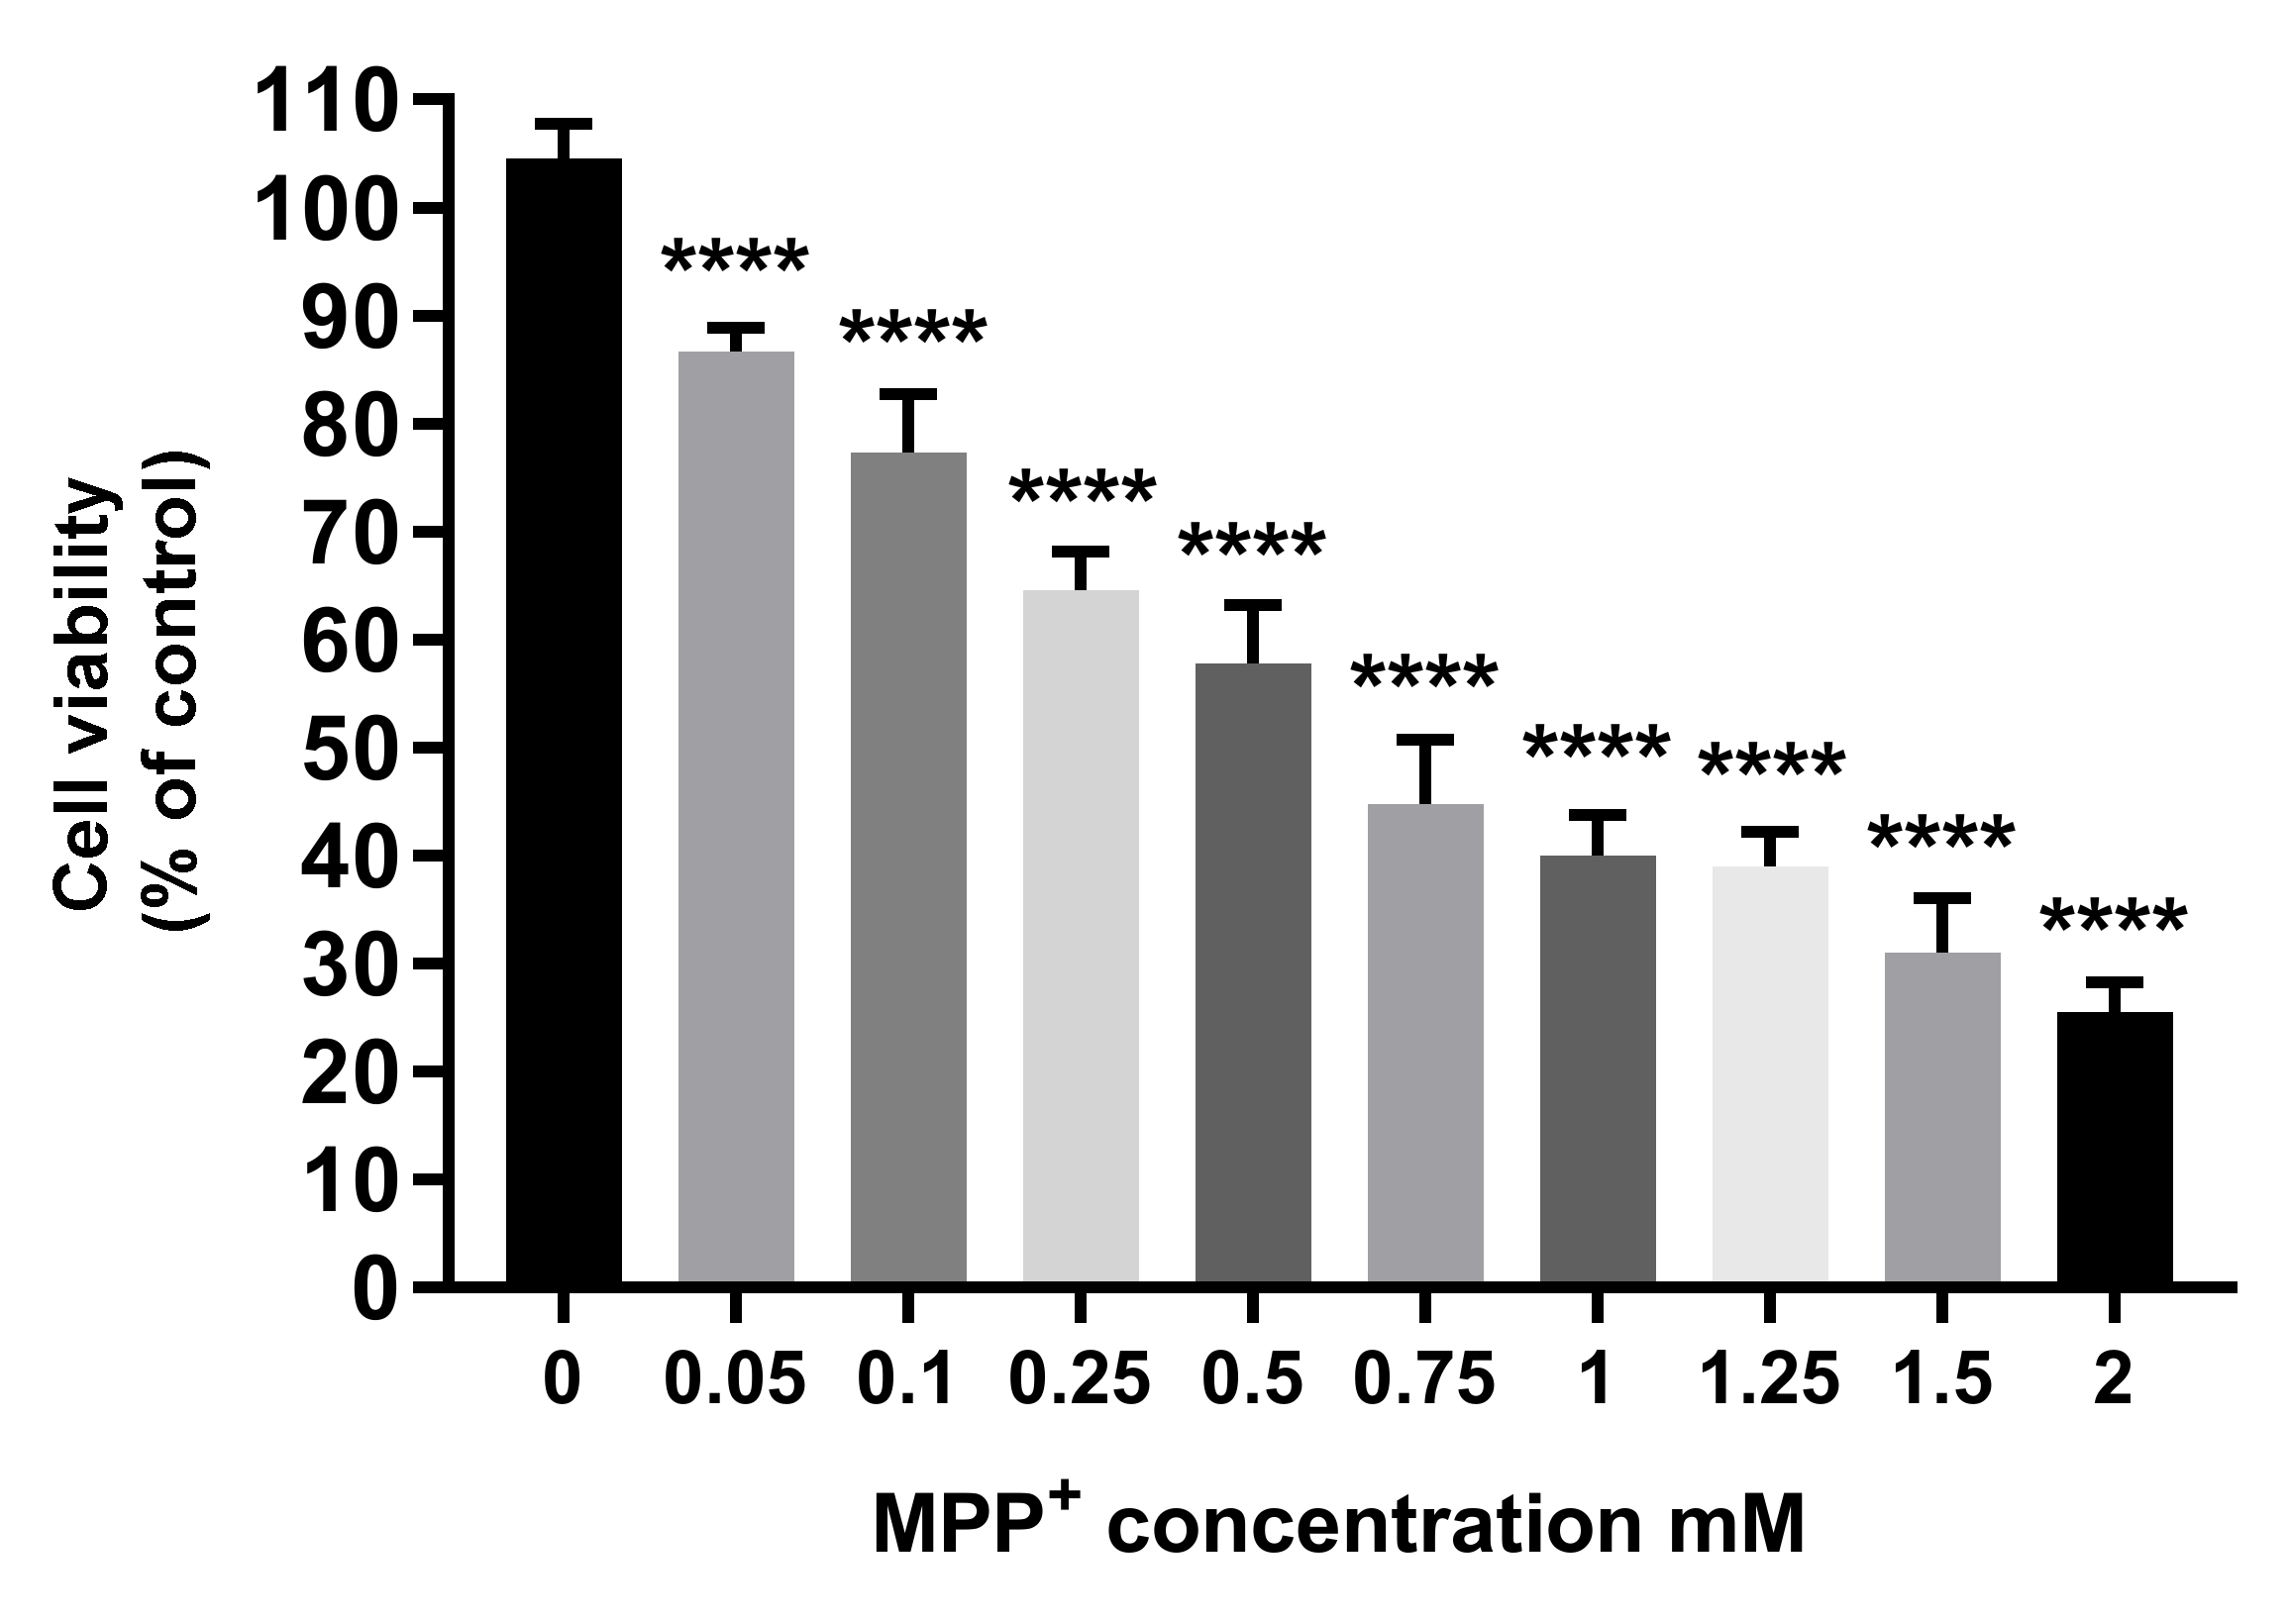
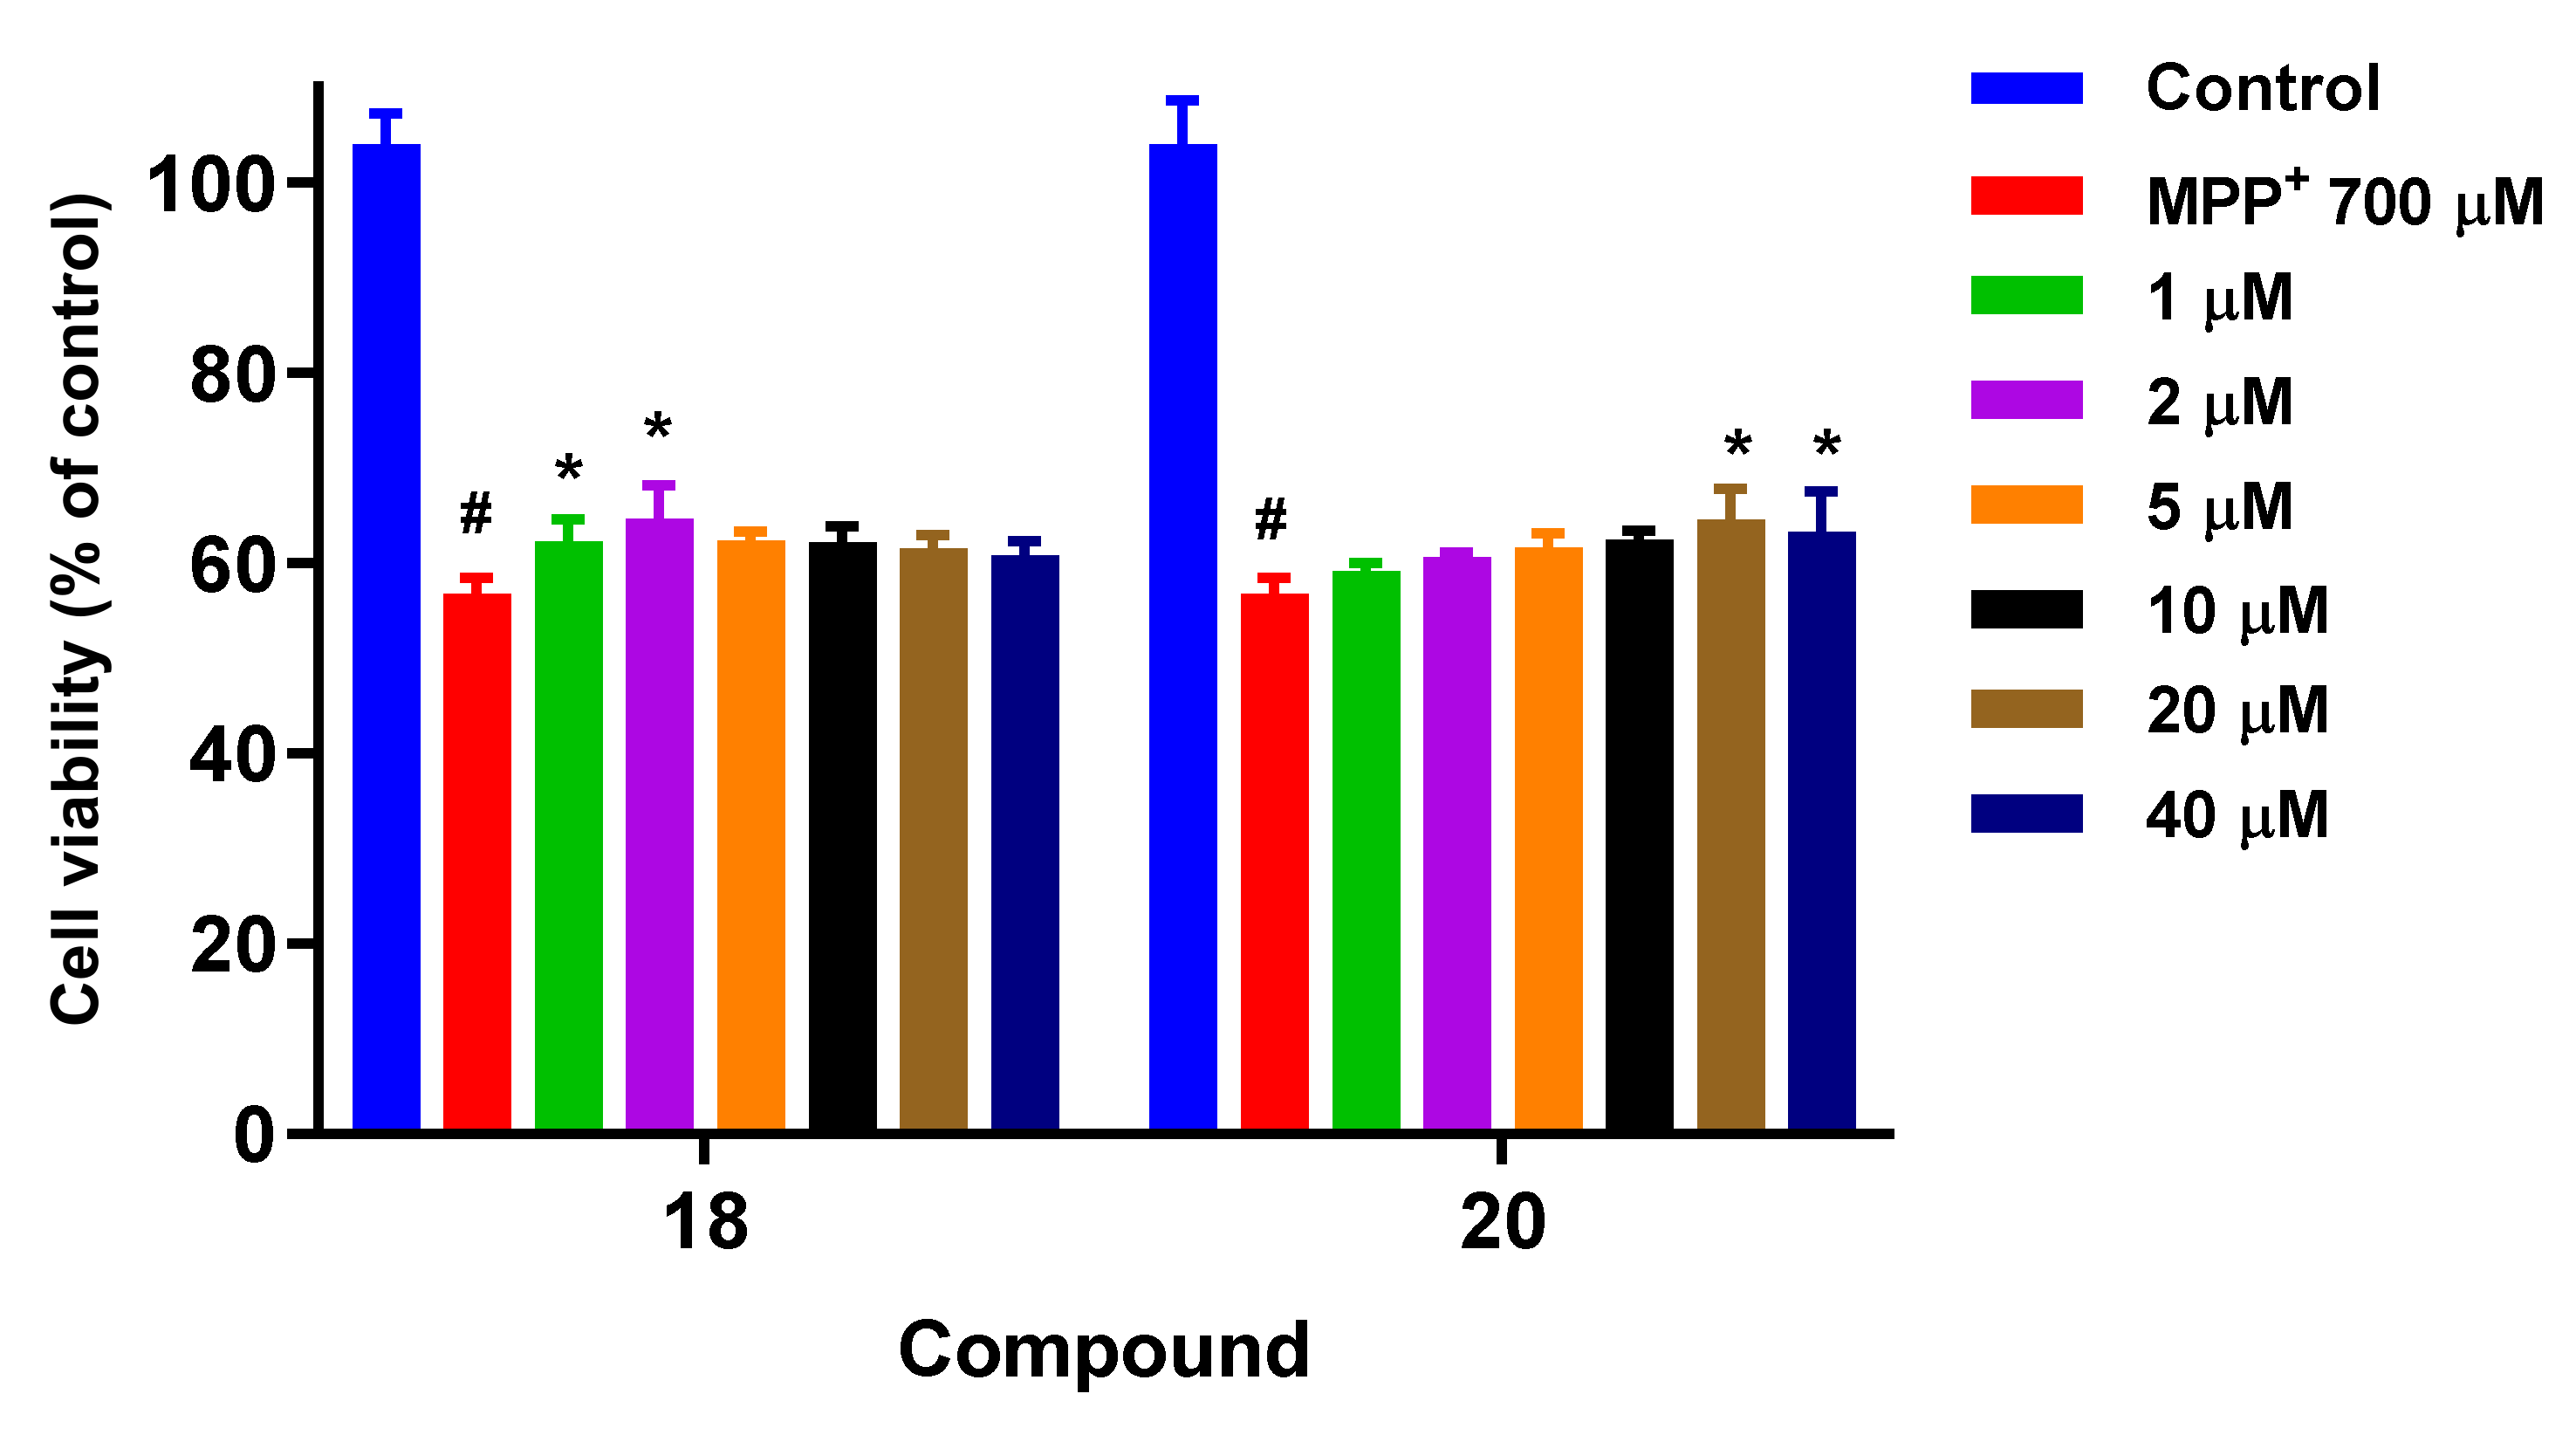
3.7.3. Neuroprotection Studies in the MPP+ Neurotoxicity-Induced Model
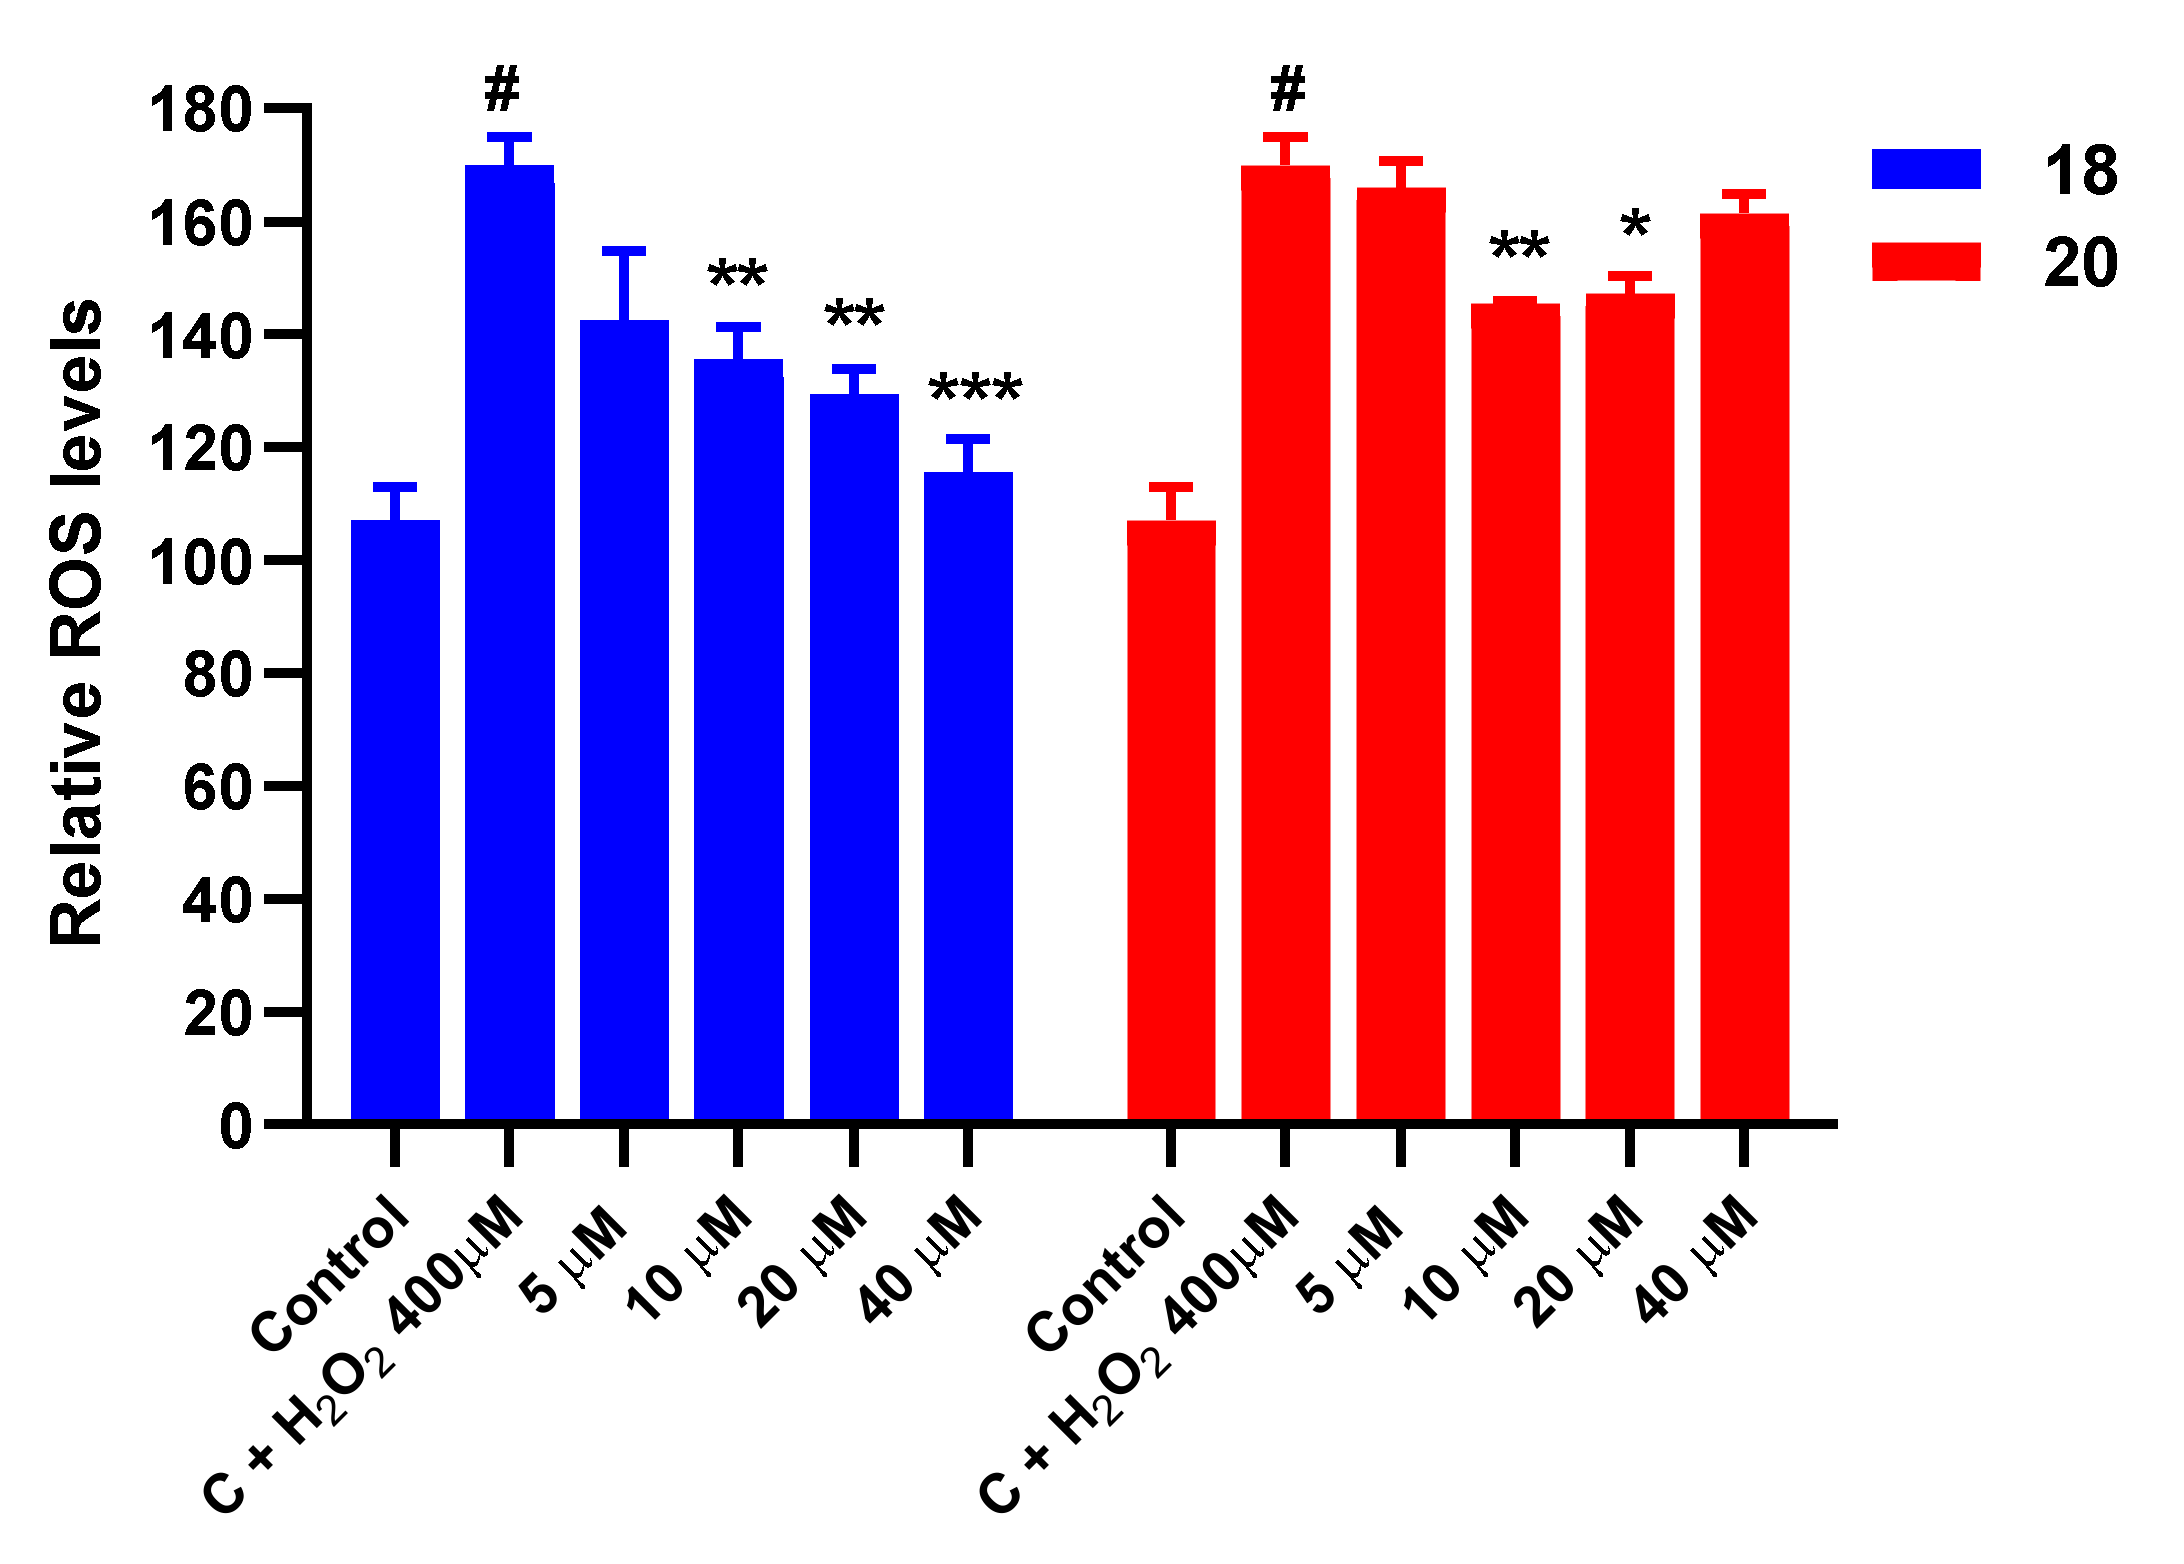
3.8. Effect on ROS Levels in SH-SY5Y Cells under Oxidative Stress
3.9. Protection against Mitochondrial Membrane (ΔΨm) Depolarization Induced by Oxidative Stress
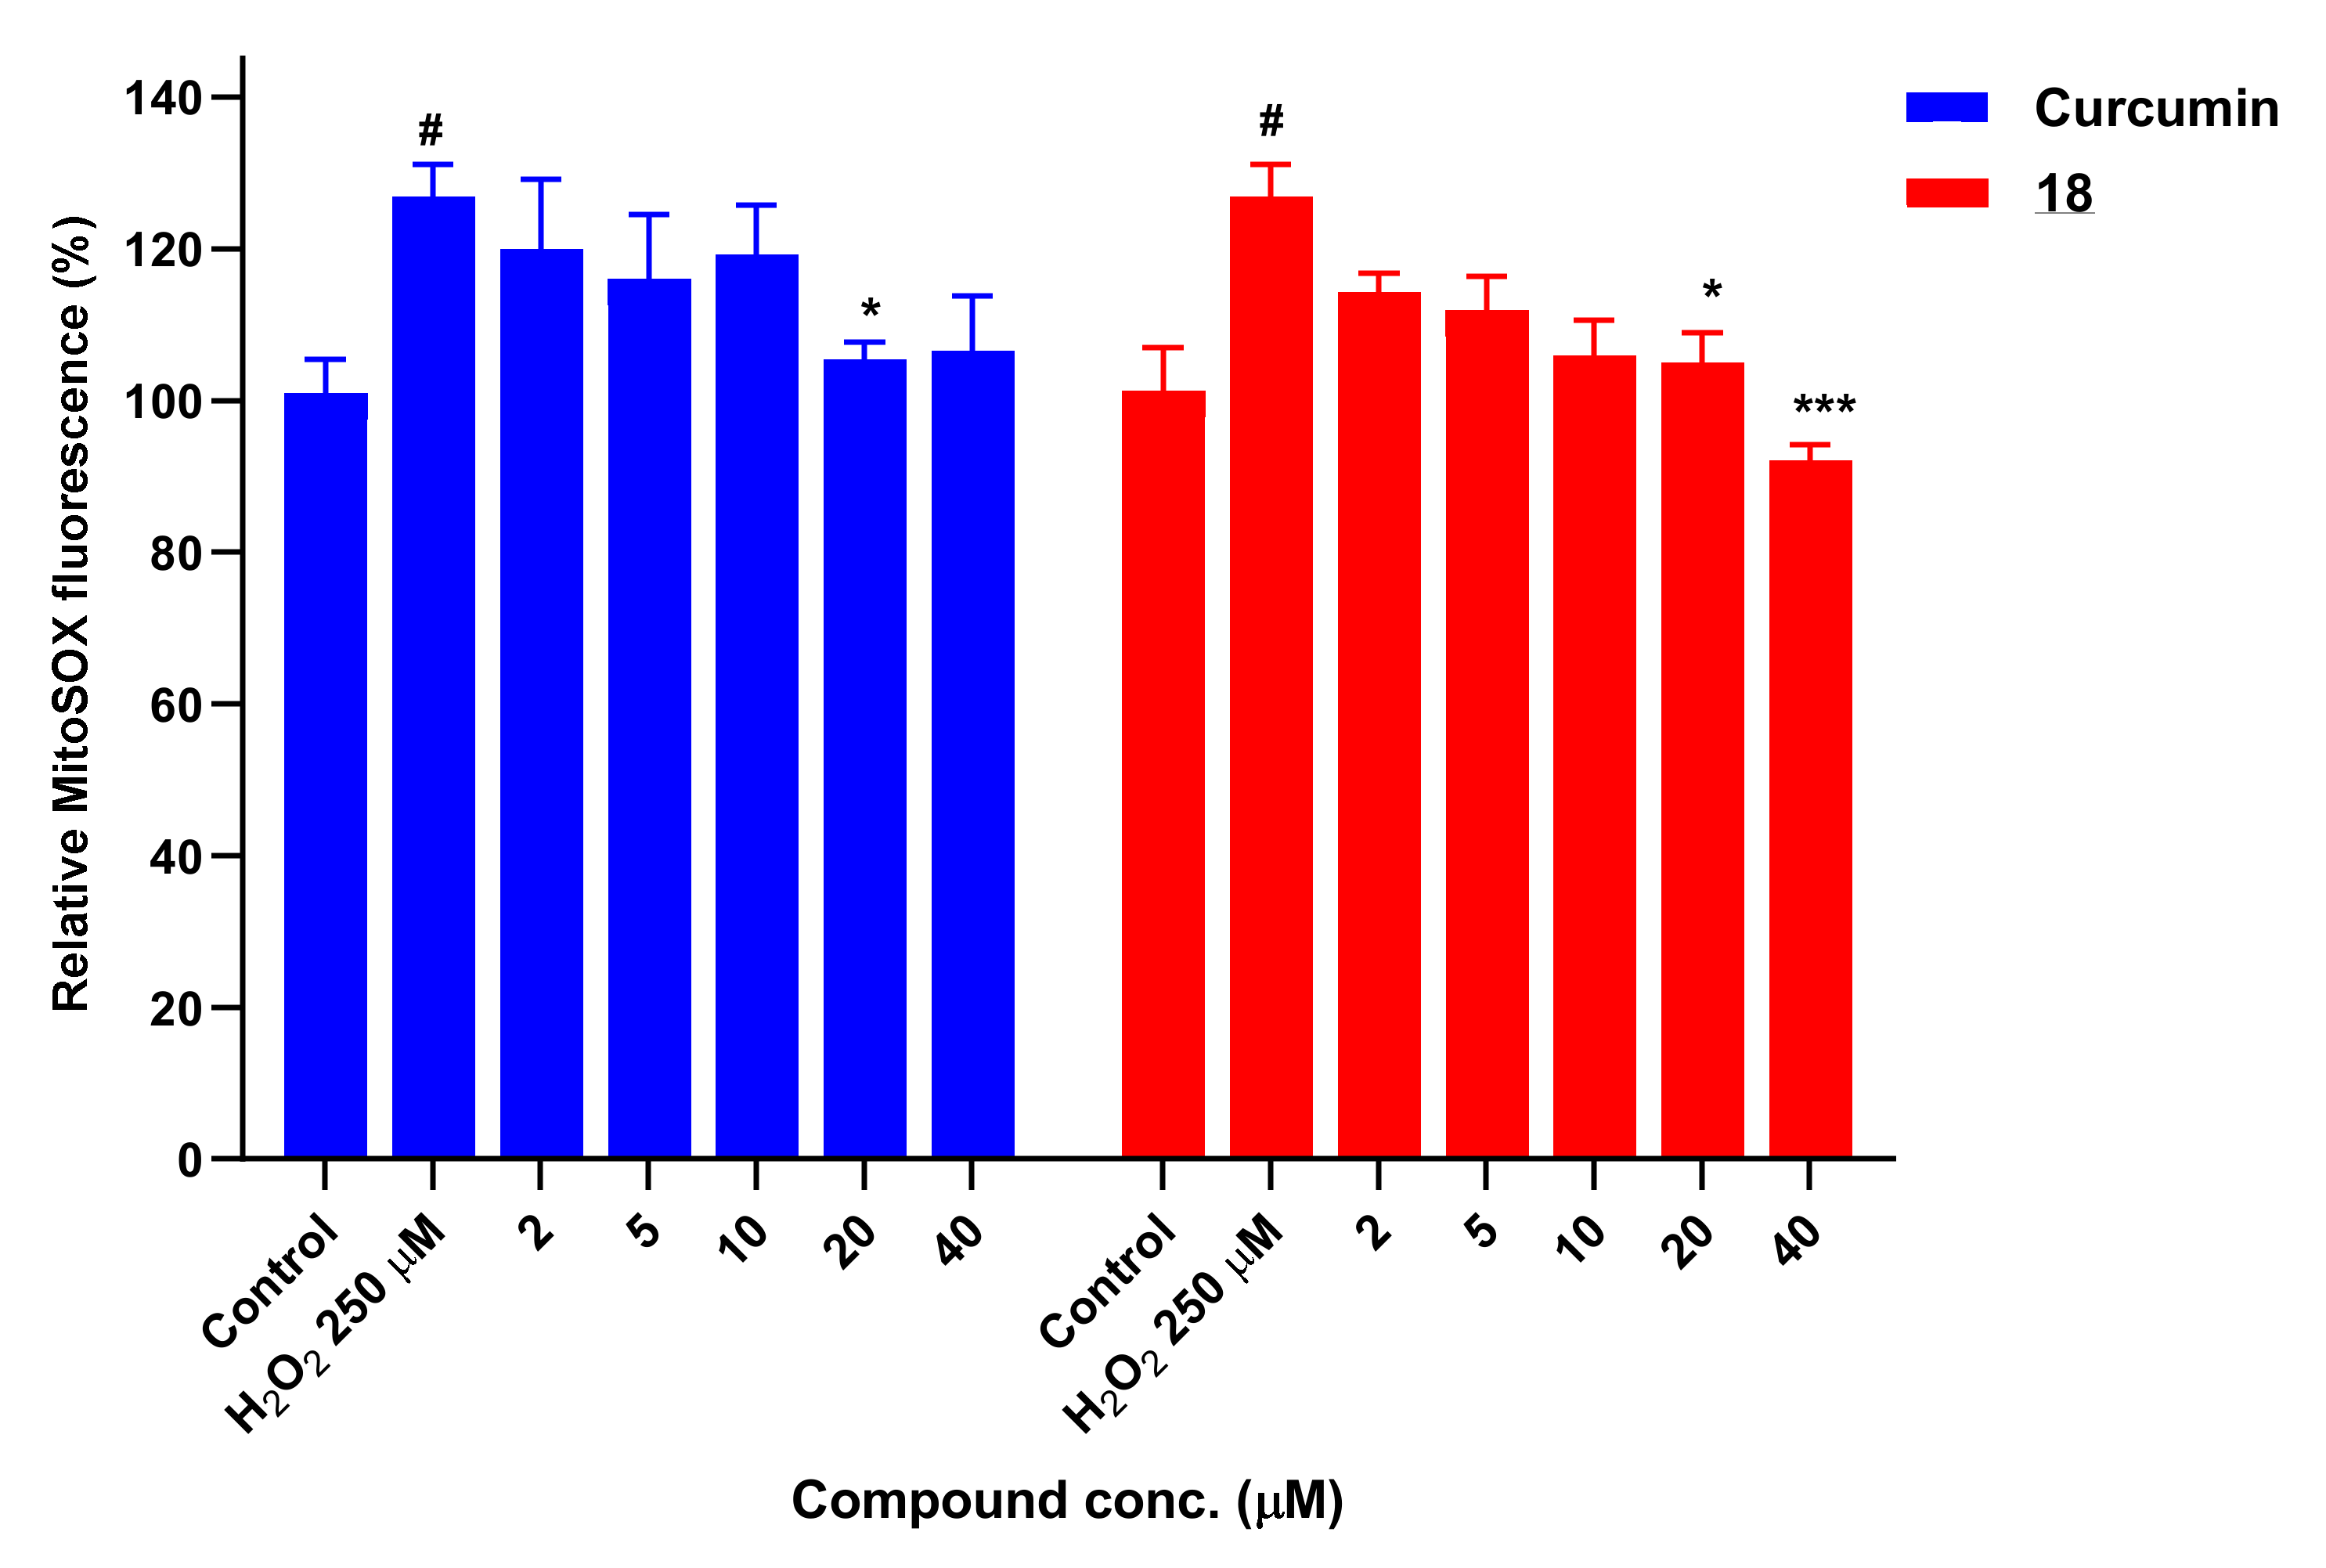
3.10. Determination of Mitochondrial Superoxide Levels with MitoSOX
3.11. Study of Apoptosis and Necrosis
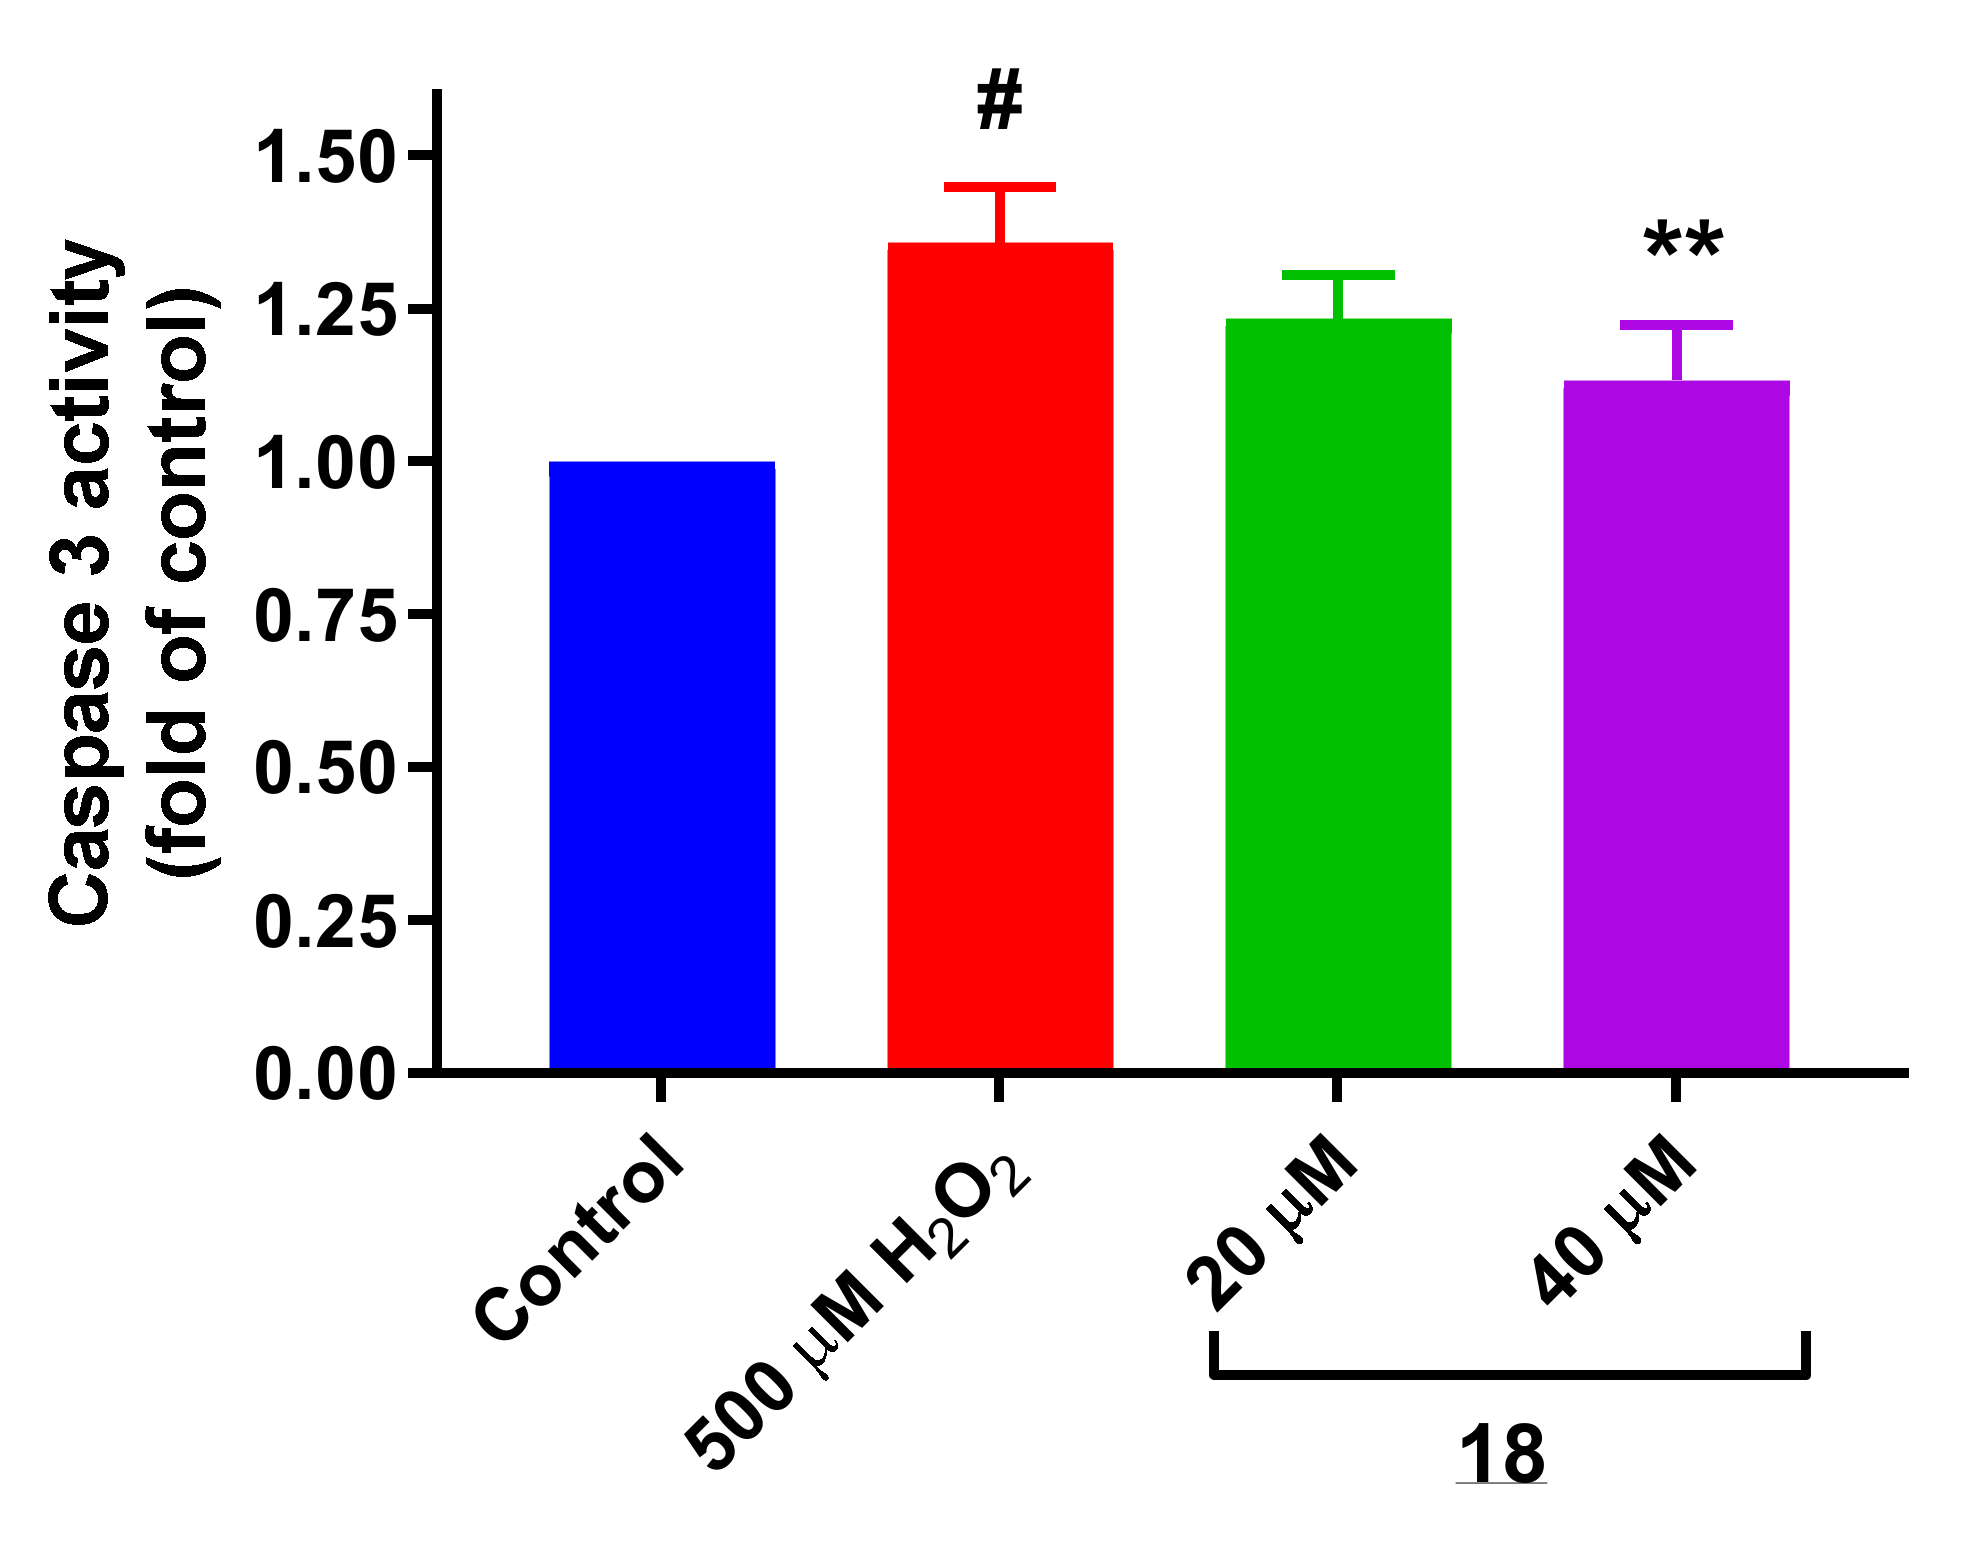
3.11.1. Evaluation of Caspase 3 Activity
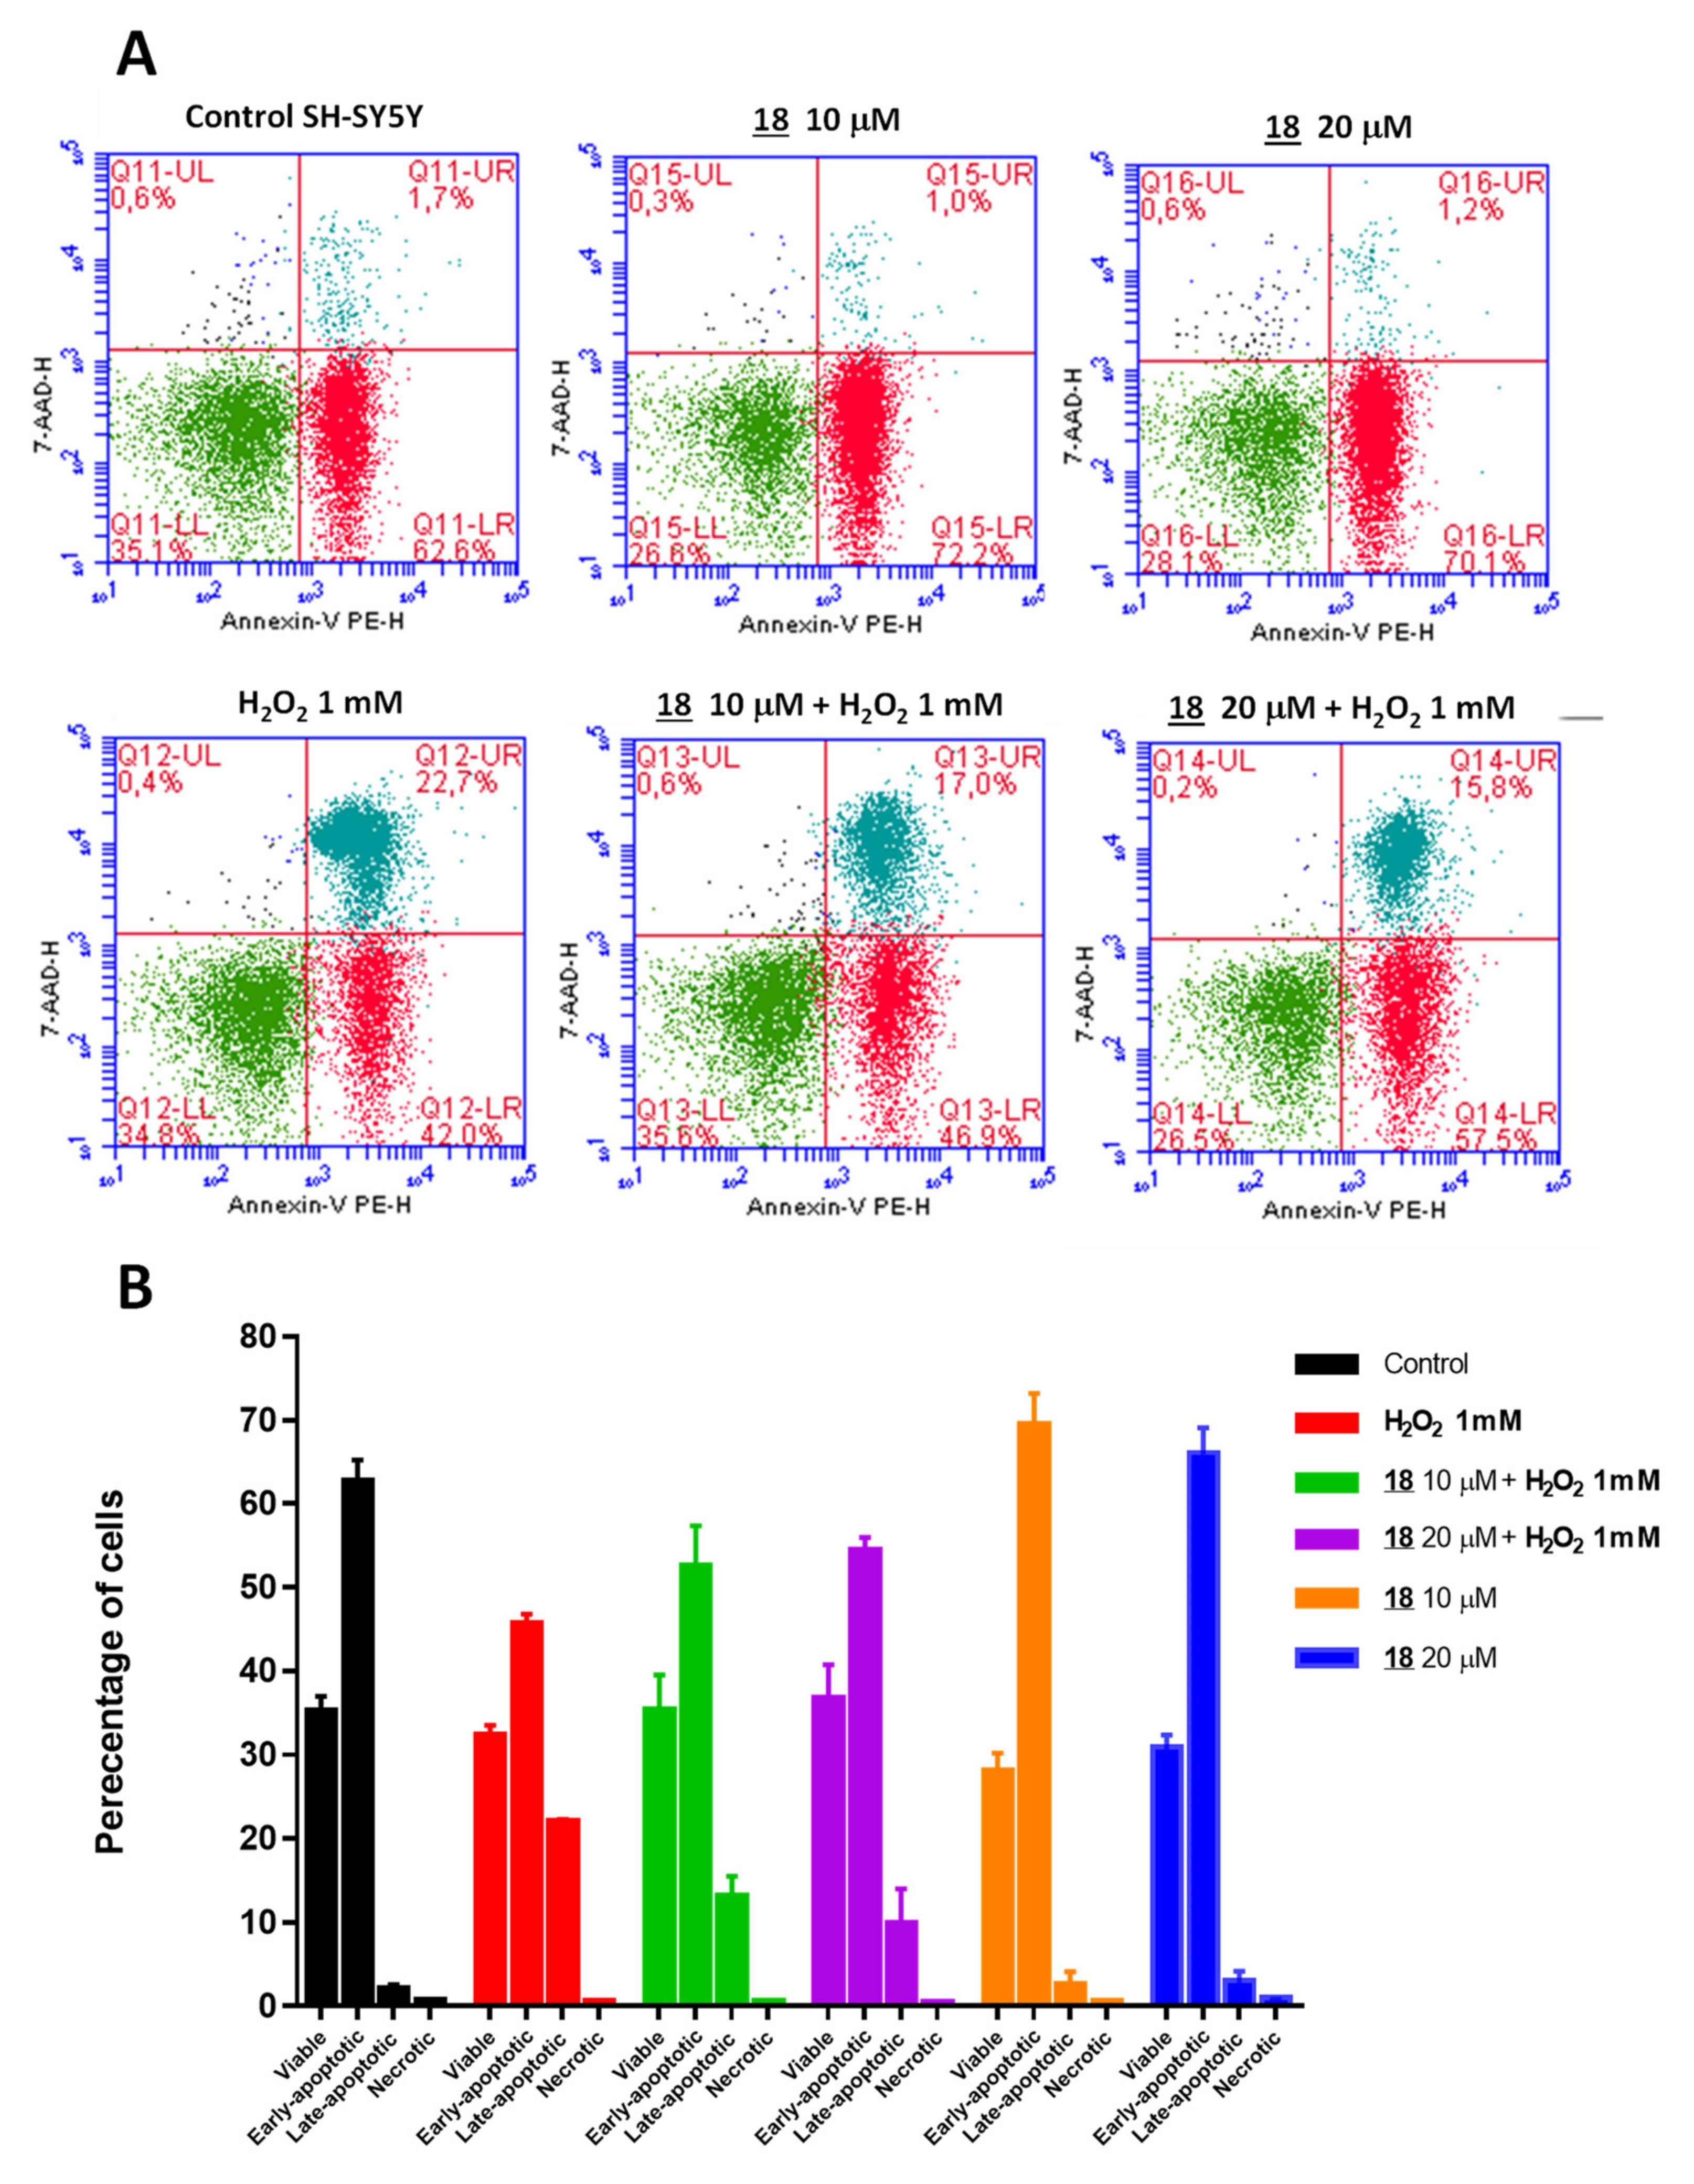
3.11.2. Study of Apoptosis and Necrosis by Flow Cytometry with Annexin-V PE/7-AAD
3.12. Determination of Lipid Peroxidation Levels
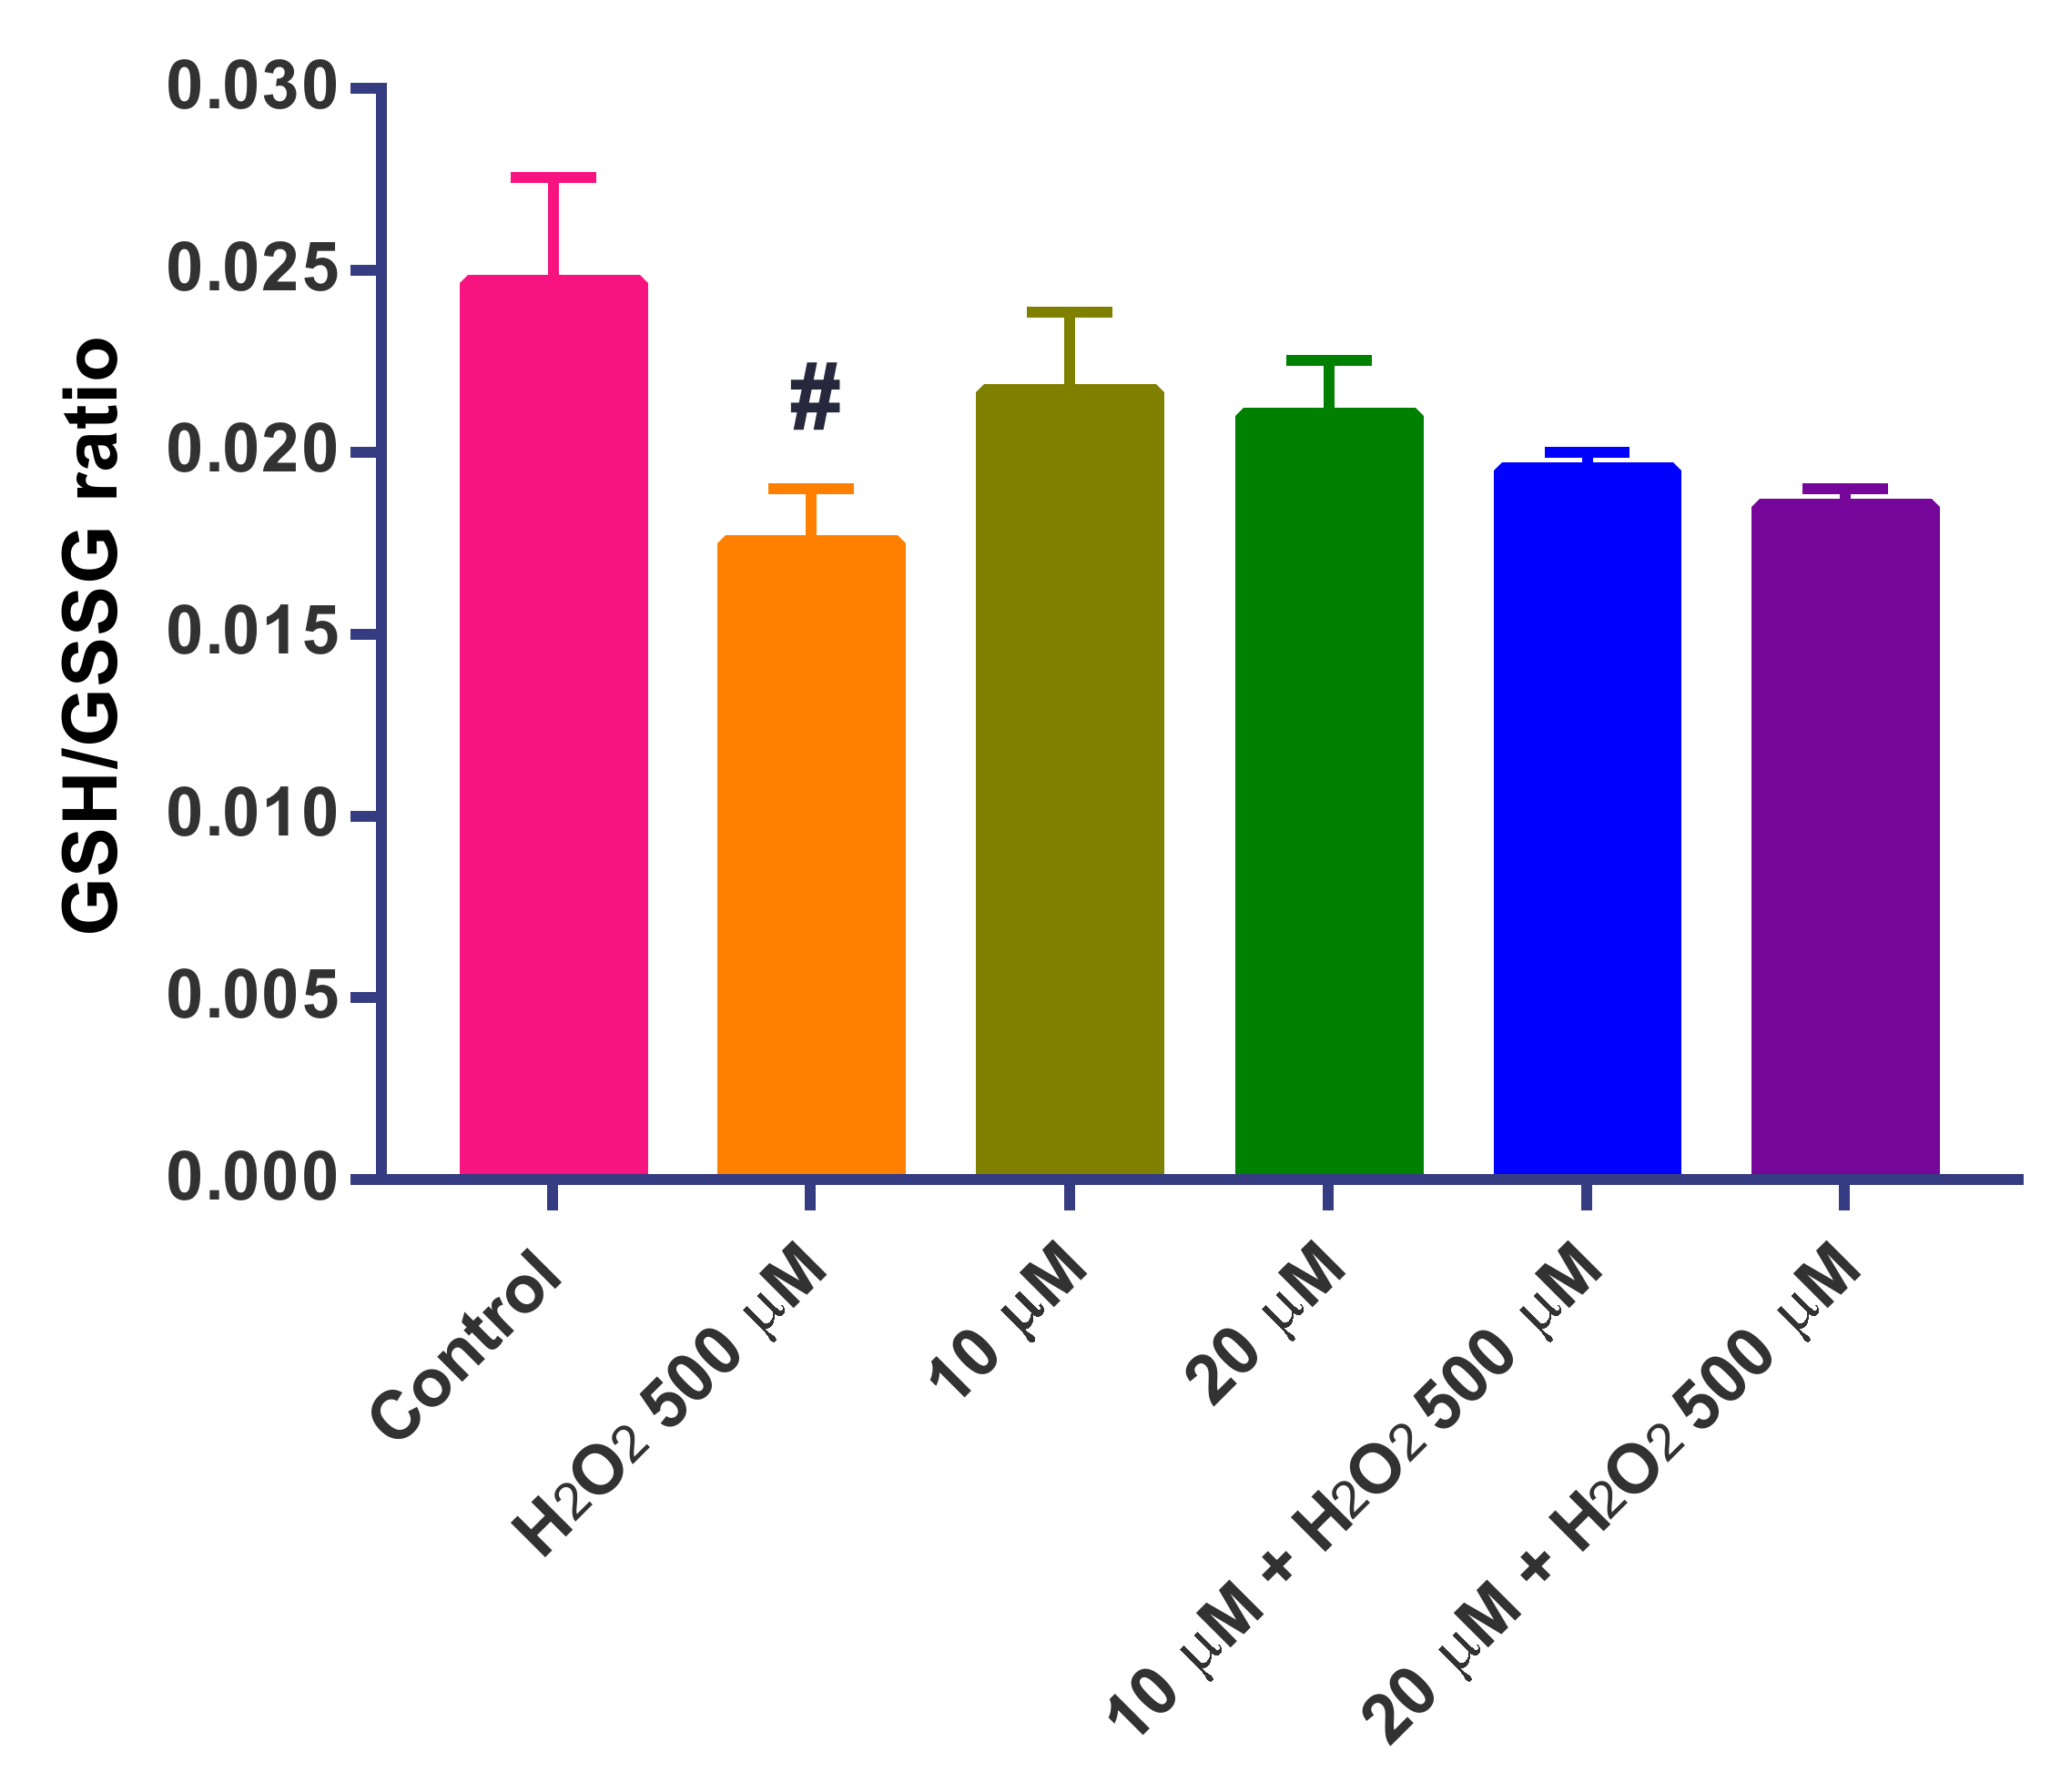
3.13. Determination of the GSH/GSSG Ratio
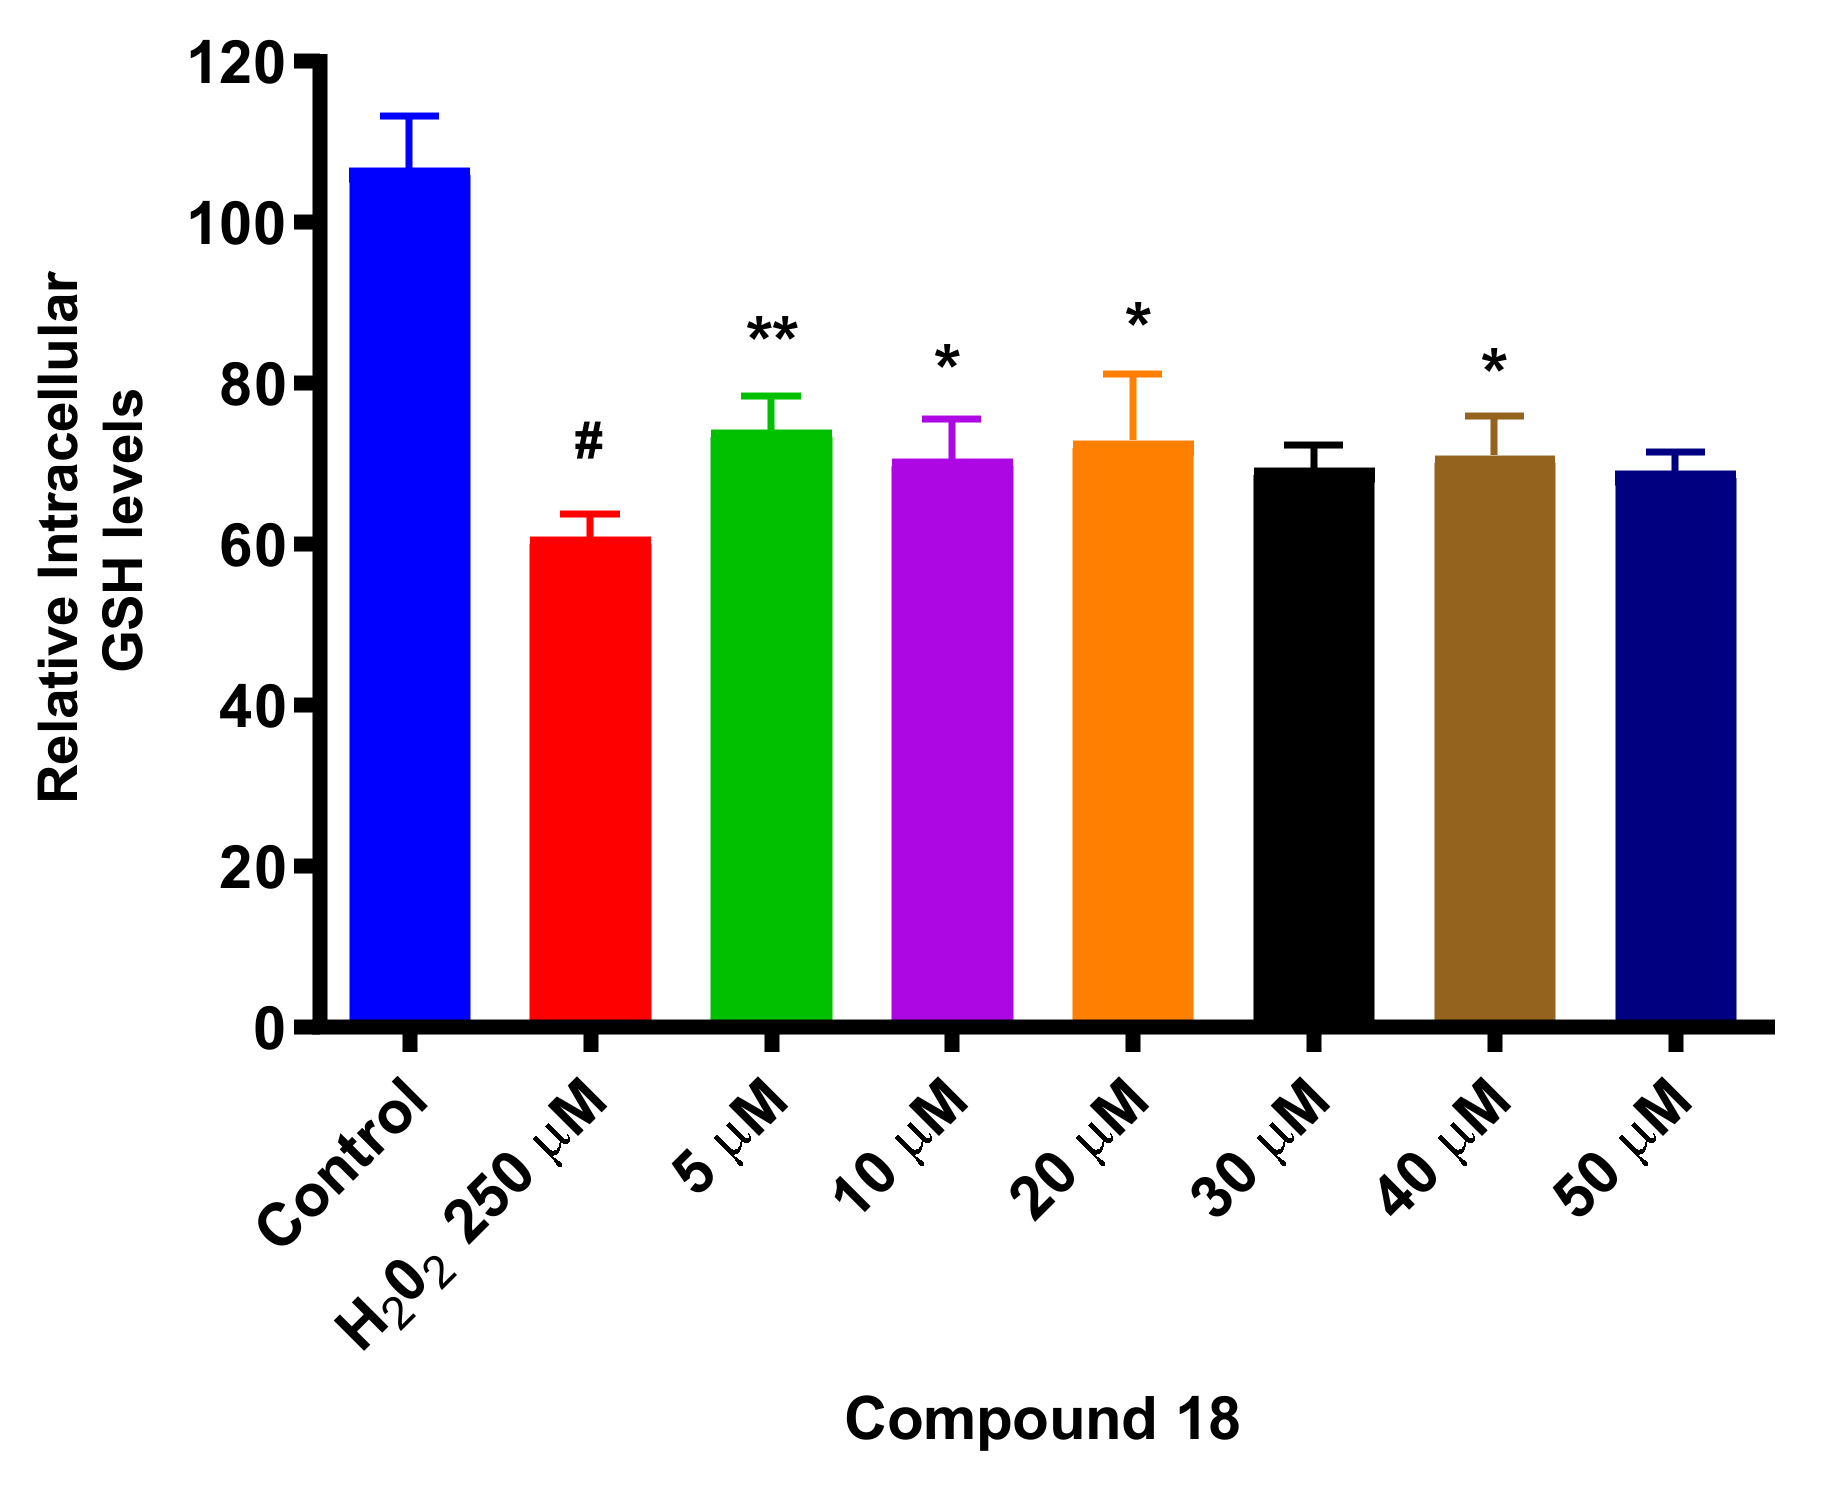
3.14. Determination of Intracellular GSH Levels
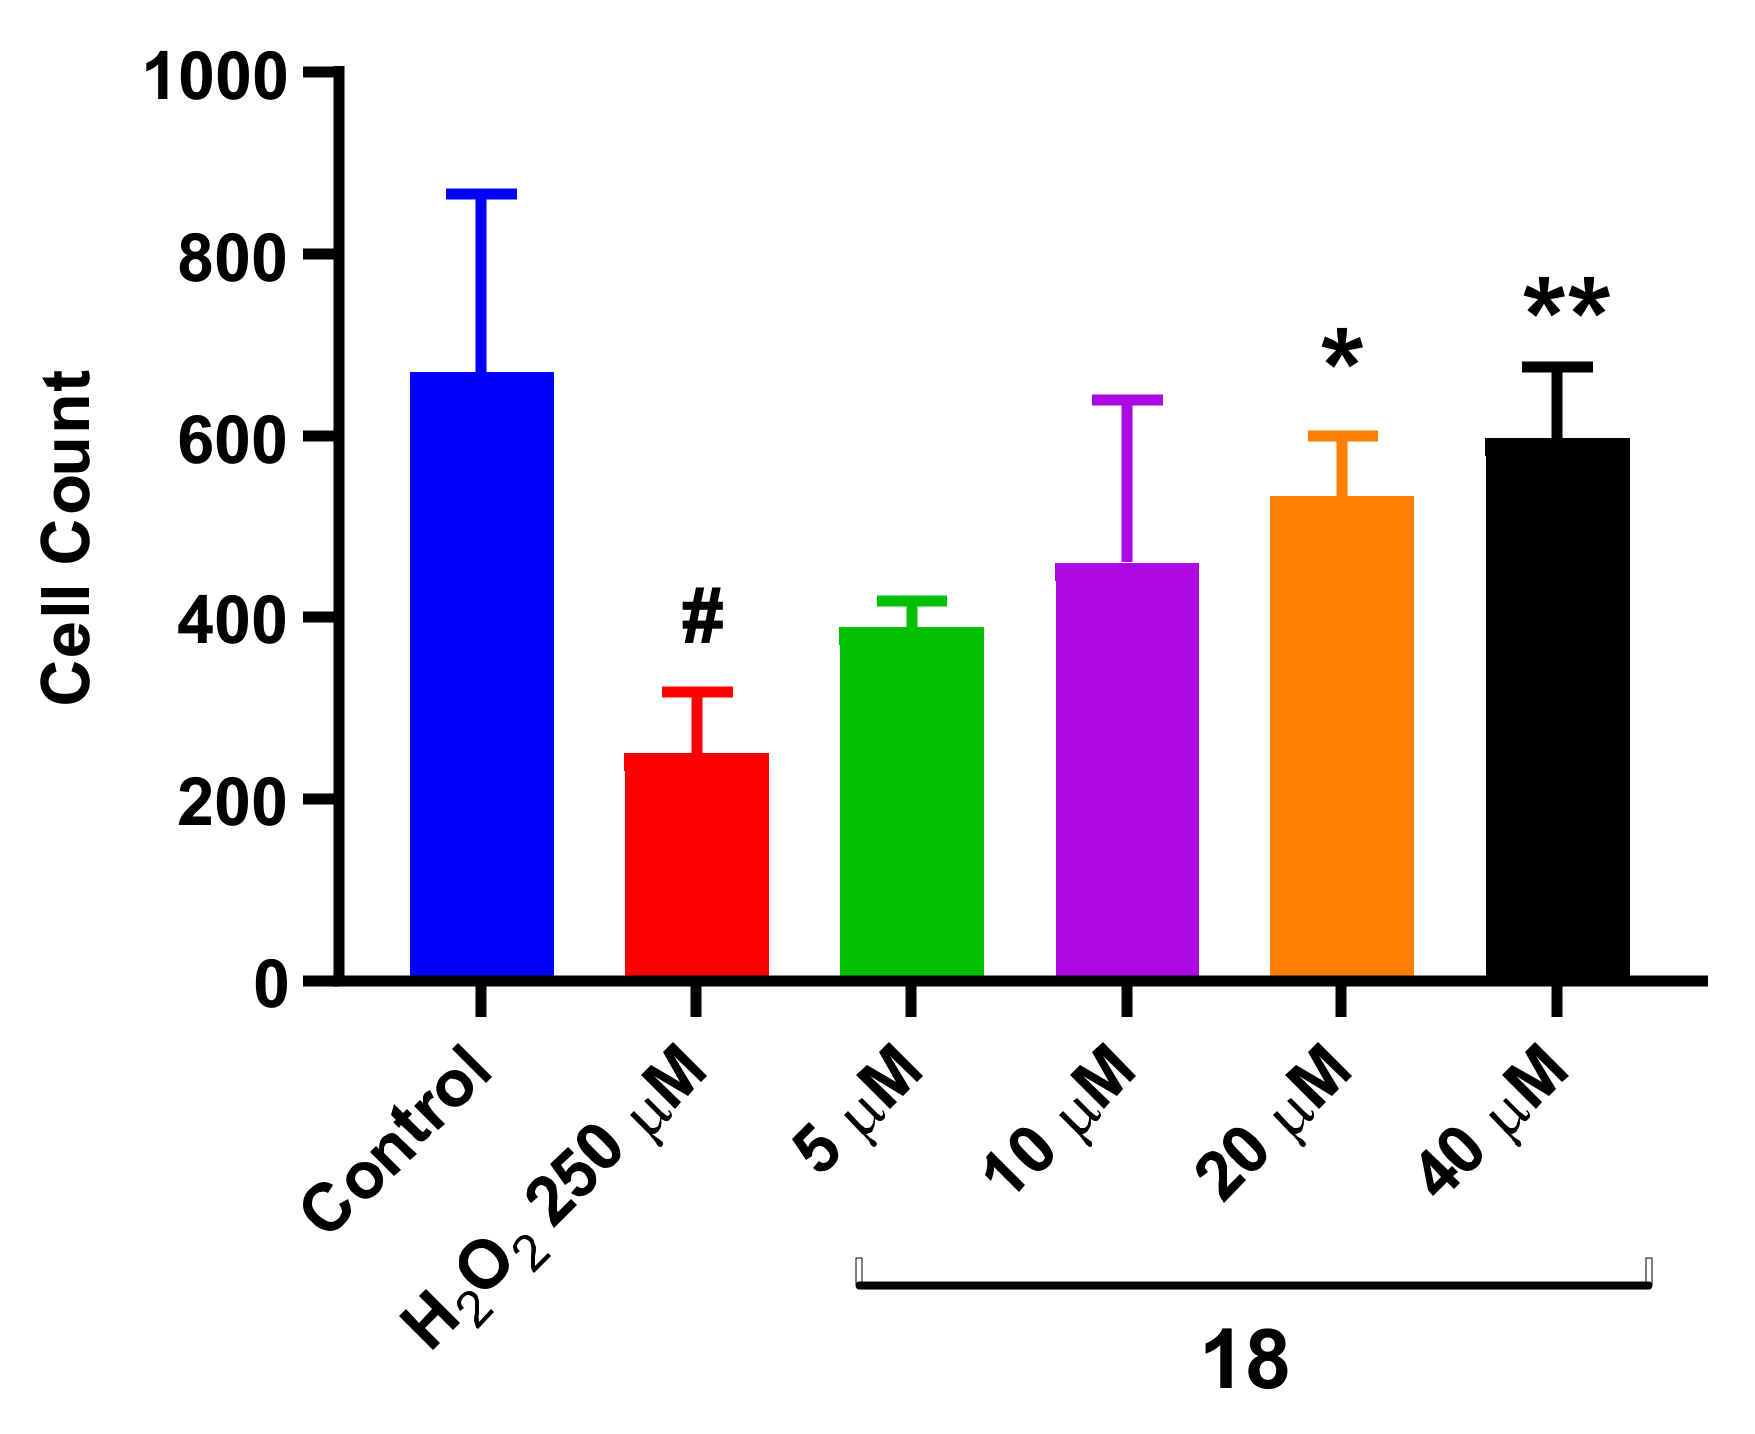
3.15. Neuroprotection Assays in SH-SY5Y Differentiated Cells (diffSH-SY5Y)
4. Conclusions
Supplementary Materials
Author Contributions
Funding
Institutional Review Board Statement
Informed Consent Statement
Data Availability Statement
Conflicts of Interest
References
- ONU. World Population, Ageing; United Nations, Department of Economic and Social Affairs, Population Division: New York, NY, USA, 2015; p. 164. [Google Scholar]
- Feigin, V.L.; Abajobir, A.A.; Abate, K.H.; Abd-Allah, F.; Abdulle, A.M.; Abera, S.F.; Abyu, G.Y.; Ahmed, M.B.; Aichour, A.N.; Aichour, I.; et al. Global, Regional, and National Burden of Neurological Disorders during 1990–2015: A Systematic Analysis for the Global Burden of Disease Study 2015. Lancet Neurol. 2017, 16, 877–897. [Google Scholar] [CrossRef] [Green Version]
- Reeve, A.; Simcox, E.; Turnbull, D. Ageing and Parkinson’s Disease: Why Is Advancing Age the Biggest Risk Factor? Ageing Res. Rev. 2014, 14, 19–30. [Google Scholar] [CrossRef]
- Bellou, V.; Belbasis, L.; Tzoulaki, I.; Evangelou, E.; Ioannidis, J.P.A. Environmental Risk Factors and Parkinson’s Disease: An Umbrella Review of Meta-Analyses. Parkins. Relat. Disord. 2016, 23, 1–9. [Google Scholar] [CrossRef] [Green Version]
- Pezzoli, G.; Cereda, E. Exposure to Pesticides or Solvents and Risk of Parkinson Disease. Neurology 2013, 80, 2035–2041. [Google Scholar] [CrossRef]
- Weisskopf, M.G.; Weuve, J.; Nie, H.; Saint-Hilaire, M.H.; Sudarsky, L.; Simon, D.K.; Hersh, B.; Schwartz, J.; Wright, R.O.; Hu, H. Association of Cumulative Lead Exposure with Parkinson’s Disease. Environ. Health Perspect. 2010, 118, 1609–1613. [Google Scholar] [CrossRef]
- Caudle, W.M.; Guillot, T.S.; Lazo, C.R.; Miller, G.W. Industrial Toxicants and Parkinson’s Disease. NeuroToxicology 2012, 33, 178–188. [Google Scholar] [CrossRef] [Green Version]
- Brouwer, M.; Huss, A.; van der Mark, M.; Nijssen, P.C.G.; Mulleners, W.M.; Sas, A.M.G.; van Laar, T.; de Snoo, G.R.; Kromhout, H.; Vermeulen, R.C.H. Environmental Exposure to Pesticides and the Risk of Parkinson’s Disease in the Netherlands. Environ. Int. 2017, 107, 100–110. [Google Scholar] [CrossRef]
- Breydo, L.; Wu, J.W.; Uversky, V.N. α-Synuclein Misfolding and Parkinson’s Disease. Biochim. Biophys. Acta Mol. Basis Dis. 2012, 1822, 261–285. [Google Scholar] [CrossRef] [Green Version]
- Elobeid, A.; Libard, S.; Leino, M.; Popova, S.; Alafuzoff, I. Altered Proteins in the Aging Brain. J. Neuropathol. Exp. Neurol. 2016, 75, 316–325. [Google Scholar] [CrossRef] [Green Version]
- Jellinger, K.A. Interaction between Pathogenic Proteins in Neurodegenerative Disorders. J. Cell. Mol. Med. 2012, 16, 1166–1183. [Google Scholar] [CrossRef]
- Sethi, K.; Olanow, C.W.; Stern, M.B. The Scientific and Clinical Basis for the Treatment of Parkinson Disease (2009). Neurology 2009, 72, S1-136. [Google Scholar] [CrossRef] [Green Version]
- Treatment of Parkinson’ s Disease The Motor The Clinical Symptoms of Parkinson’ s Disease. J. Neurochem. 2016, 139, 318–324. [CrossRef] [PubMed] [Green Version]
- You, H.; Mariani, L.-L.; Mangone, G.; Le Febvre de Nailly, D.; Charbonnier-Beaupel, F.; Corvol, J.-C. Molecular Basis of Dopamine Replacement Therapy and Its Side Effects in Parkinson’s Disease. Cell Tissue Res. 2018, 373, 111–135. [Google Scholar] [CrossRef]
- Tran, T.N.; Vo, T.N.N.; Frei, K.; Truong, D.D. Levodopa-Induced Dyskinesia: Clinical Features, Incidence, and Risk Factors. J. Neur. Transmiss. 2018, 125, 1109–1117. [Google Scholar] [CrossRef] [PubMed]
- Voon, V.; Napier, T.C.; Frank, M.J.; Sgambato-Faure, V.; Grace, A.A.; Rodriguez-Oroz, M.; Obeso, J.; Bezard, E.; Fernagut, P.O. Impulse Control Disorders and Levodopa-Induced Dyskinesias in Parkinson’s Disease: An Update. Lancet Neurol. 2017, 16, 238–250. [Google Scholar] [CrossRef] [Green Version]
- Blandini, F.; Armentero, M.-T. Dopamine Receptor Agonists for Parkinson’s Disease. Exp. Opin. Investig. Drugs 2014, 23, 387–410. [Google Scholar] [CrossRef]
- Stocchi, F.; Torti, M.; Fossati, C. Advances in Dopamine Receptor Agonists for the Treatment of Parkinson’s Disease. Exp. Opin. Pharmacother. 2016, 17, 1889–1902. [Google Scholar] [CrossRef]
- Perez-Lloret, S.; Rey, M.V.; Crispo, J.; Krewski, D.; Lapeyre-Mestre, M.; Montastruc, J.-L.; Rascol, O. Risk of Heart Failure Following Treatment with Dopamine Agonists in Parkinson’s Disease Patients. Exp. Opin. Drug Safety 2014, 13, 351–360. [Google Scholar] [CrossRef]
- Castro, E.S.; Santos-García, D.; de Deus Fonticoba, T.; Expósito Ruíz, I.; Tuñas Gesto, C.; Arribí, M.M. Causes and Factors Related to Dopamine Agonist Withdrawal in Parkinson′s Disease. Brain Behav. 2016, 6, 1–7. [Google Scholar] [CrossRef]
- Ceravolo, R.; Rossi, C.; Del Prete, E.; Bonuccelli, U. A Review of Adverse Events Linked to Dopamine Agonists in the Treatment of Parkinson’s Disease. Exp. Opin. Drug Safety 2016, 15, 181–198. [Google Scholar] [CrossRef]
- Fox, S.H. Non-Dopaminergic Treatments for Motor Control in Parkinson’s Disease. Drugs 2013, 73, 1405–1415. [Google Scholar] [CrossRef]
- Connolly, B.S.; Lang, A.E. Pharmacological Treatment of Parkinson Disease: A Review. JAMA 2014, 311, 1670–1683. [Google Scholar] [CrossRef] [PubMed]
- Freitas, M.E.; Fox, S.H. Nondopaminergic Treatments for Parkinson’s Disease: Current and Future Prospects. Neurodegener. Dis. Manag. 2016, 6, 249–268. [Google Scholar] [CrossRef] [Green Version]
- Winklhofer, K.F.; Haass, C. Mitochondrial Dysfunction in Parkinson’s Disease. Biochim. Biophys. Acta Mol. Basis Dis. 2010, 1802, 29–44. [Google Scholar] [CrossRef]
- Grünewald, A.; Kumar, K.R.; Sue, C.M. New Insights into the Complex Role of Mitochondria in Parkinson’s Disease. Progress Neurobiol. 2019, 177, 73–93. [Google Scholar] [CrossRef] [PubMed]
- Celardo, I.; Martins, L.M.; Gandhi, S. Unravelling Mitochondrial Pathways to Parkinson’s Disease. Br. J. Pharmacol. 2014, 171, 1943–1957. [Google Scholar] [CrossRef] [PubMed] [Green Version]
- Nguyen, M.; Wong, Y.C.; Ysselstein, D.; Severino, A.; Krainc, D. Synaptic, Mitochondrial, and Lysosomal Dysfunction in Parkinson’s Disease. Trends Neurosci. 2019, 42, 140–149. [Google Scholar] [CrossRef]
- Fernández-Moriano, C.; González-Burgos, E.; Gómez-Serranillos, M.P. Mitochondria-Targeted Protective Compounds in Parkinson’s and Alzheimer’s Diseases. Oxid. Med. Cell. Longev. 2015, 2015, 408927. [Google Scholar] [CrossRef]
- Gandhi, S.; Abramov, A.Y. Mechanism of Oxidative Stress in Neurodegeneration. Oxid. Med. Cell. Longev. 2012, 2012, 428010. [Google Scholar] [CrossRef] [Green Version]
- Manoharan, S.; Guillemin, G.J.; Abiramasundari, R.S.; Essa, M.M.; Akbar, M.; Akbar, M.D. The Role of Reactive Oxygen Species in the Pathogenesis of Alzheimer’s Disease, Parkinson’s Disease, and Huntington’s Disease: A Mini Review. Oxid. Med. Cell. Longev. 2016, 2016, 8590578. [Google Scholar] [CrossRef]
- Navarro-Yepes, J.; Burns, M.; Anandhan, A.; Khalimonchuk, O.; del Razo, L.M.; Quintanilla-Vega, B.; Pappa, A.; Panayiotidis, M.I.; Franco, R. Oxidative Stress, Redox Signaling, and Autophagy: Cell Death Versus Survival. Antioxid. Redox Signal. 2014, 21, 66–85. [Google Scholar] [CrossRef] [Green Version]
- Su, B.; Wang, X.; Zheng, L.; Perry, G.; Smith, M.A.; Zhu, X. Abnormal Mitochondrial Dynamics and Neurodegenerative Diseases. Biochim. Biophys. Acta 2010, 1802, 135–142. [Google Scholar] [CrossRef] [PubMed] [Green Version]
- Mancuso, M.; Coppede, F.; Migliore, L.; Siciliano, G.; Murri, L. Mitochondrial Dysfunction, Oxidative Stress and Neurodegeneration. J. Alzheimer’s Dis. 2006, 10, 59–73. [Google Scholar] [CrossRef]
- Valko, M.; Morris, H.; Cronin, M.T.D. Metals, Toxicity and Oxidative Stress. Curr. Med. Chem. 2005, 12, 1161–1208. [Google Scholar] [CrossRef] [Green Version]
- Barnham, K.J.; Masters, C.L.; Bush, A.I. Neurodegenerative Diseases and Oxidative Stress. Nat. Rev. Drug Discov. 2004, 3, 205–214. [Google Scholar] [CrossRef]
- Kim, G.H.; Kim, J.E.; Rhie, S.J.; Yoon, S. The Role of Oxidative Stress in Neurodegenerative Diseases. Exp. Neurobiol. 2015, 24, 325. [Google Scholar] [CrossRef]
- Islam, M.T. Oxidative Stress and Mitochondrial Dysfunction-Linked Neurodegenerative Disorders. Neurol. Res. 2017, 39, 73–82. [Google Scholar] [CrossRef] [PubMed]
- Ghosh, N.; Ghosh, R.; Mandal, S.C. Antioxidant Protection: A Promising Therapeutic Intervention in Neurodegenerative Disease. Free Radic. Res. 2011, 45, 888–905. [Google Scholar] [CrossRef] [PubMed]
- Gelain, D.P.; Antonio Behr, G.; Birnfeld De Oliveira, R.; Trujillo, M. Antioxidant Therapies for Neurodegenerative Diseases: Mechanisms, Current Trends, and Perspectives. Oxid. Med. Cell. Longev. 2012, 2012, 895153. [Google Scholar] [CrossRef] [PubMed]
- Weber, C.A.; Ernst, M.E. Antioxidants, Supplements, and Parkinson’s Disease. Ann. Pharmacother. 2006, 40, 935–938. [Google Scholar] [CrossRef]
- Muller, T. New Small Molecules for the Treatment of Parkinson’s Disease. Exp. Opin. Investig. Drugs 2010, 19, 1077–1086. [Google Scholar] [CrossRef]
- Schirinzi, T.; Martella, G.; Imbriani, P.; Di Lazzaro, G.; Franco, D.; Colona, V.L.; Alwardat, M.; Sinibaldi Salimei, P.; Mercuri, N.B.; Pierantozzi, M.; et al. Dietary Vitamin E as a Protective Factor for Parkinson’s Disease: Clinical and Experimental Evidence. Front. Neurol. 2019, 10, 1–7. [Google Scholar] [CrossRef] [Green Version]
- Taghizadeh, M.; Tamtaji, O.R.; Dadgostar, E.; Daneshvar Kakhaki, R.; Bahmani, F.; Abolhassani, J.; Aarabi, M.H.; Kouchaki, E.; Memarzadeh, M.R.; Asemi, Z. The Effects of Omega-3 Fatty Acids and Vitamin E Co-Supplementation on Clinical and Metabolic Status in Patients with Parkinson’s Disease: A Randomized, Double-Blind, Placebo-Controlled Trial. Neurochem. Int. 2017, 108, 183–189. [Google Scholar] [CrossRef]
- Covarrubias-Pinto, A.; Acuña, A.; Beltrán, F.; Torres-Díaz, L.; Castro, M. Old Things New View: Ascorbic Acid Protects the Brain in Neurodegenerative Disorders. Int. J. Mol. Sci. 2015, 16, 28194–28217. [Google Scholar] [CrossRef] [PubMed]
- Moretti, M.; Fraga, D.B.; Rodrigues, A.L.S. Preventive and Therapeutic Potential of Ascorbic Acid in Neurodegenerative Diseases. CNS Neurosci. Ther. 2017, 23, 921–929. [Google Scholar] [CrossRef] [PubMed]
- Han, Q.Q.; Shen, T.T.; Wang, F.; Wu, P.F.; Chen, J.G. Preventive and Therapeutic Potential of Vitamin C in Mental Disorders. Curr. Med. Sci. 2018, 38, 1–10. [Google Scholar] [CrossRef] [PubMed]
- Sikorska, M.; Lanthier, P.; Miller, H.; Beyers, M.; Sodja, C. Nanomicellar formulation of coenzyme Q10 (Ubisol-Q10) Effectively Blocks Ongoing Neurodegeneration in the Mouse 1- as an Adjuvant Treatment in Parkinson’ s Disease. Neurobiol. Aging 2016, 35, 2329–2346. [Google Scholar] [CrossRef] [Green Version]
- Muthukumaran, K.; Leahy, S.; Harrison, K.; Sikorska, M.; Sandhu, J.K.; Cohen, J.; Keshan, C.; Lopatin, D.; Miller, H.; Borowy-Borowski, H.; et al. Orally Delivered Water Soluble Coenzyme Q 10 (Ubisol-Q 10 ) Blocks on-Going Neurodegeneration in Rats Exposed to Paraquat: Potential for Therapeutic Application in Parkinson’s Disease. BMC Neurosci. 2014, 15, 21. [Google Scholar] [CrossRef] [Green Version]
- Zhu, Z.-G.; Sun, M.-X.; Zhang, W.-L.; Wang, W.-W.; Jin, Y.-M.; Xie, C.-L. The Efficacy and Safety of Coenzyme Q10 in Parkinson’s Disease: A Meta-Analysis of Randomized Controlled Trials. Neurol. Sci. Off. J. Ital. Neurol. Soc. Ital. Soc. Clin. Neurophysiol. 2017, 38, 215–224. [Google Scholar] [CrossRef]
- Li, Y.; Wang, S.-M.; Guo, L.; Zhu, J.; Wang, Y.; Li, L.; Zhao, Y.-X. Effects of Melatonin Levels on Neurotoxicity of the Medial Prefrontal Cortex in a Rat Model of Parkinson’s Disease. Chin. Med. J. 2017, 130, 2726–2731. [Google Scholar] [CrossRef]
- Belaid, H.; Adrien, J.; Karachi, C.; Hirsch, E.C.; François, C. Effect of Melatonin on Sleep Disorders in a Monkey Model of Parkinson’s Disease. Sleep Med. 2015, 16, 1245–1251. [Google Scholar] [CrossRef]
- Rasheed, M.Z.; Andrabi, S.S.; Salman, M.; Tabassum, H.; Shaquiquzzaman, M.; Parveen, S.; Parvez, S. Melatonin Improves Behavioral and Biochemical Outcomes in a Rotenone-Induced Rat Model of Parkinson’s Disease. J. Environ. Pathol. Toxicol. Oncol. 2018, 37, 139–150. [Google Scholar] [CrossRef] [PubMed]
- Sharma, A.; Kaur, P.; Kumar, V.; Gill, K.D. Attenuation of 1-Methyl-4-Phenyl-1, 2,3,6-Tetrahydropyridine Induced Nigrostriatal Toxicity in Mice by N-Acetyl Cysteine. Cell. Mol. Biol. 2007, 53, 48–55. [Google Scholar] [PubMed]
- Clark, J.; Clore, E.L.; Zheng, K.; Adame, A.; Masliah, E.; Simon, D.K. Oral N-Acetyl-Cysteine Attenuates Loss of Dopaminergic Terminals in Alpha-Synuclein Overexpressing Mice. PLoS ONE 2010, 5, e12333. [Google Scholar] [CrossRef] [PubMed] [Green Version]
- Monti, D.A.; Zabrecky, G.; Kremens, D.; Liang, T.-W.; Wintering, N.A.; Cai, J.; Wei, X.; Bazzan, A.J.; Zhong, L.; Bowen, B.; et al. N-Acetyl Cysteine May Support Dopamine Neurons in Parkinson’s Disease: Preliminary Clinical and Cell Line Data. PLoS ONE 2016, 11, e0157602. [Google Scholar] [CrossRef] [PubMed]
- Lee, W.-H.; Loo, C.-Y.; Bebawy, M.; Luk, F.; Mason, R.; Rohanizadeh, R. Curcumin and Its Derivatives: Their Application in Neuropharmacology and Neuroscience in the 21st Century. Curr. Neuropharmacol. 2013, 11, 338–378. [Google Scholar] [CrossRef] [Green Version]
- Molino, S.; Dossena, M.; Buonocore, D.; Ferrari, F.; Venturini, L.; Ricevuti, G.; Verri, M. Polyphenols in Dementia: From Molecular Basis to Clinical Trials. Life Sci. 2016, 161, 69–77. [Google Scholar] [CrossRef]
- Javed, H.; Nagoor Meeran, M.F.; Azimullah, S.; Adem, A.; Sadek, B.; Ojha, S.K. Plant Extracts and Phytochemicals Targeting α-Synuclein Aggregation in Parkinson’s Disease Models. Front. Pharmacol. 2019, 9, 1555. [Google Scholar] [CrossRef] [Green Version]
- Spinelli, K.J.; Osterberg, V.R.; Meshul, C.K.; Soumyanath, A.; Unni, V.K. Curcumin Treatment Improves Motor Behavior in α-Synuclein Transgenic Mice. PLoS ONE 2015, 10, e0128510. [Google Scholar] [CrossRef]
- Ortiz-Ortiz, M.A.; Morán, J.M.; Ruiz-Mesa, L.M.; Niso-Santano, M.; Bravo-SanPedro, J.M.; Gómez-Sánchez, R.; González-Polo, R.A.; Fuentes, J.M. Curcumin Exposure Induces Expression of the Parkinson’s Disease-Associated Leucine-Rich Repeat Kinase 2 (LRRK2) in Rat Mesencephalic Cells. Neurosci. Lett. 2010, 468, 120–124. [Google Scholar] [CrossRef]
- Chiu, S.; Terpstra, K.J.; Bureau, Y.; Hou, J.; Raheb, H.; Cernvosky, Z.; Badmeav, V.; Copen, J.; Husni, M.; Woodbury-Farina, M. Liposomal-Formulated Curcumin [LipocurcTM] Targeting HDAC (Histone Deacetylase) Prevents Apoptosis and Improves Motor Deficits in Park 7 (DJ-1)-Knockout Rat Model of Parkinson’s Disease: Implications for Epigenetics-Based Nanotechnology-Driven Drug Platfor. J. Complement. Intergr. Med. 2013, 10. [Google Scholar] [CrossRef]
- Nelson, K.M.; Dahlin, J.L.; Bisson, J.; Graham, J.; Pauli, G.F.; Walters, M.A. The Essential Medicinal Chemistry of Curcumin. J. Med. Chem. 2017, 60, 1620–1637. [Google Scholar] [CrossRef]
- Liu, W.; Zhai, Y.; Heng, X.; Che, F.Y.; Chen, W.; Sun, D.; Zhai, G. Oral Bioavailability of Curcumin: Problems and Advancements. J. Drug Target. 2016, 24, 694–702. [Google Scholar] [CrossRef] [PubMed]
- Metzler, M.; Pfeiffer, E.; Schulz, S.I.; Dempe, J.S. Curcumin Uptake and Metabolism. BioFactors 2013, 39, 14–20. [Google Scholar] [CrossRef] [PubMed]
- Schneider, C.; Gordon, O.N.; Edwards, R.L.; Luis, P.B. Degradation of Curcumin: From Mechanism to Biological Implications. J. Agricult. Food Chem. 2015, 63, 7606–7614. [Google Scholar] [CrossRef] [PubMed] [Green Version]
- Anand, P.; Kunnumakkara, A.B.; Newman, R.A.; Aggarwal, B.B. Bioavailability of curcumin: Problems and promises. Mol Pharm. 2007, 4, 807–818. [Google Scholar] [CrossRef]
- Hu, S.; Maiti, P.; Ma, Q.; Zuo, X.; Jones, M.R.; Cole, G.M.; Frautschy, S.A. Clinical Development of Curcumin in Neurodegenerative Disease. Exp. Rev. Neurother. 2015, 15, 629–637. [Google Scholar] [CrossRef] [PubMed]
- Hsu, C.-H.; Cheng, A.-L. Clinical Studies with Curcumin. Adv. Exp. Med. Biol. 2007, 595, 471–480. [Google Scholar] [CrossRef]
- Yang, C.; Su, X.; Liu, A.; Zhang, L.; Yu, A.; Xi, Y.; Zhai, G. Advances in Clinical Study of Curcumin. Curr. Pharm. Design 2013, 19, 1966–1973. [Google Scholar]
- Gonzalez-Albadalejo, J.; Sanz, D.; Claramunt, R.M.; Lavandera, J.L.; Alkorta, I.; Elguero, J. Curcumin and Curcuminoids: Chemistry, Structural Studies and Biological Properties. An. Real Acad. Nac. Farmac. 2015, 81, 278–310. [Google Scholar]
- Priyadarsini, K.I. The Chemistry of Curcumin: From Extraction to Therapeutic Agent. Molecules 2014, 19, 20091–20112. [Google Scholar] [CrossRef] [PubMed] [Green Version]
- Pabon, H.J.J. A Synthesis of Curcumin and Related Compounds. Recueil Travaux Chim. Pays-Bas 1964, 83, 379–386. [Google Scholar] [CrossRef]
- Nieto, C.I.; Pilar Cornago, M.; Pilar Cabildo, M.; Sanz, D.; Claramunt, R.M.; Carmen Torralba, M.; Rosario Torres, M.; Martínez Casanova, D.; Rebeca Sánchez-Alegre, Y.; Escudero, E.; et al. Evaluation of the Antioxidant and Neuroprotectant Activities of New Asymmetrical 1,3-Diketones. Molecules 2018, 23, 1837. [Google Scholar] [CrossRef] [PubMed] [Green Version]
- Khor, P.Y.; Mohd Aluwi, M.F.F.; Rullah, K.; Lam, K.W. Insights on the Synthesis of Asymmetric Curcumin Derivatives and Their Biological Activities. Eur. J. Med. Chem. 2019, 183, 111704. [Google Scholar] [CrossRef]
- Qiu, P.; Zhang, S.; Zhou, Y.; Zhu, M.; Kang, Y.; Chen, D.; Wang, J.; Zhou, P.; Li, W.; Xu, Q.; et al. Synthesis and Evaluation of Asymmetric Curcuminoid Analogs as Potential Anticancer Agents That Downregulate NF-ΚB Activation and Enhance the Sensitivity of Gastric Cancer Cell Lines to Irinotecan Chemotherapy. Eur. J. Med. Chem. 2017, 139, 917–925. [Google Scholar] [CrossRef]
- Pérez-Torralba, M.; Claramunt, R.M.; García, M.Á.; López, C.; Torralba, M.C.; Torres, M.R.; Alkorta, I.; Elguero, J. Structure of 1,5-Benzodiazepinones in the Solid State and in Solution: Effect of the Fluorination in the Six-Membered Ring. Beilstein J. Organ. Chem. 2013, 9, 2156–2167. [Google Scholar] [CrossRef] [Green Version]
- Martín, O.; Pérez-Torralba, M.; García, M.Á.; Claramunt, R.M.; Torralba, M.C.; Torres, M.R.; Alkorta, I.; Elguero, J. Static and Dynamic Properties of Fluorinated 4-Aryl-1,5-Benzodiazepinones. ChemistrySelect 2016, 1, 861–870. [Google Scholar] [CrossRef]
- Benzie, I.F.; Strain, J.J. The Ferric Reducing Ability of Plasma (FRAP) as a Measure of “Antioxidant Power”: The FRAP Assay. Analyt. Biochem. 1996, 239, 70–76. [Google Scholar] [CrossRef] [Green Version]
- Sumida, K.; Igarashi, Y.; Toritsuka, N.; Matsushita, T.; Abe-Tomizawa, K.; Aoki, M.; Urushidani, T.; Yamada, H.; Ohno, Y. Effects of DMSO on Gene Expression in Human and Rat Hepatocytes. Human Exp. Toxicol. 2011, 30, 1701–1709. [Google Scholar] [CrossRef]
- Präbst, K.; Engelhardt, H.; Ringgeler, S.; Hübner, H. Basic colorimetric proliferation assays: MTT, WST, and resazurin. In Methods in Molecular Biology; Humana Press Inc.: Totowa, NJ, USA, 2017; Volume 1601, pp. 1–17. [Google Scholar]
- Riss, T.L.; Moravec, R.A.; Niles, A.L. Cell Viability Assays; Eli Lilly & Company and the National Center for Advancing Translational Sciences: Bethesda, MD, USA, 2013. [Google Scholar]
- Neri, S.; Mariani, E.; Meneghetti, A.; Cattini, L.; Facchini, A. Calcein-Acetyoxymethyl Cytotoxicity Assay: Standardization of a Method Allowing Additional Analyses on Recovered Effector Cells and Supernatants. Clin. Diagn. Lab. Immunol. 2001, 8, 1131–1135. [Google Scholar] [CrossRef] [Green Version]
- Bratosin, D.; Mitrofan, L.; Palii, C.; Estaquier, J.; Montreuil, J. Novel Fluorescence Assay Using Calcein-AM for the Determination of Human Erythrocyte Viability and Aging. Cytometry Part A 2005, 66, 78–84. [Google Scholar] [CrossRef]
- Hoelke, B.; Gieringer, S.; Arlt, M.; Saal, C. Comparison of Nephelometric, UV-Spectroscopic, and HPLC Methods for High-Throughput Determination of Aqueous Drug Solubility in Microtiter Plates. Analyt. Chem. 2009, 81, 3165–3172. [Google Scholar] [CrossRef]
- Wang, H.; Joseph, J.A. Quantifying Cellular Oxidative Stress by Dichlorofluorescein Assay Using Microplate Reader. Free Radic. Biol. Med. 1999, 27, 612–616. [Google Scholar] [CrossRef]
- Robinson, K.M.; Janes, M.S.; Pehar, M.; Monette, J.S.; Ross, M.F.; Hagen, T.M.; Murphy, M.P.; Beckman, J.S. Selective Fluorescent Imaging of Superoxide in Vivo Using Ethidium-Based Probes. Proc. Natl. Acad. Sci. USA 2006, 103, 15038–15043. [Google Scholar] [CrossRef] [Green Version]
- Robinson, K.M.; Janes, M.S.; Beckman, J.S. The Selective Detection of Mitochondrial Superoxide by Live Cell Imaging. Nat. Protoc. 2008, 3, 941–947. [Google Scholar] [CrossRef]
- Salvioli, S.; Ardizzoni, A.; Franceschi, C.; Cossarizza, A. JC-1, but Not DiOC6(3) or Rhodamine 123, Is a Reliable Fluorescent Probe to Assess ΔΨ Changes in Intact Cells: Implications for Studies on Mitochondrial Functionality during Apoptosis. FEBS Lett. 1997, 411, 77–82. [Google Scholar] [CrossRef] [Green Version]
- Ghani, A.; Barril, C.; Bedgood, D.R.; Prenzler, P.D. Measurement of Antioxidant Activity with the Thiobarbituric Acid Reactive Substances Assay. Food Chem. 2017, 230, 195–207. [Google Scholar] [CrossRef] [PubMed]
- Janero, D.R. Malondialdehyde and Thiobarbituric Acid-Reactivity as Diagnostic Indices of Lipid Peroxidation and Peroxidative Tissue Injury. Free Radic. Biol. Med. 1990, 9, 515–540. [Google Scholar] [CrossRef]
- Singh, V.; Gera, R.; Purohit, M.; Patnaik, S.; Ghosh, D. Fluorometric Estimation of Glutathione in Cultured Microglial Cell Lysate. Bio Protocol 2017, 7. [Google Scholar] [CrossRef] [PubMed] [Green Version]
- Senft, A.P.; Dalton, T.P.; Shertzer, H.G. Determining Glutathione and Glutathione Disulfide Using the Fluorescence Probe O-Phthalaldehyde. Analyt. Biochem. 2000, 280, 80–86. [Google Scholar] [CrossRef] [PubMed]
- Sebastià, J.; Cristòfol, R.; Martín, M.; Rodriguez-Farré, E.; Sanfeliu, C. Evaluation of Fluorescent Dyes for Measuring Intracellular Glutathione Content in Primary Cultures of Human Neurons and Neuroblastoma SH-SY5Y. Cytometry Part A 2003, 51, 16–25. [Google Scholar] [CrossRef]
- Schindelin, J.; Arganda-Carreras, I.; Frise, E.; Kaynig, V.; Longair, M.; Pietzsch, T.; Preibisch, S.; Rueden, C.; Saalfeld, S.; Schmid, B.; et al. Fiji: An Open-Source Platform for Biological-Image Analysis. Nat. Methods 2012, 9, 676–682. [Google Scholar] [CrossRef] [Green Version]
- GraphPadPrism-v7 GraphPad-Software. Available online: https://www.graphpad.com/guides/prism/latest/user-guide/index.htm (accessed on 1 December 2020).
- Science of Synthesis: Houben-Weyl Methods of Molecular Transformations; Thieme: New York, NY, USA, 2001.
- Yet, L. Privileged Structures in Drug Discovery: Medicinal Chemistry and Synthesis; Wiley: Hoboken, NJ, USA, 2018. ISBN 978111868 6331.
- Huang, D.; Ou, B.; Prior, R.L. The Chemistry behind Antioxidant Capacity Assays. J. Agricult. Food Chem. 2005, 53, 1841–1856. [Google Scholar] [CrossRef] [PubMed]
- Prior, R.L.; Wu, X.; Schaich, K. Standardized Methods for the Determination of Antioxidant Capacity and Phenolics in Foods and Dietary Supplements. J. Agricult. Food Chem. 2005, 53, 4290–4302. [Google Scholar] [CrossRef] [PubMed]
- Miller, N.J.; Rice-Evans, C.; Davies, M.J.; Gopinathan, V.; Milner, A. A Novel Method for Measuring Antioxidant Capacity and Its Application to Monitoring the Antioxidant Status in Premature Neonates. Clin. Sci. 1993, 84, 407–412. [Google Scholar] [CrossRef] [Green Version]
- Re, R.; Pellegrini, N.; Proteggente, A.; Pannala, A.; Yang, M.; Rice-Evans, C. Antioxidant Activity Applying an Improved ABTS Radical Cation Decolorization Assay. Free Radic. Biol. Med. 1999, 26, 1231–1237. [Google Scholar] [CrossRef]
- Pulido, R.; Bravo, L.; Saura-Calixto, F. Antioxidant Activity of Dietary Polyphenols as Determined by a Modified Ferric Reducing/Antioxidant Power Assay. J. Agricult. Food Chem. 2000, 48, 3396–3402. [Google Scholar] [CrossRef] [Green Version]
- Brand-Williams, W.; Cuvelier, M.E.; Berset, C. Use of a Free Radical Method to Evaluate Antioxidant Activity. LWT Food Sci. Technol. 1995, 28, 25–30. [Google Scholar] [CrossRef]
- Bondet, V.; Brand-Williams, W.; Berset, C. Kinetics and Mechanisms of Antioxidant Activity Using the DPPH.Free Radical Method. LWT Food Sci. Technol. 1997, 30, 609–615. [Google Scholar] [CrossRef]
- Wager, T.T.; Hou, X.; Verhoest, P.R.; Villalobos, A. Moving beyond Rules: The Development of a Central Nervous System Multiparameter Optimization (CNS MPO) Approach to Enable Alignment of Druglike Properties. ACS Chem. Neurosci. 2010, 1, 435–449. [Google Scholar] [CrossRef] [Green Version]
- Meanwell, N.A. Improving Drug Design: An Update on Recent Applications of Efficiency Metrics, Strategies for Replacing Problematic Elements, and Compounds in Nontraditional Drug Space. Chem. Res. Toxicol. 2016, 29, 564–616. [Google Scholar] [CrossRef]
- Ertl, P.; Rohde, B.; Selzer, P. Fast Calculation of Molecular Polar Surface Area as a Sum of Fragment-Based Contributions and Its Application to the Prediction of Drug Transport Properties. J. Med. Chem. 2000, 43, 3714–3717. [Google Scholar] [CrossRef]
- Ishikawa, M.; Hashimoto, Y. Improvement in Aqueous Solubility in Small Molecule Drug Discovery Programs by Disruption of Molecular Planarity and Symmetry. J. Med. Chem. 2011, 54, 1539–1554. [Google Scholar] [CrossRef]
- Ishikawa, M.; Hashimoto, Y. Improving the Water-Solubility of Compounds by Molecular Modification to Disrupt Crystal Packing. Pract. Med. Chem. 2015, 747–765. [Google Scholar] [CrossRef]
- Kurien, B.T.; Singh, A.; Matsumoto, H. Improving the Solubility and Pharmacological Efficacy of Curcumin by Heat Treatment Systemic Lupus Erythematosus View Project Proteomics View Project. ASSAY Drug Dev. Technol. 2007, 5, 567–576. [Google Scholar] [CrossRef]
- Daina, A.; Michielin, O.; Zoete, V. SwissADME: A Free Web Tool to Evaluate Pharmacokinetics, Drug-Likeness and Medicinal Chemistry Friendliness of Small Molecules. Sci. Rep. 2017, 7, 42717. [Google Scholar] [CrossRef] [Green Version]
- Ali, J.; Camilleri, P.; Brown, M.B.; Hutt, A.J.; Kirton, S.B. Revisiting the General Solubility Equation: In Silico Prediction of Aqueous Solubility Incorporating the Effect of Topographical Polar Surface Area. J. Chem. Inf. Model 2011, 52, 420–428. [Google Scholar] [CrossRef]
- Delaney, J.S. ESOL: Estimating Aqueous Solubility Directly from Molecular Structure. J. Chem. Inf. Sci. 2004, 44, 1000–1005. [Google Scholar] [CrossRef]
- Nyamunda, B.C.; Chigondo, F.; Moyo, M.; Guyo, U.; Shumba, M.; Nharingo, T. Hydrogen Peroxide As an Oxidant for Organic Reactions. J. Atoms Mol. 2013, 3, 553–559. [Google Scholar]
- Curci, R.; Edwards, J.O. Activation of Hydrogen Peroxide by Organic Compounds. In Catalytic Oxidations with Hydrogen Peroxide as Oxidant. Catalysis by Metal Complexes; Springer: Dordrecht, The Netherlands, 1992; pp. 45–95. [Google Scholar] [CrossRef]
- Strukul, G. Catalytic Oxidations with Hydrogen Catalysis by Metal Complexes; Springer: Berlin/Heidelberg, Germany, 1992; ISBN 9789048141630. [Google Scholar]
- Wang, Y.; Pan, M.; Cheng, A.; Lin, L.; Ho, Y.; Hsieh, C.-Y.; Lin, J.-K. Stability of Curcumin in Buffer Solutions and Characterization of Its Degradation Products. J. Pharm. Biomed. Analys. 1997, 15, 1867–1876. [Google Scholar] [CrossRef]
- Gordon, O.N.; Luis, P.B.; Ashley, R.E.; Schneider, C. Oxidative Transformation of Demethoxy- and Bisdemethoxycurcumin: Products, Mechanism of Formation, and Poisoning of Human Topoisomerase II α. Chem. Res. Toxicol. 2015, 28, 989–996. [Google Scholar] [CrossRef] [Green Version]
- Griesser, M.; Pistis, V.; Suzuki, T.; Tejera, N.; Pratt, D.A.; Schneider, C. Autoxidative and Cyclooxygenase-2 Catalyzed Transformation of the Dietary Chemopreventive Agent Curcumin. J. Biol. Chem. 2011, 286, 1114–1124. [Google Scholar] [CrossRef] [Green Version]
- Aras, M.A.; Hartnett, K.A.; Aizenman, E. Assessment of cell viability in primary neuronal cultures. Curr. Protoc. Neurosci. 2008, 7, 7.18. [Google Scholar] [CrossRef]
- Stockert, J.C.; Horobin, R.W.; Colombo, L.L.; Blázquez-Castro, A. Tetrazolium Salts and Formazan Products in Cell Biology: Viability Assessment, Fluorescence Imaging, and Labeling Perspectives. Acta Histochem. 2018, 120, 159–167. [Google Scholar] [CrossRef] [Green Version]
- Bernas, T.; Dobrucki, J.W. The Role of Plasma Membrane in Bioreduction of Two Tetrazolium Salts, MTT, and CTC. Arch. Biochem. Biophys. 2000, 380, 108–116. [Google Scholar] [CrossRef] [PubMed]
- Zhu, J.; Chu, C.T. Mitochondrial Dysfunction in Parkinson’s Disease. J. Alzheimer’s Dis. 2010, 20, S325–S334. [Google Scholar] [CrossRef] [PubMed] [Green Version]
- Glinka, Y.; Tipton, K.F.; Youdim, M.B.H. Mechanism of Inhibition of Mitochondrial Respiratory Complex I by 6- Hydroxydopamine and Its Prevention by Desferrioxamine. Eur. J. Pharmacol. 1998, 351, 121–129. [Google Scholar] [CrossRef]
- Singh, Y.; Bhatnagar, R.; Sidhu, G.S.; Batra, J.K.; Krishna, G. 1-Methyl-4-Phenyl-1,2,3,6-Tetrahydropyridine Inhibits Proton Motive Force in Energized Liver Mitochondria. Arch. Biochem. Biophys. 1989, 271, 217–222. [Google Scholar] [CrossRef]
- Langston, J.W. The MPTP Story. J. Parkinson’s Dis. 2017, 7, S11–S19. [Google Scholar] [CrossRef] [Green Version]
- Aslan, S.N.; Karahalil, B. Oxidative Stress and Parkinson Disease. Ankara Univ. Eczacilik Fakultesi Dergisi 2019, 43. [Google Scholar] [CrossRef]
- Fato, R.; Bergamini, C.; Leoni, S.; Lenaz, G. Mitochondrial Production of Reactive Oxygen Species: Role of Complex I and Quinone Analogues. BioFactors 2008, 32, 31–39. [Google Scholar] [CrossRef] [PubMed]
- Tanner, C.M.; Kame, F.; Ross, G.W.; Hoppin, J.A.; Goldman, S.M.; Korell, M.; Marras, C.; Bhudhikanok, G.S.; Kasten, M.; Chade, A.R.; et al. Rotenone, Paraquat, and Parkinson’s Disease. Environ. Health Perspect. 2011, 119, 866–872. [Google Scholar] [CrossRef] [Green Version]
- Neufeld, B.H.; Tapia, J.B.; Lutzke, A.; Reynolds, M.M. Small Molecule Interferences in Resazurin and MTT-Based Metabolic Assays in the Absence of Cells. Analyt. Chem. 2018, 90, 6867–6876. [Google Scholar] [CrossRef] [PubMed]
- Wang, Y.-J.; Zhou, S.-M.; Xu, G.; Gao, Y.-Q. Interference of Phenylethanoid Glycosides from Cistanche Tubulosa with the MTT Assay. Molecules 2015, 20, 8060–8071. [Google Scholar] [CrossRef] [PubMed] [Green Version]
- Angius, F.; Floris, A. Liposomes and MTT Cell Viability Assay: An Incompatible Affair. Toxicol. in Vitro 2015, 29, 314–319. [Google Scholar] [CrossRef] [PubMed]
- Hsiao, I.L.; Huang, Y.J. Improving the Interferences of Methyl Thiazolyl Tetrazolium and IL-8 Assays in Assessing the Cytotoxicity of Nanoparticles. J. Nanosci. Nanotechnol. 2011, 11, 5228–5233. [Google Scholar] [CrossRef]
- Lupu, A.R.; Popescu, T. The Noncellular Reduction of MTT Tetrazolium Salt by TiO2 Nanoparticles and Its Implications for Cytotoxicity Assays. Toxicol. In Vitro 2013, 27, 1445–1450. [Google Scholar] [CrossRef] [PubMed]
- Gomez Perez, M.; Fourcade, L.; Mateescu, M.A.; Paquin, J. Neutral Red versus MTT Assay of Cell Viability in the Presence of Copper Compounds. Analyt. Biochem. 2017, 535, 43–46. [Google Scholar] [CrossRef]
- Almutary, A.; Sanderson, B.J.S. The MTT and Crystal Violet Assays: Potential Confounders in Nanoparticle Toxicity Testing. Int. J. Toxicol. 2016, 35, 454–462. [Google Scholar] [CrossRef]
- Maioli, E.; Torricelli, C.; Fortino, V.; Carlucci, F.; Tommassini, V.; Pacini, A. Critical Appraisal of the MTT Assay in the Presence of Rottlerin and Uncouplers. Biol. Proc. Online 2009, 11, 227–240. [Google Scholar] [CrossRef] [PubMed] [Green Version]
- Talorete, T.P.N.; Bouaziz, M.; Sayadi, S.; Isoda, H. Influence of Medium Type and Serum on MTT Reduction by Flavonoids in the Absence of Cells. Cytotechnology 2006, 52, 189–198. [Google Scholar] [CrossRef] [PubMed] [Green Version]
- Xicoy, H.; Wieringa, B.; Martens, G.J.M. The SH-SY5Y Cell Line in Parkinson’s Disease Research: A Systematic Review. Mol. Neurodegener. 2017, 12, 10. [Google Scholar] [CrossRef] [Green Version]
- Marwarha, G.; Ghribi, O. Cellular Model of Alzheimer’s Disease—Relevance to Therapeutic Testing. Exp. Neurol. 2012, 233, 733–739. [Google Scholar] [CrossRef]
- Donato, M.T.; Lahoz, A.; Castell, J.V.; Gómez-Lechón, M.J. Cell Lines: A Tool for in Vitro Drug Metabolism Studies. Curr. Drug Metab. 2008, 9, 1–11. [Google Scholar]
- May, J.E.; Xu, J.; Morse, H.R.; Avent, N.D.; Donaldson, C. Toxicity Testing: The Search for an in Vitro Alternative to Animal Testing. Br. J. Biomed. Sci. 2009, 66, 160–165. [Google Scholar] [CrossRef]
- Namkaew, J.; Jaroonwitchawan, T.; Rujanapun, N.; Saelee, J.; Noisa, P. Combined Effects of Curcumin and Doxorubicin on Cell Death and Cell Migration of SH-SY5Y Human Neuroblastoma Cells. In Vitro Cell. Dev. Biol. Animal 2018, 54, 629–639. [Google Scholar] [CrossRef]
- Lantto, T.A.; Colucci, M.; Závadová, V.; Hiltunen, R.; Raasmaja, A. Cytotoxicity of Curcumin, Resveratrol and Plant Extracts from Basil, Juniper, Laurel and Parsley in SH-SY5Y and CV1-P Cells. Food Chem. 2009, 117, 405–411. [Google Scholar] [CrossRef]
- Wang, M.; Ruan, Y.; Chen, Q.; Li, S.; Wang, Q.; Cai, J. Curcumin Induced HepG2 Cell Apoptosis-Associated Mitochondrial Membrane Potential and Intracellular Free Ca2+ Concentration. Eur. J. Pharmacol. 2011, 650, 41–47. [Google Scholar] [CrossRef]
- Jiang, J.; Jin, H.; Liu, L.; Pi, J.; Yang, F.; Cai, J. Curcumin Disturbed Cell-Cycle Distribution of HepG2 Cells via Cytoskeletal Arrangement. Scanning 2013, 35, 253–260. [Google Scholar] [CrossRef]
- Bhullar, K.S.; Jha, A.; Rupasinghe, H.P.V. Novel Carbocyclic Curcumin Analog CUR3d Modulates Genes Involved in Multiple Apoptosis Pathways in Human Hepatocellular Carcinoma Cells. Chem.-Biol. Interact. 2015, 242, 107–122. [Google Scholar] [CrossRef]
- Giorgio, M.; Trinei, M.; Migliaccio, E.; Pelicci, P.G. Hydrogen Peroxide: A Metabolic by-Product or a Common Mediator of Ageing Signals? Nat. Rev. Mol. Cell Biol. 2007, 8, 722–728. [Google Scholar] [CrossRef]
- Sies, H. Redox Biology Hydrogen Peroxide as a Central Redox Signaling Molecule in Physiological Oxidative Stress: Oxidative Eustress. Redox Biol. 2017, 11, 613–619. [Google Scholar] [CrossRef]
- Carmona, M.; de Cubas, L.; Bautista, E.; Moral-Blanch, M.; Medraño-Fernández, I.; Sitia, R.; Boronat, S.; Ayté, J.; Hidalgo, E. Monitoring Cytosolic H2O2 Fluctuations Arising from Altered Plasma Membrane Gradients or from Mitochondrial Activity. Nat. Commun. 2019, 10, 4526. [Google Scholar] [CrossRef] [PubMed]
- Huang, B.K.; Sikes, H.D. Quantifying Intracellular Hydrogen Peroxide Perturbations in Terms of Concentration. Redox Biol. 2014, 2, 955–962. [Google Scholar] [CrossRef] [Green Version]
- Alvariño, R.; Alonso, E.; Abbasov, M.E.; Chaheine, C.M.; Conner, M.L.; Romo, D.; Alfonso, A.; Botana, L.M. Gracilin A Derivatives Target Early Events in Alzheimer’s Disease: In Vitro Effects on Neuroinflammation and Oxidative Stress. ACS Chem. Neurosci. 2019, 10, 4102–4111. [Google Scholar] [CrossRef]
- Zhao, X.; Fang, J.; Li, S.; Gaur, U.; Xing, X.; Wang, H.; Zheng, W. Artemisinin Attenuated Hydrogen Peroxide (H2o2)-Induced Oxidative Injury in SH-SY5Y and Hippocampal Neurons via the Activation of AMPK Pathway. Int. J. Mol. Sci. 2019, 20, 2680. [Google Scholar] [CrossRef] [PubMed] [Green Version]
- Morán-Santibañez, K.; Vasquez, A.H.; Varela-Ramirez, A.; Henderson, V.; Sweeney, J.; Odero-Marah, V.; Fenelon, K.; Skouta, R. Larrea Tridentata Extract Mitigates Oxidative Stress-Induced Cytotoxicity in Human Neuroblastoma SH-SY5Y Cells. Antioxidants 2019, 8, 427. [Google Scholar] [CrossRef] [Green Version]
- Franceschelli, S.; Lanuti, P.; Ferrone, A.; Gatta, D.M.P.; Speranza, L.; Pesce, M.; Grilli, A.; Cacciatore, I.; Ricciotti, E.; di Stefano, A.; et al. Modulation of Apoptotic Cell Death and Neuroprotective Effects of Glutathione—L-Dopa Codrug against H2O2-Induced Cellular Toxicity. Antioxidants 2019, 8, 319. [Google Scholar] [CrossRef] [Green Version]
- Uǧuz, A.C.; Öz, A.; Naziroǧlu, M. Curcumin Inhibits Apoptosis by Regulating Intracellular Calcium Release, Reactive Oxygen Species and Mitochondrial Depolarization Levels in SH-SY5Y Neuronal Cells. J. Recept. Signal Transduct. 2016, 36, 395–401. [Google Scholar] [CrossRef]
- Kaja, S.; Payne, A.J.; Naumchuk, Y.; Koulen, P. Quantification of Lactate Dehydrogenase for Cell Viability Testing Using Cell Lines and Primary Cultured Astrocytes. Curr. Protoc. Toxicol. 2017, 2017, 1–10. [Google Scholar] [CrossRef] [Green Version]
- Simola, N.; Morelli, M.; Carta, A.R. The 6-Hydroxydopamine Model of Parkinson’s Disease. Neurotox. Res. 2007, 11, 151–167. [Google Scholar] [CrossRef]
- Storch, A.; Kaftan, A.; Burkhardt, K.; Schwarz, J. 6-Hydroxydopamine Toxicity towards Human SH-SY5Y Dopaminergic Neuroblastoma Cells: Independent of Mitochondrial Energy Metabolism. J. Neur. Transmiss. 2000, 107, 0281–0293. [Google Scholar] [CrossRef]
- Rodriguez-Pallares, J.; Parga, J.A.; Muñoz, A.; Rey, P.; Guerra, M.J.; Labandeira-Garcia, J.L. Mechanism of 6-Hydroxydopamine Neurotoxicity: The Role of NADPH Oxidase and Microglial Activation in 6-Hydroxydopamine-Induced Degeneration of Dopaminergic Neurons. J. Neurochem. 2007, 103, 145–156. [Google Scholar] [CrossRef]
- Hanrott, K.; Gudmunsen, L.; O’Neill, M.J.; Wonnacott, S. 6-Hydroxydopamine-Induced Apoptosis Is Mediated via Extracellular Auto-Oxidation and Caspase 3-Dependent Activation of Protein Kinase C. J. Biol. Chem. 2006, 281, 5373–5378. [Google Scholar] [CrossRef] [Green Version]
- Jaisin, Y.; Thampithak, A.; Meesarapee, B.; Ratanachamnong, P.; Suksamrarn, A.; Phivthong-ngam, L.; Phumala-Morales, N.; Chongthammakun, S.; Govitrapong, P.; Sanvarinda, Y. Curcumin I Protects the Dopaminergic Cell Line SH-SY5Y from 6-Hydroxydopamine-Induced Neurotoxicity through Attenuation of P53-Mediated Apoptosis. Neurosci. Lett. 2011, 489, 192–196. [Google Scholar] [CrossRef]
- Kovacic, P.; Edwards, W.D.; Ming, G. Theoretical Studies on Mechanism of MPTP Action: ET Interference by MPP+ (1-Methyl-4-Phenylpyridinium) with Mitochondrial Respiration vs. Oxidative Stress. Free Radic. Res. Commun. 1991, 14, 25–32. [Google Scholar] [CrossRef]
- Singer, T.P.; Ramsay, R.R. Mechanism of the Neurotoxicity of MPTP. An Update. FEBS Lett. 1990, 274, 1–8. [Google Scholar] [CrossRef] [Green Version]
- Jackson-Lewis, V.; Blesa, J.; Przedborski, S. Animal Models of Parkinson’s Disease. Parkinsonism Relat. Disord. 2012, 18, S183–S185. [Google Scholar] [CrossRef]
- Salari, S.; Bagheri, M. In Vivo, in Vitro and Pharmacologic Models of Parkinson’s Disease. Physiol. Res. 2019, 68, 17–24. [Google Scholar] [CrossRef]
- Sang, Q.; Liu, X.; Wang, L.; Qi, L.; Sun, W.; Wang, W.; Sun, Y.; Zhang, H. Curcumin Protects an SH-SY5Y Cell Model of Parkinson’s Disease against Toxic Injury by Regulating HSP90. Cell. Physiol. Biochem. 2018, 51, 681–691. [Google Scholar] [CrossRef]
- Yu, S.; Zheng, W.; Xin, N.; Chi, Z.H.; Wang, N.Q.; Nie, Y.X.; Feng, W.Y.; Wang, Z.Y. Curcumin Prevents Dopaminergic Neuronal Death through Inhibition of the C-Jun N-Terminal Kinase Pathway. Rejuv. Res. 2010, 13, 55–64. [Google Scholar] [CrossRef]
- Annunziato, L.; Amoroso, S.; Pannaccione, A.; Cataldi, M.; Pignataro, G.; D’Alessio, A.; Sirabella, R.; Secondo, A.; Sibaud, L.; Di Renzo, G.F. Apoptosis Induced in Neuronal Cells by Oxidative Stress: Role Played by Caspases and Intracellular Calcium Ions. Toxicol. Lett. 2003, 139, 125–133. [Google Scholar] [CrossRef]
- Maruyama, W.; Shaomoto-Nagai, M.; Kato, Y.; Hisaka, S.; Osawa, T.; Naoi, M. Role of Lipid Peroxide in the Neurodegenerative Disorders. Sub-Cell. Biochem. 2014, 77, 127–136. [Google Scholar] [CrossRef]
- Umeno, A.; Biju, V.; Yoshida, Y. In Vivo ROS Production and Use of Oxidative Stress-Derived Biomarkers to Detect the Onset of Diseases Such as Alzheimer’s Disease, Parkinson’s Disease, and Diabetes. Free Radic. Res. 2017, 51, 413–427. [Google Scholar] [CrossRef]
- Niki, E. Biochim. Biophys. Acta Biomarkers of Lipid Peroxidation in Clinical Material. BBA—Gen. Subj. 2014, 1840, 809–817. [Google Scholar] [CrossRef]
- Satiler, W.; Malle, E.; Kostner, G.M. Methodological Approaches for Assessing Lipid and Protein Oxidation and Modification in Plasma and Isolated Lipoproteins. In Lipoprotein Protocols; Humana Press: Totowa, NJ, USA, 1998; Volume 110, pp. 167–192. [Google Scholar]
- Mirończuk-Chodakowska, I.; Witkowska, A.M.; Zujko, M.E. Endogenous Non-Enzymatic Antioxidants in the Human Body. Adv. Med. Sci. 2018, 63, 68–78. [Google Scholar] [CrossRef]
- Aoyama, K.; Nakaki, T. Impaired Glutathione Synthesis in Neurodegeneration. Int. J. Mol. Sci. 2013, 14, 21021–21044. [Google Scholar] [CrossRef] [Green Version]
- Garcia-Garcia, A.; Zavala-Flores, L.; Rodriguez-Rocha, H.; Franco, R. Thiol-Redox Signaling, Dopaminergic Cell Death, and Parkinson’s Disease. Antioxid. Redox Signal. 2012, 17, 1764–1784. [Google Scholar] [CrossRef] [Green Version]
- Čapek, J.; Hauschke, M.; Brůčková, L.; Roušar, T. Comparison of Glutathione Levels Measured Using Optimized Monochlorobimane Assay with Those from Ortho-Phthalaldehyde Assay in Intact Cells. J. Pharmacol. Toxicol. Methods 2017, 88, 40–45. [Google Scholar] [CrossRef]
- Constantinescu, R.; Constantinescu, A.T.; Reichmann, H.; Janetzky, B. Neuronal Differentiation and Long-Term Culture of the Human Neuroblastoma Line SH-SY5Y. J. Neur. Transmiss. 2007, 17–28. [Google Scholar] [CrossRef]
- Agholme, L.; Lindström, T.; Kågedal, K.; Marcusson, J.; Hallbeck, M. An in Vitro Model for Neuroscience: Differentiation of SH-SY5Y Cells into Cells with Morphological and Biochemical Characteristics of Mature Neurons. J. Alzheimer’s Dis. 2010, 20, 1069–1082. [Google Scholar] [CrossRef] [Green Version]
- Paik, S.; Somvanshi, R.K.; Kumar, U. Somatostatin-Mediated Changes in Microtubule-Associated Proteins and Retinoic Acid–Induced Neurite Outgrowth in SH-SY5Y Cells. J. Mol. Neurosci. 2019, 68, 120–134. [Google Scholar] [CrossRef]
- Jaworska-Feil, L.; Jantas, D.; Leskiewicz, M.; Budziszewska, B.; Kubera, M.; Basta-Kaim, A.; Lipkowski, A.W.; Lason, W. Protective Effects of TRH and Its Analogues against Various Cytotoxic Agents in Retinoic Acid (RA)-Differentiated Human Neuroblastoma SH-SY5Y Cells. Neuropeptides 2010, 44, 495–508. [Google Scholar] [CrossRef] [PubMed]


| Antioxidant Capacity (%) | ||||||
|---|---|---|---|---|---|---|
| ABTS Assay | FRAP Assay | |||||
| Compound | IC50 (μM) | TEAC50 * | TEAC100 * | at 100 uM | at 200 uM | Trolox Equivalents |
| Trolox | 25.1 ± 1.2 | 1 | 1 | 51.3 | 100 | 1 |
| Curcumin | 21.0 ± 1.5 | 1.1 | 1.1 | 49.0 | 74.4 | 0.96 |
| 1 | 576.3 ± 40.0 | 0.33 | 0.16 | 0.5 | 0.5 | 0.01 |
| 2 | >1000 | n.d. | n.d. | 1.00 | 0.5 | 0.02 |
| 3 | >1000 | n.d. | n.d. | 1.5 | 1.8 | 0.03 |
| 4 | >1000 | n.d. | n.d. | 1.1 | 1.3 | 0.02 |
| 5 | 658.4 ± 96.0 | 0.32 | 0.15 | 1.4 | 5.5 | 0.03 |
| 6 | >1000 | n.d. | n.d. | 1.1 | 1.6 | 0.02 |
| 7 | 635.0 ± 87.0 | 0.35 | 0.16 | 0.6 | 0.4 | 0.01 |
| 8 | >1000 | n.d. | n.d. | 0.6 | 0.2 | 0.01 |
| 9 | 431.6 ± 68.0 | 0.36 | 0.18 | 21.9 | 37.1 | 0.43 |
| 10 | >1000 | n.d. | n.d. | 0.3 | 0.6 | 0.01 |
| 11 | 306.4 ± 34.6 | 0.35 | 0.17 | 28.9 | 49.8 | 0.56 |
| 12 | >1000 | n.d. | n.d. | 0.8 | 1.4 | 0.02 |
| 13 | 324.7 ± 55.0 | 0.36 | 0.19 | 40.7 | 61.6 | 0.79 |
| 14 | >1000 | n.d. | n.d. | 0.3 | 0.6 | 0.01 |
| 15 | 495.5 ± 82.0 | 0.34 | 0.15 | 3.8 | 6.2 | 0.07 |
| 16 | >1000 | n.d. | n.d. | 0 | 0 | 0.00 |
| 17 | >1000 | n.d. | n.d. | 1.8 | 2.5 | 0.04 |
| 18 | 187.3 ± 15.2 | 0.36 | 0.21 | 45.7 | 65.1 | 0.89 |
| 19 | >1000 | n.d. | n.d. | 1.7 | 3.5 | 0.03 |
| 20 | 269.0 ± 27.2 | 0.34 | 0.18 | 48.1 | 63.8 | 0.90 |
| 21 | 137.0 ± 5.3 | 0.36 | 0.21 | 47.2 | 60.9 | 0.89 |
| 22 | >500 | n.d. | n.d. | 15.7 | 13.7 | 0.30 |
| 23 | >500 | n.d. | n.d. | 2.7 | 4.6 | 0.03 |
| 24 | 64.2 ± 4.4 | 0.58 | 0.32 | 6.0 | 10.9 | 0.11 |
| Compound | MW | clogP | logD | HBD | NO | TPSA | BBB Permeant |
|---|---|---|---|---|---|---|---|
| Curcumin | 368.39 | 2.256 | 2.778 | 3 | 6 | 96.2 | No |
| 1 | 246.165 | 2.311 | 1.107 | 1 | 3 | 41.46 | Yes |
| 2 | 260.192 | 2.583 | 1.362 | 0 | 3 | 32.67 | Yes |
| 3 | 308.237 | 3.355 | 2.646 | 1 | 3 | 41.46 | Yes |
| 4 | 322.264 | 3.593 | 2.854 | 0 | 3 | 32.67 | Yes |
| 5 | 326.227 | 3.475 | 2.705 | 1 | 3 | 41.46 | Yes |
| 6 | 340.254 | 3.71 | 2.918 | 0 | 3 | 32.67 | Yes |
| 7 | 342.682 | 3.593 | 3.101 | 1 | 3 | 41.46 | Yes |
| 8 | 356.709 | 3.825 | 3.297 | 0 | 3 | 32.67 | Yes |
| 9 | 272.256 | 3.112 | 2.424 | 1 | 3 | 41.46 | Yes |
| 10 | 286.283 | 3.355 | 2.528 | 0 | 3 | 32.67 | Yes |
| 11 | 254.265 | 2.988 | 2.334 | 1 | 3 | 41.46 | Yes |
| 12 | 268.292 | 3.234 | 2.434 | 0 | 3 | 32.67 | Yes |
| 13 | 254.265 | 2.988 | 2.207 | 1 | 3 | 41.46 | Yes |
| 14 | 268.292 | 3.234 | 2.296 | 0 | 3 | 32.67 | Yes |
| 15 | 272.256 | 3.112 | 2.334 | 1 | 3 | 41.46 | Yes |
| 16 | 286.283 | 3.355 | 2.484 | 0 | 3 | 32.67 | Yes |
| 17 | 272.256 | 3.112 | 2.483 | 1 | 3 | 41.46 | Yes |
| 18 | 236.275 | 2.595 | 2.081 | 1 | 3 | 41.46 | Yes |
| 19 | 250.302 | 2.844 | 2.156 | 0 | 3 | 32.67 | Yes |
| 20 | 326.354 | 1.225 | 1.799 | 1 | 6 | 69.15 | Yes |
| 21 | 362.335 | 1.458 | 2.121 | 1 | 6 | 69.15 | Yes |
| 22 | 354.408 | 1.685 | 2.436 | 1 | 6 | 69.15 | Yes |
| 23 | 395.244 | 1.685 | 3.014 | 1 | 6 | 69.15 | Yes |
| Compound | Solubility (µM) * | mp °C | Silicos-IT Class ** |
|---|---|---|---|
| Curcumin | <50 | ND | Moderately soluble |
| 1 | >200 | 155.2 | Moderately soluble |
| 2 | >200 | 132.2 | Moderately soluble |
| 3 | <100 | 253.3 | Poorly soluble |
| 4 | ND | 133.7 | Poorly soluble |
| 5 | <20 | 248.1 | Poorly soluble |
| 6 | <200 | 142.6 | Poorly soluble |
| 7 | <50 | 211.7 | Poorly soluble |
| 8 | <100 | 128.7 | Poorly soluble |
| 9 | <50 | 214.2 | Poorly soluble |
| 10 | >200 | 115.8 | Moderately soluble |
| 11 | <20 | 212.5 | Poorly soluble |
| 12 | >200 | oil | Moderately soluble |
| 13 | <20 | 205.7 | Poorly soluble |
| 14 | >200 | 107.7 | Moderately soluble |
| 15 | <10 | 213.4 | Poorly soluble |
| 16 | >200 | 60.2 | Moderately soluble |
| 17 | <50 | 221.5 | Poorly soluble |
| 18 | <100 | 208.2 | Moderately soluble |
| 19 | >200 | oil | Moderately soluble |
| 20 | >200 | 215.4 | Poorly soluble |
| 21 | <100 | 208.5 | Poorly soluble |
| 22 | <100 | 241.8 | Poorly soluble |
| 23 | <20 | 246.0 | Poorly soluble |
| Compound | SH-SY5Y IC50 (µM) * | HepG2 IC50 (µM) * |
|---|---|---|
| Curcumin | 48.8 ± 5.1 | 109.7 ± 9.8 |
| 1 | >250 | >250 |
| 2 | >250 | >250 |
| 3 | >250 | >250 |
| 4 | >250 | >250 |
| 5 | >250 | >250 |
| 6 | >250 | >250 |
| 7 | 135.0 ± 11.2 | 201 ± 13.1 |
| 8 | 150.1 ± 17.0 | 206.8 ± 27.0 |
| 9 | >250 | >250 |
| 10 | 193 ± 15.9 | >250 |
| 11 | >250 | >250 |
| 12 | 240.1 ± 24.9 | 230.2 ± 25.5 |
| 13 | >250 | >250 |
| 14 | 220.2 ± 27.9 | 233.0 ± 18.7 |
| 15 | >250 | >250 |
| 16 | >250 | >250 |
| 17 | >250 | >250 |
| 18 | >250 | 223.7 ± 35.0 |
| 19 | 200.6 ± 27.0 | >250 |
| 20 | >250 | >250 |
| 21 | >250 | >250 |
| 22 | >250 | >250 |
| 23 | >250 | N.D. |
| % Cell Viability at Compound Concentration * | ||||
|---|---|---|---|---|
| Compound | 5 µM | 10 µM | 20 µM | 40 µM |
| Curcumin | + | + | − | − |
| 1 | − | − | − | − |
| 2 | − | − | − | − |
| 3 | − | − | − | − |
| 4 | − | − | − | − |
| 5 | − | − | − | − |
| 6 | − | − | − | − |
| 7 | + | − | − | − |
| 8 | − | − | − | − |
| 9 | + | + | − | − |
| 10 | − | − | − | − |
| 11 | + | + | + | − |
| 12 | − | − | − | − |
| 13 | − | + | + | − |
| 14 | − | − | − | − |
| 15 | − | − | − | − |
| 16 | − | − | − | − |
| 17 | − | − | − | − |
| 18 | + | + | + | + |
| 19 | − | − | − | − |
| 20 | + | + | + | + |
| 21 | + | − | − | − |
| 22 | − | − | − | − |
| 23 | − | − | − | − |
Publisher’s Note: MDPI stays neutral with regard to jurisdictional claims in published maps and institutional affiliations. |
© 2021 by the authors. Licensee MDPI, Basel, Switzerland. This article is an open access article distributed under the terms and conditions of the Creative Commons Attribution (CC BY) license (https://creativecommons.org/licenses/by/4.0/).
Share and Cite
Ortíz de Zárate, A.; Pérez-Torralba, M.; Bonet Isidro, I.; López, C.; Claramunt, R.M.; Martínez-Casanova, D.; Sánchez-Vera, I.; Jiménez-González, J.; Lavandera, J.L. 1,5-Benzodiazepin-2(3H)-ones: In Vitro Evaluation as Antiparkinsonian Agents. Antioxidants 2021, 10, 1584. https://doi.org/10.3390/antiox10101584
Ortíz de Zárate A, Pérez-Torralba M, Bonet Isidro I, López C, Claramunt RM, Martínez-Casanova D, Sánchez-Vera I, Jiménez-González J, Lavandera JL. 1,5-Benzodiazepin-2(3H)-ones: In Vitro Evaluation as Antiparkinsonian Agents. Antioxidants. 2021; 10(10):1584. https://doi.org/10.3390/antiox10101584
Chicago/Turabian StyleOrtíz de Zárate, Ana, Marta Pérez-Torralba, Iñigo Bonet Isidro, Concepción López, Rosa M. Claramunt, Diana Martínez-Casanova, Isabel Sánchez-Vera, Jesús Jiménez-González, and José Luis Lavandera. 2021. "1,5-Benzodiazepin-2(3H)-ones: In Vitro Evaluation as Antiparkinsonian Agents" Antioxidants 10, no. 10: 1584. https://doi.org/10.3390/antiox10101584
APA StyleOrtíz de Zárate, A., Pérez-Torralba, M., Bonet Isidro, I., López, C., Claramunt, R. M., Martínez-Casanova, D., Sánchez-Vera, I., Jiménez-González, J., & Lavandera, J. L. (2021). 1,5-Benzodiazepin-2(3H)-ones: In Vitro Evaluation as Antiparkinsonian Agents. Antioxidants, 10(10), 1584. https://doi.org/10.3390/antiox10101584