Prediction of PD-L1 Expression in Neuroblastoma via Computational Modeling

 , , , ,

 ,
,  and
and 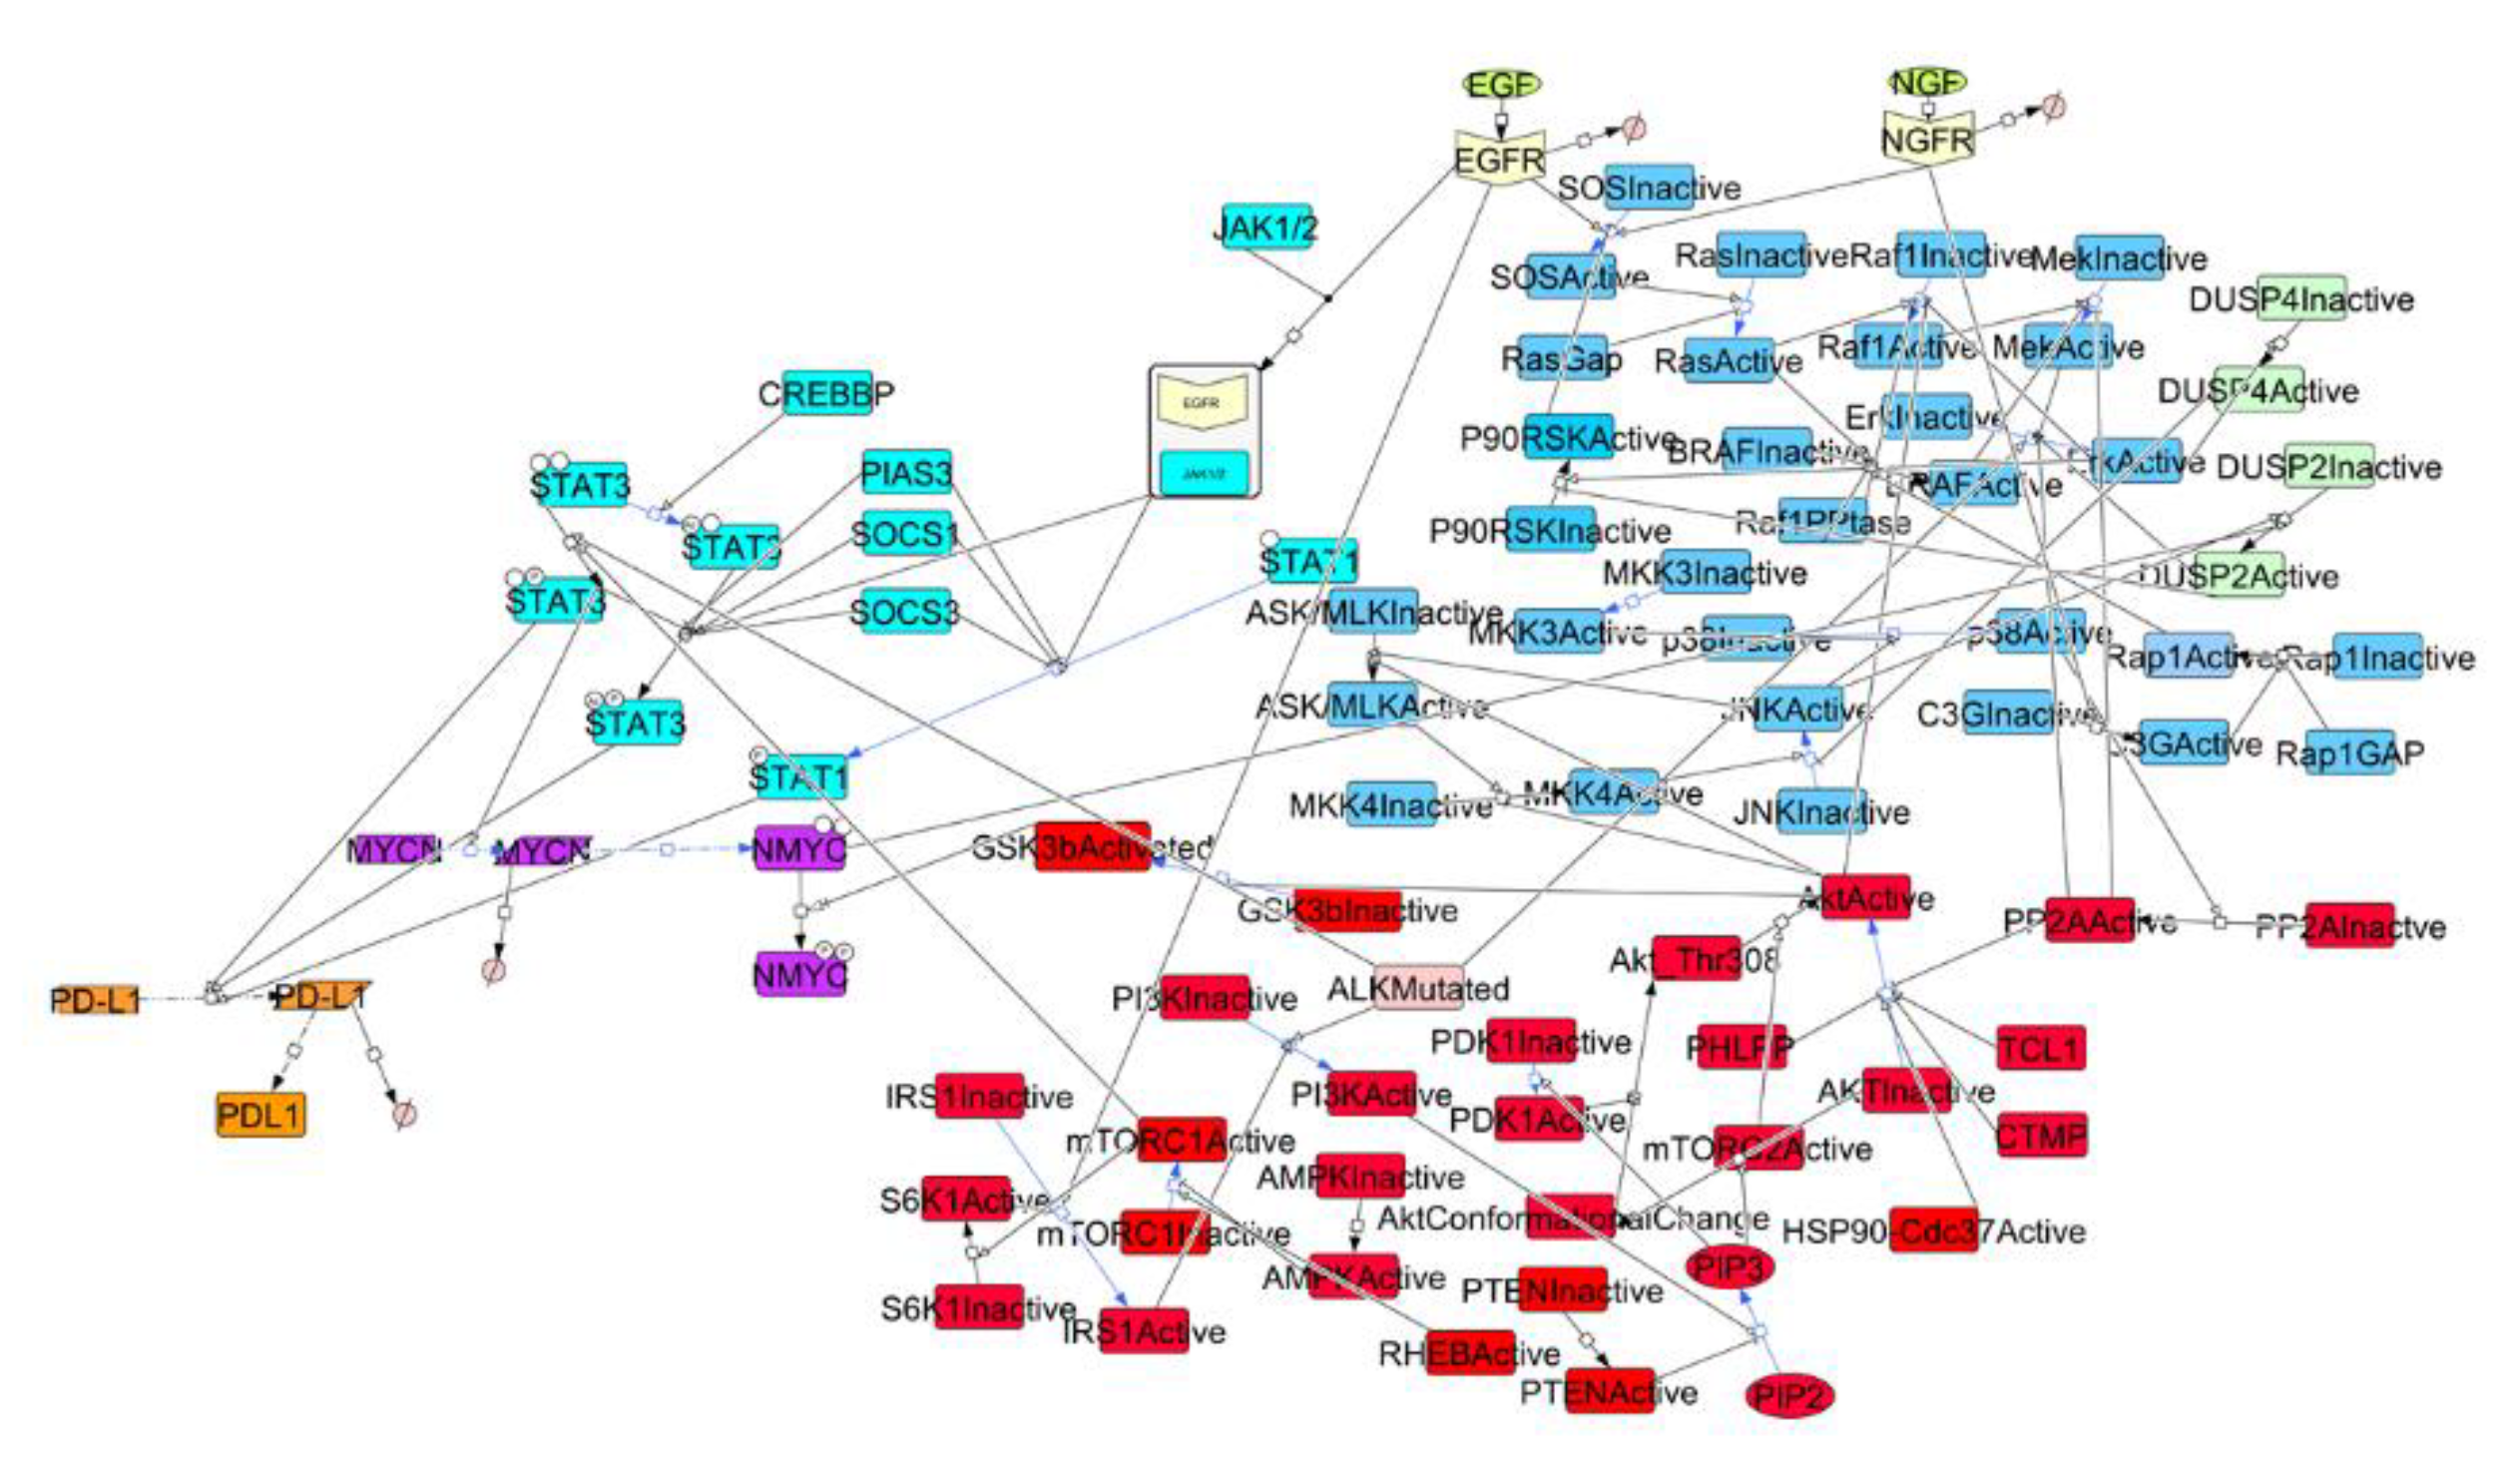
Abstract
1. Introduction
2. Materials and Methods
2.1. Construction of a Signaling Network in NBM
2.2. Parameters Estimation and Kinetics Simulation
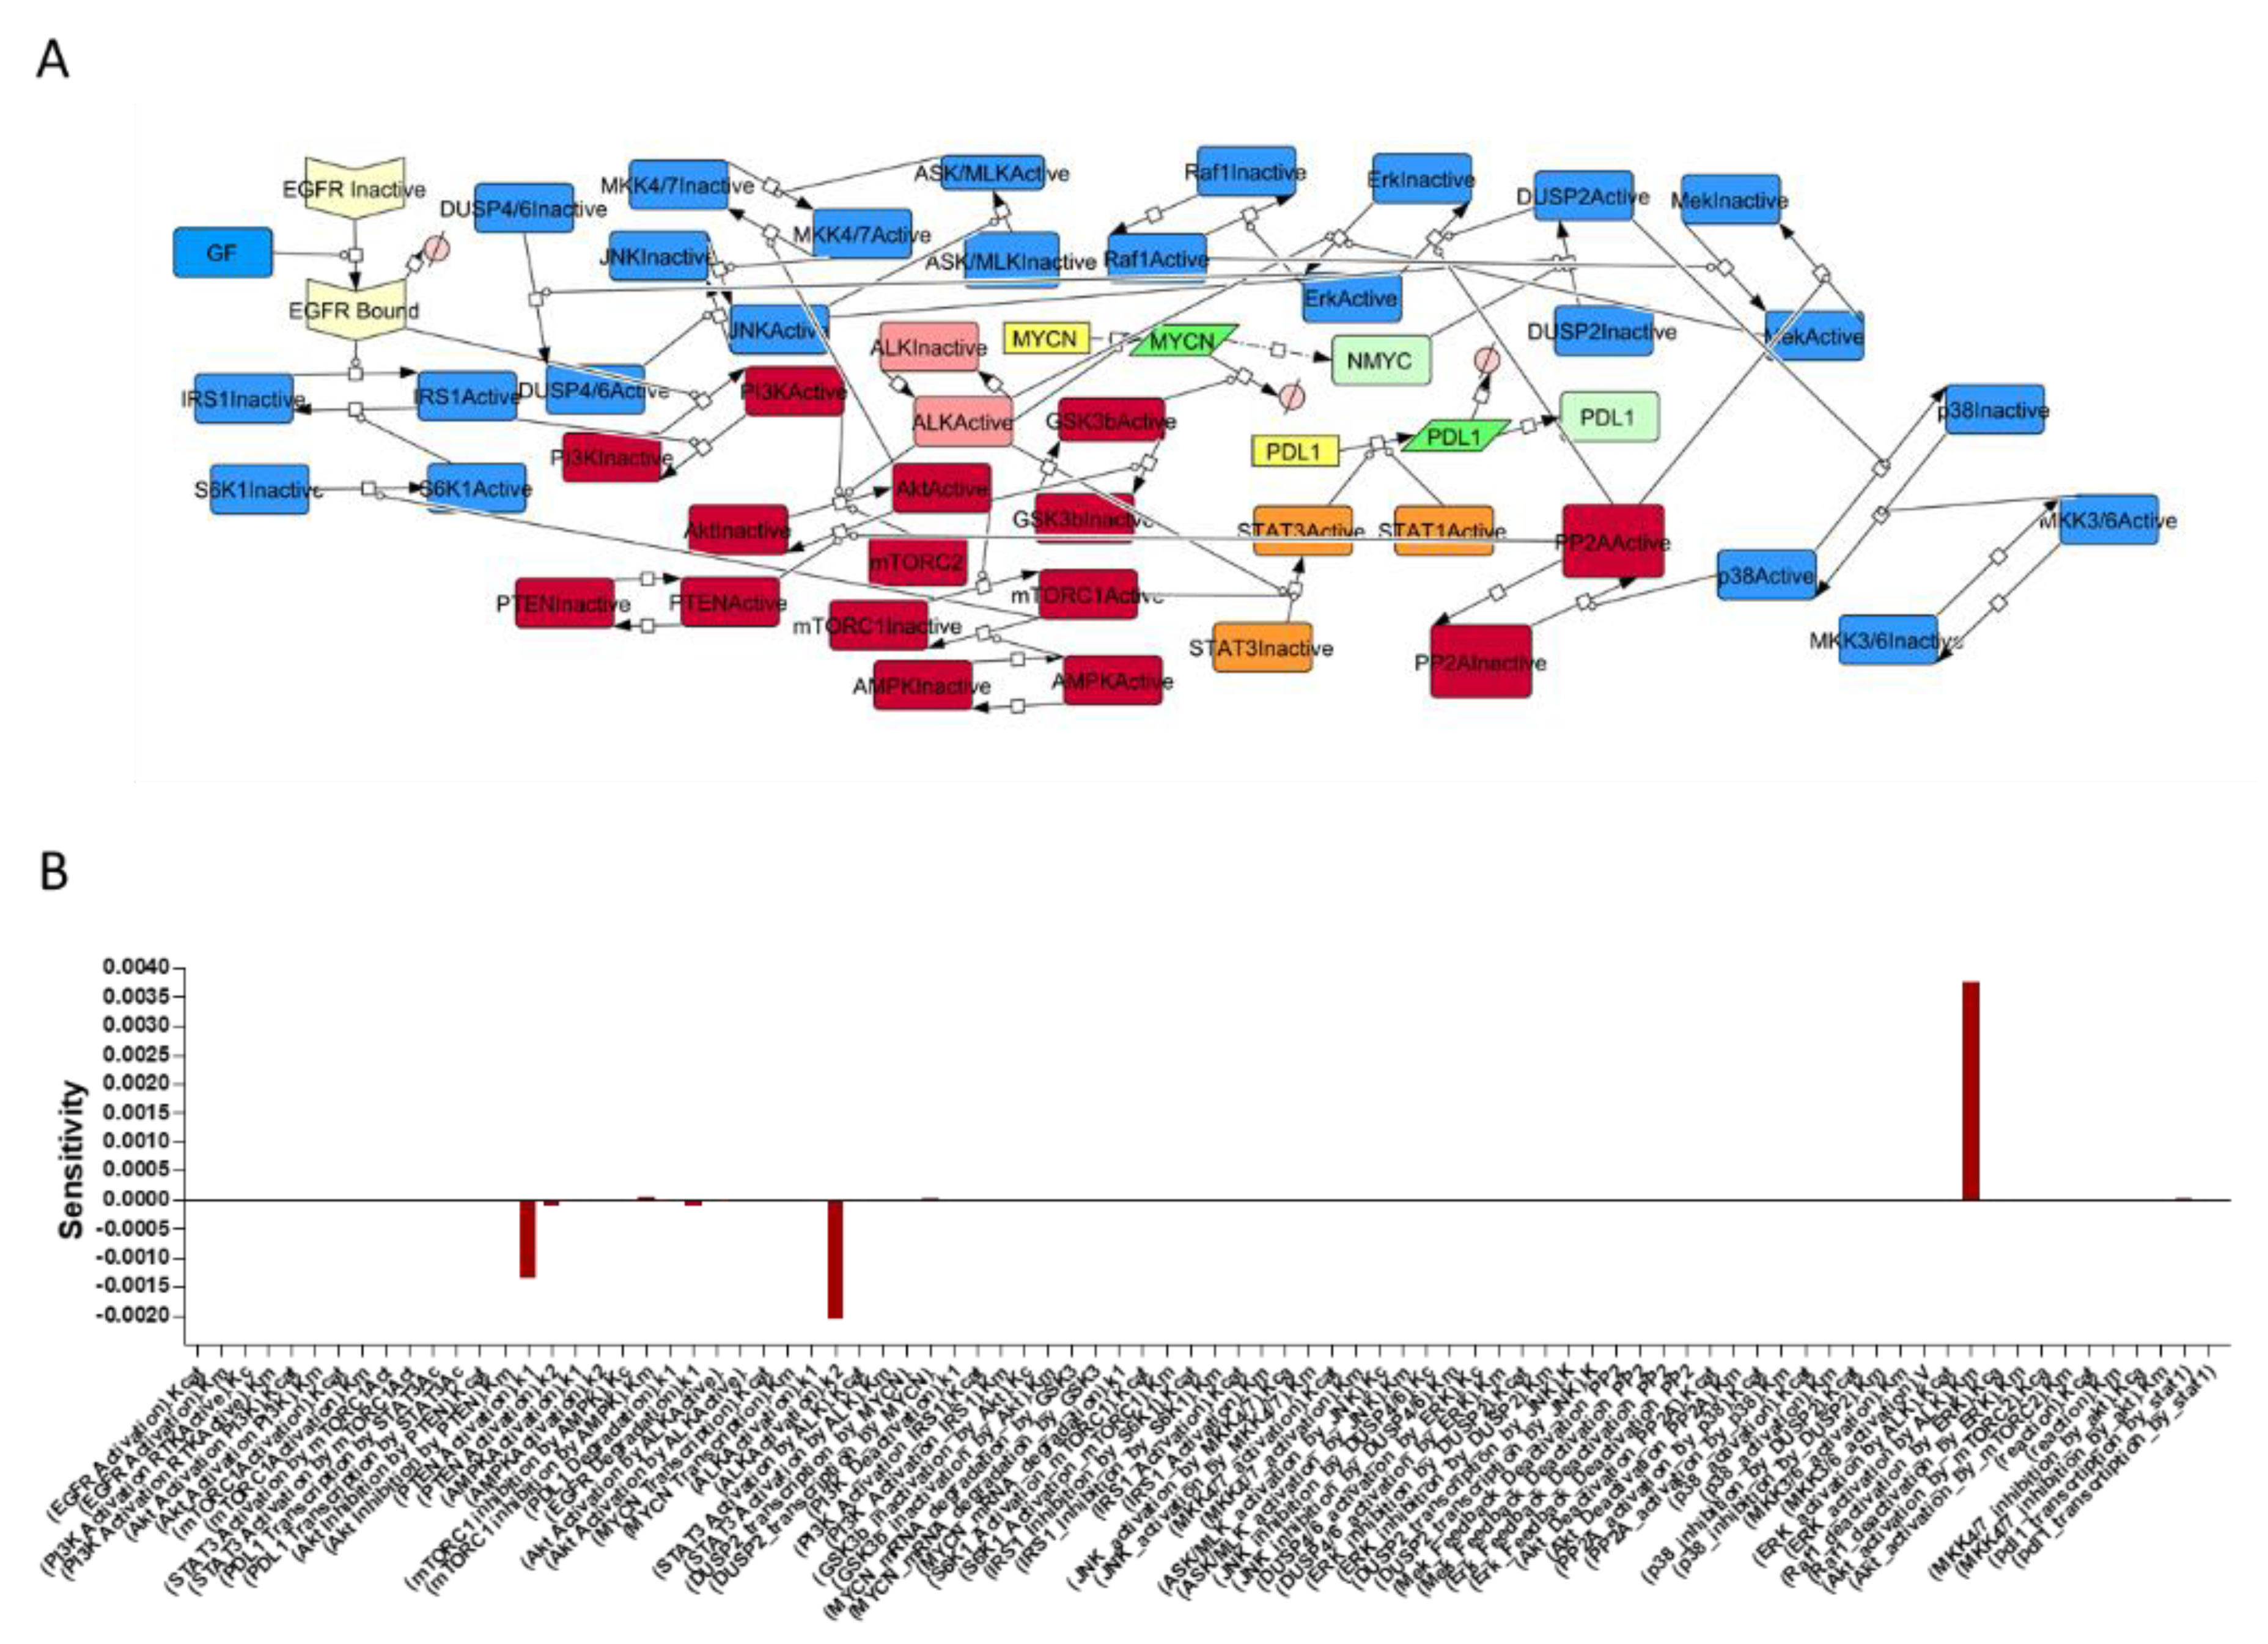
2.3. Sensitivity Analysis
2.4. Validation Analysis
3. Results
3.1. Signaling Network in NBM and Sensitivity Analysis
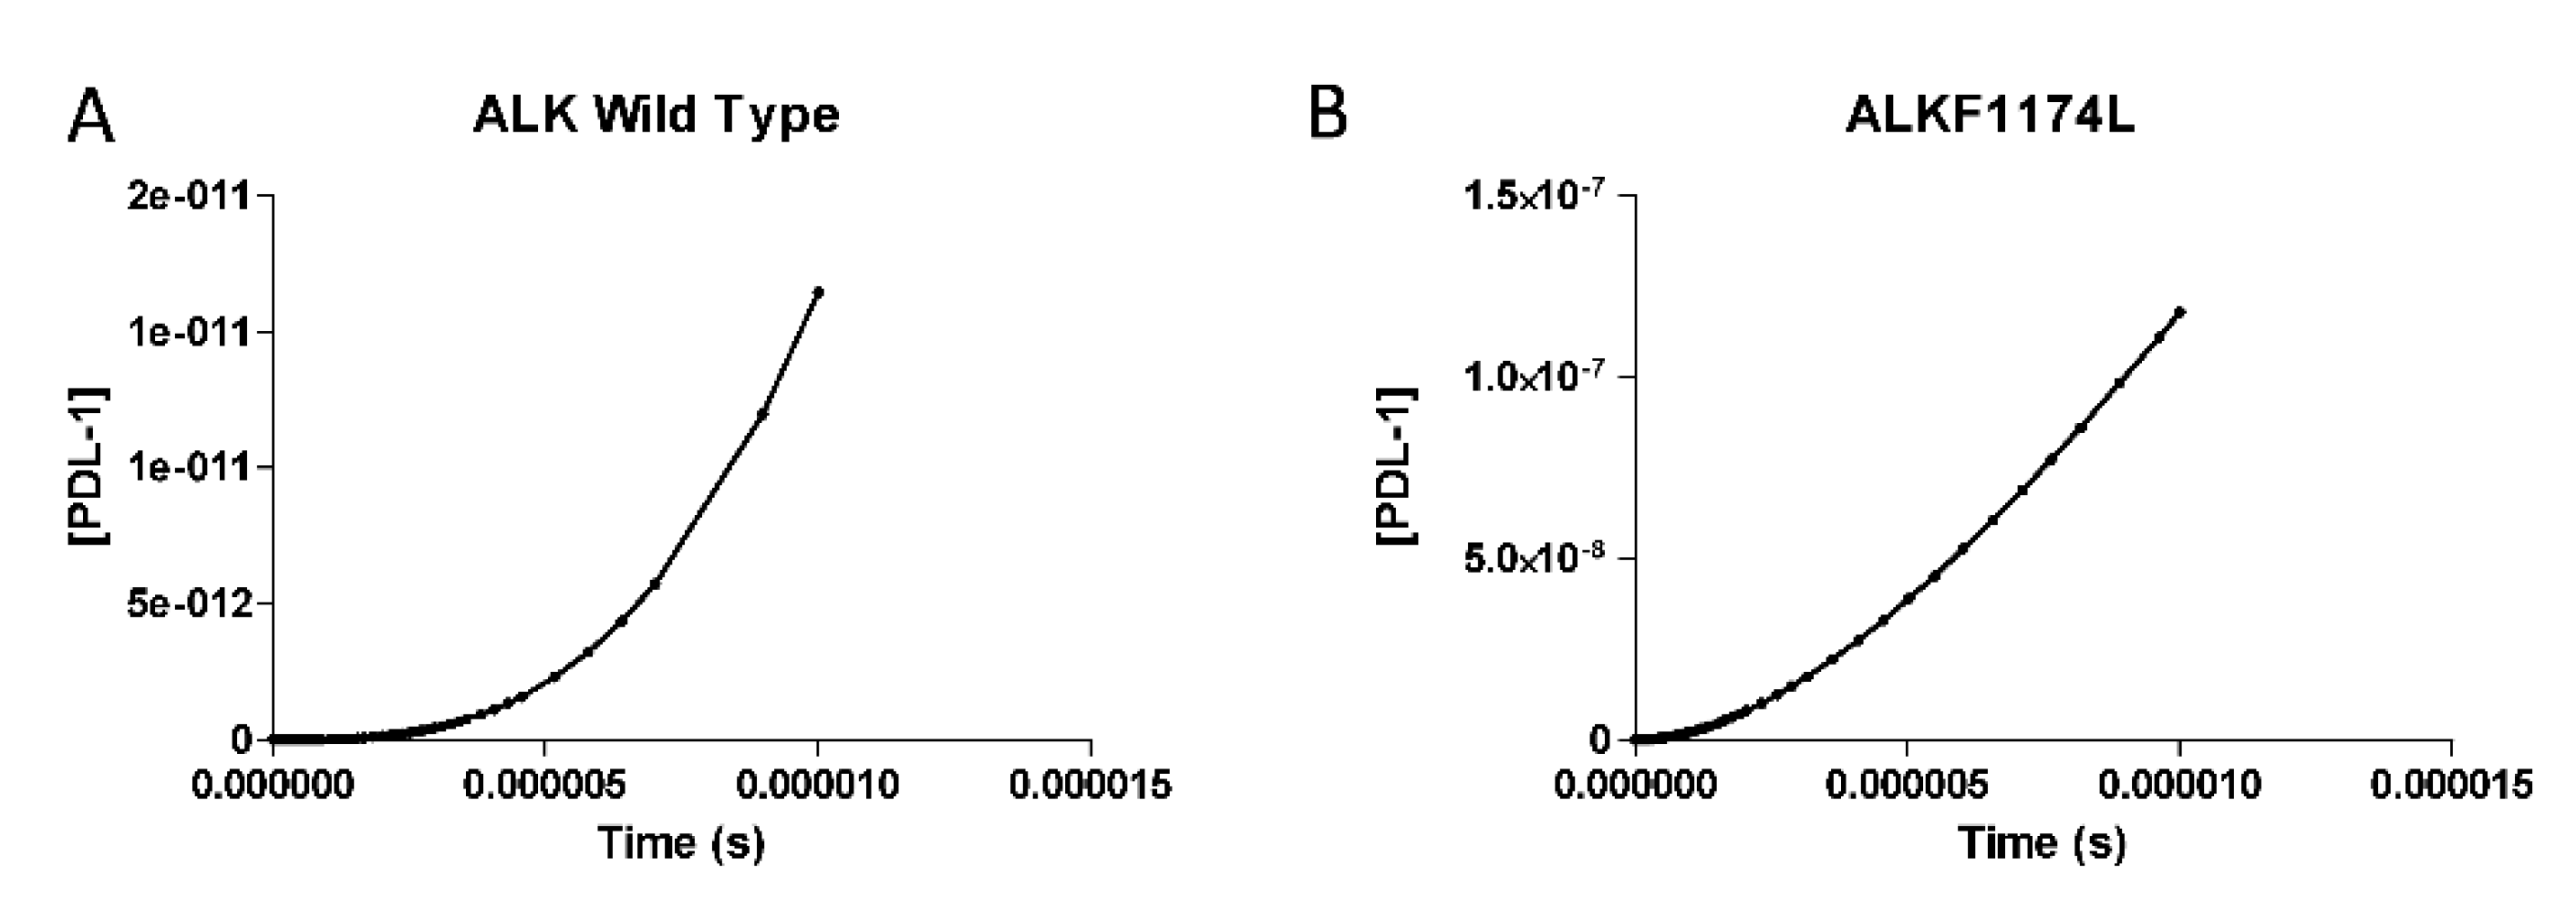
3.2. PDL-1 Expression is Controlled by ALK
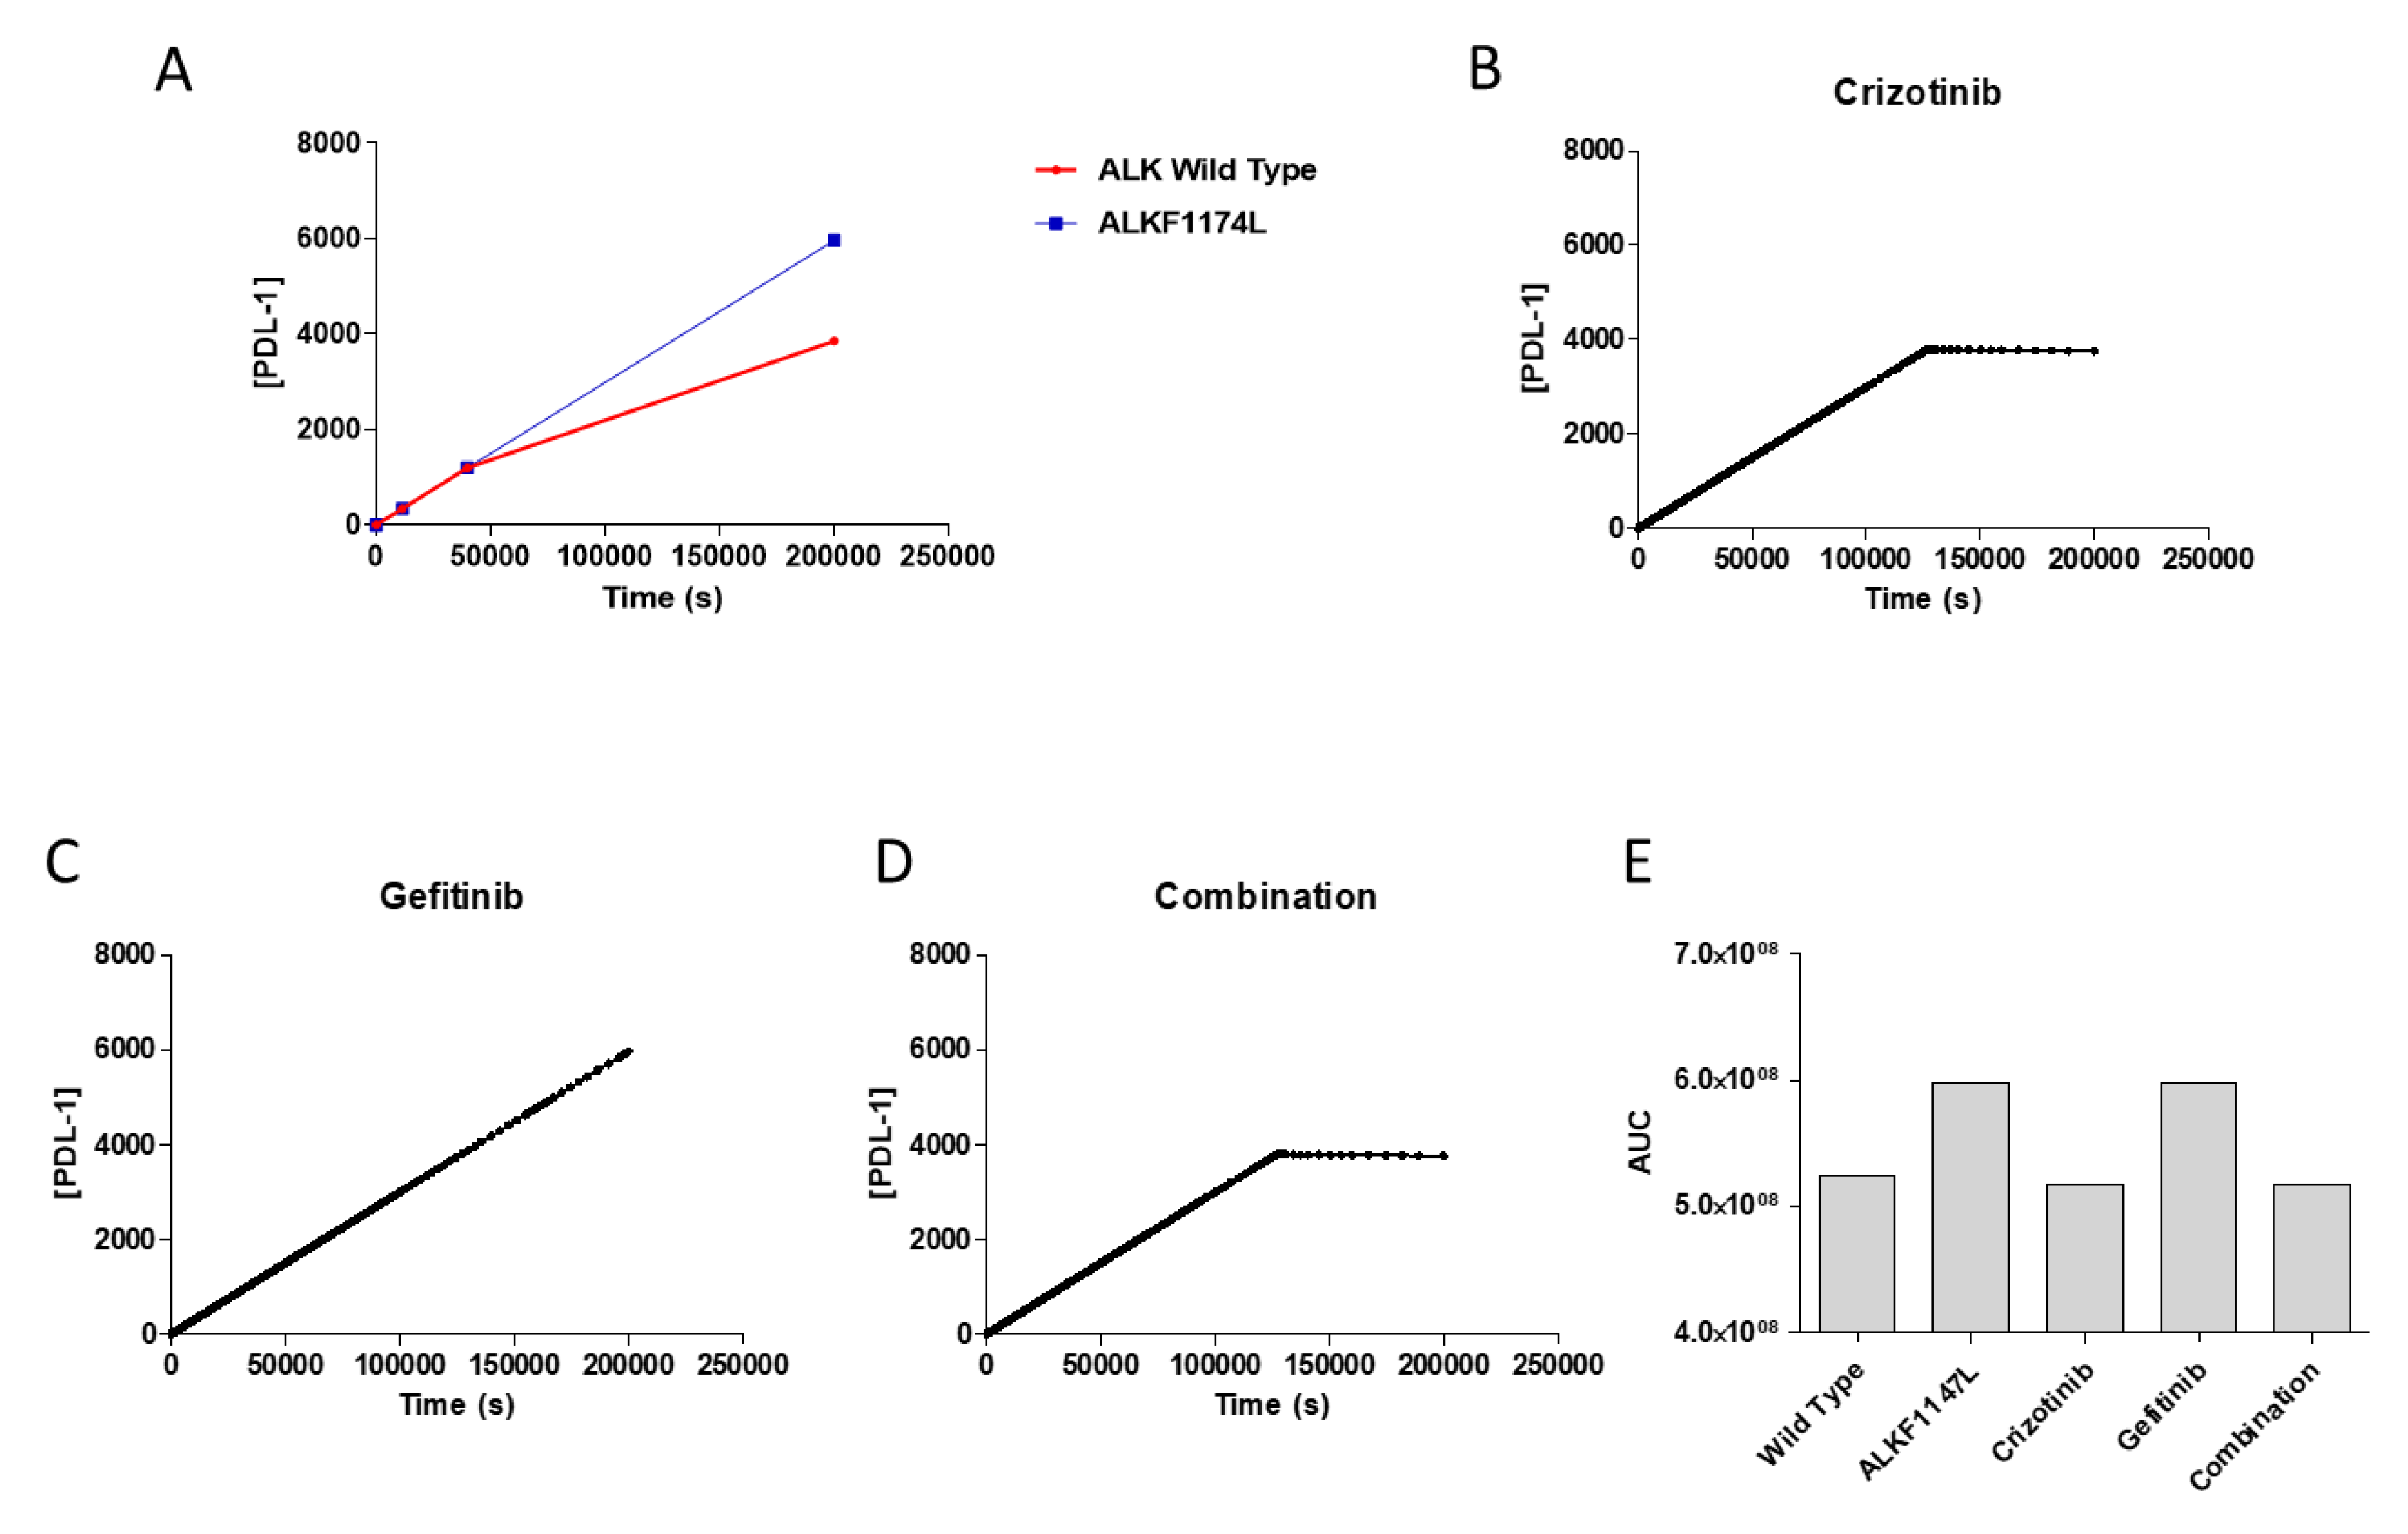
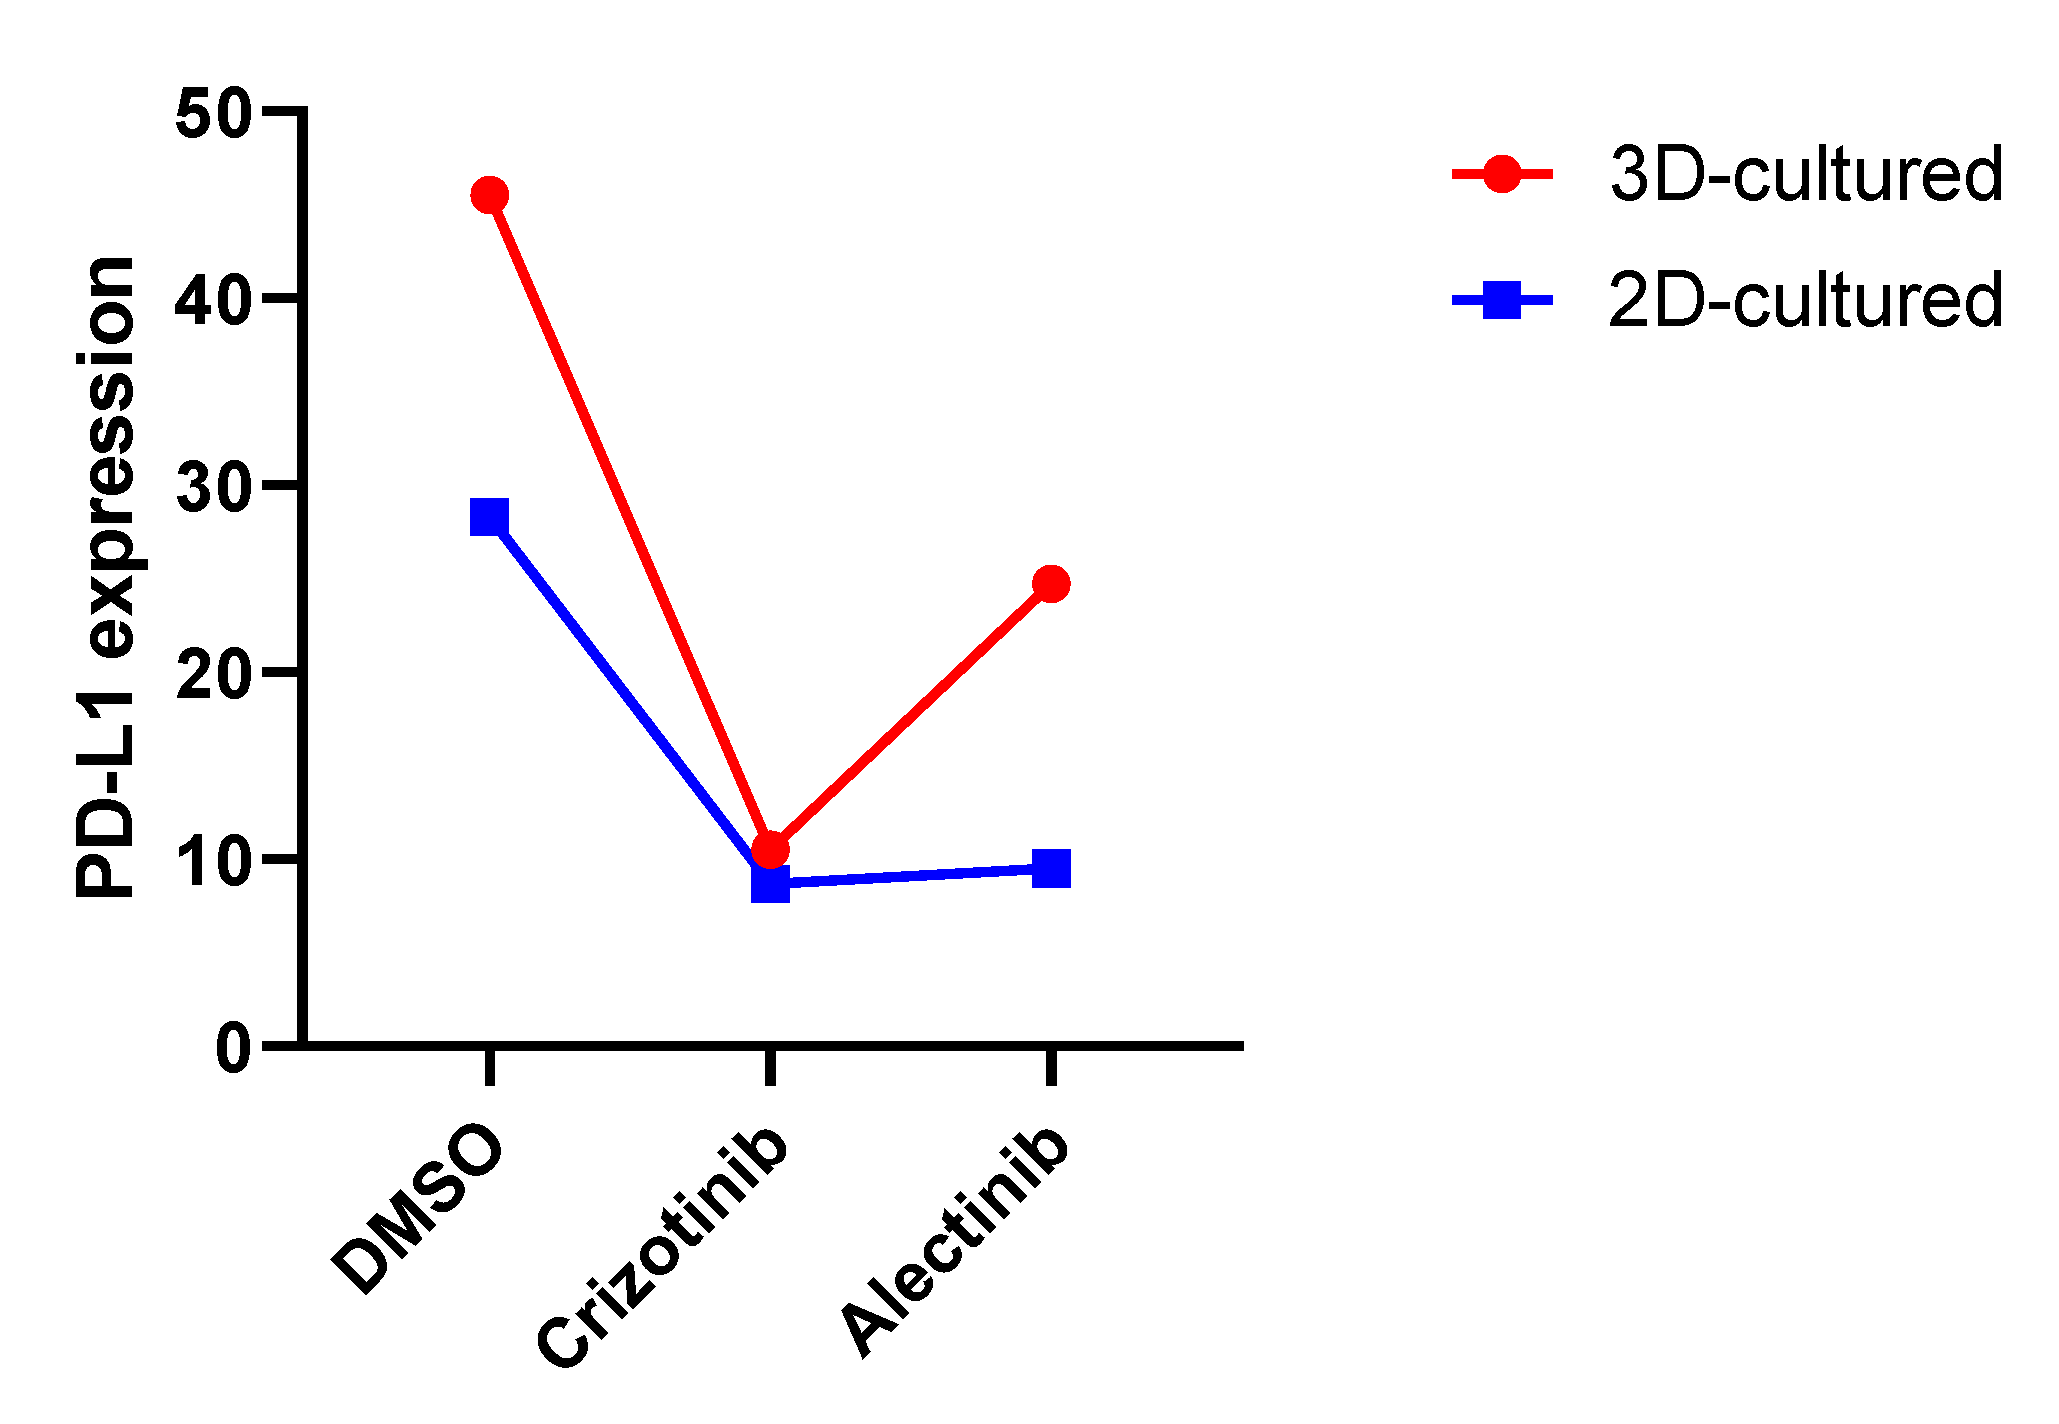
3.3. Effects of Pharmacological Treatment on PDL-1 Expression
3.4. Validation Analysis
4. Discussion
5. Conclusions
Supplementary Materials
Author Contributions
Funding
Conflicts of Interest
References
- Maris, J.M.; Hogarty, M.D.; Bagatell, R.; Cohn, S.L. Neuroblastoma. Lancet 2007, 369, 2106–2120. [Google Scholar] [CrossRef]
- Bolande, R.P. The neurocristopathiesA unifying concept of disease arising in neural crest maldevelopment. Hum. Pathol. 1974, 5, 409–429. [Google Scholar] [CrossRef]
- Salazar, B.M.; Balczewski, E.A.; Ung, C.Y.; Zhu, S. Neuroblastoma, a paradigm for big data science in pediatric oncology. Int. J. Mol. Sci. 2017, 18, 37. [Google Scholar] [CrossRef] [PubMed]
- Maris, J.M. Recent advances in neuroblastoma. N. Engl. J. Med. 2012, 362, 2202–2211. [Google Scholar] [CrossRef] [PubMed]
- Yu, A.L.; Gilman, A.L.; Ozkaynak, M.F.; London, W.B.; Kreissman, S.G.; Chen, H.X.; Smith, M.; Anderson, B.; Villablanca, J.G.; Matthay, K.K.; et al. Anti-GD2 Antibody with GM-CSF, Interleukin-2, and Isotretinoin for Neuroblastoma. N. Engl. J. Med. 2011, 363, 1324–1334. [Google Scholar] [CrossRef] [PubMed]
- Richards, R.M.; Sotillo, E.; Majzner, R.G. CAR T Cell Therapy for Neuroblastoma. Front. Immunol. 2018, 9. [Google Scholar] [CrossRef] [PubMed]
- D’arrigo, P.; Tufano, M.; Rea, A.; Vigorito, V.; Novizio, N.; Russo, S.; Romano, M.F.; Romano, S. Manipulation of the immune system for cancer defeat: A focus on the T cell inhibitory checkpoint molecules. Curr. Med. Chem. 2018, 25, 1. [Google Scholar]
- Larkin, J.; Chiarion-Sileni, V.; González, R.; Grob, J.; Cowey, C.; Lao, C. Combined Nivolumab and Ipilimumab or Monotherapy in Previously Untreated Melanoma. N. Engl. J. Med. 2015, 373, 23–34. [Google Scholar] [CrossRef] [PubMed]
- Ritprajak, P.; Azuma, M. Intrinsic and extrinsic control of expression of the immunoregulatory molecule PD-L1 in epithelial cells and squamous cell carcinoma Intrinsic and extrinsic control of expression of the immunoregulatory molecule PD-L1 in epithelial cells and squamous cell. ORAL Oncol. 2014, 51, 221–228. [Google Scholar] [CrossRef] [PubMed]
- Massari, F.; Santoni, M.; Ciccarese, C.; Santini, D.; Alfieri, S.; Martignoni, G.; Brunelli, M.; Piva, F.; Berardi, R.; Montironi, R.; et al. PD-1 blockade therapy in renal cell carcinoma: Current studies and future promises. Cancer Treat. Rev. 2015, 41, 114–121. [Google Scholar] [CrossRef] [PubMed]
- Melaiu, O.; Mina, M.; Chierici, M.; Boldrini, R.; Jurman, G.; Romania, P.; D’Alicandro, V.; Benedetti, M.C.; Castellano, A.; Liu, T.; et al. PD-L1 Is a Therapeutic Target of the Bromodomain Inhibitor JQ1 and, Combined with HLA Class I, a Promising Prognostic Biomarker in Neuroblastoma. Clin. Cancer Res. 2017, 23, 4462–4472. [Google Scholar] [CrossRef] [PubMed]
- Brogden, K.A.; Parashar, D.; Hallier, A.R.; Braun, T.; Qian, F.; Rizvi, N.A.; Bossler, A.D.; Milhem, M.M.; Chan, T.A.; Abbasi, T.; et al. Genomics of NSCLC patients both affirm PD-L1 expression and predict their clinical responses to anti-PD-1 immunotherapy. BMC Cancer 2018, 18, 225. [Google Scholar] [CrossRef]
- Miyazaki, M.; Otomo, R.; Matsushima-Hibiya, Y.; Suzuki, H.; Nakajima, A.; Abe, N.; Tomiyama, A.; Ichimura, K.; Matsuda, K.; Watanabe, T.; et al. The p53 activator overcomes resistance to ALK inhibitors by regulating p53-target selectivity in ALK-driven neuroblastomas. Cell Death Discov. 2018, 4, 56. [Google Scholar] [CrossRef] [PubMed]
- Chowdhury, F.; Dunn, S.; Mitchell, S.; Mellows, T.; Ashton-Key, M.; Gray, J.C. PD-L1 and CD8+PD1+ lymphocytes exist as targets in the pediatric tumor microenvironment for immunomodulatory therapy. Oncoimmunology 2015, 4, e1029701. [Google Scholar] [CrossRef]
- Aoki, T.; Hino, M.; Koh, K.; Kyushiki, M.; Kishimoto, H.; Arakawa, Y.; Hanada, R.; Kawashima, H.; Kurihara, J.; Shimojo, N.; et al. Low Frequency of Programmed Death Ligand 1 Expression in Pediatric Cancers. Pediatr. Blood Cancer. 2016, 63, 1461–1464. [Google Scholar] [CrossRef]
- Dondero, A.; Pastorino, F.; Chiesa, M.D.; Corrias, M.V.; Morandi, F.; Pistoia, V.; Olive, D.; Bellora, F.; Locatelli, F.; Castellano, A.; et al. PD-L1 expression in metastatic neuroblastoma as an additional mechanism for limiting immune surveillance. Oncoimmunology 2016, 5, e1064578. [Google Scholar] [CrossRef] [PubMed]
- Ott, P.A.; Hodi, F.S.; Robert, C. CTLA-4 and PD-1/PD-L1 Blockade: New Immunotherapeutic Modalities with Durable Clinical Benefit in Melanoma Patients. Clin. Cancer Res. 2013, 19, 5300–5309. [Google Scholar] [CrossRef] [PubMed]
- Akbay, E.A.; Koyama, S.; Carretero, J.; Altabef, A.; Tchaicha, J.H.; Christensen, C.L.; Mikse, O.R.; Cherniack, A.D.; Beauchamp, E.M.; Pugh, T.J.; et al. Activation of the PD-1 pathway contributes to immune escape in EGFR-driven lung tumors. Cancer Discov. 2013, 3, 1355–1363. [Google Scholar] [CrossRef]
- Srinivasan, P.; Wu, X.; Basu, M.; Rossi, C.; Sandler, A.D. PD-L1 checkpoint inhibition and anti-CTLA-4 whole tumor cell vaccination counter adaptive immune resistance: A mouse neuroblastoma model that mimics human disease. PLoS Med. 2018, 15, e1002497. [Google Scholar] [CrossRef]
- Azuaje, F. Computational models for predicting drug responses in cancer research. Brief. Bioinform. 2017, 18, 820–829. [Google Scholar] [CrossRef]
- Mammana, S.; Fagone, P.; Cavalli, E.; Basile, M.S.; Petralia, M.C.; Nicoletti, F.; Bramanti, P.; Mazzon, E. The Role of Macrophages in Neuroinflammatory and Neurodegenerative Pathways of Alzheimer’s Disease, Amyotrophic Lateral Sclerosis, and Multiple Sclerosis: Pathogenetic Cellular Effectors and Potential Therapeutic Targets. Int. J. Mol. Sci. 2018, 19, 831. [Google Scholar] [CrossRef] [PubMed]
- Mangano, K.; Mazzon, E.; Basile, M.S.; Di Marco, R.; Bramanti, P.; Mammana, S.; Petralia, M.C.; Fagone, P.; Nicoletti, F. Pathogenic role for macrophage migration inhibitory factor in glioblastoma and its targeting with specific inhibitors as novel tailored therapeutic approach. Oncotarget 2018, 9, 17951–17970. [Google Scholar] [CrossRef] [PubMed]
- Fagone, P.; Mazzon, E.; Cavalli, E.; Bramanti, A.; Petralia, M.C.; Mangano, K.; Al-Abed, Y.; Bramati, P.; Nicoletti, F. Contribution of the macrophage migration inhibitory factor superfamily of cytokines in the pathogenesis of preclinical and human multiple sclerosis: In silico and in vivo evidences. J. Neuroimmunol. 2018, 322, 46–56. [Google Scholar] [CrossRef] [PubMed]
- Mangano, K.; Cavalli, E.; Mammana, S.; Basile, M.S.; Caltabiano, R.; Pesce, A.; Puleo, S.; Atanasov, A.G.; Magro, G.; Nicoletti, F.; et al. Involvement of the Nrf2/HO-1/CO axis and therapeutic intervention with the CO-releasing molecule CORM-A1, in a murine model of autoimmune hepatitis. J. Cell. Physiol. 2018, 233, 4156–4165. [Google Scholar] [CrossRef] [PubMed]
- Mammana, S.; Bramanti, P.; Mazzon, E.; Cavalli, E.; Basile, M.S.; Fagone, P.; Petralia, M.C.; McCubrey, J.A.; Nicoletti, F.; Mangano, K. Preclinical evaluation of the PI3K/Akt/mTOR pathway in animal models of multiple sclerosis. Oncotarget 2018, 9, 8263–8277. [Google Scholar] [CrossRef] [PubMed]
- Fagone, P.; Muthumani, K.; Mangano, K.; Magro, G.G.; Meroni, P.L.; Kim, J.J.; Sardesai, N.Y.; Weiner, D.B.; Nicoletti, F. VGX-1027 modulates genes involved in lipopolysaccharide-induced Toll-like receptor 4 activation and in a murine model of systemic lupus erythematosus. Immunology 2014, 142, 594–602. [Google Scholar] [CrossRef]
- Fagone, P.; Mazzon, E.; Mammana, S.; Di Marco, R.; Spinasanta, F.; Basile, M.S.; Petralia, M.C.; Bramanti, P.; Nicoletti, F.; Mangano, K. Identification of CD4+ T cell biomarkers for predicting the response of patients with relapsing-remitting multiple sclerosis to natalizumab treatment. Mol. Med. Rep. 2019, 20, 678–684. [Google Scholar] [CrossRef]
- Nicoletti, F.; Mazzon, E.; Fagone, P.; Mangano, K.; Mammana, S.; Cavalli, E.; Basile, M.S.; Bramanti, P.; Scalabrino, G.; Lange, A.; et al. Prevention of clinical and histological signs of MOG-induced experimental allergic encephalomyelitis by prolonged treatment with recombinant human EGF. J. Neuroimmunol. 2019, 332, 224–232. [Google Scholar] [CrossRef]
- Presti, M.; Mazzon, E.; Basile, M.S.; Petralia, M.C.; Bramanti, A.; Colletti, G.; Bramanti, P.; Nicoletti, F.; Fagone, P. Overexpression of macrophage migration inhibitory factor and functionally-related genes, D-DT, CD74, CD44, CXCR2 and CXCR4, in glioblastoma. Oncol. Lett. 2018, 16, 2881–2886. [Google Scholar] [CrossRef]
- Fagone, P.; Caltabiano, R.; Russo, A.; Lupo, G.; Anfuso, C.D.; Basile, M.S.; Longo, A.; Nicoletti, F.; De Pasquale, R.; Libra, M.; et al. Identification of novel chemotherapeutic strategies for metastatic uveal melanoma. Sci. Rep. 2017, 7, 44564. [Google Scholar] [CrossRef]
- Basile, M.S.; Mazzon, E.; Russo, A.; Mammana, S.; Longo, A.; Bonfiglio, V.; Fallico, M.; Caltabiano, R.; Fagone, P.; Nicoletti, F.; et al. Differential modulation and prognostic values of immune-escape genes in uveal melanoma. PLoS ONE 2019, 14, e0210276. [Google Scholar] [CrossRef] [PubMed]
- Petralia, M.C.; Mazzon, E.; Fagone, P.; Russo, A.; Longo, A.; Avitabile, T.; Nicoletti, F.; Reibaldi, M.; Basile, M.S. Characterization of the Pathophysiological Role of CD47 in Uveal Melanoma. Molecules 2019, 24, 2450. [Google Scholar] [CrossRef] [PubMed]
- Candido, S.; Lupo, G.; Pennisi, M.; Basile, M.S.; Anfuso, C.D.; Petralia, M.C.; Gattuso, G.; Vivarelli, S.; Spandidos, D.A.; Libra, M.; et al. The analysis of miRNA expression profiling datasets reveals inverse microRNA patterns in glioblastoma and Alzheimer’s disease. Oncol. Rep. 2019, 42, 911–922. [Google Scholar] [CrossRef] [PubMed]
- Fagone, P.; Mangano, K.; Mammana, S.; Pesce, A.; Pesce, A.; Caltabiano, R.; Giorlandino, A.; Portale, T.R.; Cavalli, E.; Lombardo, G.A.; et al. Identification of novel targets for the diagnosis and treatment of liver fibrosis. Int. J. Mol. Med. 2015, 36, 747–752. [Google Scholar] [CrossRef] [PubMed]
- Fagone, P.; Nunnari, G.; Lazzara, F.; Longo, A.; Cambria, D.; Distefano, G.; Palumbo, M.; Nicoletti, F.; Malaguarnera, L.; Di Rosa, M. Induction of OAS gene family in HIV monocyte infected patients with high and low viral load. Antivir. Res. 2016, 131, 66–73. [Google Scholar] [CrossRef] [PubMed]
- Petralia, M.C.; Mazzon, E.; Fagone, P.; Falzone, L.; Bramanti, P.; Nicoletti, F.; Basile, M.S. Retrospective follow-up analysis of the transcriptomic patterns of cytokines, cytokine receptors and chemokines at preconception and during pregnancy, in women with post-partum depression. Exp. Ther. Med. 2019, 18, 2055–2062. [Google Scholar] [CrossRef] [PubMed]
- Lombardo, S.D.; Mazzon, E.; Basile, M.S.; Cavalli, E.; Bramanti, P.; Nania, R.; Fagone, P.; Nicoletti, F.; Petralia, M.C. Upregulation of IL-1 Receptor Antagonist in a Mouse Model of Migraine. Brain Sci. 2019, 9, 172. [Google Scholar] [CrossRef]
- Arkin, A.P.; Schaffer, D.V. Network News: Innovations in 21st Century Systems Biology. Cell 2011, 144, 844–849. [Google Scholar] [CrossRef]
- Kitano, H. Systems Biology: A Brief Overview. Science 2002, 295, 1662–1664. [Google Scholar] [CrossRef]
- Speleman, F.; De Preter, K.; Vandesompele, J. Neuroblastoma genetics and phenotype: A tale of heterogeneity. Semin. Cancer Boil. 2011, 21, 238–244. [Google Scholar] [CrossRef]
- Diskin, S.J.; Capasso, M.; Schnepp, R.W.; A Cole, K.; Attiyeh, E.F.; Hou, C.; Diamond, M.; Carpenter, E.L.; Winter, C.; Lee, H.; et al. Common variation at 6q16 within HACE1 and LIN28B influences susceptibility to neuroblastoma. Nat. Genet. 2012, 44, 1126–1130. [Google Scholar] [CrossRef] [PubMed]
- Sausen, M.; Leary, R.J.; Jones, S.; Wu, J.; Reynolds, C.P.; Liu, X.; Blackford, A.; Parmigiani, G.; Diaz, L.A.; Papadopoulos, N.; et al. Integrated genomic analyses identify ARID1A and ARID1B alterations in the childhood cancer neuroblastoma. Nat. Genet. 2013, 45, 12–17. [Google Scholar] [CrossRef] [PubMed]


© 2019 by the authors. Licensee MDPI, Basel, Switzerland. This article is an open access article distributed under the terms and conditions of the Creative Commons Attribution (CC BY) license (http://creativecommons.org/licenses/by/4.0/).
Share and Cite
Lombardo, S.D.; Presti, M.; Mangano, K.; Petralia, M.C.; Basile, M.S.; Libra, M.; Candido, S.; Fagone, P.; Mazzon, E.; Nicoletti, F.; et al. Prediction of PD-L1 Expression in Neuroblastoma via Computational Modeling. Brain Sci. 2019, 9, 221. https://doi.org/10.3390/brainsci9090221
Lombardo SD, Presti M, Mangano K, Petralia MC, Basile MS, Libra M, Candido S, Fagone P, Mazzon E, Nicoletti F, et al. Prediction of PD-L1 Expression in Neuroblastoma via Computational Modeling. Brain Sciences. 2019; 9(9):221. https://doi.org/10.3390/brainsci9090221
Chicago/Turabian StyleLombardo, Salvo Danilo, Mario Presti, Katia Mangano, Maria Cristina Petralia, Maria Sofia Basile, Massimo Libra, Saverio Candido, Paolo Fagone, Emanuela Mazzon, Ferdinando Nicoletti, and et al. 2019. "Prediction of PD-L1 Expression in Neuroblastoma via Computational Modeling" Brain Sciences 9, no. 9: 221. https://doi.org/10.3390/brainsci9090221
APA StyleLombardo, S. D., Presti, M., Mangano, K., Petralia, M. C., Basile, M. S., Libra, M., Candido, S., Fagone, P., Mazzon, E., Nicoletti, F., & Bramanti, A. (2019). Prediction of PD-L1 Expression in Neuroblastoma via Computational Modeling. Brain Sciences, 9(9), 221. https://doi.org/10.3390/brainsci9090221