Article

Anoctamin 3: A Possible Link between Cluster Headache and Ca2+ Signaling

1
Department of Neuroscience, Karolinska Institutet, Biomedicum D7, Solnavägen 9, 171 65 Stockholm, Sweden
2
Department of Clinical Neuroscience, Karolinska University Hospital, Tomtebodavägen 18A, 171 77 Stockholm, Sweden
3
Division of Neurology, Karolinska University Hospital, Eugeniavägen 3, 171 76 Solna, Sweden
*
Author to whom correspondence should be addressed.
Brain Sci. 2019, 9(8), 184; https://doi.org/10.3390/brainsci9080184
Submission received: 9 July 2019 / Revised: 24 July 2019 / Accepted: 29 July 2019 / Published: 30 July 2019
(This article belongs to the Special Issue Recent Advances and New Insights in Cluster Headache)

Abstract

:
Cluster headache is a severe primary headache characterized by extremely painful attacks of unilateral headache. Verapamil is commonly used as a prophylactic treatment with good effect. In order to search for new pathways involved in the pathophysiology of cluster headache, we analyzed genetic variants that were previously linked to verapamil response in migraine in a Swedish cluster headache case-control sample. We used TaqMan qPCR for genetic screening and performed a gene expression analysis on associated genes in patient-derived fibroblasts, and further investigated which reference genes were suitable for analysis in fibroblasts from cluster headache patients. We discovered a significant association between anoctamin 3, a gene encoding a calcium-activated ion channel, and cluster headache. The association was not dependent on verapamil treatment since the associated variant, rs1531394, was also overrepresented in patients not using verapamil. No difference was found in the anoctamin 3 gene expression between controls and patients. Also, we determined that TBP, IPO8 and PDHB were suitable reference genes in cluster headache fibroblasts. This finding is the first report of an association between a variant in a gene encoding an ion-channel and cluster headache, and the first significant genetic evidence of calcium involvement in cluster headache pathophysiology.

1. Introduction

Cluster headache (CH) is a trigeminal autonomic cephalalgia; patients typically suffer from recurrent unilateral headaches of extremely severe pain, accompanied by unilateral autonomic symptoms and restlessness [1]. The most characteristic feature of CH is the intensity of the pain, which is reported to be unparalleled by any other human disorder or physiological condition [2]. The symptoms occur in active periods, followed by asymptomatic remission periods in episodic patients. In contrast, around 15% of the patients are classified as chronic and have no, or very short, remission periods [1]. Another striking singularity of CH is that two thirds of the patients report that their attacks appear with a circadian pattern [3,4]. In particular, the headaches tend to occur at night when the patient is asleep. Around 1 in 1000 individuals are estimated to suffer from CH globally, and there is a clear male predominance [5]. CH pathophysiology is only partly understood, but probably involves both central and peripheral parts of the nervous system. There is evidence of activation of the trigeminal nerve by calcitonin gene-related peptide (CGRP) release [6,7]. This probably entrains the activation of the trigeminal autonomic reflex responsible for the autonomic symptoms experienced during an attack [1]. The hypothalamus is also reported to be activated during a CH attack, a possible explanation for the rhythmic pattern with which the symptoms occur during active periods [8,9]. The cause of CH is currently unknown, but several studies suggest that genetic factors contribute to the risk of developing the disorder [10]. Genetic associations with CH have today been reported for several candidate genes [11,12,13,14,15,16]. The two most extensively studied genes in relation to CH are clock circadian regulator (CLOCK) and hypocretin receptor 2 (HCRTR2) which are both linked to diurnal rhythm and sleep; however, results are not consistent between studies [17,18,19,20,21]. As yet, there has only been one small study reported using a genome wide association approach. Three new loci were identified, whereof pituitary adenylate cyclase-activating polypeptide (PACAP) type 1 receptor can be considered of particular interest [22,23]. None of the reported loci were replicated in an independent sample [24].
Around half of the CH patients in our Swedish biobank use prophylactic treatment (51%) during active cluster periods, and the most commonly used preventive drug is verapamil (34%) [4]. Verapamil is an L-type calcium (Ca2+) channel antagonist, which inhibits the influx of Ca2+ and therefore affects muscle contraction. Due to its potent vasodilating properties and its effect on contractility and conduction of the myocardium, verapamil is primarily used to treat cardiovascular disorders, such as hypertension, angina and tachycardia, but is also used as a preventive treatment for CH, and to some extent for migraine [25,26,27].
The mechanism of action for verapamil in headache prevention is yet to be elucidated. By comparison to cardiovascular disease, there is a striking difference in effective dosage, specifically for CH patients [25], which might be indicative of a different mode of action or target. Verapamil is not a selective antagonist for L-type Ca2+ channels, which is the primary target for its cardiovascular usage. In addition, verapamil also binds to T-type Ca2+ channels [28,29]. Results from rodent in vitro experiments further suggest that N-type as well as P/Q-type Ca2+ channels might be a target for verapamil [30]. All of these channels are present in nervous tissue, and thus constitute potential targets for a neural mechanism of action of verapamil in CH, as well as a vascular mechanism. Experiments on rodents indicate that verapamil has an analgesic effect on certain types of pain-stimuli [31]. Moreover, verapamil has been shown to block potassium channels in vitro [32,33,34]; e.g., hERG (the human Ether-à-go-go-Related Gene) channels present in peripheral tissue, as well as in the central nervous system [35], and TRESK (TWIK-related spinal cord potassium) channels, which are linked to excitability and pain signaling of trigeminal neurons [36]. The potassium channel subfamily K member 18 (KCNK18), which encodes TRESK has been suggested as a candidate gene for migraine [37]. Interestingly, verapamil is a substrate of the P-glycoprotein transporter, a major drug efflux transporter in the blood brain barrier, and therefore verapamil has low bioavailability in the brain [38,39]. Verapamil also inhibits the P-glycoprotein transporter at higher concentrations [40,41,42]. Hitherto, there are no indications that the relatively high doses of verapamil needed for CH prevention, commonly 240–720 mg per day and sometimes higher [25], are sufficiently elevated to inhibit P-glycoprotein transporters, thereby reducing the outward transport of verapamil at the blood brain barrier. Still, these molecular interactions might provide some explanation for the high doses necessary for prophylactic treatment in CH, and a possibility of a central mechanism of action for verapamil in CH prevention.
In a study aiming to correlate genetics to a good response to verapamil in migraine patients, eight genetic variants in seven genes were found to be associated with verapamil-responsive migraine, measured as a reduction in migraine days after three months of verapamil treatment [43]. These seven genes were implicated in a variety of cellular functions, and further studies of their importance to verapamil treatment might increase the understanding of the mechanism of action for verapamil treatment in migraine. Since the effect of verapamil treatment on CH is superior to the effect on migraine, we decided to investigate these markers as potential genetic risk- or protective factors for CH. Based on the strength of association to a successful verapamil treatment of migraine [43], and a potential role for the corresponding gene in CH pathophysiology, we selected four markers in four different genes; rs17844444 in protocadherin β6 (PCDHB6), rs10882386 in phospholipase C ε1 (PLCE1), rs1531394 in anoctamin 3 (ANO3), and rs2230433 in α subunit of integrin lymphocyte function associated antigen-1 (ITGAL). All of these genes have an indirect connection to Ca2+ or Ca2+ signaling, which is compelling in view of the effect of verapamil on Ca2+ influx. For this study we used biological tissue from patients and controls in our extensive Swedish CH biobank, which has been thoroughly characterized previously [4].

2. Materials and Methods

2.1. Patients and Controls

The case-control material consisted of 628 CH patients and 586 controls (Table 1). Informed consent was obtained from all participants. Experiments were approved by the Regional Ethical Review Board in Stockholm, Sweden (diary number 2014/656-31/4) and carried out according to the rules of the Declaration of Helsinki. Patients were asked to provide personal and clinical information through a questionnaire. CH diagnosis, according to the criteria of the International Classification of Headache Disorders, second edition (ICHD-II) [44], was confirmed by a neurologist. Demographic details for the selection of patients analyzed here are presented in Table 1. Anonymous healthy blood donors were included as control subjects. Genomic DNA was isolated from blood samples according to standard protocols using the Gentra Puregene Blood Kit (QIAGEN, Hilden, Germany). The DNA was quantified and assessed for purity by spectrophotometry with a NanoDropTM system (Thermo Fisher Scientific, Waltham, MA, USA).

2.2. Genotyping

DNA samples from patients and controls were genotyped for four single nucleotide polymorphisms (SNPs), rs17844444, rs10882386, rs1531394, and rs2230433; detailed information on the SNPs can be found in Table 2. SNP genotypes were determined by TaqMan® quantitative real-time PCR (qPCR) on a 7500 Fast instrument (Applied Biosystems, Foster City, CA, USA). The cycling conditions were as follows: 60 °C for 1 min, 95 °C for 10 min, 45–55 cycles at 95 °C followed by 1 min at 60 °C. We used TaqMan® Genotyping Master Mix and commercially available TaqMan® SNP genotyping assays (Applied Biosystems); see Table 2. All four assays had a call rate higher than 98%.

2.3. Establishment of Fibroblast Cell Lines

A superficial skin biopsy around 2 × 5 mm in size was taken on the inside of the arm at the site of musculus biceps brachii. The procedure was performed under local anesthesia after informed consent. Tissue was cut into smaller pieces and put in culture in a 35-mm Petri dish (Corning, New York, NY, USA) under a coverslip according to the protocol described by Takashima et al. [45]. After a few weeks in a humidified 37 °C, 5% CO2 incubator, fibroblasts started to grow along the edges of the tissue; during this time medium was changed 2–3 times per week (DMEM GlutaMAXTM medium with 25 mM D-Glucose and 1 mM sodium pyruvate, supplemented with 13% fetal bovine serum (FBS), 10 mM HEPES and 1% antibiotic-antimycotic (10,000 U/mL penicillin, 10,000 mg/mL streptomycin, and 25 mg/mL amphotericin B), (Invitrogen, Carlsbad, CA, USA)). When cells were confluent, they were transferred to 25-cm2 tissue flasks, passaged once to 75-cm2 flasks, and then stored at −150 °C in FBS with 10% DMSO (Sigma-Aldrich, St. Louis, MO, United States).

2.4. cDNA Preparation

We used primary fibroblast cell lines established from 12 CH patients and 9 control subjects for gene expression analysis. Prior to harvesting, the cells were passaged one time, cultured in 75-cm2 flasks until 80% confluency, then starved for 24 h and subjected to a serum shock according to a protocol from Johansson et al., in order to reset the circadian clock [46]. Cells were harvested 6 h after serum shock, and cell pellets were frozen at −150 °C until further use. We used RNeasy Mini Kit (QIAGEN) to obtain RNA from frozen cell pellets according to the manufacturer’s instructions. After RNA quantification using a NanoDropTM system (Thermo Fisher Scientific), cDNA was prepared from 1 µg of RNA template using the QuantiTect Reverse Transcription Kit (QIAGEN), also according to the provided protocol.

2.5. Reverse Transcription qPCR (qRT-PCR)

Primers (Thermo Scientific) were designed with Primer3 software [47,48], verified with Mfold [49], and NCBI nucleotide blast (https://blast.ncbi.nlm.nih.gov/Blast.cgi) tools, for primer sequences refer to Table 3. qRT-PCR was performed on a 7500 Fast instrument (Applied Biosystems), using a standard program for relative quantification: 50 cycles of denaturation at 95 °C for 15 s and annealing/extension at 60 °C for 1 min, terminated by a melting curve.
In order to select a suitable reference gene for gene expression normalization in human primary fibroblasts from CH patients, we first assessed the expression of five reference genes: GAPDH, IPO8, PPIA, PDHB and TBP in 12 CH patients and 8 controls. qRT-PCR was performed with Power SYBR® Green PCR Master Mix (Thermo Fisher Scientific), 200 ng cDNA and 0.3 µM of each primer in each reaction. For the relative quantification of ANO3 mRNA, we used 300 ng cDNA from 11 CH patients and 9 controls, Power SYBR® Green PCR Master Mix, and 0.5 µM primers for target gene ANO3, with reference genes IPO8 and TBP.

2.6. Statistical Analysis

Power calculation was performed using the PS Power and Sample Size Calculator v3.0 [50], and was based on minor allele frequencies (MAF) reported for European populations in the NCBI dbSNP database (https://www.ncbi.nlm.nih.gov/projects/SNP/). Using our sample size and an MAF of 0.15, an association with an odds ratio (OR) <0.61 or >1.53 would be detected with 80% power, and with a MAF of 0.3 the corresponding OR would be <0.69 or >1.41. Genotypes were determined using the 7500 software v2.3 provided with the 7500 Fast instrument (Applied Biosystems). Genetic association was analyzed using a two-tailed chi-squared (χ2) test or a Fisher’s exact test in GraphPad Prism v5.04 (GraphPad Softwares Inc, La Jolla, CA, USA). We used the Šidák correction for multiple testing, adjusting the threshold for significance to αSID = 0.013. The Hardy-Weinberg equilibrium (HWE) was assessed in both patients and controls using the OEGE HWE calculator [51]. Control individuals were in HWE for all four SNPs, but CH patients exceeded the threshold for HWE χ2 > 3.84 (p = 0.05), for rs1744444—χ2 = 5.86, and rs1531394—χ2 = 9.59. The other two SNPs, rs10882386 and rs2230433, were in HWE in CH patients as well.
In silico analysis of associated SNPs was performed with online computational tools—Mfold and SNP2TFBS [49,52].
Reference genes were statistically analyzed using GraphPad Prism v5.04, verifying means and variances, and further compared using Normfinder and geNorm [53,54]. TBP and IPO8 were determined to be the most stable reference genes for CH in fibroblasts.
ANO3 mRNA levels were normalized to IPO8 and TBP and to one randomly selected control sample in the 7500 software v2.3 provided with the 7500 Fast instrument. One patient was removed from the analysis due to high variability between technical replicates. Data was analyzed with Grubb’s test to exclude outliers (Z > 2.4, significance level 0.05); none were identified. We performed a log2-transformation, due to non-normal distribution according to the D’Agostino and Pearson omnibus normality test, and thereafter analyzed the data with Student’s t-test, one-way ANOVA, and linear regression; significance level was set to 0.05, and two-tailed p-values were used.

3. Results

3.1. Genetic Analysis

586 control subjects and 628 individuals with CH from a Swedish biobank were genotyped for four different markers (Table 2) which are suggested to be linked to response to verapamil in migraine. Genotype and allele frequencies for these markers and the results of the analysis are presented in Table 4. One of the variants, rs1531394, located in ANO3, was discovered to be more common amongst CH patients. In particular, individuals carrying two copies of the minor allele were clearly overrepresented in the CH group: 19.45% as compared to 13.75% in controls; this difference was significant (p = 0.0097) (Table 4). Further analysis showed that the effect was strongest under a recessive model with an OR of 1.52, resulting in p = 0.0086 (Table 5). Statistical analysis also revealed that rs1531394 was not in HWE in patients. In contrast to the ANO3 variant, the wild type genotype GG of rs2230433 in ITGAL seemed to be more common in the CH patients, suggesting a protective effect of the minor allele (Table 4). Statistical analysis of the data showed only a trend for association between the C allele and CH (p = 0.066), and the genotype analysis showed no significance. However, a secondary analysis under a dominant model confirmed the trend for a protective association between rs2230433 and CH; OR 0.79, 95% confidence interval (CI) 0.63–0.99, p = 0.043 (data not shown). The other two genetic variants, rs17844444 and rs10882386, were equally distributed in the patient and control groups.
About one third of the CH patients (30.4% = 191 individuals) used verapamil as a prophylactic treatment for CH. We performed a stratified analysis under a recessive model, comparing patients using verapamil and those not using verapamil separately with controls. We found an association between rs1531394 and CH in both groups together and separately (Table 5). The risk genotype AA was slightly more common in the subgroup of patients using verapamil compared to non-users: 20.94% vs. 18.81%.
In silico analysis using the Mfold software to analyze the folding of a segment of mRNA (140 bp) surrounding the disease-associated SNP revealed that an mRNA transcript with the minor allele (A) adapts slightly different secondary structures than the wild type fragment (Figure A1). There was a 5.5% increase of Gibbs energy required to fold the minor allele-containing fragment, as compared to the wild type. As the rs1531394 variant is located in the 5′UTR of the sequence (Table 2); it can potentially affect interactions with transcription factors and other binding proteins. We analyzed the SNP for overlap with transcription factor binding sites using the SNP2TFBS online computational tool and found that rs1531394 potentially affects binding of transcription factor RFX2, which was predicted to bind to the ANO3 promoter. The position weight matrix (PMW) score was lower for the minor A allele than the T allele, indicating that the sequence with the wild type allele has a better match with the transcription factor binding motif than the disease-associated allele.

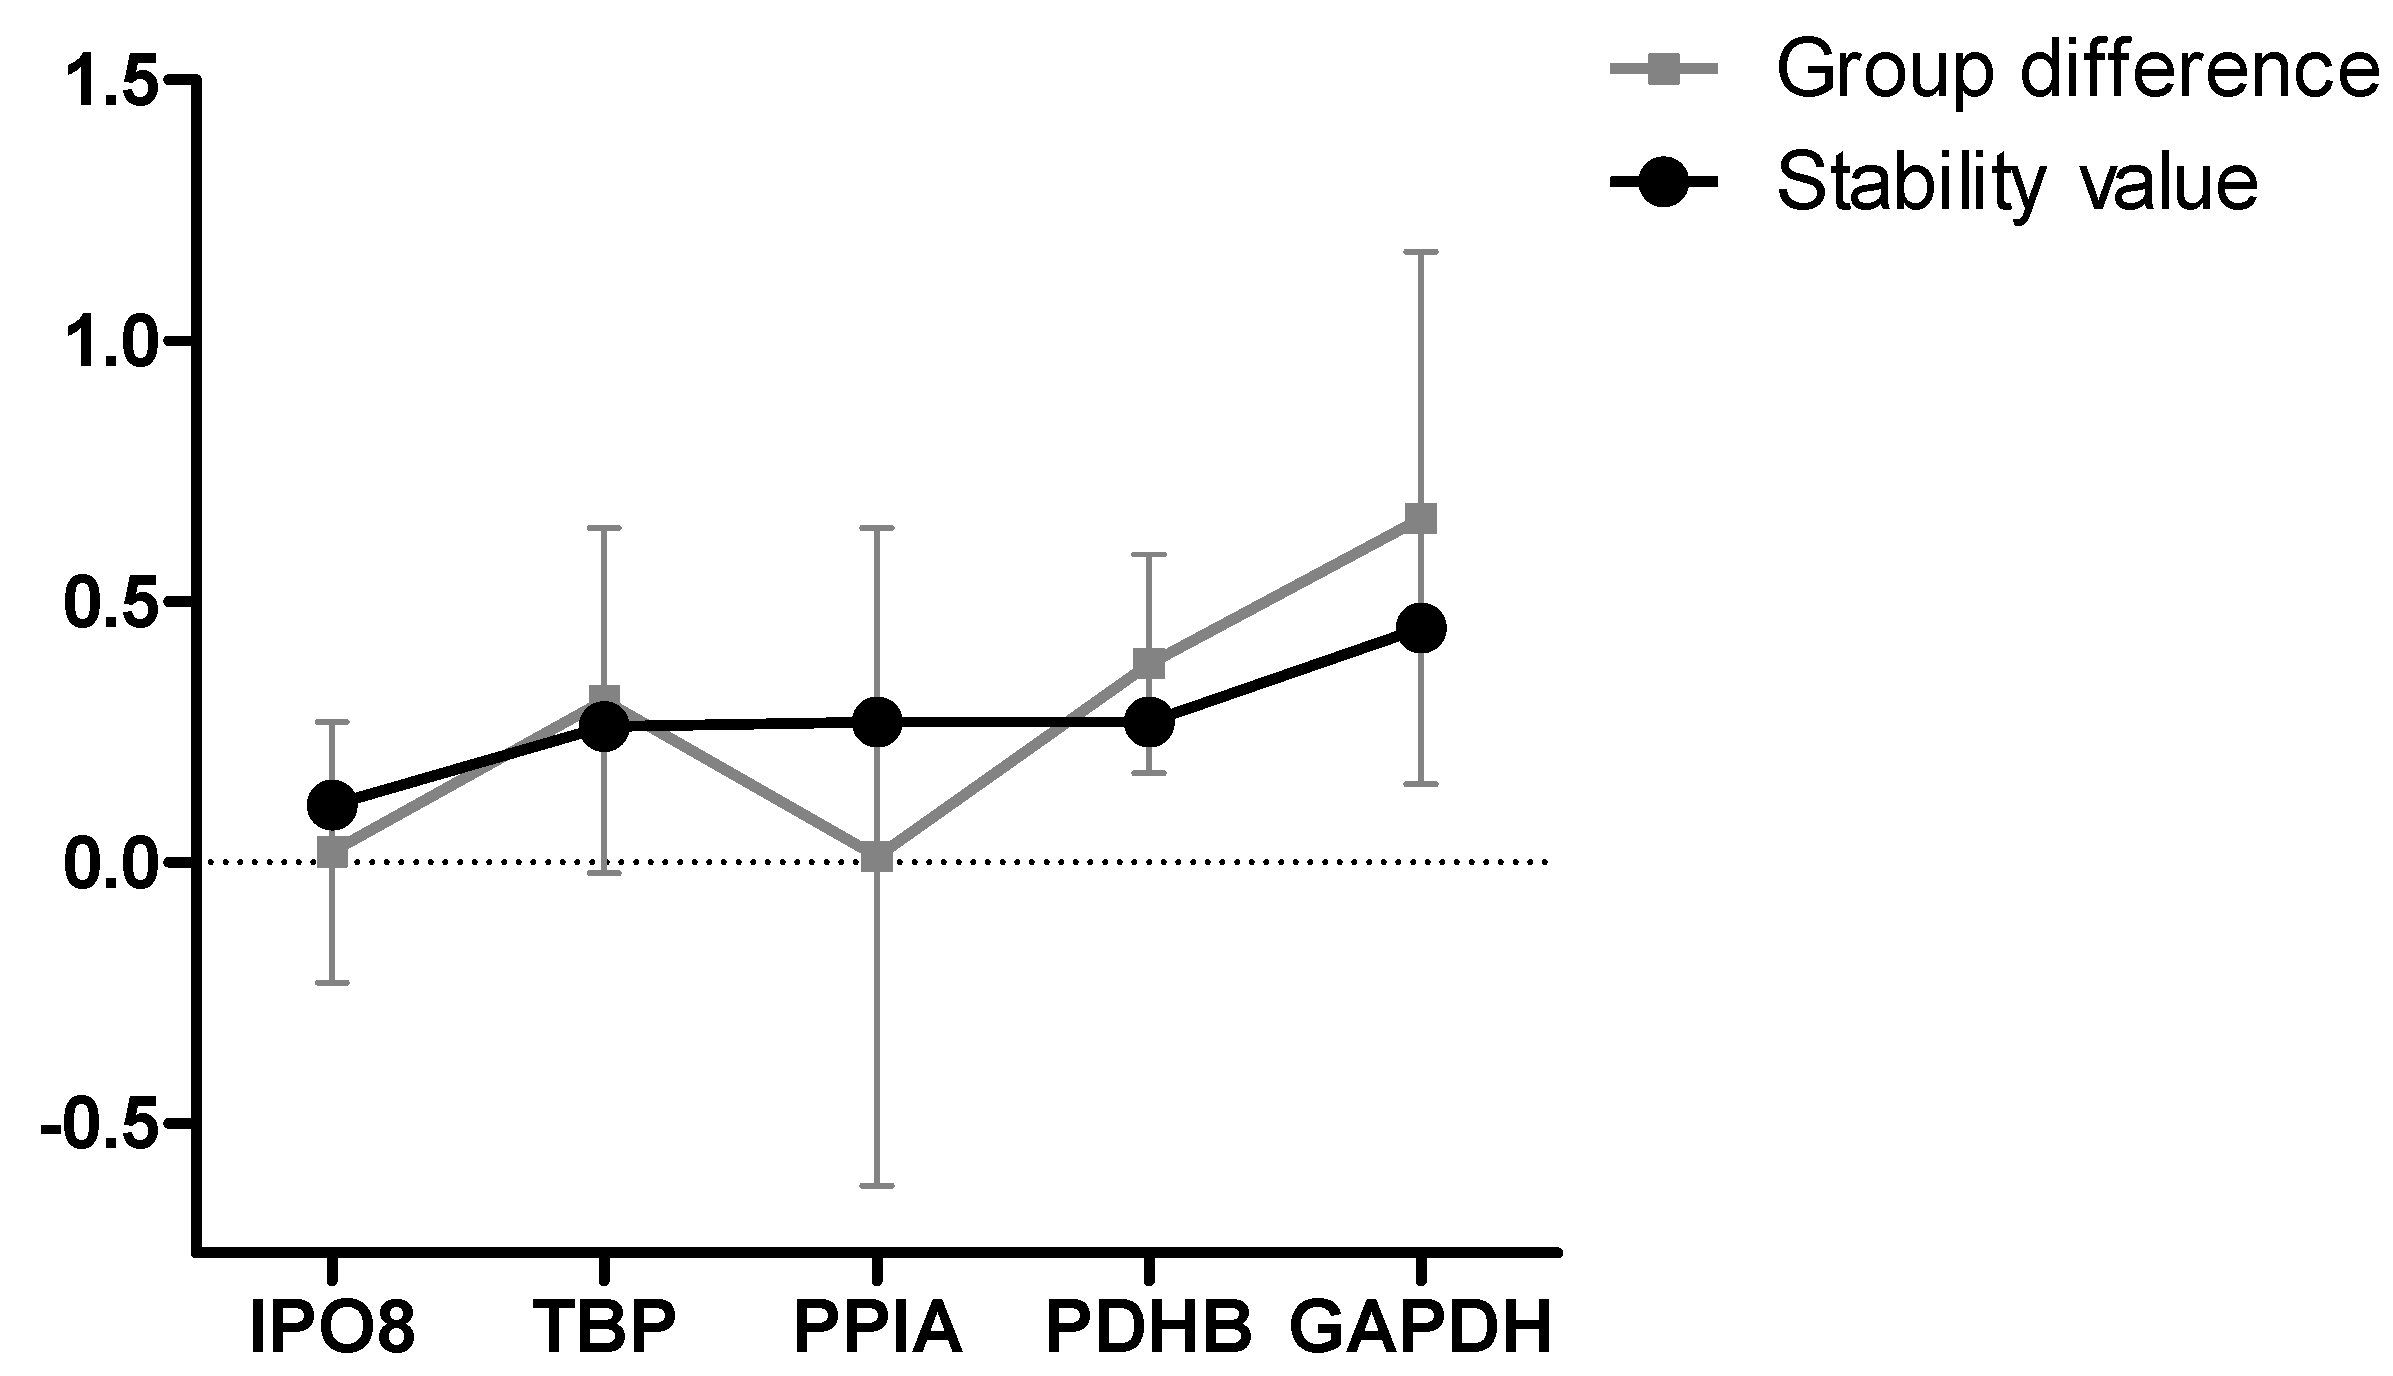
3.2. Formal Selection of Reference Genes for Studying CH in Fibroblasts

We performed an initial experiment to determine which reference genes were best suited to assess gene expression in primary fibroblast cell lines from CH patients. Five established reference genes were selected for the trial: GAPDH, IPO8, PPIA, PDHB, and TBP. Data was first analyzed to assess that means and variances did not differ between cases and controls; this was true for all genes except GAPDH, which was more abundant in patients (t = 2.333, p = 0.0315). Reference genes were then ranked using two different programs, which both showed that TBP and IPO8 were the most stable genes in our experimental setting. In Figure 1, reference genes are ranked with Normfinder based on their intergroup variability (stability) and their intragroup variability (difference between cases and controls). Results from the geNorm analysis, which uses a different algorithm to assess stability, differed slightly from Normfinder by ranking PDHB as more stable than PPIA (data not shown) [53,54].

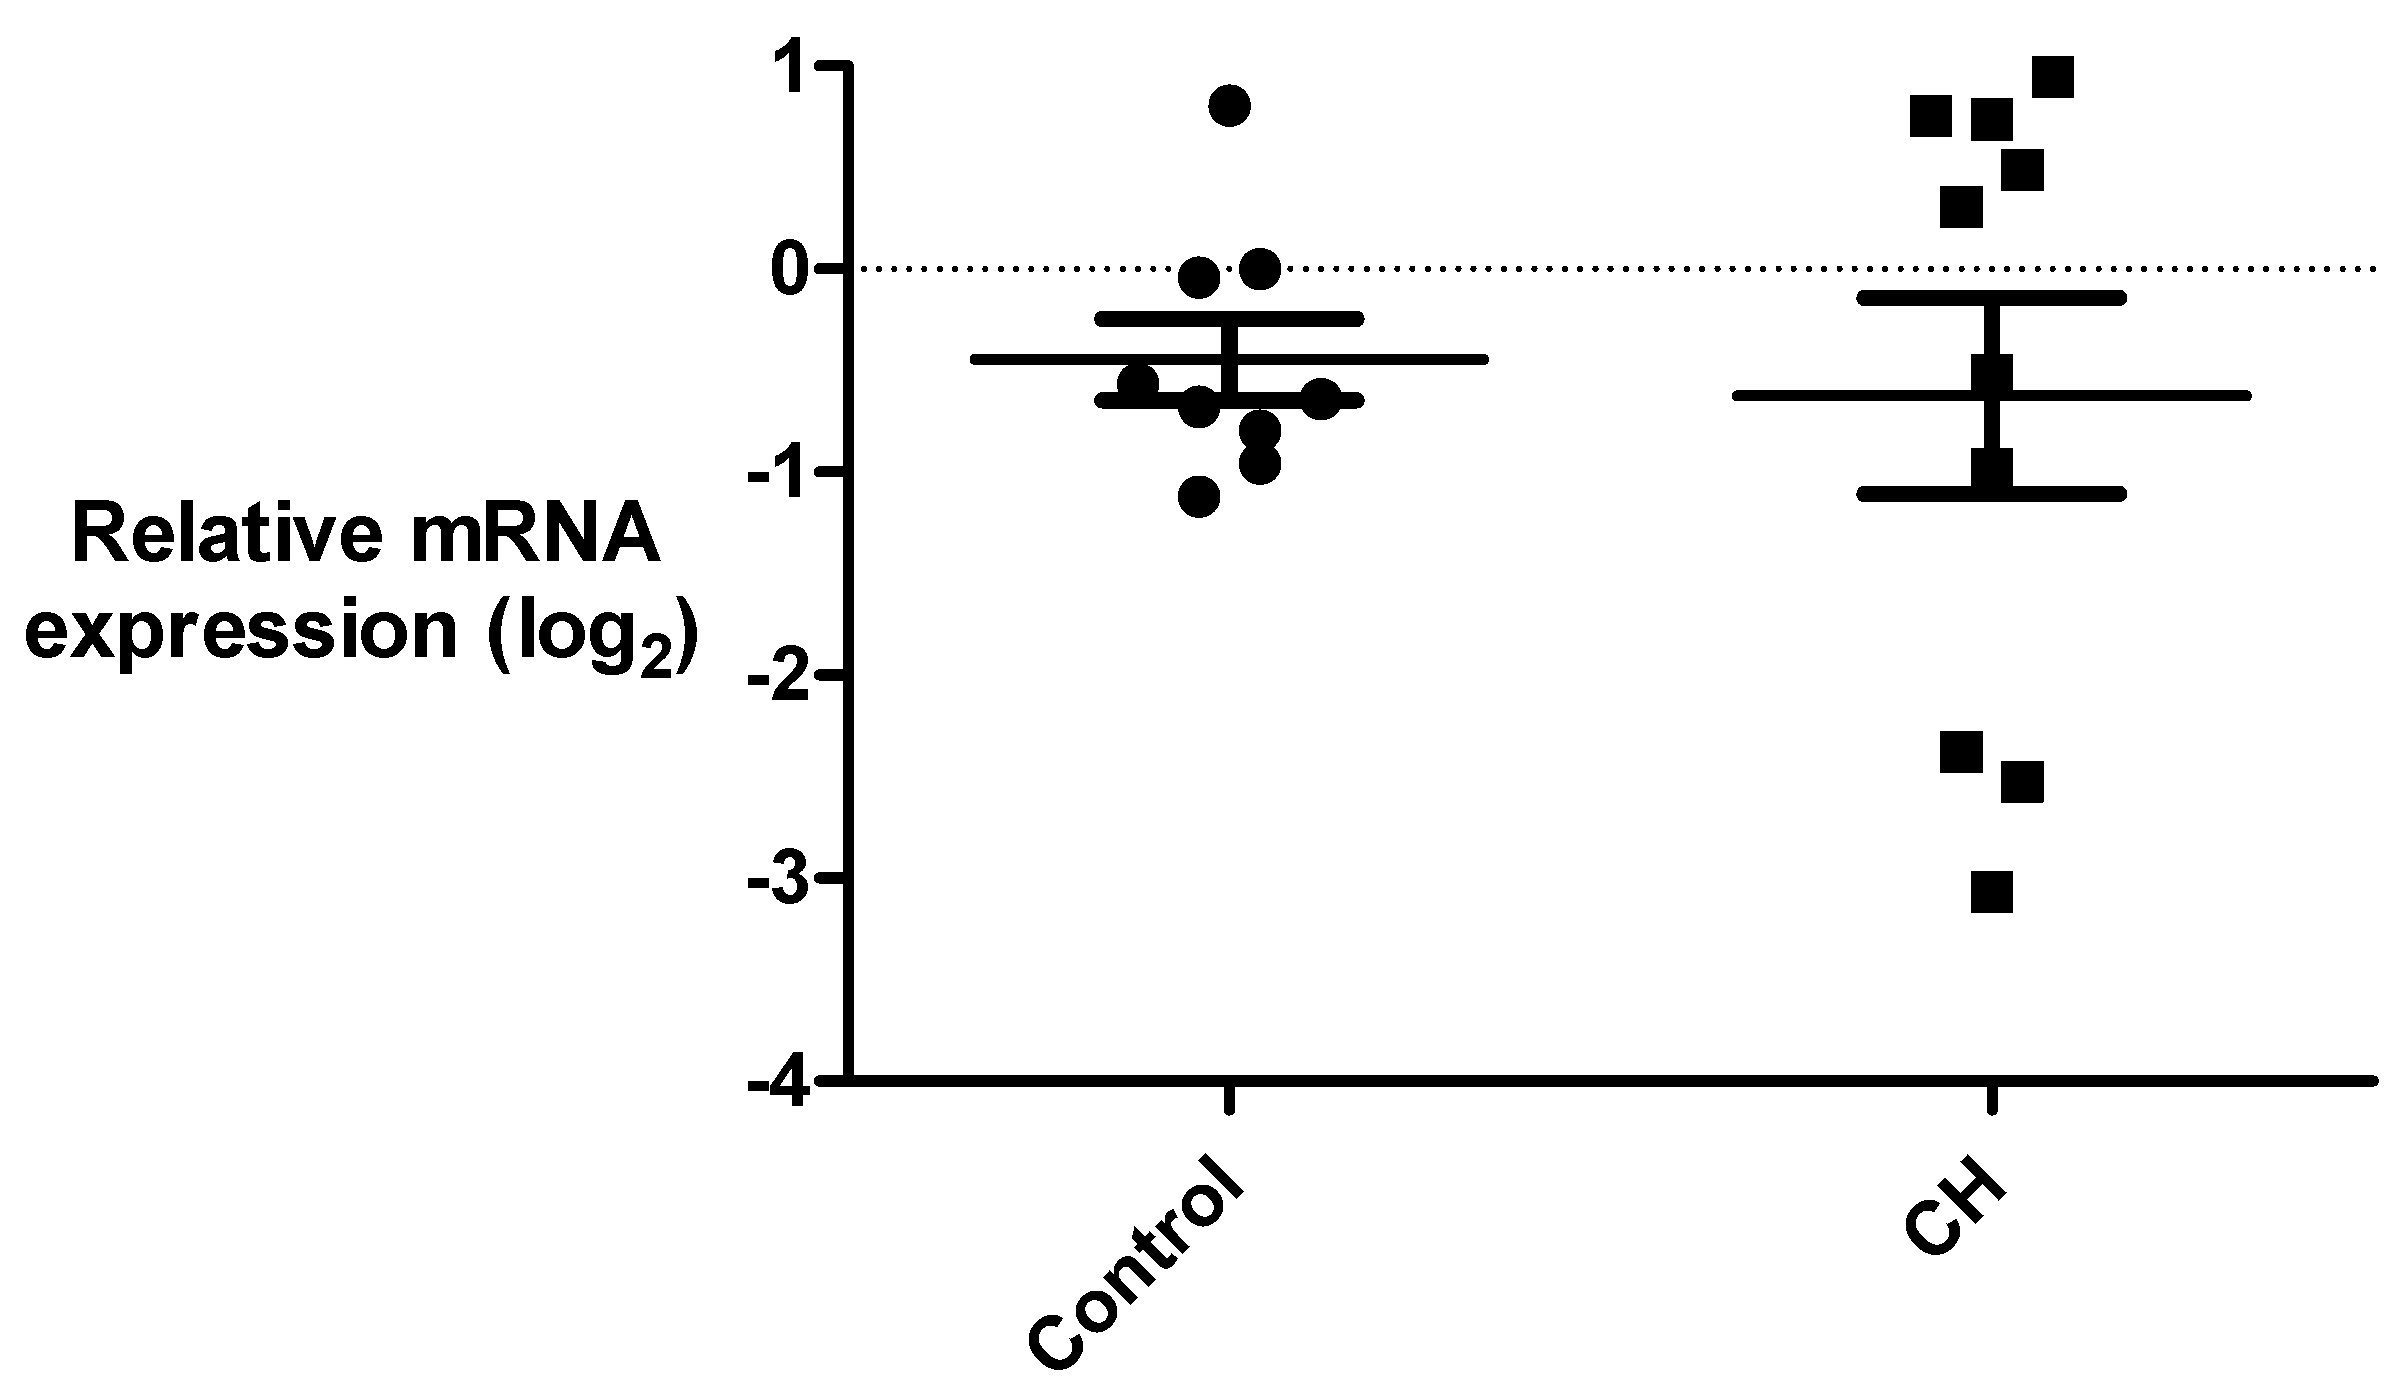
3.3. Gene Expression Analysis of ANO3 and ITGAL

We further examined the expression of the two most promising candidate genes from the association analysis, ANO3 and ITGAL, using primary fibroblast cell lines derived from a subset of patients and controls. In accordance with what is reported in public databases, we detected low ANO3 mRNA expression in fibroblasts. We performed a relative quantification of ANO3; mRNA levels were normalized and then compared between cases and controls. We observed no difference in ANO3 gene expression between the two groups (p = 0.75), but mRNA levels in the patient group were more spread than in the control group, and the variances were significantly different between cases and controls (F = 6.55, p = 0.015); see Figure 2. Therefore, we analyzed the expression data according to several other parameters, which were clinical subtype, gender, age, rs1531394 genotype, and verapamil use, but none of those parameters could be correlated to the high variability in the patient group (data not shown). ITGAL mRNA was expressed at too low levels in fibroblasts to perform a reliable analysis.

4. Discussion

This analysis on four genetic markers that were originally linked to verapamil response in migraine permitted us to identify two new candidate genes for CH: ANO3, and possibly ITGAL. We found an association between rs1531394 in ANO3 and an increased risk for CH. Interestingly, the rs1531394 variant was found to associate to CH both in patients using verapamil and patients not using verapamil, implying that the association does not depend on verapamil use, but is attributed solely to CH. One limitation of our study is that we did not have information as to why 69.6% of our patients did not use verapamil. Some of these patients might never have used preventive treatment, discontinued their treatment because of adverse effects, or were in remission and not in need of prophylactic treatment. That information could potentially reveal an association also to verapamil responsiveness which would be masked in the present study. This type of data could in the future have clinical impact, as a genetic test might precede and optimize the choice of medication.
A general limitation for candidate gene studies in CH have so far been small sample sizes (n = 100–200) and heterogeneous study designs, which have led to inconclusive results in the past. In addition, it is of great importance to validate our findings with other large independent case-control studies before drawing definite conclusions on the involvement of ANO3 in CH pathophysiology. ANO3 is a large gene on chromosome 11 comprising 27 exons, and further investigations of other genetic variants within the same gene in relation to CH are warranted.
The variant studied here resides in the 5′ UTR region of the gene sequence, and therefore has a potentially regulatory role. Specifically, the rs1531394 SNP is localized in a potential binding site for transcription factor RFX2. Our data on ANO3 in CH patients showed no difference in expression levels between patients and controls in fibroblasts, but a large variability in the patient group that we could not account for in our analysis on subtype, gender, age, or verapamil use. We did not investigate whether exposure to verapamil in vitro affected ANO3 gene expression; this might be an informative approach in the future. Moreover, gene expression in fibroblasts did not correlate to rs1531394 genotype. That is in contrast to data from the GTEx portal (https://gtexportal.org) suggesting that rs1531394 represents an expression quantitative trait locus (eQTL) in the tibial nerve. Consequently, it would be of great interest to investigate the gene expression of ANO3 in other human tissues, specifically in nervous tissue, where ANO3 is expressed abundantly, and likely to have a more prominent role than in skin. The rs1531394 variant might also affect ANO3 in ways other than gene expression. SNPs in the untranslated regions of a gene can for example affect mRNA stability, as suggested by our in silico analysis, revealing an effect on the secondary structure of the mRNA molecule. Additionally, binding or transport of the transcript might be affected by an untranslated SNP. Moreover, it is possible that the SNP studied by us is not the causative SNP per se, but that it is in linkage disequilibrium with other SNPs representing the true association.
Our findings on ANO3 are highly interesting, as they represent a molecular indication of Ca2+ signaling as a new pathophysiological pathway in CH. Verapamil, and other Ca2+ channel antagonists are commonly used in headache prevention, but besides the genetic association between familial hemiplegic migraine (type 1) and CACNA1A (calcium voltage-gated channel subunit alpha1 A), little is known of the implications of Ca2+ in headache. CACNA1A mutations have been screened and tested for association with CH, but no significant link has been identified [55,56]. ANO3 has not been studied previously in relation to CH. The gene encodes a Ca2+ activated Cl- channel and was previously discovered to be implicated in craniocervical dystonia [57,58]. Anoctamines are a family of 10 genes, and while the first two subtypes (1 and 2) are fairly well described, the role and function of ANO3 is still unclear [59]. In vitro experiments suggest that it is an intracellular protein, which is supported by the finding that mutations in ANO3 probably influence Ca2+ signaling by reducing the Ca2+ pool of the endoplasmic reticulum [57,60]. Interestingly, Ano3 knock-out rats display hyperexcitability of neurons residing in dorsal root ganglia, and are hypersensitive to pain [61].
The significance of our findings on the rs2230433 variant in ITGAL is more uncertain. There was a trend for association between this marker and CH, suggesting a protective effect, and the gene expression was not possible to evaluate in fibroblasts, due to low expression levels. We believe this gene could be of interest, but the association has to be investigated in a large independent CH cohort prior to drawing any conclusions on its potential involvement in CH.
Gene expression analysis permitted us to formally establish IPO8, TBP, and PDHB as suitable reference genes for studying CH in fibroblasts. Of the five reference genes that were assessed, GAPDH (which is a well-established reference gene) turned out to be the least suitable gene for CH, showing a significant difference in mRNA levels between cases and controls. This in an important finding, and should be considered in future gene expression studies on CH and fibroblasts.

5. Conclusions

In this paper, we report the first genetic association between CH and a SNP in ANO3, which is a gene encoding a Ca2+ activated Cl channel. This finding is of great interest to the field of CH research, as it suggests Ca2+ signaling as a new component of CH pathophysiology.

Author Contributions

Conceptualization, C.R.; data curation, C.F.; formal analysis, C.R., F.L., and A.C.B.; funding acquisition, A.C.B.; investigation, C.R., C.F., and D.A.; methodology, C.R.; project administration, A.C.B.; resources, C.S., E.W., A.S., and A.C.B.; supervision, A.C.B.; validation, C.S., E.W., and A.S.; writing—original draft, C.R. and A.C.B.; writing—review and editing, C.F., D.A., F.L., C.S., E.W., A.S., and A.C.B.

Funding

This research was funded by the Swedish Brain Foundation, the Swedish Research Council (2017-01096), The Mellby gård Foundation, and the Karolinska Institutet Research Funds.

Acknowledgments

We thank Ann-Christin Karlsson for contributing to the recruitment of patients.

Conflicts of Interest

The authors declare no conflict of interest.

Appendix A

Figure A1. Circle graph of mRNA fragments with the T or A allele at SNP rs1531394. Mfold was used to analyze the effect of rs1531394 on the predicted ANO3 mRNA folding of 141 bp partial sequence: rs1531394 is indicated by an arrowhead with the T allele in (A), and A allele in (B).
Brainsci 09 00184 g0a1

References

  1. The International Headache Society (IHS). Headache Classification Committee of the International Headache Society (IHS) The International Classification of Headache Disorders, 3rd edition. Cephalalgia 2018, 38, 1–211. [Google Scholar] [CrossRef] [PubMed]
  2. Schor, L.I. IHC Electronic Posters—Saturday and Sunday: Cluster Headache: Investigating severity of pain, suicidality, personal burden, access to effective treatment, and demographics among a large International survey sample. Cephalalgia 2017, 37, 172–208. [Google Scholar] [CrossRef]
  3. Manzoni, G.C.; Terzano, M.G.; Bono, G.; Micieli, G.; Martucci, N.; Nappi, G. Cluster Headache—Clinical Findings in 180 Patients. Cephalalgia 1983, 3, 21–30. [Google Scholar] [CrossRef] [PubMed]
  4. Steinberg, A.; Fourier, C.; Ran, C.; Waldenlind, E.; Sjöstrand, C.; Belin, A.C. Cluster headache—Clinical pattern and a new severity scale in a Swedish cohort. Cephalalgia 2018, 38, 1286–1295. [Google Scholar] [CrossRef] [PubMed]
  5. Fischera, M.; Marziniak, M.; Gralow, I.; Evers, S. The Incidence and Prevalence of Cluster Headache: A Meta-Analysis of Population-Based Studies. Cephalalgia 2008, 28, 614–618. [Google Scholar] [CrossRef] [PubMed]
  6. Goadsby, P.J.; Edvinsson, L. Human in vivo evidence for trigeminovascular activation in cluster headache Neuropeptide changes and effects of acute attacks therapies. Brain 1994, 117, 427–434. [Google Scholar] [CrossRef] [PubMed]
  7. Vollesen, A.L.H.; Snoer, A.; Beske, R.P.; Guo, S.; Hoffmann, J.; Jensen, R.H. Effect of Infusion of Calcitonin Gene-Related Peptide on Cluster Headache Attacks: A Randomized Clinical Trial. JAMA Neurol. 2018, 75, 1187–1197. [Google Scholar] [CrossRef]
  8. Hoffmann, J.; May, A. Diagnosis, pathophysiology, and management of cluster headache. Lancet Neurol. 2018, 17, 75–83. [Google Scholar] [CrossRef]
  9. May, A.; Bahra, A.; Büchel, C.; Frackowiak, R.S.; Goadsby, P.J. Hypothalamic activation in cluster headache attacks. Lancet 1998, 352, 275–278. [Google Scholar] [CrossRef]
  10. Gibson, K.F.; Dos Santos, A.; Lund, N.; Jensen, R.; Stylianou, I.M. Genetics of cluster headache. Cephalalgia 2019. [Google Scholar] [CrossRef]
  11. Rainero, I.; Gallone, S.; Valfrè, W.; Ferrero, M.; Angilella, G.; Rivoiro, C.; Rubino, E.; De Martino, P.; Savi, L.; Ferrone, M.; et al. A polymorphism of the hypocretin receptor 2 gene is associated with cluster headache. Neurology 2004, 63, 1286–1288. [Google Scholar] [CrossRef] [PubMed]
  12. Rainero, I.; Rubino, E.; Gallone, S.; Fenoglio, P.; Negro, E.; De Martino, P.; Savi, L.; Pinessi, L. Cluster Headache is Associated With theAlcohol Dehydrogenase 4(ADH4) Gene. Headache J. Head Face Pain 2010, 50, 92–98. [Google Scholar] [CrossRef] [PubMed]
  13. Fourier, C.; Ran, C.; Zinnegger, M.; Johansson, A.S.; Sjöstrand, C.; Waldenlind, E.; Steinberg, A.; Belin, A.C. A genetic CLOCK variant associated with cluster headache causing increased mRNA levels. Cephalalgia 2018, 38, 496–502. [Google Scholar] [CrossRef] [PubMed]
  14. Ran, C.; Fourier, C.; Zinnegger, M.; Steinberg, A.; Sjöstrand, C.; Waldenlind, E.; Belin, A.C. Implications for the migraine SNP rs1835740 in a Swedish cluster headache population. J. Headache Pain 2018, 19, 100. [Google Scholar] [CrossRef] [PubMed]
  15. Sjöstrand, C.; Modin, H.; Masterman, T.; Ekbom, K.; Waldenlind, E.; Hillert, J. Analysis of Nitric Oxide Synthase Genes in Cluster Headache. Cephalalgia 2002, 22, 758–764. [Google Scholar] [CrossRef] [PubMed]
  16. Weller, C.M.; Wilbrink, L.A.; Houwing-Duistermaat, J.J.; Koelewijn, S.C.; Vijfhuizen, L.S.; Haan, J.; Ferrari, M.D.; Terwindt, G.M.; van den Maagdenberg, A.M.; de Vries, B. Cluster headache and the hypocretin receptor 2 reconsidered: A genetic association study and meta-analysis. Cephalalgia 2015, 35, 741–747. [Google Scholar] [CrossRef] [PubMed]
  17. Rainero, I.; Rivoiro, C.; Gallone, S.; Valfrè, W.; Ferrero, M.; Angilella, G.; Rubino, E.; De Martino, P.; Savi, L.; Giudice, R.L.; et al. Lack of Association between the 3092 T°C Clock Gene Polymorphism and Cluster Headache. Cephalalgia 2005, 25, 1078–1081. [Google Scholar] [CrossRef] [PubMed]
  18. Cevoli, S.; Mochi, M.; Pierangeli, G.; Zanigni, S.; Grimaldi, D.; Bonavina, G.; Torelli, P.; Manzoni, G.C.; Cortelli, P.; Montagna, P. Investigation of the T3111C CLOCK gene polymorphism in cluster headache. J. Neurol. 2008, 255, 299–300. [Google Scholar] [CrossRef]
  19. Fourier, C.; Ran, C.; Steinberg, A.; Sjöstrand, C.; Waldenlind, E.; Belin, A.C. Screening of Two ADH4 Variations in a Swedish Cluster Headache Case–Control Material. Headache J. Head Face Pain 2016, 56, 835–840. [Google Scholar] [CrossRef]
  20. Fan, Z.; Hou, L.; Wan, D.; Ao, R.; Zhao, D.; Yu, S. Genetic association of HCRTR2, ADH4 and CLOCK genes with cluster headache: A Chinese population-based case-control study. J. Headache Pain 2018, 19, 1. [Google Scholar] [CrossRef]
  21. Fourier, C.; Ran, C.; Steinberg, A.; Sjöstrand, C.; Waldenlind, E.; Belin, A.C. Analysis of HCRTR2 Gene Variants and Cluster Headache in Sweden. Headache J. Head Face Pain 2019, 59, 410–417. [Google Scholar] [CrossRef] [PubMed]
  22. Tuka, B.; Szabó, N.; Tóth, E.; Kincses, Z.T.; Párdutz, Á.; Szok, D.; Körtési, T.; Bagoly, T.; Helyes, Z.; Edvinsson, L.; et al. Release of PACAP-38 in episodic cluster headache patients – an exploratory study. J. Headache Pain 2016, 17, 251. [Google Scholar] [CrossRef] [PubMed]
  23. Bacchelli, E.; Cainazzo, M.M.; Cameli, C.; Guerzoni, S.; Martinelli, A.; Zoli, M.; Maestrini, E.; Pini, L.A. A genome-wide analysis in cluster headache points to neprilysin and PACAP receptor gene variants. J. Headache Pain 2016, 17, 279. [Google Scholar] [CrossRef] [PubMed]
  24. Ran, C.; Fourier, C.; Michalska, J.M.; Steinberg, A.; Sjöstrand, C.; Waldenlind, E.; Belin, A.C. Screening of genetic variants in ADCYAP1R1, MME and 14q21 in a Swedish cluster headache cohort. J. Headache Pain 2017, 18, 88. [Google Scholar] [CrossRef] [PubMed]
  25. Tfelt-Hansen, P.C.; Tfelt-Hansen, D.P.C.; Jensen, R.H. Management of Cluster Headache. CNS Drugs 2012, 26, 571–580. [Google Scholar] [CrossRef] [PubMed]
  26. Markley, H.G. Verapamil and migraine prophylaxis: Mechanisms and efficacy. Am. J. Med. 1991, 90, S48–S53. [Google Scholar] [CrossRef]
  27. Elliott, W.J.; Ram, C.V.S. Calcium Channel Blockers. J. Clin. Hypertens. 2011, 13, 687–689. [Google Scholar] [CrossRef]
  28. Kuga, T.; Sadoshima, J.; Tomoike, H.; Kanaide, H.; Akaike, N.; Nakamura, M. Actions of Ca2+ antagonists on two types of Ca2+ channels in rat aorta smooth muscle cells in primary culture. Circ. Res. 1990, 67, 469–480. [Google Scholar] [CrossRef]
  29. Freeze, B.S.; McNulty, M.M.; Hanck, D.A. State-dependent verapamil block of the cloned human Ca(v)3.1 T-type Ca(2+) channel. Mol. Pharmacol. 2006, 70, 718–726. [Google Scholar] [CrossRef]
  30. Diochot, S.; Richard, S.; Baldy-Moulinier, M.; Nargeot, J.; Valmier, J. Dihydropyridines, phenylalkylamines and benzothiazepines block N-, P/Q- and R-type calcium currents. Pflugers. Arch. 1995, 431, 10–19. [Google Scholar] [CrossRef]
  31. Miranda, H.F.; Bustamante, D.; Kramer, V.; Pelissier, T.; Saavedra, H.; Paeile, C.; Fernandez, E.; Pinardi, G. Antinociceptive effects of Ca2+ channel blockers. Eur. J. Pharmacol. 1992, 217, 137–141. [Google Scholar] [CrossRef]
  32. Zhang, S.; Zhou, Z.; Gong, Q.; Makielski, J.C.; January, C.T. Mechanism of Block and Identification of the Verapamil Binding Domain to HERG Potassium Channels. Circ. Res. 1999, 84, 989–998. [Google Scholar] [CrossRef] [PubMed] [Green Version]
  33. Lebrun, P.; Antoine, M.-H.; Ouedraogo, R.; Pirotte, B.; Herchuelz, A.; Cosgrove, K.E.; Fernandez, E.; Pinardi, G. Verapamil, a phenylalkylamine Ca2+ channel blocker, inhibits ATP-sensitive K+ channels in insulin-secreting cells from rats. Diabetologia 1997, 40, 1403–1410. [Google Scholar] [CrossRef] [PubMed]
  34. DeCoursey, T.E. Mechanism of K+ channel block by verapamil and related compounds in rat alveolar epithelial cells. J. Gen. Physiol. 1995, 106, 745–779. [Google Scholar] [CrossRef] [PubMed]
  35. Huffaker, S.J.; Chen, J.; Nicodemus, K.K.; Sambataro, F.; Yang, F.; Mattay, V.; Lipska, B.K.; Hyde, T.M.; Song, J.; Rujescu, D.; et al. A novel, primate-specific, brain isoform of KCNH2 impacts cortical physiology, cognition, neuronal repolarization and risk for schizophrenia. Nat. Med. 2009, 15, 509–518. [Google Scholar] [CrossRef] [PubMed]
  36. Guo, Z.; Cao, Y.-Q. Over-Expression of TRESK K+ Channels Reduces the Excitability of Trigeminal Ganglion Nociceptors. PLoS ONE 2014, 9, e87029. [Google Scholar] [CrossRef] [PubMed]
  37. Lafrenière, R.G.; Cader, M.Z.; Poulin, J.-F.; Andres-Enguix, I.; Simoneau, M.; Gupta, N.; Boisvert, K.; Lafrenière, F.; McLaughlan, S.; Dubé, M.-P.; et al. A dominant-negative mutation in the TRESK potassium channel is linked to familial migraine with aura. Nat. Med. 2010, 16, 1157–1160. [Google Scholar] [CrossRef] [PubMed]
  38. Bauer, M.; Karch, R.; Zeitlinger, M.; Philippe, C.; Römermann, K.; Stanek, J.; Maier-Salamon, A.; Wadsak, W.; Jäger, W.; Hacker, M.; et al. Approaching complete inhibition of P-glycoprotein at the human blood–brain barrier: An (R)-[11C]verapamil PET study. Br. J. Pharmacol. 2015, 35, 743–746. [Google Scholar] [CrossRef]
  39. Römermann, K.; Wanek, T.; Bankstahl, M.; Bankstahl, J.P.; Fedrowitz, M.; Müller, M.; Löscher, W.; Kuntner, C.; Langer, O. (R)-[11C]verapamil is selectively transported by murine and human P-glycoprotein at the blood–brain barrier, and not by MRP1 and BCRP. Nucl. Med. Boil. 2013, 40, 873–878. [Google Scholar] [CrossRef]
  40. Safa, A.R. Photoaffinity labeling of the multidrug-resistance-related P-glycoprotein with photoactive analogs of verapamil. Proc. Natl. Acad. Sci. USA 1988, 85, 7187–7191. [Google Scholar] [CrossRef]
  41. Tsuruo, T.; Iida, H.; Tsukagoshi, S.; Sakurai, Y. Increased accumulation of vincristine and adriamycin in drug-resistant P388 tumor cells following incubation with calcium antagonists and calmodulin inhibitors. Cancer Res. 1982, 42, 4730–4733. [Google Scholar]
  42. Yusa, K.; Tsuruo, T. Reversal mechanism of multidrug resistance by verapamil: Direct binding of verapamil to P-glycoprotein on specific sites and transport of verapamil outward across the plasma membrane of K562/ADM cells. Cancer Res. 1989, 49, 5002–5006. [Google Scholar]
  43. Cutrer, F.M.; Klein, C.J.; Atkinson, E.J. IHC Oral Abstracts: Genomic variants related to Verapamil response in the treatment of Migraine. Cephalalgia 2017, 37, 1–24. [Google Scholar] [CrossRef]
  44. The International Headache Society (IHS). The international classification of headache disorders: 2nd edition. Cephalalgia 2004, 24. [Google Scholar] [CrossRef]
  45. Takashima, A. Establishment of Fibroblast Cultures. Curr. Protoc. Cell Boil. 1998, 2, 2.1.1–2.1.12. [Google Scholar] [CrossRef]
  46. Johansson, A.-S.; Owe-Larsson, B.; Hetta, J.; Lundkvist, G.B. Altered circadian clock gene expression in patients with schizophrenia. Schizophr. Res. 2016, 174, 17–23. [Google Scholar] [CrossRef]
  47. Koressaar, T.; Remm, M. Enhancements and modifications of primer design program Primer3. Bioinformatics 2007, 23, 1289–1291. [Google Scholar] [CrossRef] [Green Version]
  48. Untergasser, A.; Cutcutache, I.; Koressaar, T.; Ye, J.; Faircloth, B.C.; Remm, M.; Rozen, S.G. Primer3—New capabilities and interfaces. Nucleic Acids Res. 2012, 40, e115. [Google Scholar] [CrossRef]
  49. Zuker, M. Mfold web server for nucleic acid folding and hybridization prediction. Nucleic Acids Res. 2003, 31, 3406–3415. [Google Scholar] [CrossRef]
  50. Dupont, W.D.; Plummer, W.D., Jr.; Plummer, W.D. Power and sample size calculations. A review and computer program. Control. Clin. Trials 1990, 11, 116–128. [Google Scholar] [CrossRef]
  51. Rodriguez, S.; Gaunt, T.R.; Day, I.N.M. Hardy-Weinberg Equilibrium Testing of Biological Ascertainment for Mendelian Randomization Studies. Am. J. Epidemiol. 2008, 169, 505–514. [Google Scholar] [CrossRef]
  52. Kumar, S.; Ambrosini, G.; Bucher, P. SNP2TFBS—A database of regulatory SNPs affecting predicted transcription factor binding site affinity. Nucleic. Acids Res. 2017, 45, D139–D144. [Google Scholar] [CrossRef]
  53. Andersen, C.L.; Jensen, J.L.; Ørntoft, T.F. Normalization of Real-Time Quantitative Reverse Transcription-PCR Data: A Model-Based Variance Estimation Approach to Identify Genes Suited for Normalization, Applied to Bladder and Colon Cancer Data Sets. Cancer Res. 2004, 64, 5245–5250. [Google Scholar] [CrossRef] [Green Version]
  54. Vandesompele, J.; De Preter, K.; Pattyn, F.; Poppe, B.; Van Roy, N.; De Paepe, A.; Speleman, F. Accurate normalization of real-time quantitative RT-PCR data by geometric averaging of multiple internal control genes. Genome Boil. 2002, 3, 0034-1. [Google Scholar]
  55. Sjöstrand, C.; Giedratis, V.; Ekbom, K.; Waldenlind, E.; Hillert, J. CACNA1A Gene Polymorphisms in Cluster Headache. Cephalalgia 2001, 21, 953–958. [Google Scholar] [CrossRef]
  56. Haan, J.; Van Vliet, J.; Kors, E.; Terwindt, G.; Vermeulen, F.; Maagdenberg, A.V.D.; Frants, R.; Ferrari, M. No Involvement of the Calcium Channel Gene (CACNA1A) in a Family with Cluster Headache. Cephalalgia 2001, 21, 959–962. [Google Scholar] [CrossRef]
  57. Charlesworth, G.; Plagnol, V.; Holmström, K.M.; Bras, J.; Sheerin, U.-M.; Preza, E.; Rubio-Agusti, I.; Ryten, M.; Schneider, S.A.; Stamelou, M.; et al. Mutations in ANO3 Cause Dominant Craniocervical Dystonia: Ion Channel Implicated in Pathogenesis. Am. J. Hum. Genet. 2012, 91, 1041–1050. [Google Scholar] [CrossRef] [Green Version]
  58. Lohmann, K.; Klein, C. Update on the Genetics of Dystonia. Curr. Neurol. Neurosci. Rep. 2017, 17, 1090. [Google Scholar] [CrossRef]
  59. Picollo, A.; Malvezzi, M.; Accardi, A. TMEM16 Proteins: Unknown Structure and Confusing Functions. J. Mol. Biol. 2015, 427, 94–105. [Google Scholar] [CrossRef]
  60. Duran, C.; Qu, Z.; Osunkoya, A.O.; Cui, Y.; Hartzell, H.C. ANOs 3–7 in the anoctamin/Tmem16 Cl-channel family are intracellular proteins. Am. J. Physiol. Physiol. 2012, 302, C482–C493. [Google Scholar] [CrossRef]
  61. Huang, F.; Wang, X.; Ostertag, E.M.; Nuwal, T.; Huang, B.; Jan, Y.-N.; Basbaum, A.I.; Jan, L.Y. TMEM16C facilitates Na+-activated K+ currents in rat sensory neurons and regulates pain processing. Nat. Neurosci. 2013, 16, 1284–1290. [Google Scholar] [CrossRef]
Figure 1. Stability of mRNA expression in fibroblast cell lines from cluster headache (CH) cases and controls. The stability of mRNA expression of five reference genes was assessed in primary fibroblast cell lines from 8 healthy control subjects and 12 CH patients. Comparative analysis to determine the gene with the most stable expression was performed using the software Normfinder [53]. Gene names are listed on the x-axis. IPO8 was the most stable reference gene in these conditions, presenting both high stability (stability value close to zero), and a small difference in mRNA expression (group difference close to zero), with low standard deviation (error bars) between the two groups.
Brainsci 09 00184 g001
Figure 2. ANO3 mRNA levels in cluster headache (CH) patients and controls. Relative mRNA levels of ANO3 in primary fibroblast cell lines from 9 control individuals and 10 CH patients. mRNA levels were normalized to reference genes TBP and IPO8, and to a control sample. Relative expression levels were log2-transformed due to non-normal distribution of the data, and analyzed with Student’s t-test, p-value = 0.75.
Brainsci 09 00184 g002
Table 1. Demographic data for patients and controls.
ControlsCH Patients
Individuals586628
Average age in years ± SDn/a52.1 ± 14.6
Male % (n)60.6 (355)68.3 (429)
Chronic CH % (n)n/a10.6 (66)
Average age at onset ± SDn/a32.0 ± 13.6
Positive family history % (n)n/a10.8 § (61)
Prophylactic verapamil use % (n)n/a30.4 (191)
Diurnal rhythmicity % (n)n/a68.0 (380)
CH: Cluster headache; SD: standard deviation; n/a: not available/applicable; n: number of individuals; §/† information available for a total number of § 567 individuals or 559 individuals, respectively.
Table 2. Analyzed SNPs.
GeneSNP rs Number (HGVS)ConsequenceTaqMan Assay
PCDHB6rs17844444 (NC_000005.10:g.141152584G>A)Missense Gly→AspC__32960006_10
PLCE1rs10882386 (NC_000010.10:g.95790669G>A)Unknown (5′UTR)C___1946626_10
ANO3rs1531394 (NC_000011.10:g.26332096T>A)Unknown (5′UTR)C___1616984_10
ITGALrs2230433 (NC_000016.10:g.30506720G>C)Missense Arg→ThrC__11789692_10
SNP: single nucleotide polymorphism; HGVS: Human Genome Variation Society; UTR: untranslated region.
Table 3. Primers used for gene expression analysis.
Gene of InterestForward Primer 5′-3′Reverse Primer 5′-3′
Anoctamin 3ANO3CCTGGAGTTTTGGAAAAGGAGACTTGGCTTCAAACTGGGGAC
Integrin Subunit α LITGALCACTCTATGTCAGTTTCACCCCGTTGTGGTCGTGGATGGAAG
Reference GeneForward Primer 5′-3′Reverse Primer 5′-3′
Glyceraldehyde-3-Phosphate DehydrogenaseGAPDHAGCCACATCGCTCAGACACGCCCAATACGACCAAATCC
Importin 8IPO8ATTGGAAGAAACCGCGCTTGTGTGTACACCTCCTGCAGTG
Peptidylprolyl Isomerase APPIAGACCCAACACAAATGGTTCCGGCCTCCACAATATTCATGC
Pyruvate Dehydrogenase E1 β SubunitPDHBGGTTTCCCATTCAAGACCTGTGGTTTCCATGTCCATTGGT
TATA-Box Binding ProteinTBPAGGCAACACAGGGAACCTCTTGCAGCTGCGGTACAATCC
Table 4. Statistical analysis of genotypes and alleles.
SNP NameGenotype/AlleleControl % (n)CH % (n)χ2 (df)OR (95% CI)p-Value
rs17844444GG75.30 (439)75.41 (466)
GA22.64 (132)21.52 (133)
AA2.06 (12)3.07 (19)1.37 (2) 0.50
G86.62 (1010)86.17 (1065) 1.04
A13.38 (156)13.84 (171)0.071 (1)(1.82–1.31)0.79
rs10882386GG55.36 (320)56.64 (354)
GA39.62 (229)36.80 (230)
AA5.02 (29)6.56 (41)1.94 (2) 0.38
G75.17 (869)75.04 (938) 1.007
A24.83 (287)24.96 (312)0.0008 (1)(0.84–1.21)0.98
rs1531394TT37.29 (217)38.28 (240)
TA48.97 (285)42.27 (265)
AA13.75 (80)19.46 (122)9.28 (2) 0.0097 *
T61.77 (719)59.41 (745) 1.10
A38.23 (445)40.59 (509)1.31 (1)(0.94–1.30)0.25
rs2230433GG51.55 (299)57.44 (359)
GC40.69 (236)35.52 (222)
CC7.76 (45)7.04 (44)4.24 (2) 0.12
G71.90 (834)75.2 (940) 0.84
C28.10 (326)24.8 (310)3.38 (1)(0.70–1.011)0.066
SNP: single nucleotide polymorphism, CH: cluster headache, χ2: chi-squared, df: degrees of freedom, OR: odds ratio, CI: confidence interval, * αSID = 0.013 using the Šidák correction for multiple testing.
Table 5. Analysis of rs1531394 in patients using verapamil.
GenotypeControl % (n)All CH Patients % (n)CH Using Verapamil % (n)CH not Using Verapamil % (n)OR (95%CI)p-Value
TT + TA86.25 (502)80.54 (505) 1.56
AA13.75 (80)19.46 (122) 1.11–2.060.0086
Stratified Analysis
TT + TA 79.06 (151) 1.66
AA 20.94 (40) 1.09–2.530.021
TT + TA 81.19 (354)1.45
AA 18.81 (82)1.04–2.040.031
CH: cluster headache, OR: odds ratio, CI: confidence interval.

