Multiple Levels of Control Processes for Wisconsin Card Sorts: An Observational Study


Abstract
1. Introduction
2. Materials and Methods
2.1. Participants
2.2. Materials and Design
2.3. Statistical Analyses
3. Results
3.1. Confirmatory Analyses
3.2. Exploratory Analyses
4. Discussion
5. Conclusions
Author Contributions
Funding
Conflicts of Interest
References
- Berg, E.A. A simple objective technique for measuring flexibility in thinking. J. Gen. Psychol. 1948, 39, 15–22. [Google Scholar] [CrossRef] [PubMed]
- Grant, D.A.; Berg, E.A. A behavioral analysis of degree of reinforcement and ease of shifting to new responses in a Weigl-type card-sorting problem. J. Exp. Psychol. 1948, 38, 404–411. [Google Scholar] [CrossRef] [PubMed]
- Milner, B. Effects of different brain lesions on card sorting. Arch. Neurol. 1963, 9, 90–100. [Google Scholar] [CrossRef]
- Teuber, H.L.; Battersby, W.S.; Bender, M.B. Performance of complex visual tasks after cerebral lesions. J. Nerv. Ment. Dis. 1951, 114, 413–429. [Google Scholar] [CrossRef] [PubMed]
- Heaton, R.K.; Chelune, G.J.; Talley, J.L.; Kay, G.G.; Curtiss, G. Wisconsin Card Sorting Test Manual: Revised and Expanded; Psychological Assessment Resources Inc.: Odessa, FL, USA, 1993. [Google Scholar]
- Kongs, S.K.; Thompson, L.L.; Iverson, G.L.; Heaton, R.K. WCST-64: Wisconsin Card Sorting Test-64 Card Version: Professional Manual; Psychological Assessment Resources Inc.: Lutz, FL, USA, 2000. [Google Scholar]
- Nelson, H.E. A modified card sorting test sensitive to frontal lobe defects. Cortex 1976, 12, 313–324. [Google Scholar] [CrossRef]
- Schretlen, D.J. Modified Wisconsin Card Sorting Test (M-WCST): Professional Manual; Psychological Assessment Resources Inc.: Lutz, FL, USA, 2010. [Google Scholar]
- Diamond, A. Executive functions. Annu. Rev. Psychol. 2013, 64, 135–168. [Google Scholar] [CrossRef]
- Miller, E.K.; Cohen, J.D. An integrative theory of prefrontal cortex function. Annu. Rev. Neurosci. 2001, 24, 167–202. [Google Scholar] [CrossRef] [PubMed]
- Alvarez, J.A.; Emory, E. Executive function and the frontal lobes: A meta-analytic review. Neuropsychol. Rev. 2006, 16, 17–42. [Google Scholar] [CrossRef]
- Demakis, G.J. A meta-analytic review of the sensitivity of the Wisconsin Card Sorting Test to frontal and lateralized frontal brain damage. Neuropsychology 2003, 17, 255–264. [Google Scholar] [CrossRef]
- Eling, P.; Derckx, K.; Maes, R. On the historical and conceptual background of the Wisconsin Card Sorting Test. Brain Cogn. 2008, 67, 247–253. [Google Scholar] [CrossRef]
- Lange, F.; Seer, C.; Kopp, B. Cognitive flexibility in neurological disorders: Cognitive components and event-related potentials. Neurosci. Biobehav. Rev. 2017, 83, 496–507. [Google Scholar] [CrossRef] [PubMed]
- Nyhus, E.; Barceló, F. The Wisconsin Card Sorting Test and the cognitive assessment of prefrontal executive functions: A critical update. Brain Cogn. 2009, 71, 437–451. [Google Scholar] [CrossRef] [PubMed]
- Strauss, E.; Sherman, E.M.S.; Spreen, O. A Compendium of Neuropsychological Tests: Administration, Norms, and Commentary; Oxford University Press: New York, NY, USA, 2006. [Google Scholar]
- Lange, F.; Brückner, C.; Knebel, A.; Seer, C.; Kopp, B. Executive dysfunction in Parkinson’s disease: A meta-analysis on the Wisconsin Card Sorting Test literature. Neurosci. Biobehav. Rev. 2018, 93, 38–56. [Google Scholar] [CrossRef] [PubMed]
- Kopp, B.; Steinke, A.; Meiran, N.; Seer, C.; Lange, F. Stimulus- and response-based interference contributes to the costs of switching between cognitive tasks. Psychol. Res. 2018, 1–14. [Google Scholar] [CrossRef] [PubMed]
- Bowden, S.C.; Fowler, K.S.; Bell, R.C.; Whelan, G.; Clifford, C.C.; Ritter, A.J.; Long, C.M. The reliability and internal validity of the Wisconsin Card Sorting Test. Neuropsychol. Rehabil. 1998, 8, 243–254. [Google Scholar] [CrossRef]
- Greve, K.W. Can perseverative responses on the Wisconsin Card Sorting Test be scored accurately? Arch. Clin. Neuropsychol. 1993, 8, 511–517. [Google Scholar] [CrossRef]
- Paolo, A.M.; Axelrod, B.N.; Ryan, J.J.; Goldman, R.S. Administration accuracy of the Wisconsin card sorting test. Clin. Neuropsychol. 1994, 8, 112–116. [Google Scholar] [CrossRef]
- Bishara, A.J.; Kruschke, J.K.; Stout, J.C.; Bechara, A.; McCabe, D.P.; Busemeyer, J.R. Sequential learning models for the Wisconsin card sort task: Assessing processes in substance dependent individuals. J. Math. Psychol. 2010, 54, 5–13. [Google Scholar] [CrossRef]
- Buchsbaum, B.R.; Greer, S.; Chang, W.L.; Berman, K.F. Meta-analysis of neuroimaging studies of the Wisconsin Card-Sorting task and component processes. Hum. Brain Mapp. 2005, 25, 35–45. [Google Scholar] [CrossRef]
- Dehaene, S.; Changeux, J.P. The Wisconsin Card Sorting Test: Theoretical analysis and modeling in a neuronal network. Cereb. Cortex 1991, 1, 62–79. [Google Scholar] [CrossRef]
- Miyake, A.; Friedman, N.P. The nature and organization of individual differences in executive functions: Four general conclusions. Curr. Dir. Psychol. Sci. 2012, 21, 8–14. [Google Scholar] [CrossRef] [PubMed]
- Ridderinkhof, K.R.; Span, M.M.; van der Molen, M.W. Perseverative behavior and adaptive control in older adults: Performance monitoring, rule induction, and set shifting. Brain Cogn. 2002, 49, 382–401. [Google Scholar] [CrossRef] [PubMed]
- Shallice, T.; Cooper, R.P. The Organization of Mind; Oxford University Press: New York, NY, USA, 2011. [Google Scholar]
- Badre, D.; Nee, D.E. Frontal cortex and the hierarchical control of behavior. Trends Cogn. Sci. 2018, 22, 170–188. [Google Scholar] [CrossRef] [PubMed]
- Egner, T. The Wiley Handbook of Cognitive Control; John Wiley & Sons Inc.: Chichester, UK, 2017. [Google Scholar]
- Luria, A.R. Two kinds of motor perseveration in massive injury of the frontal lobes. Brain 1965, 88, 1–10. [Google Scholar] [CrossRef] [PubMed]
- Grange, J.; Houghton, G. Task Switching and Cognitive Control; Oxford University Press: New York, NY, USA, 2014. [Google Scholar]
- Hübner, R.; Druey, M.D. Response execution, selection, or activation: What is sufficient for response-related repetition effects under task shifting? Psychol. Res. 2006, 70, 245–261. [Google Scholar] [CrossRef] [PubMed][Green Version]
- Wessel, J.R.; Aron, A.R. Inhibitory motor control based on complex stopping goals relies on the same brain network as simple stopping. Neuroimage 2014, 103, 225–234. [Google Scholar] [CrossRef] [PubMed]
- Aebi, C. Validierung der neuropsychologischen Testbatterie CERAD-NP: Eine Multi-Center Studie, University of Basel. 2002. Available online: http://edoc.unibas.ch/46/1/DissB_6279.pdf (accessed on 20 May 2019).
- Fillenbaum, G.G.; van Belle, G.; Morris, J.C.; Mohs, R.C.; Mirra, S.S.; Davis, P.C.; Tariot, P.N.; Silverman, J.M.; Clark, C.M.; Welsh-Bohmer, K.A.; et al. Consortium to Establish a Registry for Alzheimer’s Disease (CERAD): The first twenty years. Alzheimer’s Dement. 2008, 4, 96–109. [Google Scholar] [CrossRef]
- Luck, T.; Pabst, A.; Rodriguez, F.S.; Schroeter, M.L.; Witte, V.; Hinz, A.; Mehnert, A.; Engel, C.; Loeffler, M.; Thiery, J.; et al. Age-, sex-, and education-specific norms for an extended CERAD Neuropsychological Assessment Battery–Results from the population-based LIFE-Adult-Study. Neuropsychology 2018, 32, 461–475. [Google Scholar] [CrossRef]
- Morris, J.C.; Mohs, R.C.; Rogers, H.; Fillenbaum, G.; Heyman, A. Consortium to Establish a Registry for Alzheimer’s Disease (CERAD): Clinical and neuropsychological assessment of Alzheimer’s disease. Psychopharmacol. Bull. 1988, 24, 341–652. [Google Scholar]
- Barceló, F. Electrophysiological evidence of two different types of error in the Wisconsin Card Sorting Test. Neuroreport 1999, 10, 1299–1303. [Google Scholar] [CrossRef]
- Barceló, F.; Knight, R.T. Both random and perseverative errors underlie WCST deficits in prefrontal patients. Neuropsychologia 2002, 40, 349–356. [Google Scholar] [CrossRef]
- Kopp, B.; Lange, F. Electrophysiological indicators of surprise and entropy in dynamic task-switching environments. Front. Hum. Neurosci. 2013, 7. [Google Scholar] [CrossRef] [PubMed]
- Lange, F.; Kröger, B.; Steinke, A.; Seer, C.; Dengler, R.; Kopp, B. Decomposing card-sorting performance: Effects of working memory load and age-related changes. Neuropsychology 2016, 30, 579–590. [Google Scholar] [CrossRef] [PubMed]
- Lange, F.; Seer, C.; Finke, M.; Dengler, R.; Kopp, B. Dual routes to cortical orienting responses: Novelty detection and uncertainty reduction. Biol. Psychol. 2015, 105, 66–71. [Google Scholar] [CrossRef] [PubMed]
- Chandler, M.J.; Lacritz, L.H.; Hynan, L.S.; Barnard, H.D.; Allen, G.; Deschner, M.; Weiner, M.F.; Cullum, C.M. A total score for the CERAD neuropsychological battery. Neurology 2005, 65, 102–106. [Google Scholar] [CrossRef] [PubMed]
- Kruschke, J.K.; Liddell, T.M. The Bayesian New Statistics: Hypothesis testing, estimation, meta-analysis, and power analysis from a Bayesian perspective. Psychon. Bull. Rev. 2018, 25, 178–206. [Google Scholar] [CrossRef] [PubMed]
- JASP Team. JASP (Version 0.8.5.1). Available online: https://jasp-stats.org/2017/12/20/new-version-jasp-0-8-5/ (accessed on 8 February 2018).
- Meng, X.L.; Rosenthal, R.; Rubin, D.B. Comparing correlated correlation coefficients. Psychol. Bull. 1992, 111, 172–175. [Google Scholar] [CrossRef]
- Frank, M.J.; Seeberger, L.C.; O’Reilly, R.C. By carrot or by stick: Cognitive reinforcement learning in Parkinsonism. Science 2004, 306, 1940–1943. [Google Scholar] [CrossRef]
- Palminteri, S.; Justo, D.; Jauffret, C.; Pavlicek, B.; Dauta, A.; Delmaire, C.; Czernecki, V.; Karachi, C.; Capelle, L.; Durr, A.; et al. Critical roles for anterior insula and dorsal striatum in punishment-based avoidance learning. Neuron 2012, 76, 998–1009. [Google Scholar] [CrossRef]
- Ashendorf, L.; Jefferson, A.L.; O’Connor, M.K.; Chaisson, C.; Green, R.C.; Stern, R.A. Trail Making Test errors in normal aging, mild cognitive impairment, and dementia. Arch. Clin. Neuropsychol. 2008, 23, 129–137. [Google Scholar] [CrossRef]
- Kopp, B.; Rösser, N.; Tabeling, S.; Stürenburg, H.J.; de Haan, B.; Karnath, H.-O.; Wessel, K. Errors on the Trail Making Test are associated with right hemispheric frontal lobe damage in stroke patients. Behav. Neurol. 2015, 2015, 309235. [Google Scholar] [CrossRef] [PubMed]
- Stuss, D.T.; Bisschop, S.M.; Alexander, M.P.; Levine, B.; Katz, D.; Izukawa, D. The Trail Making Test: A study in focal lesion patients. Psychol. Assess. 2001, 13, 230–239. [Google Scholar] [CrossRef] [PubMed]
- Cooper, R.; Shallice, T. Contention scheduling and the control of routine activities. Cogn. Neuropsychol. 2000, 17, 297–338. [Google Scholar] [CrossRef] [PubMed]
- Norman, D.A.; Shallice, T. Attention to action: Willed and automatic control of behavior. In Consciousness and Self-Regulation; Davidson, R.J., Schwartz, G.E., Shapiro, D., Eds.; Springer US: Boston, MA, USA, 1986; pp. 1–18. [Google Scholar] [CrossRef]
- Shallice, T.; Stuss, D.T.; Picton, T.W.; Alexander, M.P.; Gillingham, S. Mapping task switching in frontal cortex through neuropsychological group studies. Front. Neurosci. 2008, 2, 79–85. [Google Scholar] [CrossRef] [PubMed]
- Dickinson, A.; Balleine, B. The role of learning in the operation of motivational systems. In Stevens’ Handbook of Experimental Psychology: Learning, Motivation, and Emotion; Pashler, H., Gallistel, R., Eds.; John Wiley & Sons Inc.: Hoboken, NJ, USA, 2002; pp. 497–533. [Google Scholar]
- Tolman, E.C. Cognitive maps in rats and men. Psychol. Rev. 1948, 55, 189–208. [Google Scholar] [CrossRef] [PubMed]
- Moran, R.; Keramati, M.; Dayan, P.; Dolan, R.J. Retrospective model-based inference guides model-free credit assignment. Nat. Commun. 2019, 10, 750. [Google Scholar] [CrossRef] [PubMed]


| Included (N = 112) | Excluded (N = 34) | |||||
|---|---|---|---|---|---|---|
| M | SD | n | M | SD | n | |
| Age | 61.08 | 12.26 | 112 | 63.71 | 12.43 | 34 |
| education (years) | 13.12 | 2.23 | 112 | 12.94 | 2.47 | 34 |
| M-WCST categories | 2.99 | 1.87 | 112 | 3.19 | 2.23 | 16 # |
| CERAD-NAB (core) | ||||||
| Animal fluency | −0.99 | 2.49 | 108 | −1.50 | 1.38 | 34 |
| Abbreviated Boston Naming Test | −0.11 | 1.26 | 109 | −0.11 | 1.28 | 31 |
| Word list learning | −1.31 | 1.39 | 112 | −1.57 | 1.49 | 34 |
| Word list recall | −0.95 | 1.27 | 112 | −1.05 | 1.23 | 34 |
| Word list intrusions | −0.62 | 1.30 | 112 | −0.12 | 1.05 | 34 |
| Word list savings | −0.85 | 2.00 | 110 | −0.80 | 1.81 | 34 |
| Word list discriminability | −0.62 | 1.27 | 112 | −0.83 | 1.23 | 34 |
| Constructional praxis | −0.89 | 1.24 | 111 | −1.13 | 1.40 | 34 |
| Constructional praxis recall | −1.16 | 1.54 | 111 | −1.59 | 2.00 | 34 |
| Constructional praxis savings | −0.54 | 1.18 | 111 | −0.82 | 1.25 | 34 |
| Adjusted Chandler score | 73.12 | 12.00 | 108 | 66.78 | 12.40 | 31 |
| CERAD-NAB (extension) | ||||||
| Letter fluency | −1.12 | 1.30 | 108 | −1.42 | 1.22 | 34 |
| Trail Making Test A | −1.00 | 1.56 | 109 | −1.30 | 1.57 | 32 |
| Trail Making Test B | −1.14 | 1.47 | 101 | −1.48 | 1.32 | 29 |
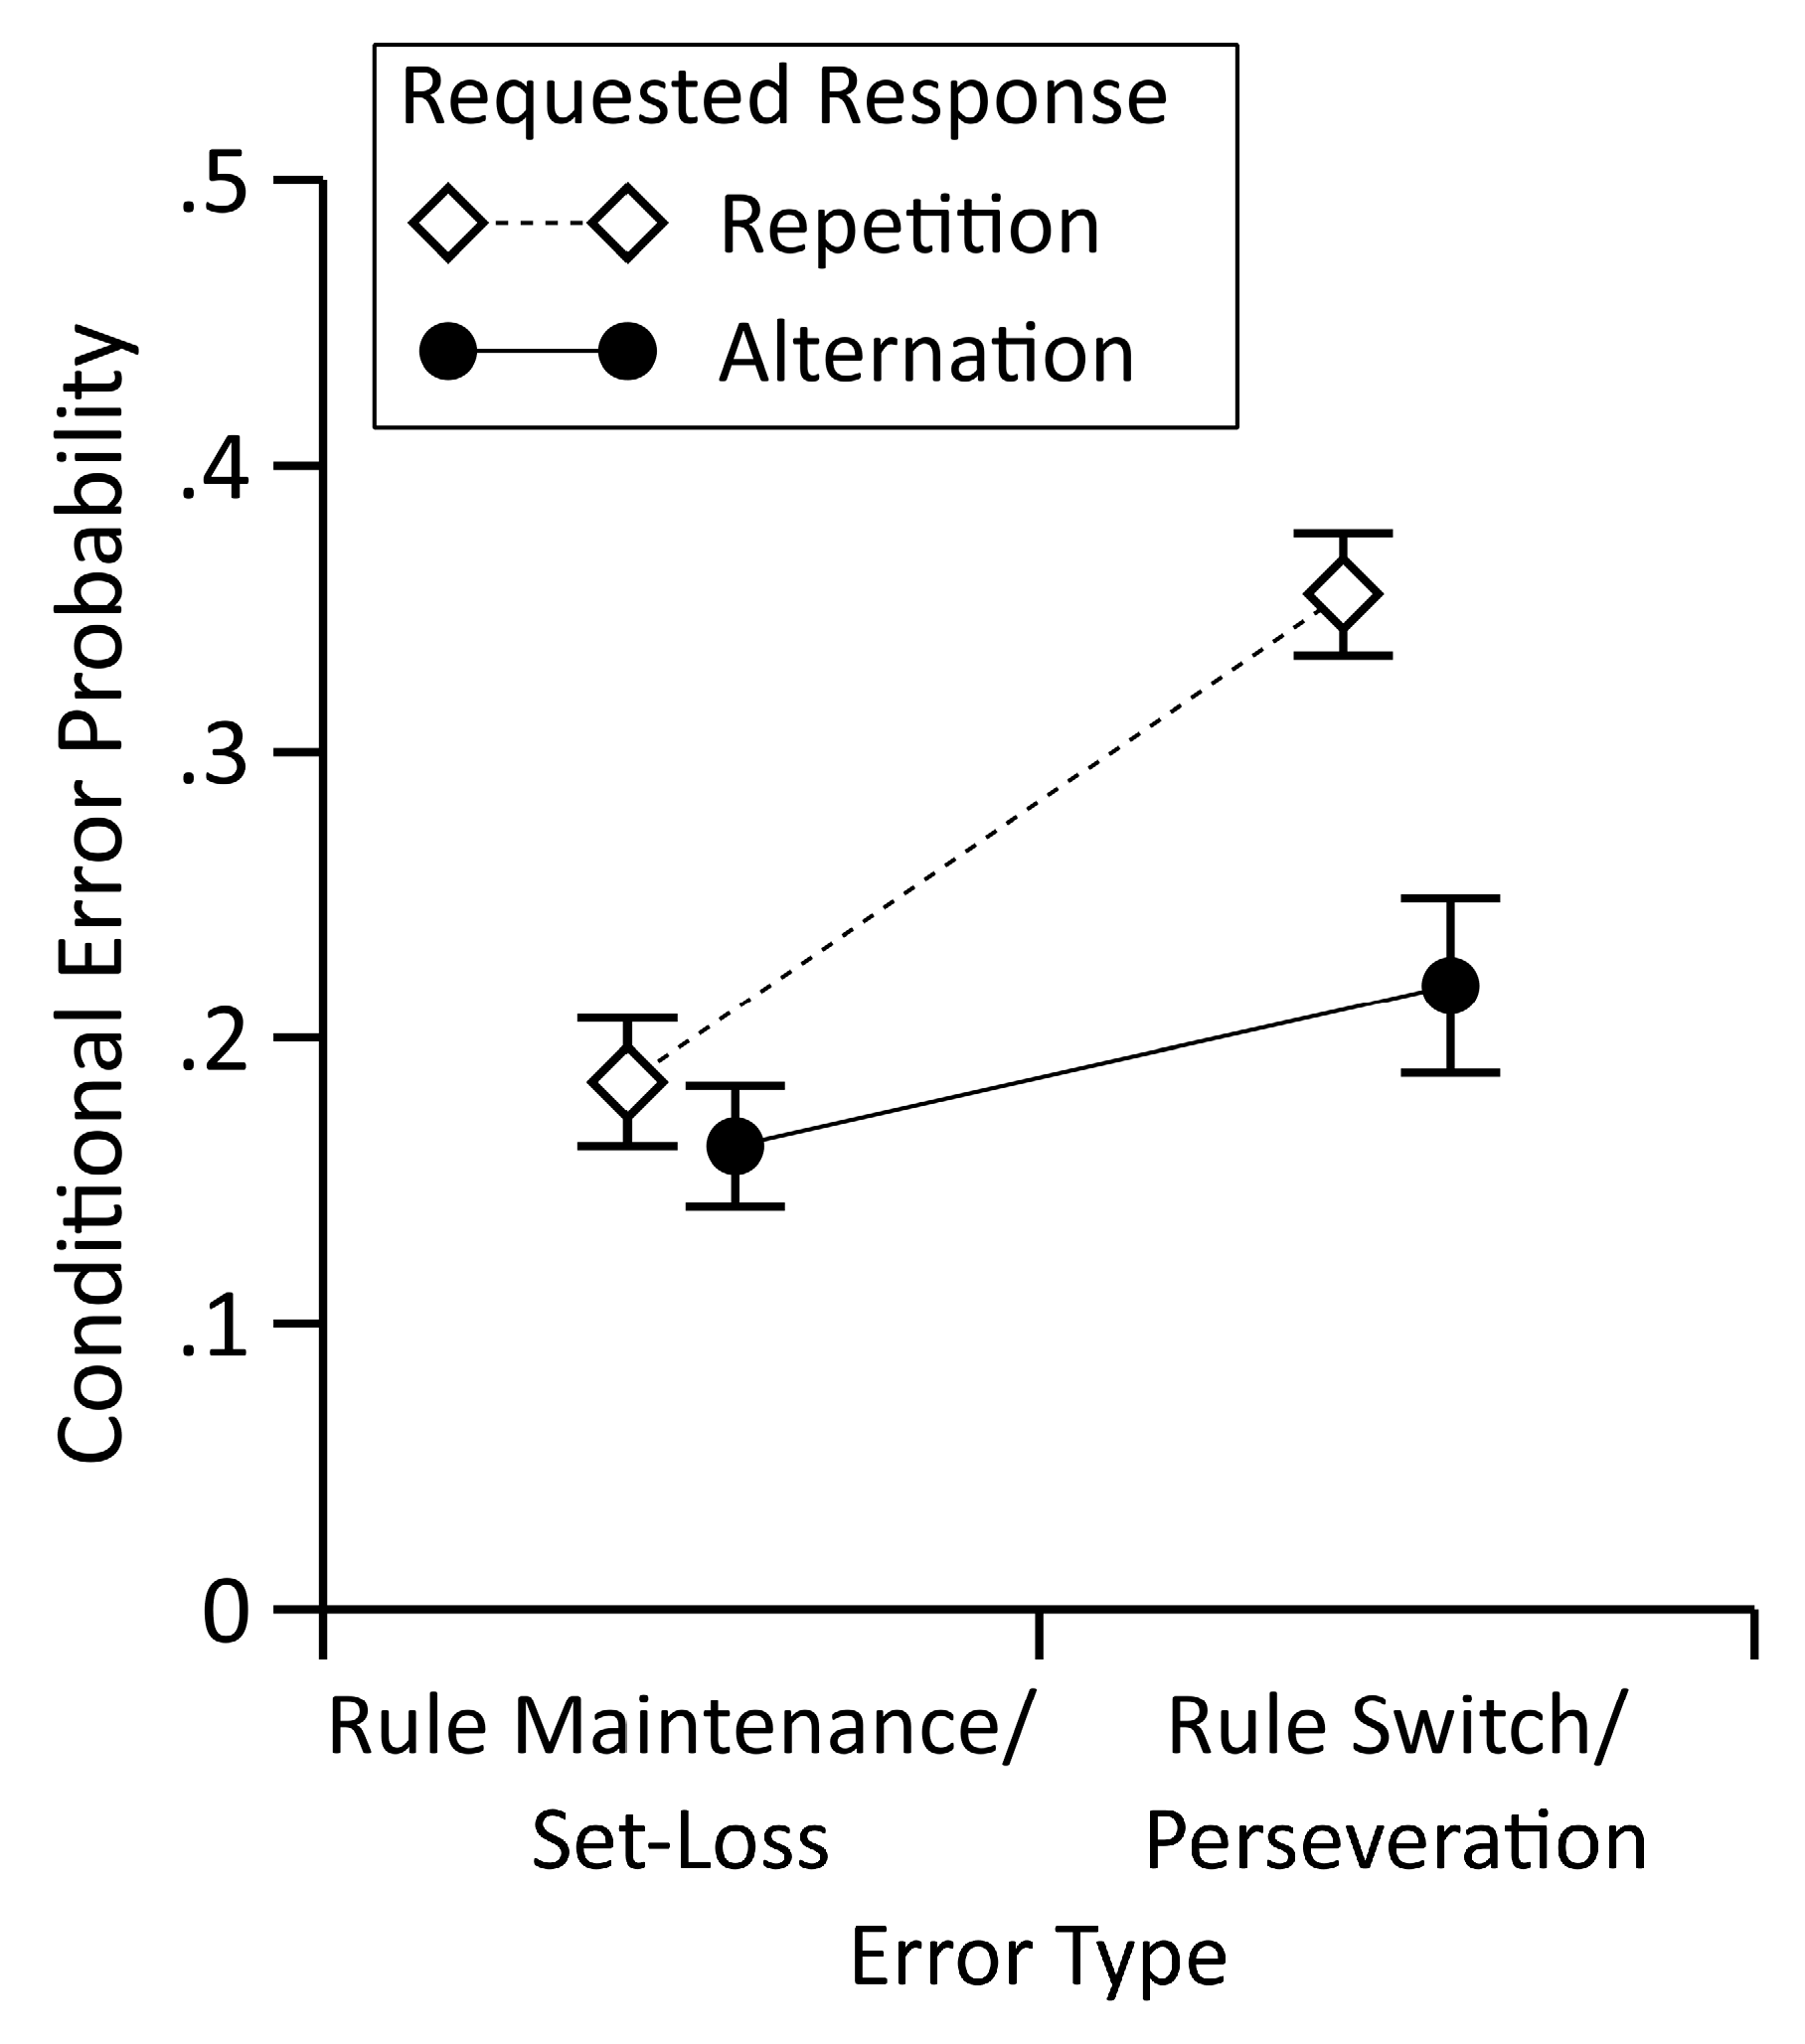
| Requested Rule & Error Type | Rule Maintenance/Set-Loss Error | Rule Switch/Perseveration Error | ||
|---|---|---|---|---|
| Requested Response | Repetition | Alternation | Repetition | Alternation |
| Errors Committed | 1.25 (0.14) | 1.33 (0.15) | 8.55 (0.67) | 0.76 (0.12) |
| Errors Possible | 8.27 (0.31) | 12.25 (0.53) | 20.00 (0.78) | 2.63 (0.15) |
| Conditional Error Probability | 0.18 (0.02) | 0.16 (0.02) | 0.36 (0.02) | 0.22 (0.03) |
| Subtest | Short Description |
|---|---|
| CERAD-NAB (core) Animal fluency | Number of animals within 1 minute |
| Abbreviated Boston Naming Test | Number of correctly named objects (max. = 15) |
| Word list learning | Immediate recall of 10 words, three repetitions (max. = 30) |
| Word list recall | Delayed recall of 10 words (max. = 10) |
| Word list intrusions | Number of erroneously recalled words on all Word list learning and Word list recall trials |
| Word list savings | |
| Word list discriminability | Recognition of 10 words on a 20 words list (includes 10 distractors) (max. = 10) |
| Constructional praxis | Copying of four geometrical forms (max. = 11) |
| Constructional praxis recall | Delayed recall of four geometrical forms (max. = 11) |
| Constructional praxis savings CERAD-NAB (extension) | |
| Letter fluency | Number of words beginning with letter ‘s’ within 1 minute |
| Trail Making Test A Trail Making Test B | Time needed in seconds (max. = 180 by truncation) Time needed in seconds (max. = 300 by truncation) |
| Spearman Correlation Coefficients (rs) for Perseveration Errors | Difference in Correlation Coefficients (z) Δ | |||
|---|---|---|---|---|
| Requested Response | ||||
| n | Repetition | Alternation | ||
| CERAD-NAB (core) | ||||
| Animal fluency | 108 | −0.34 * | −0.40 * | 0.63 |
| Abbreviated Boston Naming Test | 109 | −0.32 * | −0.09 | −2.30 * |
| Word list learning | 112 | −0.34 * | −0.29 * | −0.61 |
| Word list recall | 112 | −0.34 * | −0.29 * | −0.54 |
| Word list intrusions | 112 | 0.19 * | 0.23 * | −0.39 |
| Word list savings | 110 | −0.24 * | −0.22 * | −0.23 |
| Word list discriminability | 112 | −0.22 * | −0.14 | −0.75 |
| Constructional praxis | 111 | −0.39 * | −0.27 * | −1.32 |
| Constructional praxis recall | 111 | −0.46 * | −0.43 * | −0.42 |
| Constructional praxis savings | 111 | −0.31 * | −0.32 * | 0.11 |
| Adjusted Chandler score | 108 | −0.44 * | −0.42 * | −0.29 |
| CERAD-NAB (extension) | ||||
| Letter fluency | 108 | −0.36 * | −0.41 * | 0.54 |
| Trail Making Test A | 109 | 0.50 * | 0.38 * | 1.40 |
| Trail Making Test B | 101 | 0.55 * | 0.46 * | 0.97 |
| Age | 112 | 0.32 * | 0.34 * | −0.17 |
| Years of education | 112 | −0.34 * | −0.14 * | −2.09 * |
© 2019 by the authors. Licensee MDPI, Basel, Switzerland. This article is an open access article distributed under the terms and conditions of the Creative Commons Attribution (CC BY) license (http://creativecommons.org/licenses/by/4.0/).
Share and Cite
Kopp, B.; Steinke, A.; Bertram, M.; Skripuletz, T.; Lange, F. Multiple Levels of Control Processes for Wisconsin Card Sorts: An Observational Study. Brain Sci. 2019, 9, 141. https://doi.org/10.3390/brainsci9060141
Kopp B, Steinke A, Bertram M, Skripuletz T, Lange F. Multiple Levels of Control Processes for Wisconsin Card Sorts: An Observational Study. Brain Sciences. 2019; 9(6):141. https://doi.org/10.3390/brainsci9060141
Chicago/Turabian StyleKopp, Bruno, Alexander Steinke, Malte Bertram, Thomas Skripuletz, and Florian Lange. 2019. "Multiple Levels of Control Processes for Wisconsin Card Sorts: An Observational Study" Brain Sciences 9, no. 6: 141. https://doi.org/10.3390/brainsci9060141
APA StyleKopp, B., Steinke, A., Bertram, M., Skripuletz, T., & Lange, F. (2019). Multiple Levels of Control Processes for Wisconsin Card Sorts: An Observational Study. Brain Sciences, 9(6), 141. https://doi.org/10.3390/brainsci9060141