Article

Evaluation of Microglia/Macrophage Cells from Rat Striatum and Prefrontal Cortex Reveals Differential Expression of Inflammatory-Related mRNA after Methamphetamine

Department of Pharmacology and Toxicology, Indiana University School of Medicine, Indianapolis, IN 46202, USA
*
Author to whom correspondence should be addressed.
Brain Sci. 2019, 9(12), 340; https://doi.org/10.3390/brainsci9120340
Submission received: 24 October 2019 / Revised: 19 November 2019 / Accepted: 20 November 2019 / Published: 25 November 2019

Abstract

:
RNA sequencing (RNAseq) can be a powerful tool in the identification of transcriptional changes after drug treatment. RNAseq was utilized to determine expression changes in Fluorescence-activated cell sorted (FACS) CD11b/c+ cells from the striatum (STR) and prefrontal cortex (PFC) of male Sprague-Dawley rats after a methamphetamine (METH) binge dosing regimen. Resident microglia and infiltrating macrophages were collected 2 h or 3 days after drug administration. Gene expression changes indicated there was an increase toward an overall pro-inflammatory state, or M1 polarization, along with what appears to be a subset of cells that differentiated toward the anti-inflammatory M2 polarization. In general, there were significantly more mRNA expression changes in the STR than the PFC and more at 2 h post-binge METH than at 3 days post-binge METH. Additionally, Ingenuity® Pathway Analysis along with details of RNA expression changes revealed cyclo-oxygenase 2 (COX2)-driven prostaglandin (PG) E2 synthesis, glutamine uptake, and the Nuclear factor erythroid2-related factor 2 (NRF2) canonical pathway in microglia were associated with the binge administration regimen of METH.

1. Introduction

Methamphetamine (METH) is known to induce neuroinflammation. Resident glial cells, including microglia [1,2,3] and astrocytes [4,5,6] in the brain are implicated in contributing to this METH-induced neuroinflammation via production and release of a variety of inflammatory mediators, such as interleukin (IL) 1β [7,8], IL6 [9,10], tumor necrosis factor (TNF) α [11], C-C motif chemokine ligand 2 (CCL2) [12], reactive oxygen species (ROS) [13,14], and nitric oxide [15]. Inducible enzymes that can lead to the production of additional inflammatory mediators in these glial cells, such as COX2 [16,17], have also been implicated. However, the specific cellular origin of these pro-inflammatory mediators has yet to be defined.
The canonical role of central nervous system (CNS)-resident microglia is to serve as sentinels to detect disturbances in the chemical environment around neurons and to respond to these disturbances. In their response to locally detected lipopolysaccharide (LPS) or interferon-gamma (INF-γ), microglia can take on the role known as the M1 phenotype. As an activated M1 microglia, the microglia produce and release pro-inflammatory mediators. In contrast, microglia can take on an M2 phenotype if stimulated locally by IL4 or IL13. In this state of activation, the microglial cell produces and releases mediators such as IL10, which can serve as an anti-inflammatory signal to initiate recovery from an insult.
The current study focused on the role of microglia at 2 h and 3 days after administration of neurotoxic binge doses of METH to evaluate time-dependent, acute, and persistent changes in gene transcription within microglia and infiltrating macrophages. We evaluated changes in gene transcription in the rat striatum (STR) and prefrontal cortex (PFC), areas associated with controlling voluntary movement, reward, motivation, and executive functions such as planning and decision-making [18,19,20,21], all of which are affected by METH [22,23,24,25].

2. Materials and Methods

2.1. Animals

All experiments were conducted with approval of the Institutional Animal Care and Use Committee at the Indiana University School of Medicine and performed in American Association for Laboratory Animal Care (AALAC)-approved facilities. Male Sprague-Dawley rats were purchased from Envigo (Indianapolis, IN, USA) and received food and water ad libitum. After a period of acclimation, the rats were randomly divided into either control (saline) or treated (METH) groups. Methamphetamine (METH) HCl was from Sigma-Aldrich (St. Louis, MO, USA, Catalog #M-8750). A 10 mg/mL METH solution was prepared the day of injections in sterile-filtered 0.9% w/v sodium chloride (saline). Rats received intraperitoneal (i.p.) injections of either saline or 10 mg/mL METH at a volume equal to 1 mL/kg (10 mg METH/kg body mass). Injections were given at 2 h intervals over 8 h for a total of 4 injections. Rats were housed individually during the injections in plastic shoebox-style containers with a wire lid. Food and water were available ad libitum. A plastic grate was placed on top of the bedding inside the container to prevent aspiration of bedding material. Body temperature was monitored at 15–30 min intervals throughout the injection period and for 1–2 h after the final injection via a subcutaneously-implanted temperature transponder (Bio Medic Data Systems, Inc., Seaford, DE, USA, Catalog # IPTT 300). If a rat’s body temperature exceeded 40 °C, measures were taken (oscillating fan, ice packs on cage lid) to prevent hyperthermia. At either 2 h or 3 days after the last i.p. injection, each rat was deeply anesthetized with an i.p. injection of a ketamine (Henry Schein, Indianapolis, IN USA, KetathesiaTM 100 mg/mL)/xylazine (Akorn Pharmaceuticals, Decatur, IL, USA, AnaSed® Injection 20 mg/mL) 70%/30% v/v mix. Once a rat had no response to a toe-pinch, the chest cavity was opened and 0.35 mL heparin (Sagent Pharmaceuticals, Inc, Schaumburg, IL, USA, 1000 USP units/mL) was injected into the left ventricle, followed by perfusion with ice-cold phosphate-buffered saline (PBS). Blood and PBS exited the body through an incision made in the right atrium. Perfusion continued for 5 min at a flow rate of 20 mL/min. We chose to perfuse with PBS prior to brain extraction to reduce the contribution of circulating macrophages contained within the brain’s capillaries, thereby restricting our collection to Cd11b/c+ cells that reside within the brain parenchyma.
The rat was decapitated via guillotine and the whole brain was removed from the skull. The brain was bisected on ice into its right and left hemispheres via RNase Away®-treated (Thermo Fisher, Waltham, MA, USA, #7005-11) razor blade and the striatum and prefrontal cortex were blunt-dissected from each hemisphere. The two pieces of the same region were combined into a single DNase-free RNase-free 1.5 mL tube containing 200 μL of ice cold dissociation buffer (see below).
The number of rats per group were: 2 h post saline STR (6), 2 h post METH STR (8), 2 h post saline PFC (4), 2 h post METH (5). The respective numbers for the 3 day groups were 6, 7, 6, and 7.

2.2. Buffers and Antibodies for Single-Cell Suspensions

For the mechanical dissociation of STR and PFC to a single-cell suspension, several buffers were prepared. Diethyl pyrocarbonate (DEPC)-phosphate-buffered saline (PBS) pH 7.4 was prepared using DEPC-treated water (Thermo Fisher, AM9922) containing 150 mM sodium chloride (Santa Cruz Biotechnology, Dallas, TX, sc-203274B), 1.5 mM sodium phosphate monobasic (Sigma-Aldrich S-9638), and 17.5 mM sodium phosphate dibasic (Thermo Fisher, S374-1). Dissociation buffer was prepared with DEPC-PBS supplemented with RNase-free DNase (Qiagen, Hilden, Germany) 79254, stock = 2.72 units/μL, final concentration in DEPC-PBS = 40 units/mL) and RNasin® Plus RNase Inhibitor (Promega, Madison, WI, USA, N2615, stock = 40 units/μL, final concentration in DEPC-PBS = 80 units/mL). Blocking buffer consisted of DEPC-PBS with 1% w/v bovine serum albumin (BSA) (Sigma-Aldrich, A3059), 80 units/mL RNasin® Plus RNase Inhibitor and 5% v/v normal mouse serum (Sigma-Aldrich, M5905). Blocked cells were divided, with a fraction of the cells incubated with phycoerythrin (PE)-labeled isotype IgG2a control antibody (Abcam, Cambridge, MA, USA, ab91363) and the remainder of the cells incubated with mouse monoclonal phycoerythrin (PE)-labeled antibody to CD11b/c (Abcam, ab112239) in blocking buffer. For fluorescence activated cell sorting (FACS), stained and washed cells were resuspended in DEPC-PBS with 1% w/v BSA and 80 units/mL RNasin® Plus RNase Inhibitor (Promega).

2.3. Mechanical Dissociation

Keeping the tissue-containing tube on ice, an RNase Away®-treated plastic pestle designed to fit a 1.5 mL tube was used to gently disrupt the tissue to smaller pieces. Another 300 μL ice cold dissociation buffer was added to a final volume of 500 μL. Any remaining tissue chunks were mashed. The suspension was filtered through 100 micron mesh into a clean 1.5 mL DNase-free, RNase-free tube on ice. The filter was washed with another 500 μL dissociation buffer into the same tube. The combined filtrate was centrifuged 5 min 2500× g at 4 °C to pellet the cells. After aspirating the supernatant, the cells were blocked and incubated with PE-labeled CD11b/c+ antibody.

2.4. Blocking and Staining Rat Striatal Cells

One mL of blocking buffer was added to each cell pellet and the cells were resuspended by gentle pipetting. The tubes were closed and rocked for 10 min at room temperature (RT). Fifty μL was removed from each sample and combined in a common tube for gating of cells via flow cytometry (FACS). Another 50 μL was removed from each sample to combine into a negative control for PE nonspecific binding with the PE-labeled isotype control antibody. The remaining 900 μL of cells from each sample were used for PE-labeled CD11b/c antibody labeling. All tubes were spun for 5 min at 2500× g 4 °C to pellet the cells. Supernatant was discarded. Cell pellets from each sample to be incubated with PE-labeled CD11b/c antibody were resuspended in 500 μL of blocking buffer containing 5 μL (0.5 μg) of antibody. A proportionate amount of PE-labeled isotype control antibody was incubated with the resuspended cell pellet for nonspecific PE binding. The resuspended cell pellet that would not receive any antibody was incubated in the same volume of blocking buffer as the isotype control pellet. All tubes were wrapped in foil to protect the fluorescent label from light and rotated end-over-end overnight at 4 °C.

2.5. FACS and RNA Isolation

The next morning, the cells were collected by centrifuging the tubes for 5 min at 2500× g 4 °C. After aspirating the supernatant, each cell pellet was washed twice by resuspending it in 500 μL DEPC-PBS, centrifuging, and aspirating the DEPC-PBS. The final pellet was resuspended in DEPC-PBS + 1% BSA + RNasin® Plus RNase Inhibitor for cell sorting on BD Biosciences FACSAria flow cytometers. 
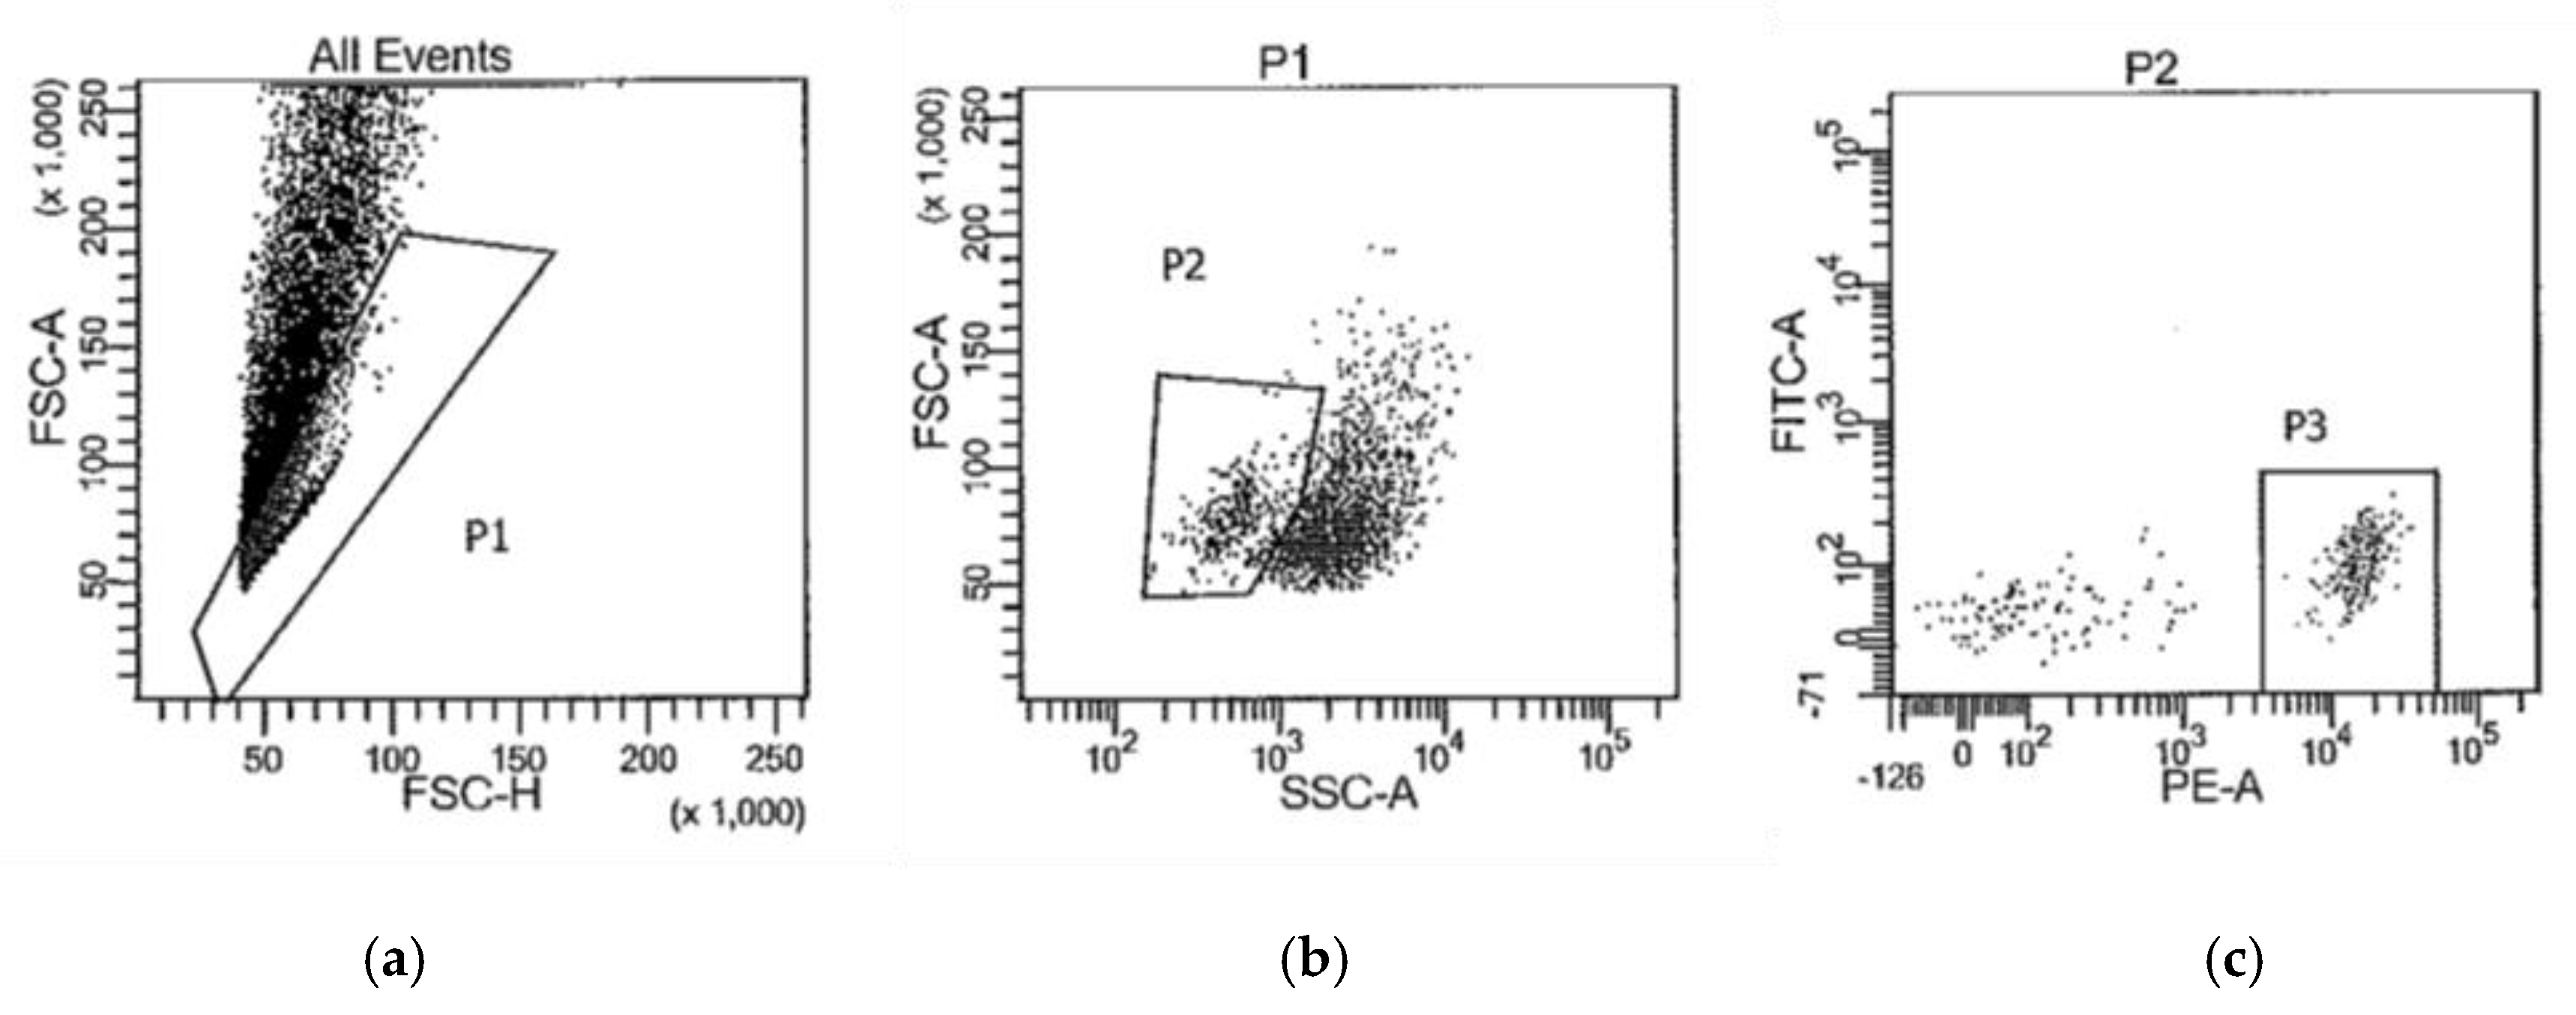
Figure 1 is representative of the gating strategy used to isolate PE-CD11b/c+ cells (P3). The collected CD11b/c+ cells were pelleted by centrifugation at 16,000× g for 5 min at 4 °C. After aspirating the supernatant, the pellet was resuspended in 50 μL Solution XB (ArcturusTM PicoPureTM RNA Isolation Kit, Thermo Fisher, KIT0204) and incubated at 42 °C for 30 min. To remove any insoluble material, the tubes were spun at 3000× g for 2 min and the cleared supernatant was transferred to a clean DNase-free RNase-free 1.5 mL tube. Total RNA was isolated as per the instructions provided with the ArcturusTM PicoPureTM RNA Isolation Kit instructions (ThermoFischer), including optional on-column DNase treatment.

2.6. Clontech SMART-Seq V4 Ultra Low Input RNA Methods for Illumina HiSeq 4000 Sequencing

Purified total RNA was first evaluated for its quantity and quality, using Agilent Bioanalyzer 2100 (Agilent, Santa Clara, CA, USA). One nanogram of total RNA per sample was used for library preparation. cDNA was first synthesized using SMART-Seq v4 Ultra Low Input RNA Kit for Sequencing (Takara Clontech Laboratories, Inc., Mountain View, CA, USA). Dual indexed cDNA library was then prepared using Nextera XT DNA Library Prep Kit (Illumina, Inc., San Diego, CA, USA). Each library was quantified and its quality accessed by Qubit and Agilent Bioanalyzer, and multiple libraries were pooled in equal molarity. The average size of the library insert was about 150–200 b. Five microliters of 2 nM pooled libraries per lane were then denatured, neutralized, and applied to the cBot for flow cell deposition and cluster amplification, before loading on to HiSeq 4000 for 75 b paired-end sequencing (Illumina, Inc.). Each lane generated approximately 300–350 million reads. A Phred quality score (Q score) was used to measure the quality of sequencing. More than 90% of the sequencing reads reached Q30 (99.9% base call accuracy).

2.7. Sequence Alignment and Gene Counts

The sequencing data were first assessed using FastQC (Babraham Bioinformatics, Cambridge, UK) for quality control. All sequenced libraries were mapped to the rat genome (mm10) using STAR RNA-seq aligner [26] with the following parameter: “--outSAMmapqUnique 60”. The reads distribution across the genome was assessed using bamutils (from ngsutils) [27]. Uniquely mapped sequencing reads were assigned to mm10 refGene genes using featureCounts (from subread) [28] with the following parameters: “-s 2 –p –Q 10”. Quality control of sequencing and mapping results were summarized using MultiQC [29]. The data were normalized using the TMM (trimmed mean of M values) method. Differential expression analysis was performed using edgeR [30,31]. False discovery rate (FDR) was computed from p-values using the Benjamini–Hochberg procedure.

2.8. Ingenuity® Pathway Analysis

Ingenuity® Pathway Analysis (IPA®) software (Qiagen, Germantown, MD, USA) was employed to analyze relationships between genes that exhibited significant differential expression (FDR < 0.05) as a result of binge METH treatment.

3. Results

3.1. General Information from RNAseq

As seen in Table 1, we obtained identifiable sequences for around 10,000 genes in each brain region and at each time point. STR appears to yield more genes that were significantly changed by METH treatment than the PFC at both time points. The 2 h post-METH time point revealed the STR had 4483 genes and the PFC had 3118 genes that were significantly changed by METH. By the three-day post-METH time point, only 714 genes reached a significant level of difference in expression and all of those genes were in the STR. Of the 7601 genes significantly changed by METH at the 2 h time point in the combined STR and PFC, 2483 genes were common to both regions, with 1255 of those genes significantly upregulated in both STR and PFC and 1223 significantly downregulated in both regions, considering all significant fold-changes (Figure 2a). The remaining five common genes are listed in Table 2. Four genes (Plau, Itgb3, Tmem120a, Msto1) were significantly downregulated in PFC while significantly upregulated in the STR and 1 gene (Grik5) was significantly upregulated in the PFC while significantly downregulated in the STR. When fold-change values are restricted to those at least two-fold (Figure 2b), the number of significantly changed genes common to both the STR and PFC is reduced from 2483 to 779. Of those 779 genes, 435 are upregulated in both STR and PFC, while 342 are downregulated. Plau and Grik2 remain present as genes significantly expressed in opposing directions between the two brain regions. Note that the majority of the significant changes were less than two-fold up or down across all comparisons.
There were 355 genes in the STR that were significantly changed at both the 2 h and 3 day time points. Of these 355 genes, 96 were upregulated at both time points, 70 were downregulated, 80 were up- then down-regulated and 109 were down- then upregulated. When restricted to fold changes >2 or <−2, the number of genes fell to 6, 6, 5, and 4, respectively (Table 3).
Table 4 lists the IPA® results of all genes with an FDR <0.05 in the STR or PFC at each time point regardless of the degree of fold-change. At the 2 h time point, changes in gene expression induced by binge METH in the STR and in the PFC share unfolded protein response as one of the top five canonical pathways. Lipopolysaccharide and platelet-derived growth factor beta-beta (PDGF BB) are common to both regions as the top five upstream regulators. STR and PFC share three of the five top molecular and cellular functions (cell death and survival, cellular movement, cellular development). However, at 3 days post-METH, the IPA® of the gene expression patterns dramatically changed in the STR. At 2 h post-METH, the apparent emphasis of cellular functions was focused on more “macro” processes such as cell development, movement, and death/survival. By 3 days post-METH, the cellular function switched to more “micro” processes devoted to transcription and translation. Since there were no longer any detectable gene expression changes in the PFC at the 3 day time point, no IPA® at this time point could be performed.
Table 5 summarizes IPA® results using the RNAseq data for the 355 genes significantly expressed in STR at both 2 h and 3 days post-binge METH with no restrictions on the fold-change. For the subset of genes in the STR significantly upregulated at both time points, there is an emphasis on pathways connected to gene and protein expression that influence cell morphology and cell-to-cell interaction after binge METH. Pathways that reveal a consistent downregulation over time in the STR after binge METH involve tryptophan degradation, nicotinamide adenine dinucleotide (NAD) biosynthesis, and leukotriene biosynthesis. It appears that functions relating to DNA and cell replication are slowed over time by this subset of genes. For the 80 genes initially upregulated significantly at 2 h and then downregulated significantly at 3 days, regulation by NFkB may be involved as three of the five top upstream regulators are IKBKE, RELB, and NFKB2. For the 109 genes initially significantly downregulated at 2 h then upregulated at 3 days, NAD salvage was the top canonical pathway identified.

3.2. RNA Sequencing Data for the Cited Top 25 Genes Enriched in Microglia

Butovsky et al. [32] did an expansive study to create an RNA profile of microglia compared to other monocyte lineage cells and cell lines as well as oligodendrocytes, astrocytes, and neurons. Table 6 presents the current study’s data for the Butovsky et al. list of top 25 genes enriched in naïve CD11b+ FRCLS+ adult mouse whole brain cells (microglia). Since these 25 genes represent a profile of expression that may serve to define microglia vs. other cell types, we did not necessarily expect to find that METH treatment would change the expression levels of these genes. However, 12 of these 25 genes were significantly changed by METH at the 2 h time point with four genes upregulated and eight genes downregulated. Note that P2ry12 was significantly downregulated as reported in association with microglial activation [33]. While we did not study any other cell type other than CD11b/c+ for this study, these “microglia enriched” genes are very highly expressed compared to the average expression level of all 10,839 detected genes. The average log2cpm (counts per million) for all genes was around 3.9 while the average log2cpm for the 24 detected genes listed in Table 6 was close to 9.

3.3. Comparison of RNA Sequencing Data to Gene Markers of Microglia vs. Macrophages

Table 7 contains the average log2cpm expression from our 2 h post-saline or post-METH STR or PFC rat microglia of the top 25 genes designated by Hickman et al. [34] as being genes unique to either microglia isolated via FACS from mouse whole brain or to peritoneal macrophages collected by lavage. While 6 of the cited top 25 unique mouse microglial genes were not found in our set of data, the remaining 19 were present with a log2cpm average of 7.5 to 8.5. Ten of the 25 unique mouse macrophage genes were not present in our data on rats. The remaining 15 genes had an overall average log2cpm around 2.0, a much lower expression than that of the microglial genes.

3.4. Comparison of METH-Induced RNAseq Gene Expression Changes to Reported M1 vs. M2 Polarization Markers

Microglia can be activated from a resting state to an activated state and subsequent polarization by a variety of mediators released by a variety of insults. In broad terms, M1-polarization is characterized as activated microglia which produce and release inflammatory mediators themselves, whereas, M2-polarization is associated with activated microglia producing and releasing mediators which act in a neuroprotective role. Table 8 compares RNAseq data from our 2 h post-METH STR and PFC to 47 genes cited in literature reviews as indicating M1 or M2 polarization of microglia [35,36,37,38,39]. Of these 47 genes, we found 12 genes were significantly changed by binge METH in the same direction as reported in the literature (shaded in green). Five of these 10 genes (Cd32, Cd80, CXCL1, IL1a, IL1b) were associated with M1 polarization while six of the 10 genes (Cd204, Dectin1, Gal3, Ifg1, Il1ra, Mrc1) were associated with M2 polarization. Ptgs2 (COX2) was also upregulated and associated with M1 and M2 polarization [35].
METH is known to upregulate COX2 expression at the RNA [40] and protein levels [17] in rodent brains. One consequence of COX2 upregulation is the enhanced production of PG’s [41,42]. Therefore, we examined the effects of binge-METH on the RNA expression levels of key molecules involved in PG synthesis. As shown in Figure 3, genes whose proteins are involved in the release of arachidonic acid (AA) from cell membranes and the subsequent synthesis of PG’s are upregulated 2 h after binge-METH treatment. Additionally, there appears to be a diversion of AA to PG’s over the cysteinyl leukotrienes (LT) via the corresponding downregulation or lack of detection of genes for the enzymes responsible for LTC4, D4, and E4 synthesis. LTA4 could be directed instead to the production of LTB4 via upregulation of Lta4h.
Figure 4 illustrates that the genes that could yield proteins which enable the specific synthesis of inflammatory mediator PGE2 from PGH2, along with two of the four receptors for PGE2, are upregulated. This hints that exposure to binge METH could elicit an autocrine mechanism to positively feedback onto an inflammatory pathway within CD11b/c+ cells. Since METH treatment does not change Alox5 or Alox12 expression, generation of 5S- and 12S-HETE (Hydroxyeicosatetraenoic acid) may not change, but their ability to possibly function in an autocrine fashion would likely be reduced since the genes for the corresponding receptors, Oxer1 and Gpr31, are respectively not detected or significantly downregulated. Alox15 is not detected; however, expression of the gene for a 15S-HETE receptor, Ppard, is upregulated.

4. Discussion

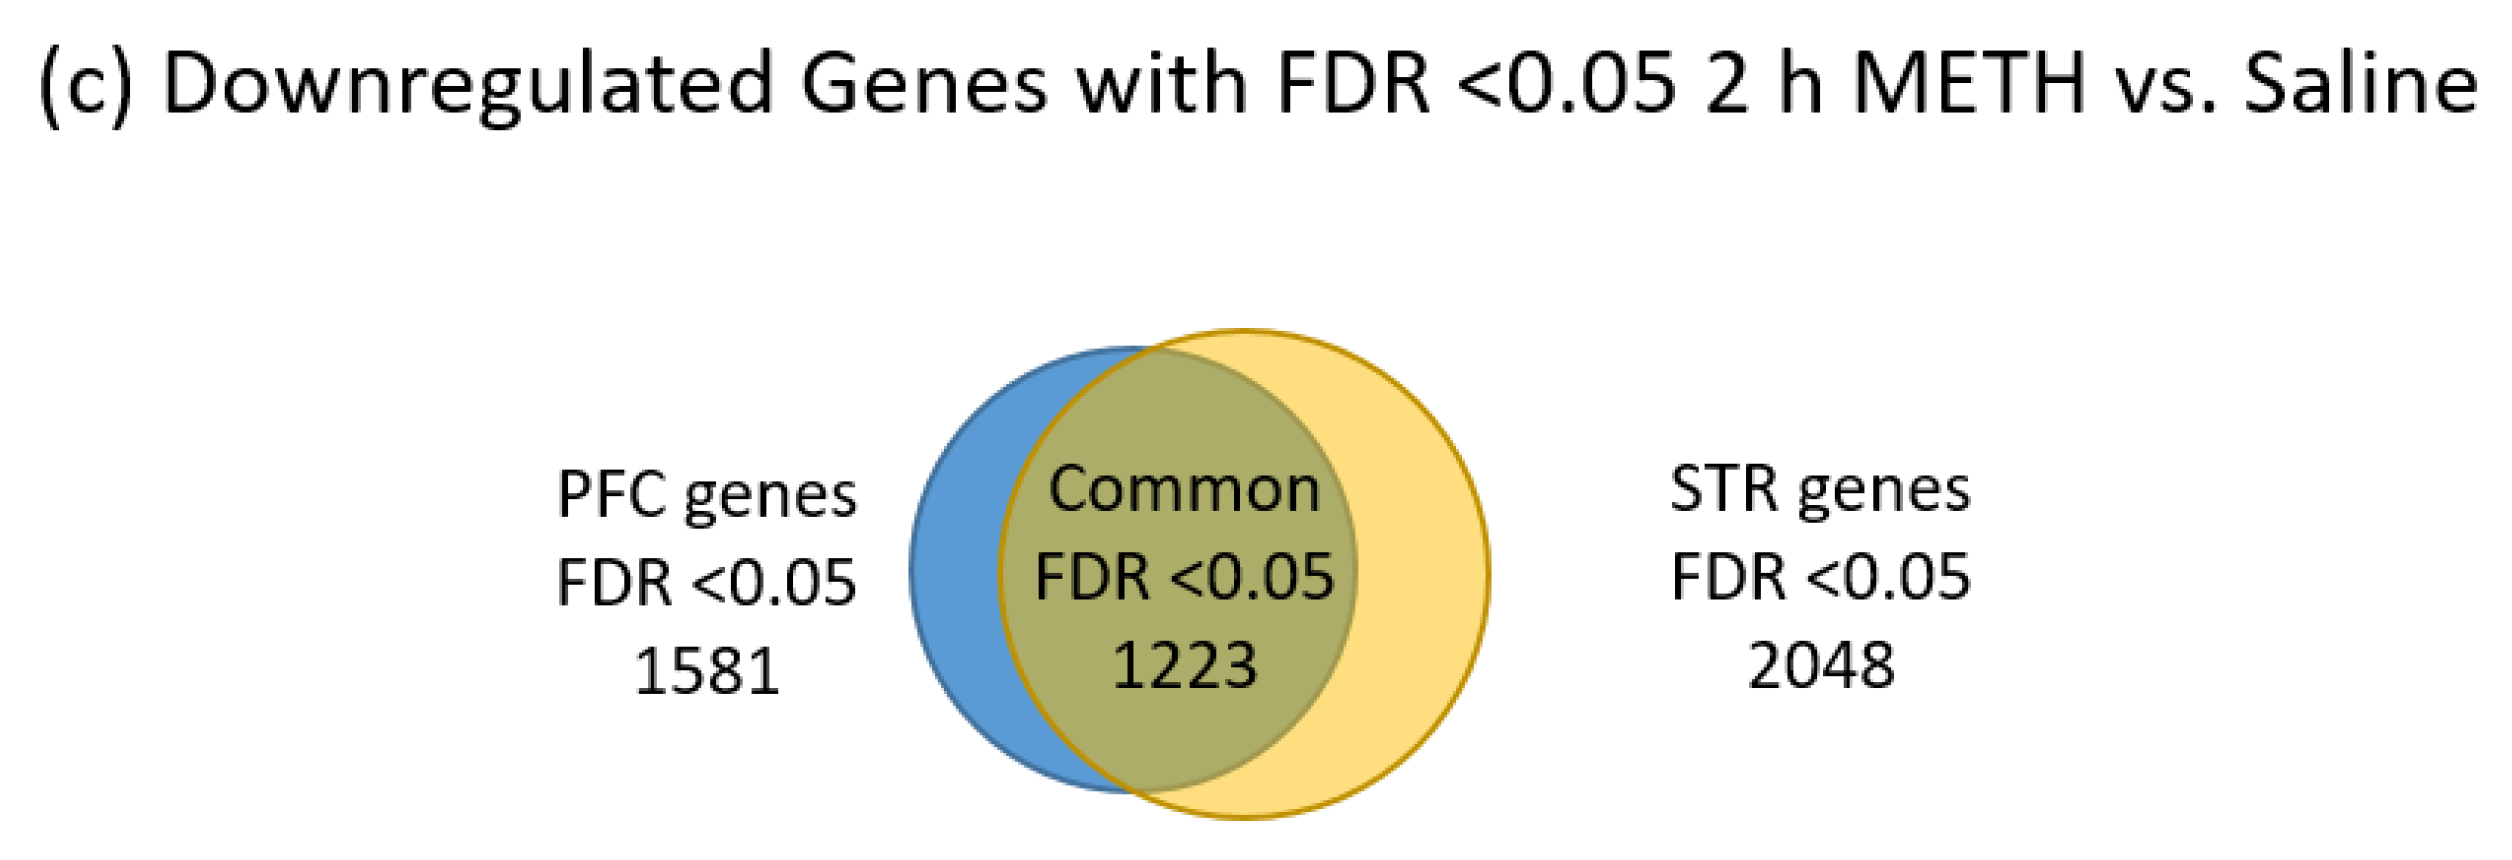
Significant changes in gene expression were found in microglial cells of rat STR and PFC following a binge METH dosing paradigm. These changes are detectable at 2 h after the last dose of METH, with some changes persisting for up to 3 days. About one third of genes changed by binge METH at 2 h after METH are shared by the STR and PFC. However, the microglia from the STR appear to exhibit longer-lasting changes than microglia from the PFC given that the PFC had no significantly changed genes at 3 days after METH. Since genes attributed as being unique to macrophages are either not detected or are present only at very low levels, peripheral macrophages appear to have minimal contribution to the number of CD11b/c+ cells collected from rat STR or PFC at 2 h post saline or METH.
Activation of microglia from the steady-state involves differential gene expression patterns that direct the cell into one of at least two polarizations, the most common designations being M1 and M2. At 2 h post-binge METH, microglia appear to be transitioning from a resting state to an M1 inflammatory-reactive state. Il1b is upregulated 2 h after the last dose of binge METH in both the STR and PFC and emerges as a key marker of such activation. Moreover, P2ry12 was downregulated in both brain regions at 2 h post-binge METH and is consistent with the finding that microglial activation is associated with its downregulation [33]. These findings are in contrast to other known markers of M1 activation (Il6, Tnf, Ccl2, iNos, Nox) that were not changed after METH and suggest that microglia are only in the early stages of responding to the insult of binge METH. Thus, this study provides insight as to how soon microglia respond to binge METH and that IL1β is an early inflammatory mediator produced by microglia after METH exposure. These findings add to a growing body of literature that microglial activation can be further differentiated beyond M1 and M2 that depend on the type of insult [44,45]. More specifically, microglial activation states also differ in rodent models of aging [34], retinal degeneration [38], ischemia [37,46], Alzheimer’s disease [47], Parkinson’s disease [48,49], and binge alcohol consumption [39].
While Tnf RNA expression was not changed in response to binge METH treatment, there were increases in the expression of a specific TNF superfamily member Tnfsf9. Tnfsf9 was upregulated 19.5-fold and 11.5-fold in the STR and PFC, respectively, at 2 h post-binge METH. TNFSF9 is also known as CD137L or 4-1BBL, a transmembrane cytokine expressed on antigen presenting cells (APC), including macrophages [50]. TNFSF9 interacts with its receptor, TNFRSF9 on activated T-cells, and can generate a signaling cascade. Yeo et al. [51] demonstrated that interaction of TNFSF9 on BV2 and N9 cells as well as on primary microglia resulted in responses typically associated with activation of microglia to an inflammatory condition, including generation of reactive oxygen species (ROS). Thus, binge METH may produce a specific upregulation in this one TNF superfamily member which contributes to an M1 inflammatory activation state.
IL1β production after METH can be induced by LPS [52,53] that in turn, can increase the release of PGE2 in a manner attenuated by COX inhibitor indomethacin [54], suggesting of a role for prostaglandins and the arachidonic acid cascade. Furthermore, PGE2 acting through the EP2 receptor was essential for pro-IL1β production induced by LPS in mouse bone-marrow derived macrophages [55]. Along these lines,
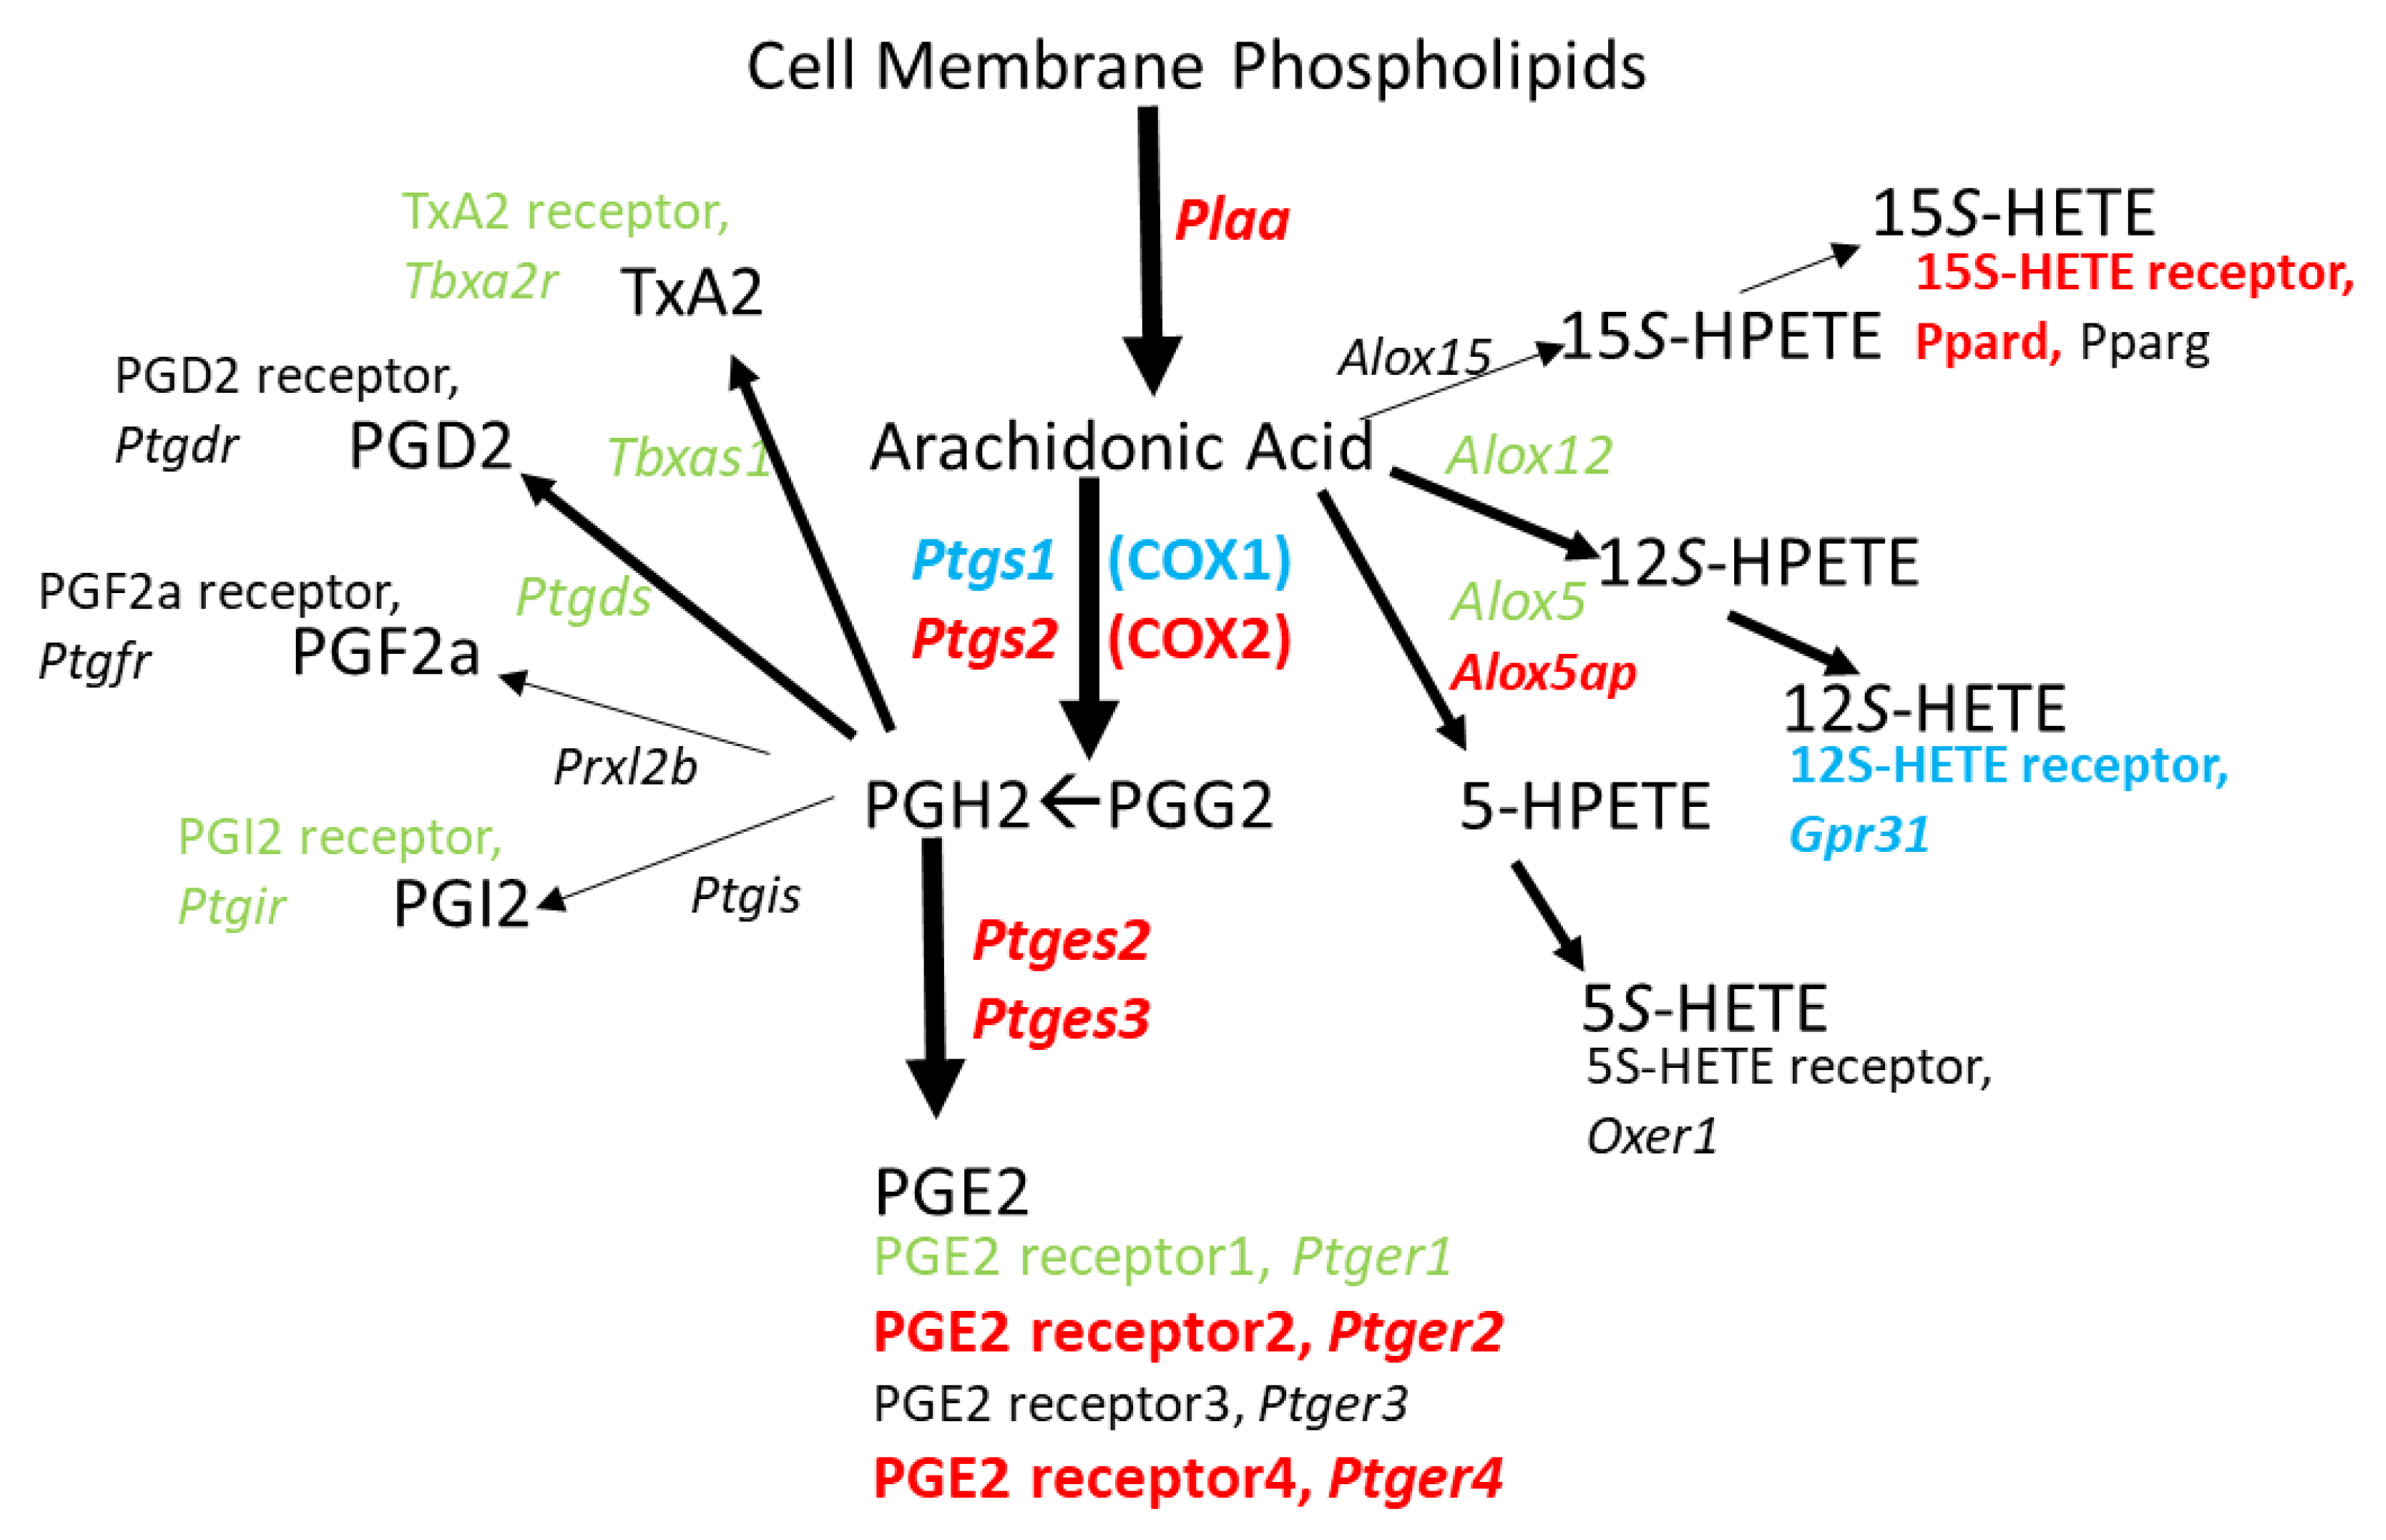
 Figure 3 and Figure 4 illustrate that METH changes expression for a number of genes involved in directing arachidonic acid metabolism toward PGE2 production that could be dependent on LPS derived from a leaky gut. In fact, Persons et al. [56] showed that METH self-administration in Fischer 344 rats resulted in lower expression of gut tight junction proteins claudin-1 and ZO-1 as well as a morphological disorganization of these proteins in the colon. Additionally, human METH users suffer from bowel ischemia which is associated with loss of gut integrity [57,58] that may lead to the entry of LPS into the brain parenchyma as shown in rats following a METH-induced compromise of the blood-brain-barrier [59]. Thus, high doses of METH may promote PGE2 production in brain microglia that exacerbates LPS-induced IL1β production. The enhanced expression of Ptger2 suggested by our current RNAseq data could further promote this cycle by allowing PGE2 to act in an autocrine fashion to induce COX2 expression via EP2 receptor activation [60]. This feed-forward cycle involving LPS, EP2, and COX2 is supported by the observation that EP2-deficient mice have reduced serum levels of inflammatory mediators after the LPS challenge [61]. Moreover, activation of EP2 in cultures of newborn Sprague-Dawley rat cortical microglia with PGE2 or butaprost upregulates mRNA’s encoding COX2 and IL1β, as well as iNOS, and IL6 [62].
Il1r2 had a sharp increase in expression 2 h post-binge METH in both the STR (39-fold) and PFC (131-fold). IL1R2 protein is a membrane-bound decoy receptor for IL1 expressed in mouse neutrophils which under LPS-stimulation was increased to its cleaved soluble form by ADAM17 [63]. Johannson et al. [64] found that Il1r2 RNA expression was enhanced in microglia isolated from adult mouse brains exposed to Aβ peptide. The large increase in Il1r2 expression in microglia 2 h post-binge METH indicates that microglia are similarly responsive to METH. Interestingly, Il1r2 expression was significantly decreased in microglia from mouse brains exposed to Aβ peptide in EP2 knock-out mice vs. wild type EP2 mice [64]. In addition, EP2-/- mice had enhanced microglial Aβ phagocytosis characteristic of M2 anti-inflammatory microglia and a lack of Aβ-activated paracrine neurotoxicity [65]. It is possible that enhanced Ptger2 expression induced by binge METH treatment may serve to enhance Il1r2 expression and suppress transition toward an M2 anti-inflammatory state in the early hours after METH.
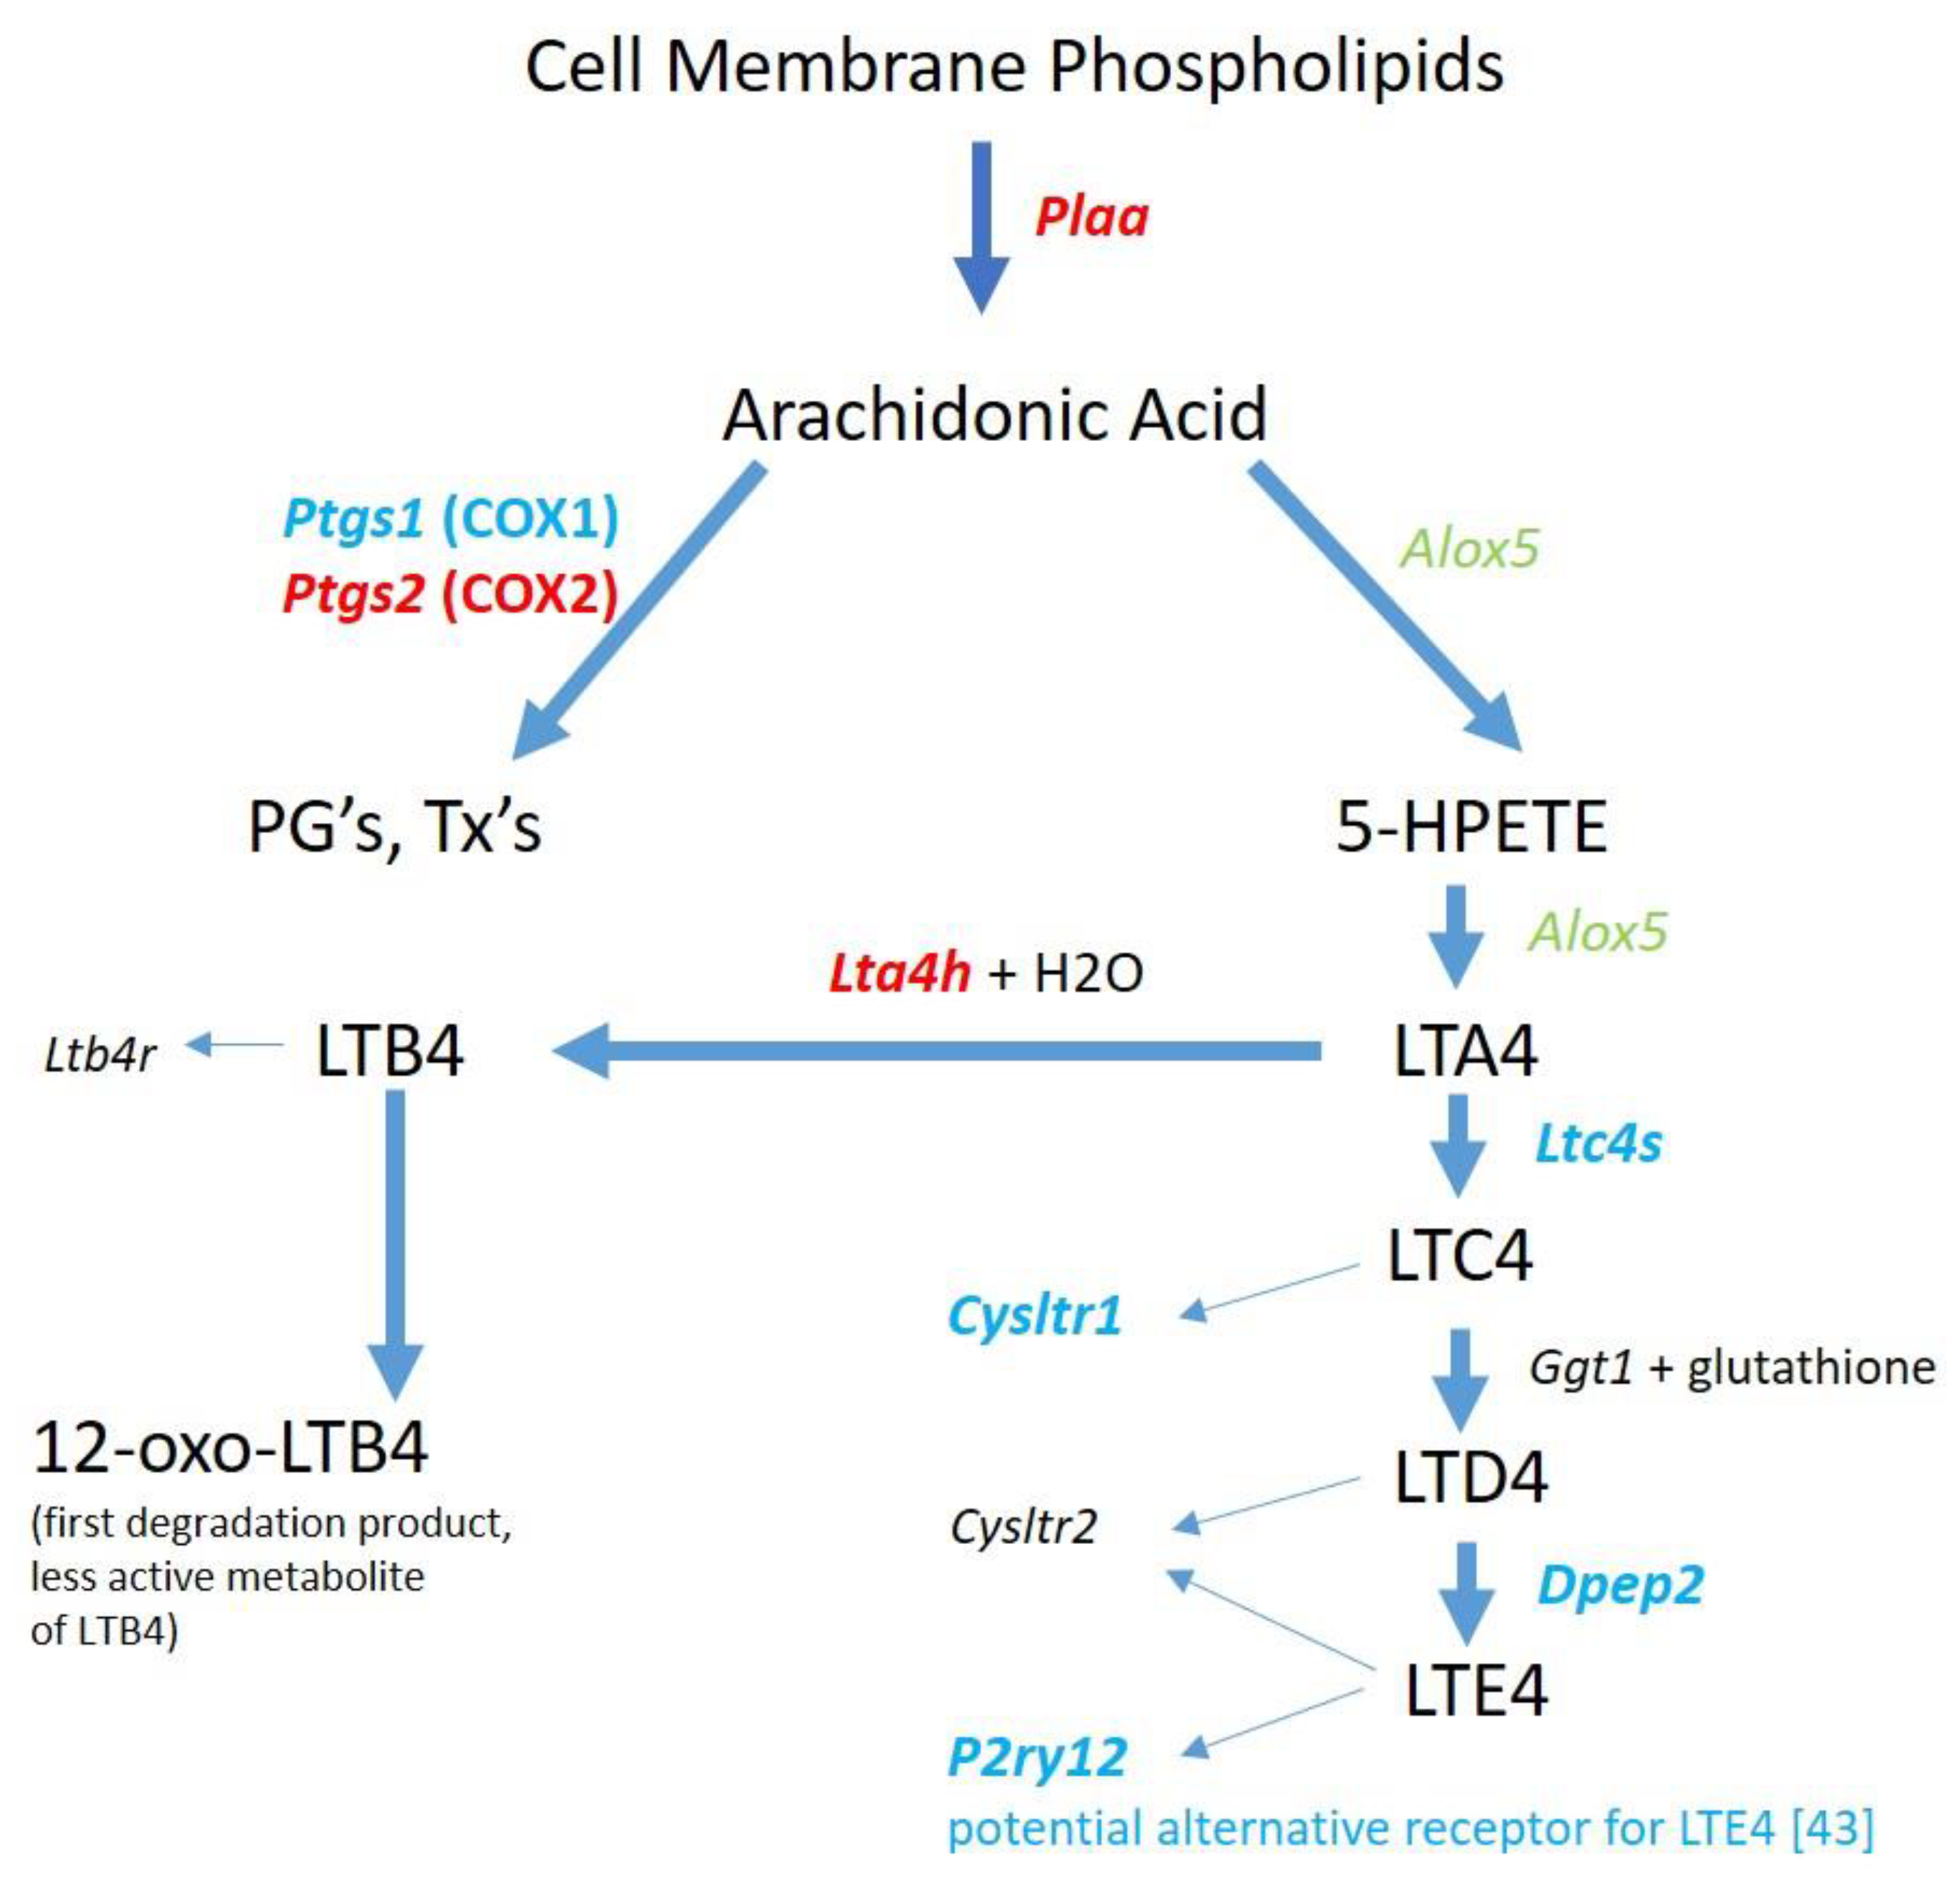
The production of the cysteinyl LT’s from AA may be diminished as illustrated by the gene expression results in Figure 3. However, it is noted that Alox5 is present and Alox5ap is upregulated which could still result in LTA4 synthesis. LTA4 is the precursor to not only the cysteinyl LT’s but also to LTB4. The gene for the enzyme that converts LTA4 to LTB4, Lta4h, is significantly upregulated. LTB4 longevity could be enhanced via the downregulation of Ptgr1, the gene for prostaglandin reductase 1, a key enzyme for inactivating LTB4 as an inflammatory mediator [66]. In models of LPS-induced septic shock, Collin et al. [67] and Kwon et al. [68] demonstrated that inhibition of ALOX5 and antagonism LTB4 receptors, respectively, reduced multiple LPS-induced effects. Saiwai et al. [69] used a model of spinal cord injury and reported that LTB4 receptor inhibition suppressed leukocyte infiltration and attenuated the inflammatory reaction. Since no RNA for LTB4 receptors was detected in the RNAseq data, the potential LTB4 production in microglia from METH-treated rats would not act in an autocrine fashion, but most likely be released to stimulate LTB4 receptors on other cells. Thus, it appears that LTB4 could be a potential contributor to METH-induced inflammation.
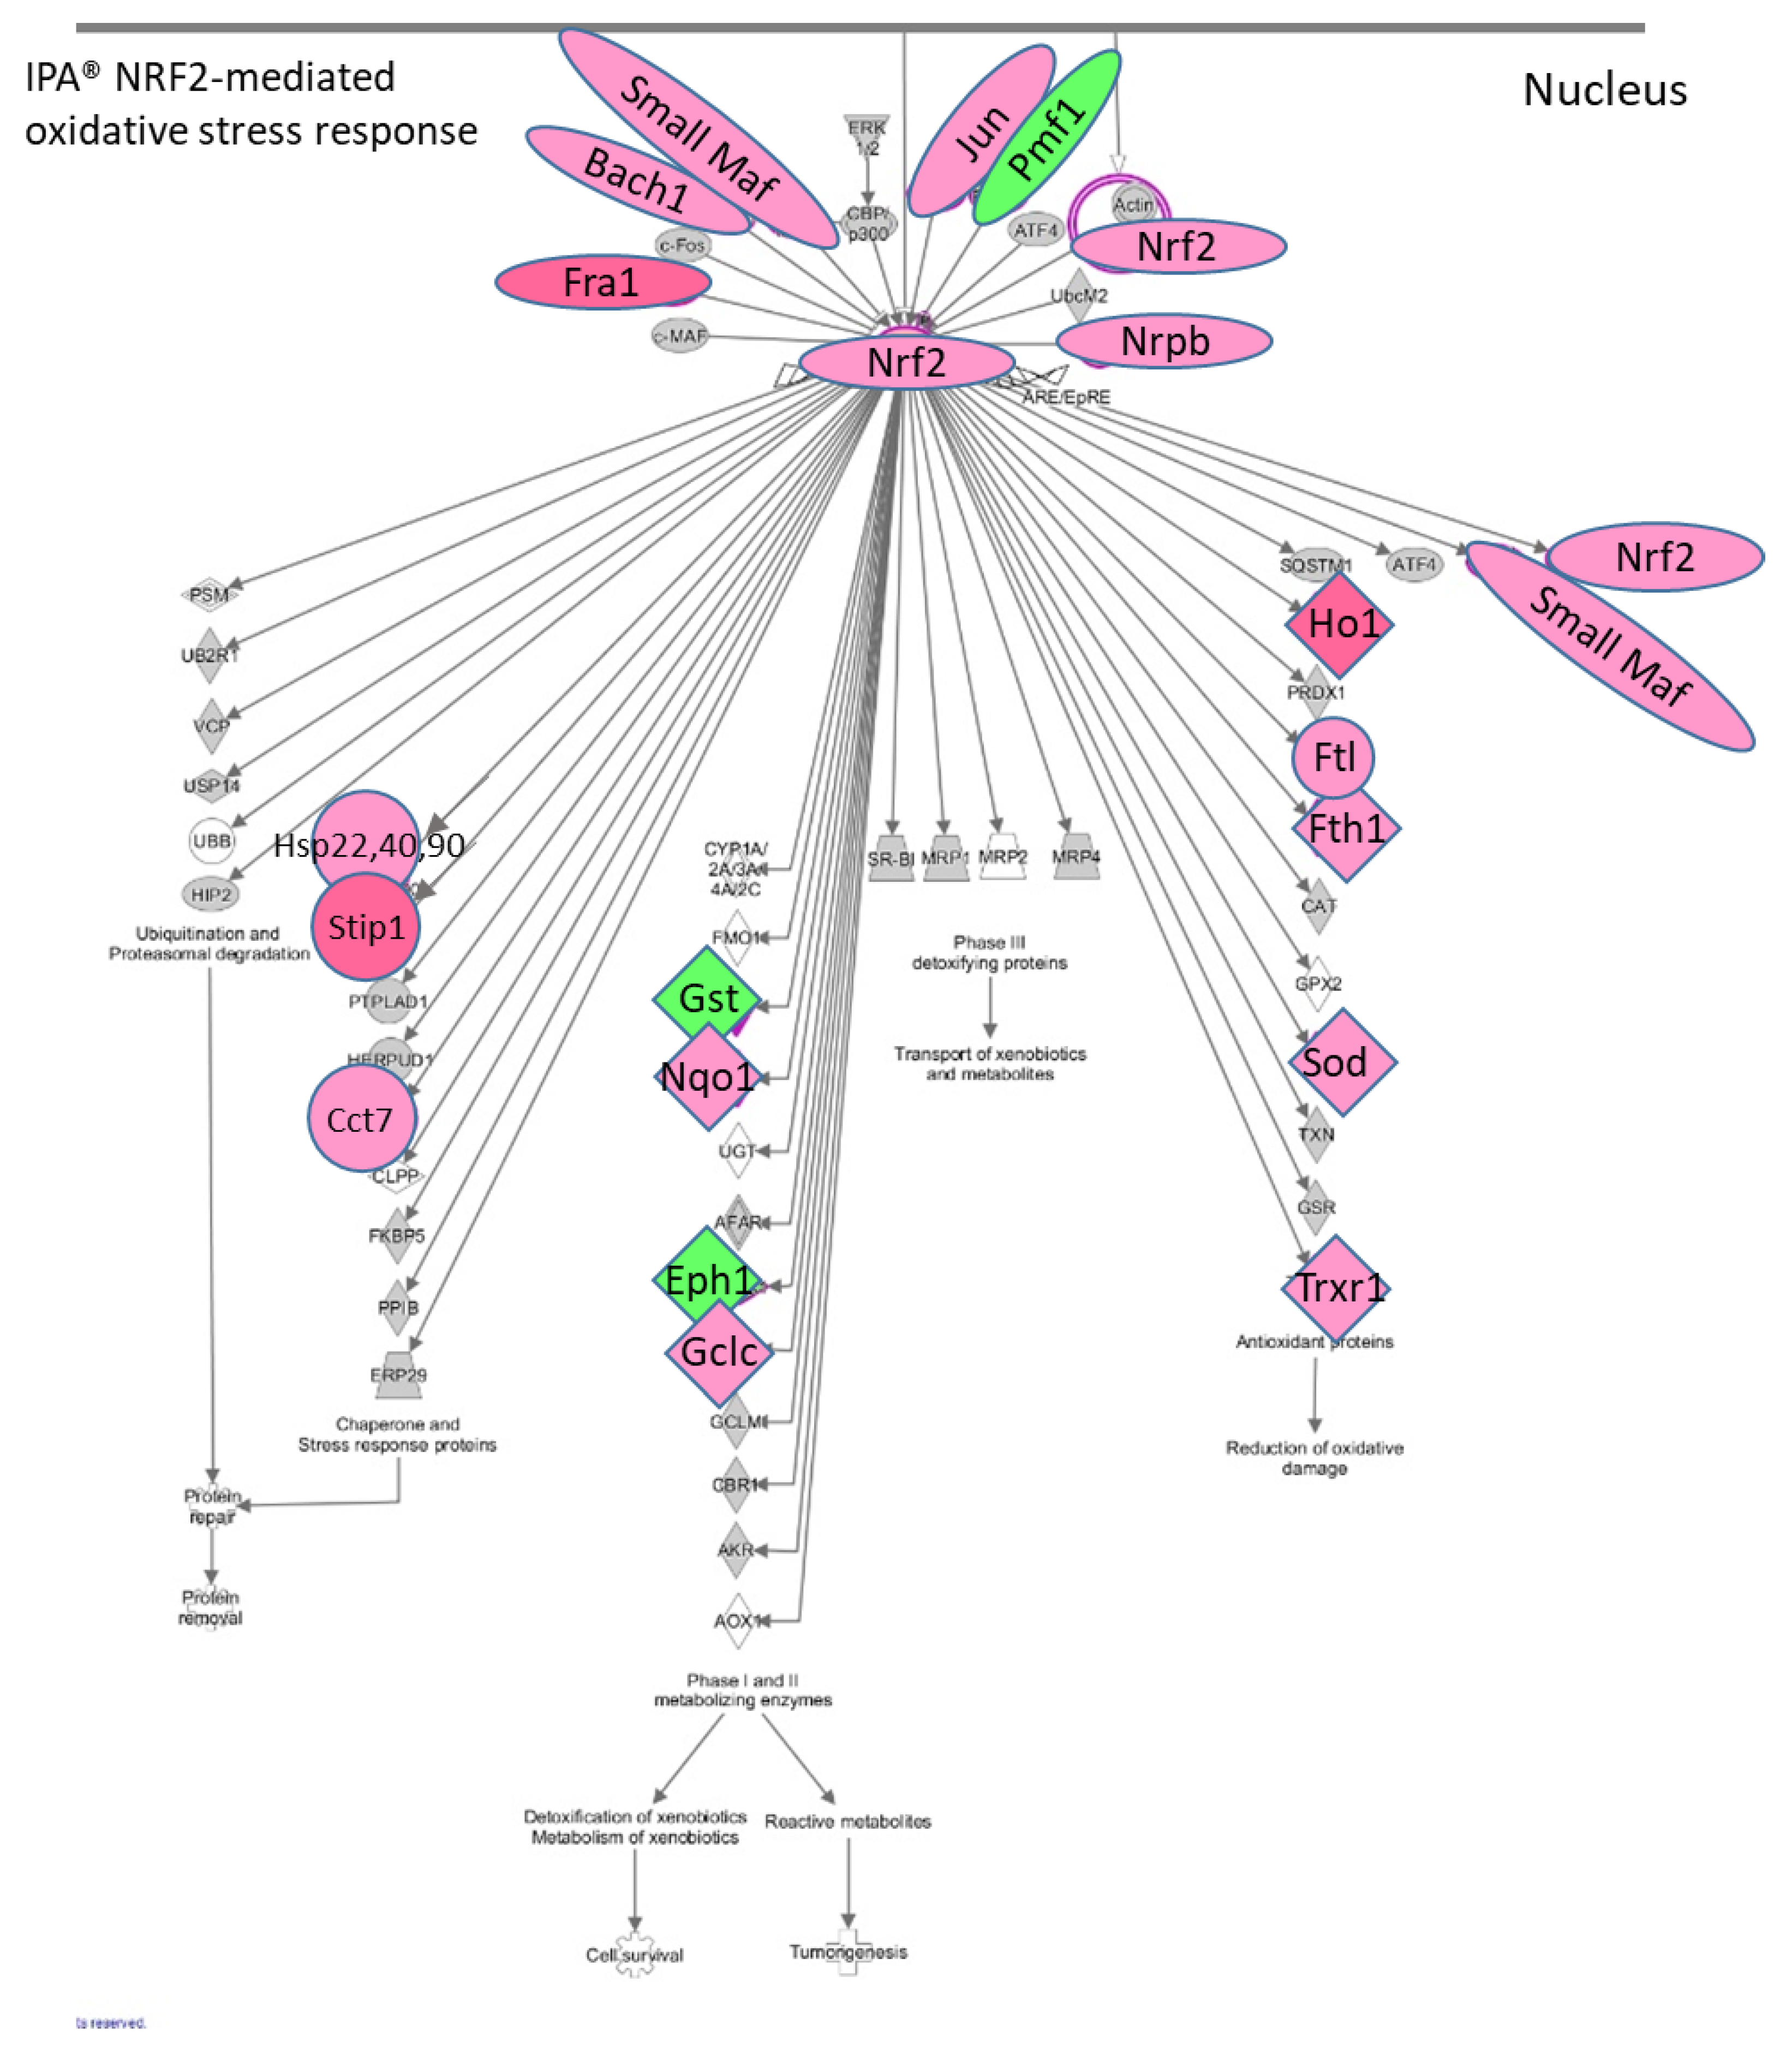
The IPA® results showed that there is an enhancement of the NRF2 (Nuclear factor erythroid 2-related factor 2) (NFE2L2)-mediated canonical pathway in the STR microglia at 2 h post METH. METH is known to induce production of reactive oxygen species [13,70]. The NRF2-mediated pathway is a cellular defense mechanism against oxidative stress (Figure 5). It is noteworthy that among the elements which can activate this pathway are drugs, cytokines, prostaglandins, and bacterial infections. NRF2 appears to be a key connection in the upregulation of Hsp’s 22 (Hspb8), 40 and 90, Stip1, Cct7, Nqo, Gclc, Hmox-1, Ftl, Fth1, Sod1, Txnrd1, small Maf’s (Maff, Mafg, Mafk) as well as Nrf2 itself. Small MAF’s and NRF2 dimerize to form transcriptional activators, suggesting another point of positive feedback in STR after METH and further illustrates the different aspects of microglia activation. More specifically, Hsp-22, Hsp-40 family member genes, and Hsp90 are significantly upregulated 2 h after METH (up to 37-fold) as are Stip1 (16-fold) and Fkbp5 (2-fold). HSP’s are critical to protein folding and maturation. The protein product STIP1 is a co-chaperone for HSP90 and serves as a scaffold for the interaction of HSP90 with HSP70. HSP90 ATPase activity is inhibited by PTGES3 by its binding to the closed conformation of dimeric HSP90 and delaying release of a client protein [71]. Ptges3 is significantly upregulated over 2-fold in both the STR and PFC 2 h post METH (Table S2). Thus, protein products of Ptges3 may serve two roles by promoting the synthesis of PGE2 and by influencing the maturation and folding of proteins.
CCT‘s, chaperonin containing TCP1 complexes, are also involved in the folding of proteins, including actin and tubulin. Cct7, the gene for molecular chaperone subunit 7 of CCT, was significantly upregulated in both the STR and PFC, 3.0- and 2.8-fold, respectively. LPS has been shown to stimulate rearrangement of actin within primary cultures of peritoneal rat macrophages [72] and rat neonatal microglia [73], which can be associated with changes in microglial morphology associated with activation. Thus, upregulation of Cct7 may be associated with the folding of cytoskeletal proteins linked to changes in morphology of microglia after activation.
Several genes upregulated by NFR2 are associated with detoxification of reactive species. Nqo upregulation would result in expression of a protein that serves to detoxify reactive quinone species. Dopamine quinone formation is induced by METH in dopaminergic neurons [74,75] and can activate microglia [76]. 
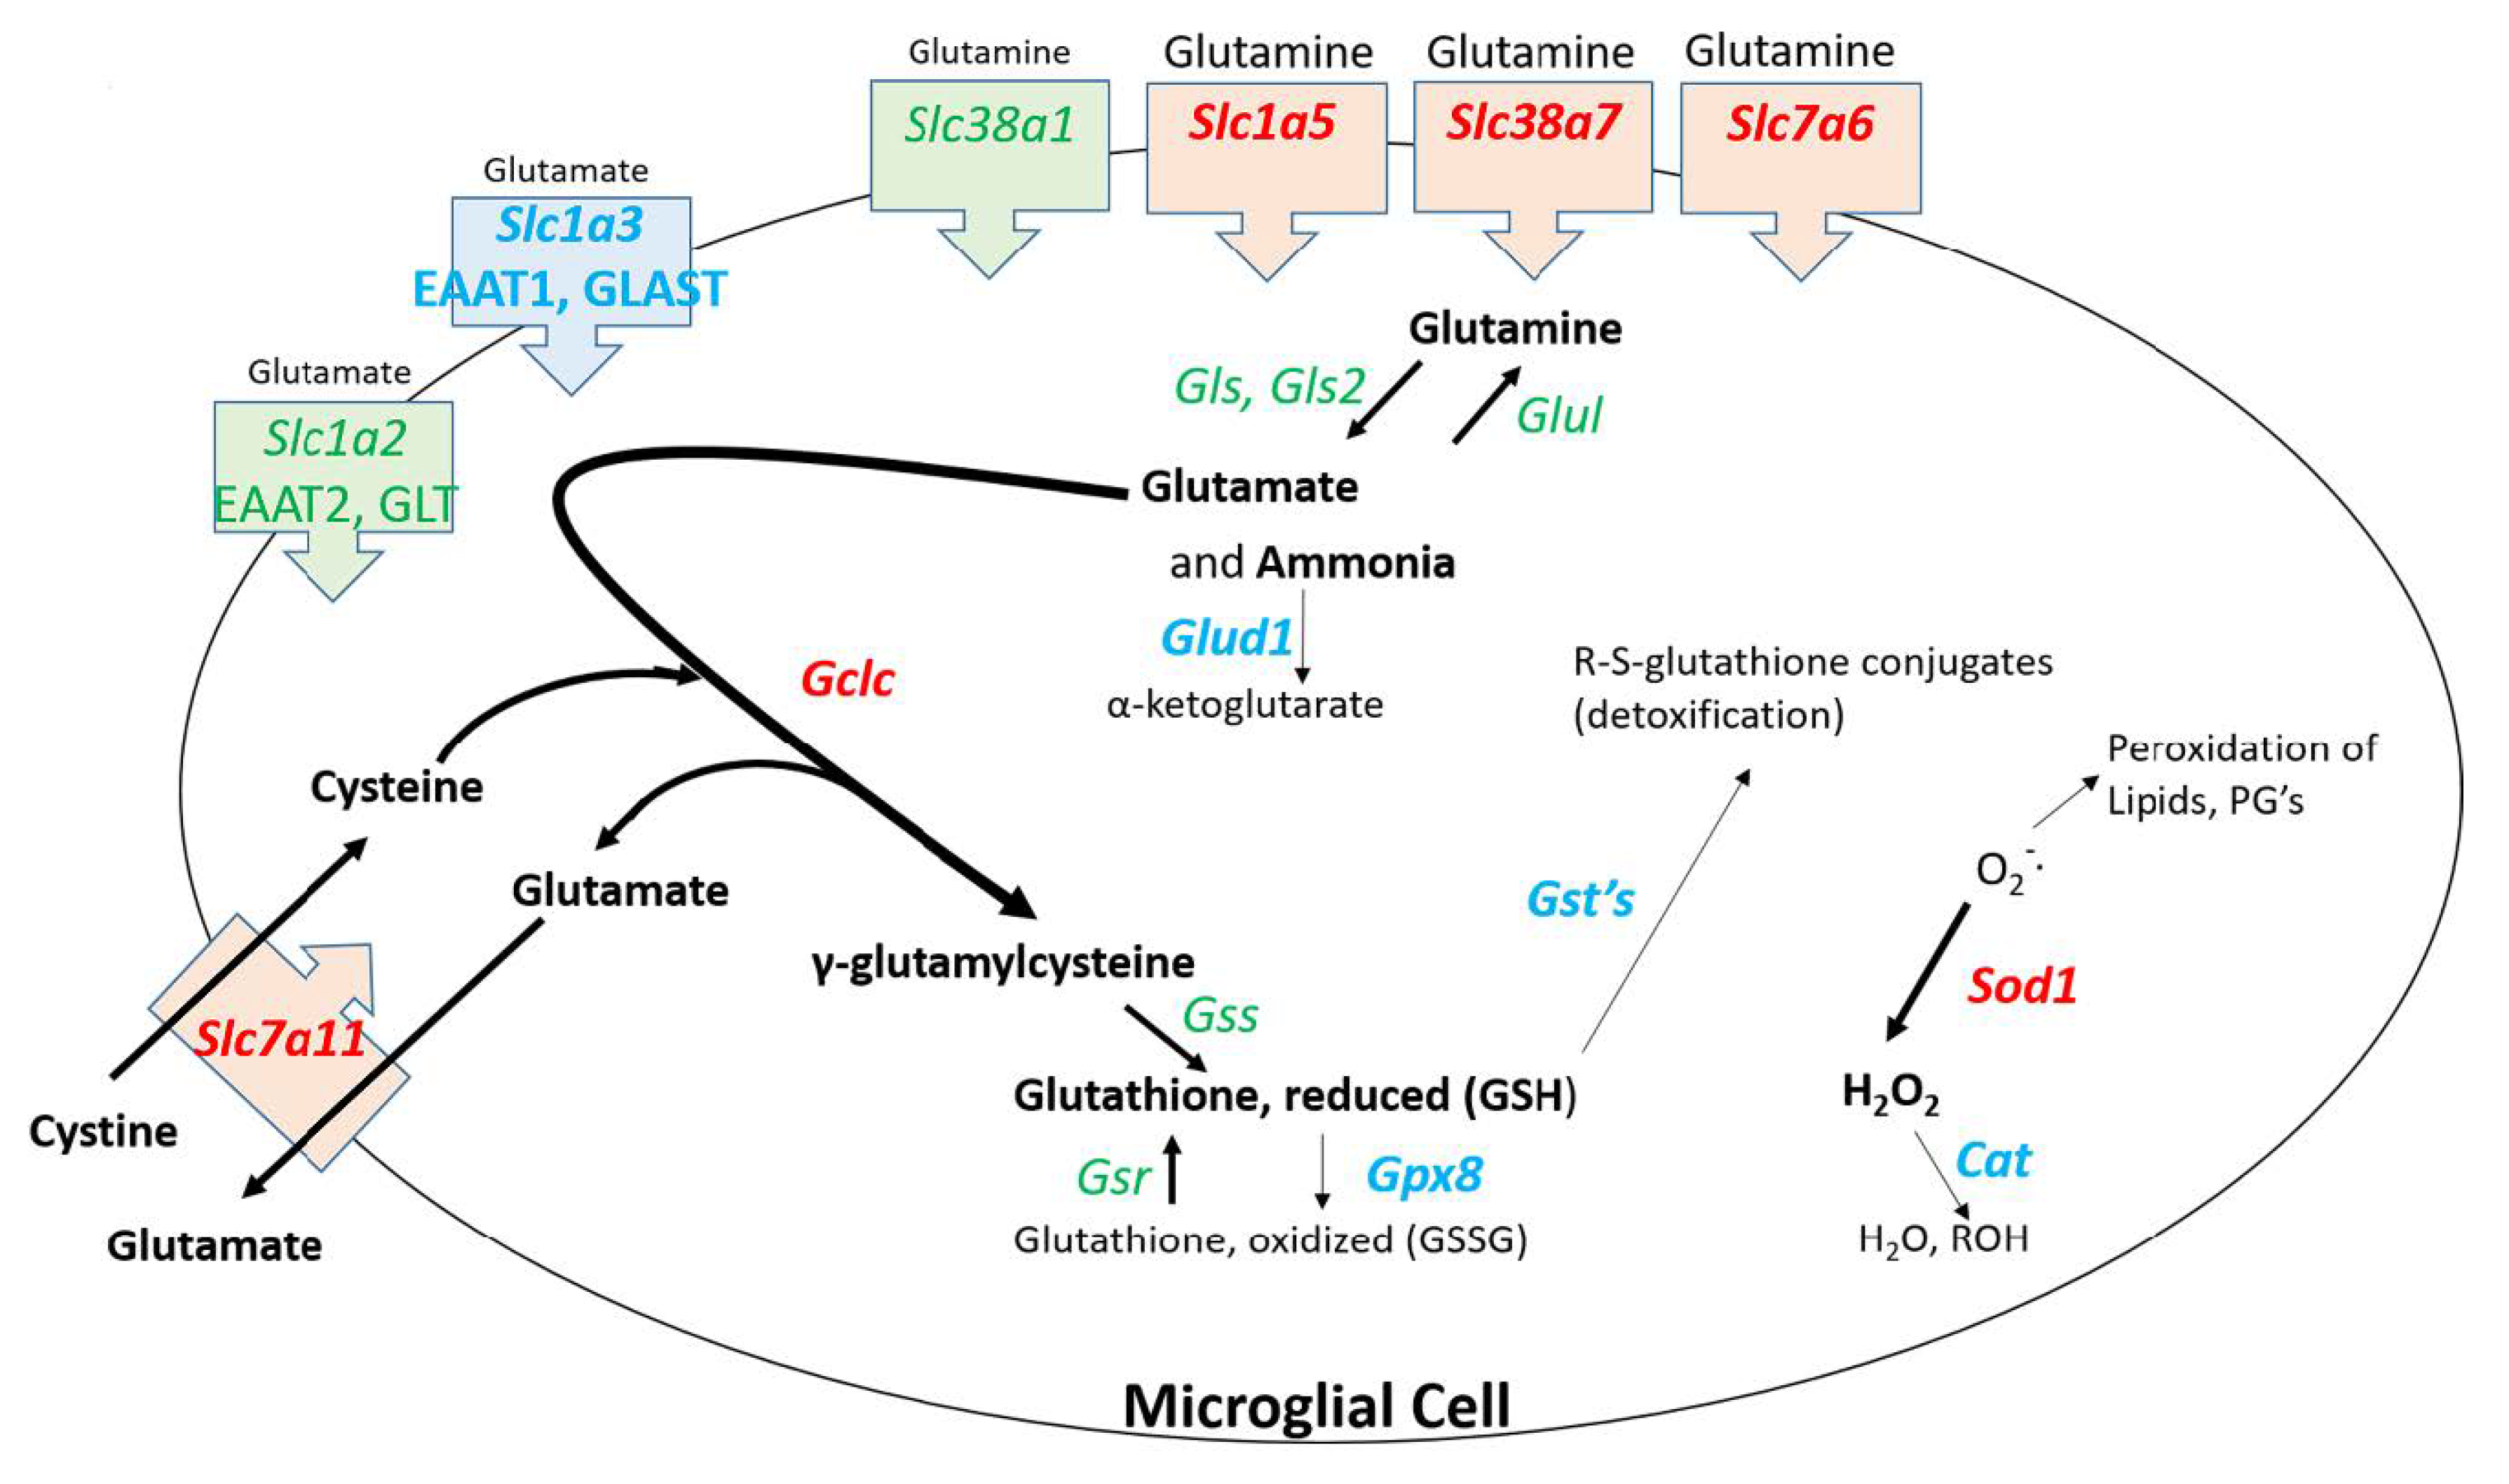
Gclc upregulation can lead to enhanced expression of glutamyl cysteinyl ligase which is the rate limiting enzyme in the synthesis of glutathione, a key molecule involved with the detoxification of reactive species. Upregulation of Gclc and Sod1 could be associated with the microglial uptake of glutamine. As shown in Figure 6, several genes for solute carriers involved with glutamine uptake are significantly upregulated in microglia. It is known that METH causes the release of glutamate from neurons [77,78] that is ordinarily taken up by astrocytes [79] and converted to glutamine [80], released into the synaptic space and subsequently taken up by neurons where it is converted back glutamate. The RNAseq data indicate that at 2 h post METH, the microglia may be primed to enhance their uptake of glutamine and convert it ultimately to reduced glutathione via the 9-fold increase in Gclc (Figure 6). Such a conversion along with the increase in Sod1 may be associated with a response by microglia to detoxify reactive species but appear to be countered by the downregulation of genes for the enzymes such as glutathione-S-transferases (GST), glutathione peroxidase 8 (GPX8), and catalase (CAT) needed to complete the detoxification cycle. Consequently, the balance of effect could lead to the release and accumulation of pro-oxidant species such as H2O2 [81,82] to produce the neurotoxicity to METH.
Several reviews point to the evolution from thinking of microglia as either simply M1 or M2 phenotypes to a spectrum of phenotypes or even sub-populations of cells specialized in their response to a given stimulus [44,84,85]. One might envision a subset of microglia poised to respond to the insult of toxic METH by locally generating COX2 expression and subsequently PGE2 production and release. These cells could amplify their initial PGE2 response via autocrine signaling through enhanced EP2 expression, while also permitting activation of a separate subset of microglia poised to respond to PGE2 via upregulated expression of EP4 receptors to enhance phagocytosis [86], suppress expression of inflammatory mediators [87,88] and enhance expression of enzymes to detoxify reactive oxygen species via NRF2 [89]. METH may serve to disrupt this coordinated effort by the incomplete detoxification of reactive species when Gclc and Sod1 are upregulated but Gpx8 and Cat are downregulated. Single-cell RNAseq could be a useful tool to determine if such subpopulations of cells could exist.
There are only six genes upregulated >2-fold at both 2 h and 3 days in the STR after METH. The gene for Betaine/GABA transporter 1, Slc6a12, is one of these genes (Table 3, Supplemental Table S5). In a review by Kempson et al. 2014 [90], the role of this particular GABA transporter in the brain is described as controversial since its expression levels relative to other GABA transporters are very low. While expression levels of genes for GABA transporters in our RNAseq data from microglia are modest, Scl6a12 is expressed at similar basal levels to the only other detected gene for a GABA transporter, Slc6a1, which is not changed in the STR at either time point by METH. The role of potential enhanced uptake of an inhibitory neurotransmitter by microglia for at least 3 days after METH has yet to be explored.
Another gene that remains upregulated at 3 days after METH in the STR is Csf1 or macrophage colony stimulating factor (Table 3, Table S6). CSF1 and activation of its receptor CSF1R, regulates the survival, proliferation, and differentiation of macrophages and microglia during development [91]. The gene for CSF1R is highly expressed in all CD11b/c+ cells analyzed but its expression is not changed by METH (Table S6). The alternative ligand for CSF1R, IL34, is significantly upregulated 3-fold at 3 days post METH in the STR (Table S6) and also can stimulate CSF1R. Thus, both ligands elicit a pro-inflammatory phenotype in microglia [92] that persists for at least 3 days after METH.

5. Conclusions

The present RNA sequencing results indicate that CD11b/c+ cells isolated from rat STR and PFC at 2 h post-binge METH appear to exhibit an RNA profile which indicates an overall inflammatory activation state. It is noted that genes for some classical M1 markers were not expressed at higher levels or even detected after exposure to METH. This may be due to the 2 h early time point chosen and/or to the nature of how METH activates microglia. These cells appear to recover from the METH-induced inflammatory profile rather quickly. By 3 days post-METH, there are no METH-induced transcriptional changes in the PFC and the changes greater than 2-fold in the STR have dropped to only 78 genes. It remains to be determined if the changes in RNA may be initiators of more prolonged and sustained response by inflammatory proteins. A key pathway that appears to be involved in the inflammatory nature of these cells in response to METH is the arachidonic acid metabolism cascade which favors the production of PGE2. Consequently, PGE2 could be released from the microglia to activate EP receptors on adjacent cells or to act potentially in an autocrine fashion as suggested by the METH-induced upregulation of EP2 and EP4 receptors. Thus, the COX2-PGE2-EP2 cycle may enhance LPS-induced IL1β production and a COX2-PGE2-EP4-NRF2-mediated cycle may drive the response to the oxidative stress produced by METH.

Supplementary Materials

The following are available online at https://www.mdpi.com/2076-3425/9/12/340/s1, Table S1: Gene expression data for Figure 3, Table S2: Gene expression data for Figure 4, Table S3: Gene expression data for Figure 5, Table S4: Gene expression data for Figure 6, Table S5: Gene expression data for GABA transporters in microglia from the STR at 2 h and 3 days after METH, Table S6: Gene expression data for Csf1, Csfr1, Il34 in microglia from the STR at 2 h and 3 days after METH.

Author Contributions

Conceptualization, B.K.Y.; data curation, J.S.K.; formal analysis, J.S.K. and B.K.Y.; funding acquisition, B.K.Y.; investigation, J.S.K.; methodology, J.S.K. and B.K.Y.; project administration, B.K.Y.; resources, B.K.Y.; supervision, B.K.Y.; visualization, J.S.K. and B.K.Y.; writing—original draft, J.S.K. and B.K.Y.; writing—review and editing, J.S.K. and B.K.Y.

Funding

This work was supported in part by NIH DA042737.

Acknowledgments

The authors thank the members of the Indiana University Melvin and Bren Simon Cancer Center Flow Cytometry Resource Facility for their outstanding technical support. The Indiana University Melvin and Bren Simon Cancer Center Flow Cytometry Resource Facility is funded in part by NIH, National Cancer Institute grant P30 CA082709 and National Institute of Diabetes and Digestive and Kidney Diseases (NIDDK) grant U54 DK106846. The FCRF is supported in part by NIH instrumentation grant 1S10D012270. We also thank the Center for Medical Genomics at IU School of Medicine for their outstanding technical support and sequencing during the NGS analysis.

Conflicts of Interest

The authors declare no conflicts of interest.

References

  1. LaVoie, M.J.; Card, J.P.; Hastings, T.G. Microglial activation precedes dopamine terminal pathology in methamphetamine-induced neurotoxicity. Exp. Neurol. 2004, 187, 47–57. [Google Scholar] [CrossRef] [PubMed]
  2. Thomas, D.M.; Walker, P.D.; Benjamins, J.A.; Geddes, T.J.; Kuhn, D.M. Methamphetamine Neurotoxicity in Dopamine Nerve Endings of the Striatum Is Associated with Microglial Activation. JPET 2004, 311, 1–7. [Google Scholar] [CrossRef] [PubMed]
  3. Sekine, Y.; Ouchi, Y.; Sugihara, G.; Takei, N.; Yoshikawa, E.; Nakamura, K.; Iwata, Y.; Tsuchiya, K.J.; Suda, S.; Suzuki, K.; et al. Methamphetamine Causes Microglial Activation in the Brains of Human Abusers. J. Neurosci. 2008, 28, 5756–5761. [Google Scholar] [CrossRef] [PubMed]
  4. Goncalves, J.; Baptista, S.; Martins, T.; Milhazes, N.; Borges, F.; Ribeiro, C.F.; Malva, J.O.; Silva, A.P. Methamphetamine-induced neuroinflammation and neuronal dysfunction in the mice hippocampus: Preventive effect of indomethacin. Eur. J. Neurosci. 2010, 31, 315–326. [Google Scholar] [CrossRef] [PubMed]
  5. McConnell, S.E.A.; O’Banion, M.K.; Cory-Slechta, D.A.; Olschowka, J.A.; Opanashuk, L.A. Characterization of binge-dosed methamphetamine-induced neurotoxicity and neuroinflammation. Neurotoxicology 2015, 50, 131–141. [Google Scholar] [CrossRef] [PubMed]
  6. Zhang, Y.; Lv, X.; Bai, Y.; Zhu, X.; Wu, X.; Chao, J.; Duan, M.; Buch, S.; Chen, L.; Yao, H. Involvement of sigma-1 receptor in astrocyte activation induced by methamphetamine via up-regulation of its own expression. J. Neuroinflamm. 2015, 12, 29–41. [Google Scholar] [CrossRef]
  7. Yamaguchi, T.; Kuraishi, Y.; Minami, M.; Nakai, S.; Hirai, Y.; Satoh, M. Methamphetamine-induced expression of interleukin-1 beta mRNA in the rat hypothalamus. Neurosci. Lett. 1991, 128, 90–92. [Google Scholar] [CrossRef]
  8. Liskiewicz, A.; Przybyla, M.; Park, M.; Liskiewicz, D.; Nowacka-Chmielewska, M.; Malecki, A.; Jaroslaw, B.; Lewin-Kowelik, J.; Toborek, M. Methamphetamine-associated cognitive decline is attenuated by neutralizing IL-1 signaling. Brain Behav. Immun. 2019, 80, 247–254. [Google Scholar] [CrossRef]
  9. Ladenheim, B.; Krasnova, I.N.; Deng, X.; Oyler, J.M.; Polettini, A.; Moran, T.H.; Huestis, M.A.; Cadet, J.L. Methamphetamine-Induced Neurotoxicity Is Attenuated in Transgenic Mice with a Null Mutation for Interleukin-6. Mol. Pharm. 2000, 58, 1247–1256. [Google Scholar] [CrossRef]
  10. Goncalves, J.; Martins, T.; Ferreira, R.; Milhazes, N.; Borges, F.; Ribeiro, C.F.; Malva, J.O.; Macedo, T.R.; Silva, A.P. Methamphetamine-Induced Early Increase of IL-6 and TNF-α mRNA Expression in the Mouse Brain. Ann. N. Y. Acad. Sci. 2008, 1139, 103–111. [Google Scholar] [CrossRef]
  11. Flora, G.; Lee, Y.W.; Nath, A.; Maragos, W.; Hennig, B.; Toborek, M. Methamphetamine-Induced TNF-Gene Expression and Activation of AP-1 in Discrete Regions of Mouse Brain. Neuromol. Med. 2002, 2, 71–85. [Google Scholar]
  12. Saika, F.; Kiguchi, N.; Kishioka, S. The role of CC-chemokine ligand 2 in the development of psychic dependence on methamphetamine. Jpn. J. Alcohol Stud. Drug Depend. 2015, 50, 189–195. [Google Scholar]
  13. Yamamoto, B.K.; Zhu, W. The effects of methamphetamine on the production of free radicals and oxidative stress. J. Pharm. Exp. 1998, 287, 107–114. [Google Scholar]
  14. Lau, J.W.S.; Senok, S.; Stadlin, A. Methamphetamine-induced Oxidative Stress in Cultured Mouse Astrocytes. Ann. N. Y. Acad. Sci. 2006, 914, 146–156. [Google Scholar] [CrossRef] [PubMed]
  15. Itzhak, Y.; Au, S.F. The Neuronal Nitric Oxide Synthase Inhibitor, 7-Nitroindazole, Protects Against Methamphetamine-Induced Neurotoxicity In Vivo. J. Neurochem. 1996, 67, 1770–1773. [Google Scholar] [CrossRef] [PubMed]
  16. Kita, T.; Shimada, K.; Mastunari, Y.; Wagner, G.C.; Kubo, K.; Nakashima, T. Methamphetamine-induced striatal dopamine neurotoxicity and cyclooxygenase-2 protein expression in BALB/c mice. Neuropharmacology 2000, 39, 399–406. [Google Scholar] [CrossRef]
  17. Thomas, D.M.; Kuhn, D.M. Cyclooxygenase-2 is an obligatory factor in methamphetamine-induced neurotoxicity. J. Pharm. Exp. 2005, 313, 870–876. [Google Scholar] [CrossRef]
  18. Pasupathy, A.; Miller, E.K. Different time courses of learning-related activity in the prefrontal cortex and striatum. Nature 2005, 433, 873–876. [Google Scholar] [CrossRef]
  19. Bault, N.; Joffily, M.; Rustichini, A.; Coricelli, G. Medial prefrontal cortex and striatum mediate the influence of social comparison on the decision process. Proc. Natl. Acad. Sci. USA 2011, 108, 16044–16049. [Google Scholar] [CrossRef]
  20. Kravitz, A.V.; Kreitzer, A.C. Striatal mechanisms underlying movement, reinforcement, and punishment. Physiology 2012, 27, 167–177. [Google Scholar] [CrossRef]
  21. Báez-Mendoza, R.; Schultz, W. The role of the striatum in social behavior. Front. Neurosci. 2013, 7, 233. [Google Scholar] [CrossRef] [PubMed]
  22. Hirabayashi, M.; Alam, M.R. Enhancing effect of methamphetamine on ambulatory activity produced by repeated administration in mice. Pharm. Biochem. Behav. 1981, 15, 925–932. [Google Scholar] [CrossRef]
  23. Simon, S.L.; Domier, C.; Carnell, J.; Brethen, P.; Rawson, R.; Ling, W. Cognitive impairment in individuals currently using methamphetamine. Am. J. Addict. 2000, 9, 222–231. [Google Scholar] [CrossRef] [PubMed]
  24. Marshall, J.F.; Belcher, A.M.; Feinstein, E.M.; O’Dell, S.J. Methamphetamine-induced neural and cognitive changes in rodents. Addiction 2007, 102 (Suppl. 1), 61–69. [Google Scholar] [CrossRef] [PubMed]
  25. Scott, J.C.; Woods, S.P.; Matt, G.E.; Meyer, R.A.; Heaton, R.K.; Atkinson, J.H.; Grant, I. Neurocognitive effects of methamphetamine: A critical review and meta-analysis. Neuropsychol. Rev. 2007, 17, 275–297. [Google Scholar] [CrossRef]
  26. Dobin, A.; Davis, C.A.; Schlesinger, F.; Drenkow, J.; Zaleski, C.; Jha, S.; Batut, P.; Chaisson, M.; Gingeras, T.R. STAR: Ultrafast universal RNA-seq aligner. Bioinformatics 2013, 29, 15–21. [Google Scholar] [CrossRef]
  27. Breese, M.R.; Liu, Y. NGSUtils: A software suite for analyzing and manipulating next-generation sequencing datasets. Bioinformatics 2013, 29, 494–496. [Google Scholar] [CrossRef]
  28. Liao, Y.; Smyth, G.K.; Shi, W. featureCounts: An efficient general purpose program for assigning sequence reads to genomic features. Bioinformatics 2014, 30, 923–930. [Google Scholar] [CrossRef]
  29. Ewels, P.; Magnusson, M.; Lundin, S.; Käller, M. MultiQC: Summarize analysis results for multiple tools and samples in a single report. Bioinformatics 2016, 32, 3047–3048. [Google Scholar] [CrossRef]
  30. Robinson, M.D.; McCarthy, D.J.; Smyth, G.K. edgeR: A Bioconductor package for differential expression analysis of digital gene expression data. Bioinformatics 2010, 26, 139–140. [Google Scholar] [CrossRef]
  31. McCarthy, D.J.; Chen, Y.; Smyth, G.K. Differential expression analysis of multifactor RNA-Seq experiments with respect to biological variation. Nucleic Acids Res. 2012, 40, 4288–4297. [Google Scholar] [CrossRef] [PubMed]
  32. Butovsky, O.; Jedrychowski, M.P.; Moore, C.S.; Cialic, R.; Lanser, A.J.; Gabriely, G.; Koeglsperger, T.; Dake, B.; Wu, P.M.; Doykan, C.E.; et al. Identification of a unique TGF-beta-dependent molecular and functional signature in microglia. Nat. Neurosci. 2014, 17, 131–143. [Google Scholar] [CrossRef] [PubMed]
  33. Haynes, S.E.; Hollopeter, G.; Yang, G.; Kurpius, D.; Dailey, M.E.; Gan, W.B.; Julius, D. The P2Y12 receptor regulates microglial activation by extracellular nucleotides. Nat. Neurosci. 2006, 9, 1512–1519. [Google Scholar] [CrossRef]
  34. Hickman, S.E.; Kingery, N.D.; Ohsumi, T.K.; Borowsky, M.L.; Wang, L.C.; Means, T.K.; El Khoury, J. The microglial sensome revealed by direct RNA sequencing. Nat. Neurosci. 2013, 16, 1896–1905. [Google Scholar] [CrossRef] [Green Version]
  35. Chhor, V.; Le Charpentier, T.; Lebon, S.; Ore, M.V.; Celador, I.L.; Josserand, J.; Degos, V.; Jacotot, E.; Hagberg, H.; Savman, K.; et al. Characterization of phenotype markers and neuronotoxic potential of polarised primary microglia in vitro. Brain Behav. Immun. 2013, 32, 70–85. [Google Scholar] [CrossRef]
  36. Cherry, J.D.; Olschowka, J.A.; O’Banion, M.K. Neuroinflammation and M2 microglia: The good, the bad, and the inflamed. J. Neuroinflamm. 2014, 11, 98–112. [Google Scholar] [CrossRef] [Green Version]
  37. Barakat, R.; Redzic, Z. The Role of Activated Microglia and Resident Macrophages in the Neurovascular Unit during Cerebral Ischemia: Is the Jury Still Out? Med. Princ. Pract. 2016, 25 (Suppl. 1), 3–14. [Google Scholar] [CrossRef]
  38. Zhou, T.; Huang, Z.; Sun, X.; Zhu, X.; Zhou, L.; Li, M.; Cheng, B.; Liu, X.; He, C. Microglia Polarization with M1/M2 Phenotype Changes in rd1 Mouse Model of Retinal Degeneration. Front. Neuroanat. 2017, 11, 77. [Google Scholar] [CrossRef] [Green Version]
  39. Peng, H.; Geil Nickell, C.R.; Chen, K.Y.; McClain, J.A.; Nixon, K. Increased expression of M1 and M2 phenotypic markers in isolated microglia after four-day binge alcohol exposure in male rats. Alcohol 2017, 62, 29–40. [Google Scholar] [CrossRef] [Green Version]
  40. Cadet, J.L.; Brannock, C.; Krasnova, I.N.; Ladenheim, B.; McCoy, M.T.; Chou, J.; Lehrmann, E.; Wood, W.H.; Becker, K.G.; Wang, Y. Methamphetamine-induced dopamine-independent alterations in striatal gene expression in the 6-hydroxydopamine hemiparkinsonian rats. PLoS ONE 2010, 5, e15643. [Google Scholar] [CrossRef]
  41. Rockwell, P.; Yuan, H.; Magnusson, R.; Figueiredo-Pereira, M.E. Proteasome Inhibition in Neuronal Cells Induces a Proinflammatory Response Manifested by Upregulation of Cyclooxygenase-2, Its Accumulation as Ubiquitin Conjugates, and Production of the Prostaglandin PGE2. Arch. Biochem. Biophys. 2000, 374, 325–333. [Google Scholar] [CrossRef]
  42. Chin, M.S.; Nagineni, C.N.; Hooper, L.C.; Detrick, B.; Hooks, J.J. Cyclooxygenase-2 Gene Expression and Regulation in Human Retinal Pigment Epithelial Cells. Investig. Ophthalmol. Vis. Sci. 2001, 42, 2338–2346. [Google Scholar]
  43. Laidlaw, T.M.; Boyce, J.A. Cysteinyl leukotriene receptors, old and new; implications for asthma. Clin. Exp. Allergy 2012, 42, 1313–1320. [Google Scholar] [CrossRef] [Green Version]
  44. Hanisch, U.K. Functional diversity of microglia—How heterogeneous are they to begin with? Front. Cell. Neurosci. 2013, 7, 65. [Google Scholar] [CrossRef] [Green Version]
  45. Friedman, B.A.; Srinivasan, K.; Ayalon, G.; Meilandt, W.J.; Lin, H.; Huntley, M.A.; Cao, Y.; Lee, S.L.; Haddick, P.C.G.; Ngu, H.; et al. Diverse Brain Myeloid Expression Profiles Reveal Distinct Microglial Activation States and Aspects of Alzheimer’s Disease Not Evident in Mouse Models. Cell Rep. 2018, 22, 832–847. [Google Scholar] [CrossRef]
  46. Patel, A.R.; Ritzel, R.; McCullough, L.D.; Liu, F. Microglia and ischemic stroke: A double-edged sword. Int. J. Physiol. Pathophysiol. Pharm. 2013, 5, 73–90. [Google Scholar]
  47. Hickman, S.E.; Allison, E.K.; El Khoury, J. Microglial dysfunction and defective beta-amyloid clearance pathways in aging Alzheimer’s disease mice. J. Neurosci. 2008, 28, 8354–8360. [Google Scholar] [CrossRef]
  48. Zhang, W.; Wang, T.; Pei, Z.; Miller, D.S.; Wu, X.; Block, M.L.; Wilson, B.; Zhang, W.; Zhou, Y.; Hong, J.; et al. Aggregated alpha-synuclein activates microglia: A process leading to disease progression in Parkinson’s disease. FASEB J. 2005, 19, 533–542. [Google Scholar] [CrossRef]
  49. Lecours, C.; Bordeleau, M.; Cantin, L.; Parent, M.; Paolo, T.D.; Tremblay, M.E. Microglial Implication in Parkinson’s Disease: Loss of Beneficial Physiological Roles or Gain of Inflammatory Functions? Front. Cell. Neurosci. 2018, 12, 282. [Google Scholar] [CrossRef]
  50. Sonar, S.; Lal, G. Role of Tumor Necrosis Factor Superfamily in Neuroinflammation and Autoimmunity. Front. Immunol. 2015, 6, 364. [Google Scholar] [CrossRef] [Green Version]
  51. Yeo, Y.A.; Martinez Gomez, J.M.; Croxford, J.L.; Gasser, S.; Ling, E.A.; Schwarz, H. CD137 ligand activated microglia induces oligodendrocyte apoptosis via reactive oxygen species. J. Neuroinflamm. 2012, 9, 173. [Google Scholar] [CrossRef] [PubMed] [Green Version]
  52. Tipton, D.A.; Legan, Z.T.; Dabbous, M. Methamphetamine cytotoxicity and effect on LPS-stimulated IL-1beta production by human monocytes. Toxicol. In Vitro 2010, 24, 921–927. [Google Scholar] [CrossRef] [PubMed]
  53. Liu, X.; Silverstein, P.S.; Singh, V.; Shah, A.; Qureshi, N.; Kumar, A. Methamphetamine increases LPS-mediated expression of IL-8, TNF-alpha and IL-1beta in human macrophages through common signaling pathways. PLoS ONE 2012, 7, e33822. [Google Scholar] [CrossRef]
  54. Navarra, P.; Pozzoli, G.; Brunetti, L.; Ragazzoni, E.; Besser, M.; Grossman, A. Interleukin-1 beta and interleukin-6 specifically increase the release of prostaglandin E2 from rat hypothalamic explants in vitro. Neuroendocrinology 1992, 56, 61–68. [Google Scholar] [CrossRef] [PubMed]
  55. Zaslona, Z.; Palsson-McDermott, E.M.; Menon, D.; Haneklaus, M.; Flis, E.; Prendeville, H.; Corcoran, S.E.; Peters-Golden, M.; O’Neill, L.A.J. The Induction of Pro-IL-1beta by Lipopolysaccharide Requires Endogenous Prostaglandin E2 Production. J. Immunol. 2017, 198, 3558–3564. [Google Scholar] [CrossRef] [Green Version]
  56. Persons, A.L.; Bradaric, B.D.; Dodiya, H.B.; Ohene-Nyako, M.; Forsyth, C.B.; Keshavarzian, A.; Shaikh, M.; Napier, T.C. Colon dysregulation in methamphetamine self-administering HIV-1 transgenic rats. PLoS ONE 2018, 13, e0190078. [Google Scholar] [CrossRef] [Green Version]
  57. Herr, R.D.; Caravati, E.M. Acute transient ischemic colitis after oral methamphetamine ingestion. Am. J. Emerg. Med. 1991, 9, 406–409. [Google Scholar] [CrossRef]
  58. Brannan, T.A.; Soundararajan, S.; Houghton, B.L. Methamphetamine-associated shock with intestinal infarction. Medscape Gen. Med. 2004, 6, 6. [Google Scholar]
  59. Northrop, N.A.; Yamamoto, B.K. Persistent neuroinflammatory effects of serial exposure to stress and methamphetamine on the blood-brain barrier. J. Neuroimmune Pharm. 2012, 7, 951–968. [Google Scholar] [CrossRef] [Green Version]
  60. Hsu, H.H.; Lin, Y.M.; Shen, C.Y.; Shibu, M.A.; Li, S.Y.; Chang, S.H.; Lin, C.C.; Chen, R.J.; Viswanadha, V.P.; Shih, H.N.; et al. Prostaglandin E2-Induced COX-2 Expressions via EP2 and EP4 Signaling Pathways in Human LoVo Colon Cancer Cells. Int. J. Mol. Sci. 2017, 18, 1132. [Google Scholar] [CrossRef]
  61. Johansson, J.U.; Pradhan, S.; Lokteva, L.A.; Woodling, N.S.; Ko, N.; Brown, H.D.; Wang, Q.; Loh, C.; Cekanaviciute, E.; Buckwalter, M.; et al. Suppression of inflammation with conditional deletion of the prostaglandin E2 EP2 receptor in macrophages and brain microglia. J. Neurosci. 2013, 33, 16016–16032. [Google Scholar] [CrossRef] [PubMed]
  62. Quan, Y.; Jiang, J.; Dingledine, R. EP2 receptor signaling pathways regulate classical activation of microglia. J. Biol. Chem. 2013, 288, 9293–9302. [Google Scholar] [CrossRef] [PubMed] [Green Version]
  63. Martin, P.; Palmer, G.; Vigne, S.; Lamacchia, C.; Rodriguez, E.; Talabot-Ayer, D.; Rose-John, S.; Chalaris, A.; Gabay, C. Mouse neutrophils express the decoy type 2 interleukin-1 receptor (IL-1R2) constitutively and in acute inflammatory conditions. J. Leukoc. Biol. 2013, 94, 791–802. [Google Scholar] [CrossRef] [Green Version]
  64. Johansson, J.U.; Nathaniel, S.; Woodling, N.S.; Brown, H.D.; Wang, Q.; Andreasson, K.I. Microarray analysis of the in vivo response ofmicroglia to Aβ peptides in mice with conditional deletion of the prostaglandin EP2 receptor. Genom. Data 2015, 5, 268–271. [Google Scholar] [CrossRef] [Green Version]
  65. Shie, F.S.; Breyer, R.M.; Montine, T.J. Microglia lacking E Prostanoid Receptor subtype 2 have enhanced Abeta phagocytosis yet lack Abeta-activated neurotoxicity. Am. J. Pathol. 2005, 166, 1163–1172. [Google Scholar] [CrossRef]
  66. Tobin, D.M.; Roca, F.J.; Ray, J.P.; Ko, D.C.; Ramakrishnan, L. An enzyme that inactivates the inflammatory mediator leukotriene b4 restricts mycobacterial infection. PLoS ONE 2013, 8, e67828. [Google Scholar] [CrossRef] [Green Version]
  67. Collin, M.; Rossi, A.; Cuzzocrea, S.; Patel, N.S.; Di Paola, R.; Hadley, J.; Collino, M.; Sautebin, L.; Thiemermann, C. Reduction of the multiple organ injury and dysfunction caused by endotoxemia in 5-lipoxygenase knockout mice and by the 5-lipoxygenase inhibitor zileuton. J. Leukoc. Biol. 2004, 76, 961–970. [Google Scholar] [CrossRef]
  68. Kwon, S.Y.; Ro, M.; Kim, J.H. Mediatory roles of leukotriene B4 receptors in LPS-induced endotoxic shock. Sci. Rep. 2019, 9, 5936. [Google Scholar] [CrossRef]
  69. Saiwai, H.; Ohkawa, Y.; Yamada, H.; Kumamaru, H.; Harada, A.; Okano, H.; Yokomizo, T.; Iwamoto, Y.; Okada, S. The LTB4-BLT1 axis mediates neutrophil infiltration and secondary injury in experimental spinal cord injury. Am. J. Pathol. 2010, 176, 2352–2366. [Google Scholar] [CrossRef]
  70. Yamamoto, B.K.; Raudensky, J. The role of oxidative stress, metabolic compromise, and inflammation in neuronal injury produced by amphetamine-related drugs of abuse. J. Neuroimmune Pharm. 2008, 3, 203–217. [Google Scholar] [CrossRef] [Green Version]
  71. Li, J.; Soroka, J.; Buchner, J. The Hsp90 chaperone machinery: Conformational dynamics and regulation by co-chaperones. Biochim. Biophys. Acta 2012, 1823, 624–635. [Google Scholar] [CrossRef] [Green Version]
  72. Shimada, O.; Ishikawa, H.; Tosaka-Shimada, H.; Atsumi, S. Rearrangements of actin cytoskeleton during infection with Escherichia coli O157 in macrophages. Cell Struct. Funct. 1999, 24, 237–246. [Google Scholar] [CrossRef] [PubMed] [Green Version]
  73. Bader, M.F.; Taupenot, L.; Ulrich, G.; Aunis, D.; Ciesielski-Treska, J. Bacterial endotoxin induces [Ca2+]i transients and changes the organization of actin in microglia. Glia 1994, 11, 336–344. [Google Scholar] [CrossRef] [PubMed]
  74. LaVoie, M.J.; Hastings, T.G. Dopamine quinone formation and protein modification associated with the striatal neurotoxicity of methamphetamine: Evidence against a role for extracellular dopamine. J. Neurosci. 1999, 19, 1484–1491. [Google Scholar] [CrossRef]
  75. Miyazaki, I.; Asanuma, M.; Diaz-Corrales, F.J.; Fukuda, M.; Kitaichi, K.; Miyoshi, K.; Ogawa, N. Methamphetamine-induced dopaminergic neurotoxicity is regulated by quinone-formation-related molecules. FASEB J. 2006, 20, 571–573. [Google Scholar] [CrossRef]
  76. Kuhn, D.M.; Francescutti-Verbeem, D.M.; Thomas, D.M. Dopamine quinones activate microglia and induce a neurotoxic gene expression profile: Relationship to methamphetamine-induced nerve ending damage. Ann. N. Y. Acad. Sci. 2006, 1074, 31–41. [Google Scholar] [CrossRef]
  77. Stephans, S.E.; Yamamoto, B.K. Methamphetamine-induced neurotoxicity: Roles for glutamate and dopamine efflux. Synapse 1994, 17, 203–209. [Google Scholar] [CrossRef]
  78. Zhang, S.; Jin, Y.; Liu, X.; Yang, L.; Ge, Z.; Wang, H.; Li, J.; Zheng, J. Methamphetamine modulates glutamatergic synaptic transmission in rat primary cultured hippocampal neurons. Brain Res. 2014, 1582, 1–11. [Google Scholar] [CrossRef]
  79. Cisneros, I.E.; Ghorpade, A. HIV-1, methamphetamine and astrocyte glutamate regulation: Combined excitotoxic implications for neuro-AIDS. Curr. HIV Res. 2012, 10, 392–406. [Google Scholar] [CrossRef] [Green Version]
  80. Schousboe, A.; Scafidi, S.; Bak, L.K.; Waagepetersen, H.S.; McKenna, M.C. Glutamate metabolism in the brain focusing on astrocytes. Adv. Neurobiol. 2014, 11, 13–30. [Google Scholar] [CrossRef] [Green Version]
  81. Mischel, R.E.; Kim, Y.S.; Sheldon, R.A.; Ferriero, D.M. Hydrogen peroxide is selectively toxic to immature murine neurons in vitro. Neurosci. Lett. 1997, 231, 17–20. [Google Scholar] [CrossRef]
  82. Ricart, K.C.; Fiszman, M.L. Hydrogen peroxide-induced neurotoxicity in cultured cortical cells grown in serum-free and serum-containing media. Neurochem. Res. 2001, 26, 801–808. [Google Scholar] [CrossRef] [PubMed]
  83. Stalnecker, C.A.; Erickson, J.W.; Cerione, R.A. Conformational changes in the activation loop of mitochondrial glutaminase C: A direct fluorescence readout that distinguishes the binding of allosteric inhibitors from activators. J. Biol. Chem. 2017, 292, 6095–6107. [Google Scholar] [CrossRef] [PubMed] [Green Version]
  84. Colonna, M.; Butovsky, O. Microglia Function in the Central Nervous System During Health and Neurodegeneration. Annu. Rev. Immunol. 2017, 35, 441–468. [Google Scholar] [CrossRef] [PubMed]
  85. Amici, S.A.; Dong, J.; Guerau-de-Arellano, M. Molecular Mechanisms Modulating the Phenotype of Macrophages and Microglia. Front. Immunol. 2017, 8, 1520. [Google Scholar] [CrossRef] [Green Version]
  86. Woodling, N.S.; Wang, Q.; Priyam, P.G.; Larkin, P.; Shi, J.; Johansson, J.U.; Zagol-Ikapitte, I.; Boutaud, O.; Andreasson, K.I. Suppression of Alzheimer-associated inflammation by microglial prostaglandin-E2 EP4 receptor signaling. J. Neurosci. 2014, 34, 5882–5894. [Google Scholar] [CrossRef] [Green Version]
  87. Shi, J.; Johansson, J.; Woodling, N.S.; Wang, Q.; Montine, T.J.; Andreasson, K. The prostaglandin E2 E-prostanoid 4 receptor exerts anti-inflammatory effects in brain innate immunity. J. Immunol. 2010, 184, 7207–7218. [Google Scholar] [CrossRef] [Green Version]
  88. Xu, J.; Xu, Z.; Yan, A. Prostaglandin E2 EP4 Receptor Activation Attenuates Neuroinflammation and Early Brain Injury Induced by Subarachnoid Hemorrhage in Rats. Neurochem. Res. 2017, 42, 1267–1278. [Google Scholar] [CrossRef] [Green Version]
  89. Gjyshi, O.; Roy, A.; Dutta, S.; Veettil, M.V.; Dutta, D.; Chandran, B. Activated Nrf2 Interacts with Kaposi’s Sarcoma-Associated Herpesvirus Latency Protein LANA-1 and Host Protein KAP1 To Mediate Global Lytic Gene Repression. J. Virol. 2015, 89, 7874–7892. [Google Scholar] [CrossRef] [Green Version]
  90. Kempson, S.A.; Zhou, Y.; Danbolt, N.C. The betaine/GABA transporter and betaine: Roles in brain, kidney, and liver. Front. Physiol. 2014, 5, 159. [Google Scholar] [CrossRef] [Green Version]
  91. Elmore, M.R.; Najafi, A.R.; Koike, M.A.; Dagher, N.N.; Spangenberg, E.E.; Rice, R.A.; Kitazawa, M.; Matusow, B.; Nguyen, H.; West, B.L.; et al. Colony-stimulating factor 1 receptor signaling is necessary for microglia viability, unmasking a microglia progenitor cell in the adult brain. Neuron 2014, 82, 380–397. [Google Scholar] [CrossRef] [PubMed] [Green Version]
  92. Walker, D.G.; Tang, T.M.; Lue, L.F. Studies on Colony Stimulating Factor Receptor-1 and Ligands Colony Stimulating Factor-1 and Interleukin-34 in Alzheimer’s Disease Brains and Human Microglia. Front. Aging Neurosci. 2017, 9, 244. [Google Scholar] [CrossRef] [PubMed]
Figure 1. Representative gating strategy to collect CD11b/c+ cells (P3) by FACS for RNA sequencing. (a) forward scatter height vs. forward scatter area plot to isolate single cells (P1) from doublets; (b) side scatter vs. forward scatter plot to isolate cells (P2) from debris; (c) fluorescence intensity plot to isolate Cd11b/c-PE labeled cells (P3).
Brainsci 09 00340 g001
Figure 2. Distribution of significantly-changed genes FDR <0.05, 2 h post METH, in the STR and PFC. (a) all significantly changed genes; (b) significantly upregulated genes; (c) significantly downregulated genes. The relative number of significantly-changed genes are represented by the size of the circles. Genes significantly-changed in the prefrontal cortex are shown by blue circles while those from the striatum are shown by yellow circles. Genes shared by both regions are depicted by the overlapping area between the two circles in an olive color. Note that the striatum has the larger number of gene changes compared to the prefrontal cortex and that about 80% of the genes changed by METH in the PFC were also changed in the STR.
Brainsci 09 00340 g002aBrainsci 09 00340 g002b
Figure 3. Genes for prostaglandin (PG) and leukotrienes (LT) biosynthetic enzymes and LT receptors in 2 h post METH STR microglia. METH treatment appears to direct the release of arachidonic acid from cell membrane phospholipids toward synthesis of prostaglandins and leukotriene B4 which are known to have roles in inflammation. Downregulation or lack of detection of RNA for all leukotriene receptors [43] suggests that microglia are less responsive to leukotrienes post-binge METH. Changes in gene expression for enzymes and receptors are denoted by italic text and color: Black = not detected. Green = no significant change. Red = significant upregulation. Blue = significant downregulation. Gene expression data can be found in Table S1.
Brainsci 09 00340 g003
Figure 4. Genes for biosynthetic enzymes and receptors for PG’s, TxA2, and HETE’s in 2 h post METH STR microglia. METH treatment seems to direct the release of arachidonic acid from cell membrane phospholipids particularly toward synthesis of PGE2 over any of the other possible cyclooxygenase- or lipoxygenase-derived products. In addition, METH provides a means by which PGE2 can act in an autocrine fashion with the concurrent upregulation of genes for PGE2 receptors EP2 and EP4. Changes in gene expression are denoted by italic text and color: Black = not detected. Green = no significant change. Red = significant upregulation. Blue = significant downregulation. Gene expression data can be found in Table S2.
Brainsci 09 00340 g004
Figure 5. RNAseq genes associated with NRF2-mediated oxidative stress response via IPA®. Toxic doses of METH can produce oxidative stress in the rodent brain. In the rat striatum 2 h post METH, IPA® showed that the upregulation of a number of genes associated with oxidative stress are under the control of NRF2, which is itself upregulated by METH. Among the upstream mediators which can initiate this pathway are drugs, cytokines prostaglandins, and bacterial infections. RNAseq data showed that Il1a, Il1b, and the enzymes which can enhance synthesis of PGE2 are also upregulated by METH and could contribute to initiating the NRF2-mediated oxidative stress response. Red symbols = upregulated genes. Green symbols = downregulated genes. Gene expression data can be found in Table S3.
Brainsci 09 00340 g005
Figure 6. Hypothesized pathway and consequences of glutamine uptake in 2 h post METH STR microglia. Binge dose METH leads to neuronal release of glutamate. Glutamate is taken up by astrocytes, converted to glutamine, and released to the extracellular space. Upregulation of genes for several glutamine transporters suggests the enhanced uptake of glutamine by microglia. The potential increased levels of glutamine would stoichiometrically be converted to glutamate and ammonia [83]. The resulting enhanced levels of glutamate may be met by the enhanced expression of Gclc, the gene for the first rate-limiting enzyme in glutathione synthesis, and enhanced expression of Slc7a11, the gene for a cystine/glutamate transporter. This combination may drive the enhanced synthesis of γ-glutamylcysteine and the reduced form of glutathione (GSH). The utility of GSH to participate in detoxifying reactive species may be thwarted by the concurrent downregulation of genes for several glutathione-S-transferases (GSTs). Enhanced expression of Sod1 via the IPA-predicted enhancement NRF2 signaling may serve to partially reduce the amounts of METH-generated reactive oxygen species. However, there is incomplete conversion of the resulting toxic hydrogen peroxide to water and alcohol and accompanying generation of oxidized glutathione due to the downregulation of genes for catalase (Cat) and glutathione peroxidase 8 (Gpx8), respectively. Other sources of toxic species resulting from enhanced uptake of glutamine by microglia could be the enhanced presence/release of ammonia after the conversion of glutamine to glutamate via the concurrent downregulation of glutamate dehydrogenase 1 (Glud1) as well as the enhanced export of glutamate via upregulated Slc7a11. Changes in gene expression are denoted by text color and font for the gene symbol: Green = no significant change. Red, bold = significant upregulation. Blue, bold = significant downregulation. Gene expression data can be found in Table S4.
Brainsci 09 00340 g006
Table 1. Number of genes with differential expression methamphetamine (METH) vs. saline, false discovery rate (FDR) < 0.05 unpaired t-test. PFC: prefrontal cortex; STR: striatum; FC: fold change.
2 h Post METH3 Day Post METH
TotalsPFC Genes: 10,496STR Genes: 10,839PFC Genes: 9991STR Genes: 10,612
Considering All FC’s with FDR < 0.05.
TotalsPFC Genes: 3118STR Genes: 4483PFC Genes: 0STR Genes: 714
UpDownUpDownUpDownUpDown
153715812435204800400314
Considering FC’s > 2 or <−2 with FDR < 0.05.
TotalsPFC Genes: 934STR Genes: 1531PFC Genes: 0STR Genes: 78
UpDownUpDownUpDownUpDown
436498840691004137
Table 2. Genes common to PFC and STR with opposite differential expression METH vs. saline, 2 h time point, FDR <0.05 unpaired t-test.
SymbolGene NameFold Change PFC 2 hFold Change STR 2 h
Grik5Glutamate Ionotropic Receptor Kainate Type Subunit 53.39−2.74
PlauPlasminogen Activator, Urokinase−2.254.04
Itgb3Integrin Subunit Beta 3−1.581.52
Tmem120aTransmembrane Protein 120A−1.301.40
Msto1Misato Mitochondrial Distribution and Morphology Regulator 1−1.311.29
Table 3. Genes in STR with significant differential expression at both 2 h and 3 day time points, fold changes <−2 or >+2.
Genes Upregulated at Both Time Points
SymbolGene NameFold Change 2 hFold Change 3 day
Slc6a12solute carrier family 6 member 1216.602.75
Csf1colony stimulating factor 112.522.41
Cd5Cd5 molecule3.402.29
Fn1fibronectin 13.142.65
Adgrg5adhesion G protein-coupled receptor G52.812.30
LOC685157similar to paired immunoglobin-like type 2 receptor beta2.673.15
Genes Downregulated at Both Time Points
SymbolGene NameFold Change 2 hFold Change 3 day
Gpr12G protein-coupled receptor 12−5.74−2.72
Gba3glucosidase, beta, acid 3−5.40−4.78
Ripply3ripply transcriptional repressor 3−2.88−2.13
Sntb1syntrophin, beta 1−2.87−2.00
Tmem53transmembrane protein 53−2.49−2.18
Dscc1DNA replication and sister chromatid cohesion 1−2.44−2.36
Genes Upregulated at 2 h, Downregulated at 3 Days
SymbolGene NameFold Change 2 hFold Change 3 day
Hbegfheparin-binding EGF-like growth factor17.55−3.16
Bcl2BCL2, apoptosis regulator3.74−2.14
Avpr1aarginine vasopressin receptor 1A2.71−2.15
Spata22spermatogenesis associated 222.40−4.78
Ccnd2cyclin D22.31−2.75
Genes Downregulated at 2 h, Upregulated at 3 Days
SymbolGene NameFold Change 2 hFold Change 3 day
Islrimmunoglobulin superfamily containing leucine-rich repeat−9.943.02
LOC689081similar to cystatin E2−6.142.23
Fndc1fibronectin type III domain containing 1−3.333.80
Hfehemochromatosis−2.622.21
Table 4. Ingenuity® Pathway Analysis of significantly changed genes within each brain region and time point.
Top Canonical PathwaysTop Upstream RegulatorsTop Molecular and Cellular Functions
STR 2 h post-METH, FDR <0.05NRF2-mediated oxidative stress responseLipopolysaccharideCell death and survival
Aryl hydrocarbon receptor signalingPDGF BBCellular movement
Unfolded protein responseBeta-estradiolCellular development
Aldosterone signaling in epithelial cellsHSF1Cellular growth and proliferation
LXR/RXR activationTNFCell morphology
PFC 2 h post-METH, FDR <0.05Aldosterone signaling in epithelial cellsLipopolysaccharideCellular movement
Unfolded protein responseIFNGCell death and survival
Atherosclerosis signalingTGFB1Protein synthesis
Granulocyte adhesion and diapedesisIL1BCellular function and maintenance
IL-10 signalingPDGF BBCellular development
STR 3 day post-METH, FDR <0.05EIF2 signalingTCRRNA post-transcriptional modification
Regulation of eIF4 and p70S6K signalingERBB2Protein synthesis
mTOR signalingDOT1LCell death and survival
Type I diabetes mellitus signalingEBI3Gene expression
T helper cell differentiationDRAP1DNA replication, recombination, and repair
PFC 3 day post-METH, FDR <0.05N/AN/AN/A
Table 5. Ingenuity® Pathway Analysis of significantly changed genes in STR at both 2 h and 3 days post-METH.
Top Canonical PathwaysTop Upstream RegulatorsTop Molecular and Cellular Functions
Upregulated at both 2 h and 3 day post-METHEIF2 signalingTCRRNA post-transcriptional modification
Regulation of eIF4 and p70S6K signalingDOT1LProtein synthesis
mTOR signalingHSP90B1Gene expression
Hepatic fibrosis/hepatic stellate cell activationmiR-542-3p (miRNAs w/seed GUGACAG)Cell morphology
Complement systemELAVL1Cell-to-cell signaling and interaction
Downregulated at both 2 h and 3 day post-METHTryptophan degradation to 2-amino-3-carboxymuconate semialdehydeBHLHA15Cellular assembly and organization
NAD biosynthesis II (from tryptophan)SOX11DNA replication, recombination, and repair
Leukotriene biosynthesisERBB2Cell cycle
-Glutamyl cycleNAMPTCellular growth and proliferation
Mismatch repair in eukaryotesCERS6Cell morphology
Upregulated at 2 h and downregulated at 3 day-Linolenate biosynthesis II (animals)FAM103A1Cellular assembly and organization
Myc mediated apoptosis signalingIKBKEDNA replication, Recombination and repair
Glycine biosynthesis IPIM1Cell morphology
Pancreatic adenocarcinoma signalingRELBCell death and survival
S-adenosyl-L-methionine biosynthesisNFKB2Cell cycle
Downregulated at 2 h and upregulated at 3 dayNAD salvage pathway IINDRG1Lipid metabolism
IL-22 signalingCOL18A1Small molecule biochemistry
Natural killer cell signalingCDK4Cell morphology
PI3K/AKT signalingPDLIM2Cellular function and maintenance
Interferon signalingCLDN7Cell death and survival
Table 6. RNAseq data for top 25 genes enriched in microglia [32]. (U) = unique to microglia vs. oligodentrocyes, astrocytes, and neurons. Bold text = change in expression FDR <0.05 METH vs. Saline treatment. ND = not detected. NS = not significant.
SymbolGene NameSTR Average log2cpm Saline (n = 6), METH (n = 8)STR Fold Change, FDR 2 h METH vs. SalinePFC Average log2cpm Saline (n = 4), METH (n = 5)PFC Fold Change, FDR 2 h METH vs. Saline
P2ry12 (U)purinergic receptor P2Y1210.88, 9.77−2.01, 5.0 × 10−510.93, 10.23−1.57, 4.5 × 10⁻⁵
Tmem119 (U)transmembrane protein 11911.24, 11.04−1.19, 0.39 (NS)11.28, 11.381.11, 0.72 (NS)
Fcrls (Fcrl2) (U)Fc receptor-like 210.04, 9.81−1.08, 0.83 (NS)10.51, 10.44−1.11, 0.81 (NS)
Olfml3 (U)olfactomedin-like 31.18, −0.29−2.78, 3.7 × 10−50.98, −0.08−2.15, 0.04
Hexb (U)hexosaminidase subunit beta12.68, 12.48−1.14, 0.23 (NS)12.77, 12.49−1.20, 0.11 (NS)
Ctsscathepsin S14.68, 15.041.30, 0.0114.70, 15.051.29, 0.06 (NS)
C1qbcomplement C1q B chain12.73, 13.231.44, 0.00112.66, 13.361.66, 2.2 × 10⁻⁴
C1qacomplement C1q A chain12.57, 12.821.21, 0.11 (NS)12.53, 12.891.31, 0.04
Csf1rcolony stimulating factor 1 receptor13.48, 13.621.10, 0.54 (NS)13.42, 13.511.03, 0.85 (NS)
P2ry13purinergic receptor P2Y139.27, 8.11−2.04, 1.1 × 10−49.16, 8.53−1.46, 0.01
Cx3cr1C-X3-C motif chemokine receptor 112.27, 11.55−1.50, 0.0112.17, 11.73−1.31, 0.11 (NS)
Gpr34G protein-coupled receptor 3411.39, 10.51−1.72, 0.0211.43, 10.54−1.76, 0.004
C1qccomplement C1q C chain11.01, 11.301.20, 0.15 (NS)10.85, 11.401.49, 0.11 (NS)
MafbMAF bZIP transcription factor B6.55, 7.312.06, 0.0086.41, 6.741.27, 0.24 (NS)
Tgfbr1 (U)transforming growth factor, beta receptor 110.46, 10.39−1.04, 0.80 (NS)10.60, 10.50−1.08, 0.62 (NS)
Fcgr1Fc fragment of IgG receptor Ia7.45, 7.15−1.17, 0.33 (NS)7.40, 7.23−1.12, 0.50 (NS)
Entpd1ectonucleoside triphosphate diphosphohydrolase 16.39, 5.52−1.74, 3.0 × 10−46.37, 5.86−1.42, 0.02
Ltc4sleukotriene C4 synthase8.11, 6.91−2.14, 1.4 × 10−58.11, 7.35−1.61, 8.5 × 10⁻⁴
Csf3rcolony stimulating factor 3 receptor8.30, 9.582.50, 1.2 × 10−78.24, 9.532.42, 8.6 × 10⁻⁹
Il10rainterleukin 10 receptor subunit alpha8.35, 7.75−1.52, 2.0 × 10−48.43, 8.07−1.23, 0.06 (NS)
Egr1early growth response 18.36, 8.811.91, 0.23 (NS)8.30, 7.67−1.39, 0,45 (NS)
Siglechsialic acid binding Ig like lectin HNDNDNDND
Ccl2C-C motif chemokine ligand 25.57, 6.342.15, 0.17 (NS)5.66, 5.621.03, 0.97 (NS)
Lag3lymphocyte activating 33.84, 3.801.01, 0.98 (NS)3.83, 3.65−1.16, 0.63 (NS)
FosFBJ osteosarcoma oncogene7.21, 7.311.09, 0.92 (NS)8.45, 8.371.14, 0.86 (NS)
Average log2cpm
STR, Saline 10,839 GenesSTR, METH 10,839 GenesPFC, Saline 10,496 GenesPFC, METH 10,496 Genes
3.933.914.134.14
STR, Saline Top 25 genesSTR, METH Top 25 genesPFC, METH Top 25 genesPFC, METH Top 25 genes
9.349.169.389.25
Table 7. Average log2cpm of genes unique to mouse brain microglia or peritoneal macrophages as per Hickman et al. [34].
STR Average Saline Microglial log2cpm (n = 6)STR Average METH Microglial log2cpm (n = 8)PFC Average Saline Microglial log2cpm (n = 4)PFC Average METH Microglial log2cpm (n = 5)
Mouse Microglial Unique Genes8.067.538.497.94
Mouse Macrophage Unique Genes1.511.951.382.32
Table 8. Literature-cited M1 or M2 microglial genes/proteins compared to RNAseq data. Green-font rows indicate significant change in expression that is directionally in agreement with literature citations. Yellow-font rows indicate significantly changed RNAseq genes that are closely related to literature-cited genes. ND = not detected. NS = not significant.
SymbolGene NameM1/M2SourceBrain RegionAverage Log2 cpm Sal, METHFold ChangeFDR
Ccl2 (MCP-1)C-C motif chemokine ligand 2M1ZhouSTR5.57, 6.342.150.17 (NS)
PFC5.66, 5.621.030.97 (NS)
Ccl5 (RANTES)C-C motif chemokine ligand 5M1ChhorSTRND, NDND
PFCND, NDND
Ccr7C-C Motif Chemokine Receptor 7M1BarakatSTRND, NDND
PFC−4.59, −2.621.840.74 (NS)
Fcgr3a (Cd16)Fc fragment of IgG, low affinity IIIa, receptorM1Barakat,
Zhou
STR8.12, 7.25−1.788.5 × 10−8
PFC8.01, 7.01−1.971.5 × 10−9
Fcer2 (Cd23)Fc Fragment Of IgE Receptor IIM1BarakatSTRND, NDND
PFCND, NDND
Fcgr2a (Cd32)Fc fragment of IgG, low affinity IIa, receptorM1Barakat, Zhou, PengSTR7.16, 7.791.589.6 × 10−7
PFC7.25, 7.961.671.7 × 10−5
Cd40 (Tnfr)Cd40 moleculeM1BarakatSTR6.08, 5.45−1.460.13 (NS)
PFC6.29, 5.30−1.971.9 × 10−9
Cd80Cd80 moleculeM1BarakatSTR3.24, 3.621.340.049
PFC3.30, 3.681.320.14 (NS)
Cd86Cd86 moleculeM1Barakat, Zhou, PengSTR6.68, 6.47−1.130.29 (NS)
PFC6.54, 6.571.110.41 (NS)
Cxcl1C-X-C motif chemokine ligand 1M1ChhorSTR−3.53, −0.286.30.01
PFC−2.30, 0.405.090.001
Adgre1 (F4/80)adhesion G protein-coupled receptor E1 M1BarakatSTR10.32, 10.05−1.20.06 (NS)
PFC10.47, 10.35−1.10.47 (NS)
Il1ainterleukin 1 alphaM1ChhorSTR6.84, 7.933.980.001
PFC6.76, 7.502.160.03
Il1binterleukin 1 betaM1Barakat, ChhorSTR3.83, 5.974.821.2 × 10−5
PFC3.85, 6.285.577.6 × 10−13
Il2Interleukin 2M1ChhorSTRND, NDND
PFCND, NDND
Il6interleukin 6M1Barakat, Chhor, ZhouSTR3.05, 2.62−1.260.35 (NS)
PFC3.13, 3.331.170.58 (NS)
Il12interleukin 12M1Barakat, ChhorSTR5.04, 4.52−1.360.045
PFC4.89, 4.47−1.250.32 (NS)
Ifnginterferon gammaM1ChhorSTRND, NDND
PFCND, NDND
Nos2 (iNos)nitric oxide synthase 2M1Barakat, ChhorSTRND, NDND
PFCND, NDND
Hla-d* (Mhc II)major histocompatibility class IIM1Barakat, PengSTRND, NDND
PFCND, NDND
Tnftumor necrosis factorM1Barakat, Chhor, ZhouSTR1.19, 0.89−1.260.49 (NS)
PFC0.96, 0.46−1.260.65 (NS)
Gene related to Tnf from RNAseq Data
Tnfsf9tumor necrosis factor superfamily member 9 STR0.33, 4.2919.535.7 × 10−11
PFC0.23, 3.6311.452.5 × 10−8
Ptgs2 (COX2)prostaglandin-endoperoxide synthase 2 M1/M2ChhorSTR−4.73, −0.6247.30.002
PFCND, NDND
Arg1Arginase 1M2Cherry, ChhorSTRND, NDND
PFCND, NDND
Ccl2 (MCP-1)C-C motif chemokine ligand 2M2ChhorSTR5.57, 6.342.150.17 (NS)
PFC5.66, 5.621.030.97 (NS)
Ccr2 (MCP-1-R)C-C Motif Chemokine Receptor 2M2ChhorSTRND, NDND
PFCND, NDND
Cd163CD163 moleculeM2Barakat, CherrySTRND, NDND
PFC−2.16, 2.137.210.11 (NS)
Msr1 (Cd204) macrophage scavenger receptor 1M2BarakatSTR1.38, 2.582.553.4 × 10−4
PFC1.06, 3.014.182.6 × 10−6
Cd209CD209 moleculeM2BarakatSTRND, NDND
PFCND, NDND
Cd36CD36 moleculeM2BarakatSTR−2.79, −2.131.120.88 (NS)
PFC−2.15, −0.791.910.42 (NS)
Cd68Cd68 moleculeM2BarakatSTR6.83, 6.68−1.110.38 (NS)
PFC6.70, 6.49−1.140.28 (NS)
Cxcr3C-X-C motif chemokine receptor 3M2ChhorSTR2.49, 1.61−1.530.21 (NS)
PFC2.79, 2.15−1.540.01
Clec7a (Dectin 1)C-type lectin domain family 7, member AM2Barakat, CherrySTR2.34, 2.591.380.35 (NS)
PFC1.22, 2.753.020.006
Retnlb (Fizz1)Resistin Like BetaM2Barakat, Cherry, ChhorSTRND, NDND
PFCND, NDND
Lgals3 (Gal-3)galectin 3M2ChhorSTR0.79, 3.066.23.0 × 10−4
PFC0.13, 2.496.76.8 × 10−4
Csf3 (G-CSF)Colony Stimulating Factor 3M2ChhorSTRND, NDND
PFCND, NDND
Csf2 (GM-CSF)Colony Stimulating Factor 2M2ChhorSTRND, NDND
PFCND, NDND
Gene related to Csf3 from RNAseq Data
Csf1 (M-CSF) Colony Stimulating Factor 1 STR1.54, 4.9112.527.6 × 10−9
PFC1.71, 4.147.17.3 × 10−7
Igf1insulin-like growth factor 1M2ChhorSTR4.81, 5.261.410.01
PFC4.87, 5.571.650.004
Il1rn (Il1ra) interleukin 1 receptor antagonistM2ChhorSTR−0.40, 1.394.040.002
PFC−0.29, 1.193.430.4 (NS)
Genes related to Il1rn from RNAseq Data
Il1rl1 (receptor for IL33 with Il1RAP)interleukin 1 receptor-like 1 STR6.31, 5.82−1.390.01
PFC6.26, 5.87−1.30.08 (NS)
Il1rapinterleukin 1 receptor accessory protein STR3.49, 3.941.360.004
PFC3.29, 3.551.190.29 (NS)
Il1r2 (IL1b decoy receptor)interleukin 1 receptor type 2 STR−1.75, 3.5939.11.9 × 10−10
PFC−3.37, 4.48131.462.0 × 10−10
Il4Interleukin 4M2Barakat, ChhorSTRND, NDND
PFCND, NDND
Il4rInterleukin 4 Receptor M2ChhorSTR8.12, 8.411.250.21 (NS)
PFC8.11, 8.391.230.16 (NS)
Il10Interleukin10M2Barakat, ChhorSTRND, NDND
PFCND, NDND
Genes related to Il10 from RNAseq Data
Il10rainterleukin 10 receptor subunit alpha STR8.35, 7.75−1.522.0 × 10−4
PFC8.34, 8.07−1.230.06 (NS)
Il10rbinterleukin 10 receptor subunit beta STR7.98, 7.53−1.346.0 × 10−4
PFC7.94, 7.62−1.220.04
Il13Interleukin13M2BarakatSTRND, NDND
PFCND, NDND
Gene related to Il13 from RNAseq Data
Il13ra1interleukin 13 receptor subunit alpha 1 STR3.77, 4.011.180.19 (NS)
PFC3.77, 4.481.61.7 × 10−3
Clec10a (Cd301)C-type lectin domain family 10, member AM2CherrySTR−0.89, −0.36 −1.190.75 (NS)
PFC1.78, 3.674.080.08 (NS)
Mrc1 (Cd206)mannose receptor, C type 1M2Barakat Cherry, Chorr, Zhou, PengSTR−0.86, 0.662.720.009
PFC0.83, 3.776.390.04
Socs3suppressor of cytokine signaling 3M2ChhorSTR5.31, 5.491.040.91 (NS)
PFC5.71, 6.131.340.29 (NS)
SphK1Sphingosine Kinase 1M2ChhorSTRND, NDND
PFCND, NDND
SphK2sphingosine kinase 2M2ChhorSTR5.90, 6.021.10.37 (NS)
PFC6.05, 6.231.140.30 (NS)
TGFb, subtypes below M2Barakat, Chhor
TGFb1transforming growth factor, beta 1 STR6.14, 6.14−1.090.62 (NS)
PFC6.34, 6.4011.00 (NS)
TGFb2transforming growth factor, beta 2 STR−1.15, −1.34−1.140.80 (NS)
PFCND, NDND
TGFb3transforming growth factor, beta 3 STR−0.63, −1.79−1.270.72 (NS)
PFC−0.93, −1.46−1.240.77 (NS)
Trem2triggering receptor expressed on myeloid cells 2M2CherrySTR10.50, 9.06−2.581.30 × 10−8
PFC10.59, 8.88−3.186.1 × 10−14
Chi3l3 (Ym1)chitinase 3 like 3M2Barakat, Cherry, ChhorSTRND, NDND
PFCND, NDND

