3.2.1. Motion Effects in the Replication Sample
Behavioural analyses. Sensitivity and response bias measures violated assumptions of normality; therefore, nonparametric analyses were conducted. Wilcoxon signed-ranks tests revealed a significant effect of presentation style on sensitivity, Z = −4.46, p < 0.001, with higher accuracy for faces learned in motion (M = 0.9, SD = 0.07) compared to static faces (M = 0.86, SD = 0.1; median difference = 0.05, 95% CI [0.03, 0.07]). A significant effect was also observed for response bias, Z = −3.07, p < 0.01, with more conservative responding for static faces (M = 0.36, SD = 0.42) than moving faces (M = 0.23, SD = 0.46; median difference = 0.12, 95% CI [0.04, 0.19]). Most participants (n = 35) showed greater accuracy for faces learned in motion, eight favoured static faces and eight performed equally for both presentation styles.
RTs were calculated for correct trials only. A paired-samples t-test showed a significant effect of presentation style, t(50) = 3.05, p = 0.004, d = 0.43, with faster responses for faces learned in motion (M = 1570.28 ms, SD = 889.25) compared to static faces (M = 1694.17 ms, SD = 1015.03; mean difference = 123.88 ms, 95% CI [42.22, 205.54]).
Eye-tracking analyses: Eye movements were analysed separately for the learning and recognition phases. Analyses focused on correctly recognised trials only (i.e., at learning: faces subsequently correctly recognised at test; at recognition: hits).
Descriptive statistics for proportional dwell time and fixation count during the
learning phase are presented in
Table 3. A 2 (presentation style: moving vs. static) × 2 (interest area: internal vs. external) repeated-measures ANOVA revealed a significant main effect of interest area for both dwell time,
F(1, 50) = 416,
p < 0.001, ω
2 = 0.89, and fixation count,
F(1, 50) = 343.85,
p < 0.001, ω
2 = 0.87, with greater attention directed to internal features. A significant main effect of presentation style was found for dwell time,
F(1, 50) = 29.27,
p < 0.001, ω
2 = 0.14, but not fixation count, with a greater proportion of dwell time directed to the face, relative to the background, during moving trials. A significant interaction between presentation style and interest area was observed for both dwell time,
F(1, 50) = 8.88,
p < 0.01, ω
2 = 0.13, and fixation count,
F(1, 50) = 11.36,
p = 0.001, ω
2 = 0.16. Simple main effects revealed that participants allocated more fixations to the internal features when faces were learned in motion (mean difference = 3.03%, 95% CI [0.69, 5.37]), and more fixations to the external features when learned from static images (mean difference = 4.01%, 95% CI [1.6, 6.43]). A similar pattern was observed for dwell time.
To examine whether the interaction was driven by attention to one specific internal feature, dwell time and fixation count were analysed using a 2 (presentation style: moving vs. static) × 3 (interest area: eyes, nose, mouth) repeated-measures ANOVA. The results revealed a significant main effect of presentation style on both dwell time, F(1, 50) = 6.76, p < 0.05, ω2 = 0.02, and fixation count, F(1, 50) = 11.20, p < 0.01, ω2 = 0.02, with greater attention to internal features for faces learned in motion. A significant main effect of IA was also observed for dwell time, F(2, 100) = 15.72, p < 0.001, ω2 = 0.21, and fixation count, F(2, 100) = 15.97, p < 0.001, ω2 = 0.21. Bonferroni-corrected comparisons showed greater dwell time to the eyes than the nose (p < 0.01) and mouth (p < 0.001), and more fixations to the eyes and nose than the mouth (p < 0.001). Finally, there was no significant interaction between presentation style and interest area for dwell time, F(2, 100) = 1.24, p = 0.29, ω2 < 0.01, or fixation count, F(2, 100) = 0.31, p = 0.73, ω2 < 0.01, indicating that the effect of motion was similar across the internal features.
Descriptive statistics for proportional dwell time and fixation count during the
recognition phase are presented in
Table 4. A 2 (presentation style at learning) × 2 (interest area) ANOVA revealed a significant main effect of interest area on dwell time,
F(1, 50) = 504.76,
p < 0.001, ω
2 = 0.91, and fixation count,
F(1, 50) = 457.5,
p < 0.001, ω
2 = 0.90, with greater attention directed to the internal features. No significant effects of presentation style or interactions were found, indicating no carry-over effect of learning condition on gaze patterns at test.
Fixation shifts were calculated using the same technique employed in Experiment 1. Wilcoxon signed-rank tests revealed that more fixation shifts occurred for faces learned in a static format compared to those learned in a moving format during both learning, Z = −3.06, p = 0.002 (median difference = 0.45 fixation shifts per trial, 95% CI [0.15, 0.75]), and recognition, Z = −2.22, p = 0.03 (mean difference = 0.17 fixation shifts per trial, 95% CI [0.01, 0.26]). This suggests that static faces required greater visual sampling, whereas motion was associated with reduced attentional shifts.
3.2.2. Comparison of DP and Age-Matched Controls
Behavioural analyses. Sensitivity (A’) was analysed using a 2 (presentation style: moving vs. static) × 2 (group: DP vs. control) mixed ANOVA. There were significant main effects of presentation style, F(1, 28) = 13.62, p < 0.01, ω2 = 0.10, and group, F(1, 28) = 7.00, p = 0.01, ω2 = 0.09, reflecting greater accuracy in the moving-face condition relative to static (mean difference = 0.04, 95% CI [0.02, 0.06]) and in the control group relative to the DP group (mean difference = 0.05, 95% CI [0.01, 0.09]), respectively. The interaction was not significant, F(1, 28) = 1.88, p = 0.18, ω2 < 0.01, providing no evidence that the effect of motion differed between the DP and control groups. However, this finding should be treated with caution due to the small sample size. Within the DP group, 10 participants showed a motion advantage, three a static advantage, and one showed no difference. In the control group, eight showed a motion advantage, two a static advantage, and six showed no difference.
The same analysis for the B’’ data revealed no significant effect of presentation style, F(1, 28) = 2.19, p = 0.15, ω2 = 0.01, or group, F(1, 28) = 1.78, p = 0.19, ω2 = 0.01, and no significant interaction between presentation style and group, F(1, 28) = 0.08, p = 0.78, ω2 < 0.01.
RTs (log-transformed) for correct responses revealed a main effect of group, F(1, 28) = 33.08, p < 0.001, ω2 = 0.30, with slower responses in the DP group (M = 2735.53 ms, SD = 1699.5) compared to the control (M = 1293.09 ms, SD = 372.67). There was no effect of presentation style, F(1, 28) = 2.84, p = 0.10, ω2 < 0.01, and no interaction, F(1, 28) = 0.08, p = 78, ω2 < 0.01.
Eye-tracking analyses. Descriptive statistics for dwell time and fixation count across interest areas during the learning phase are presented in
Table 5.
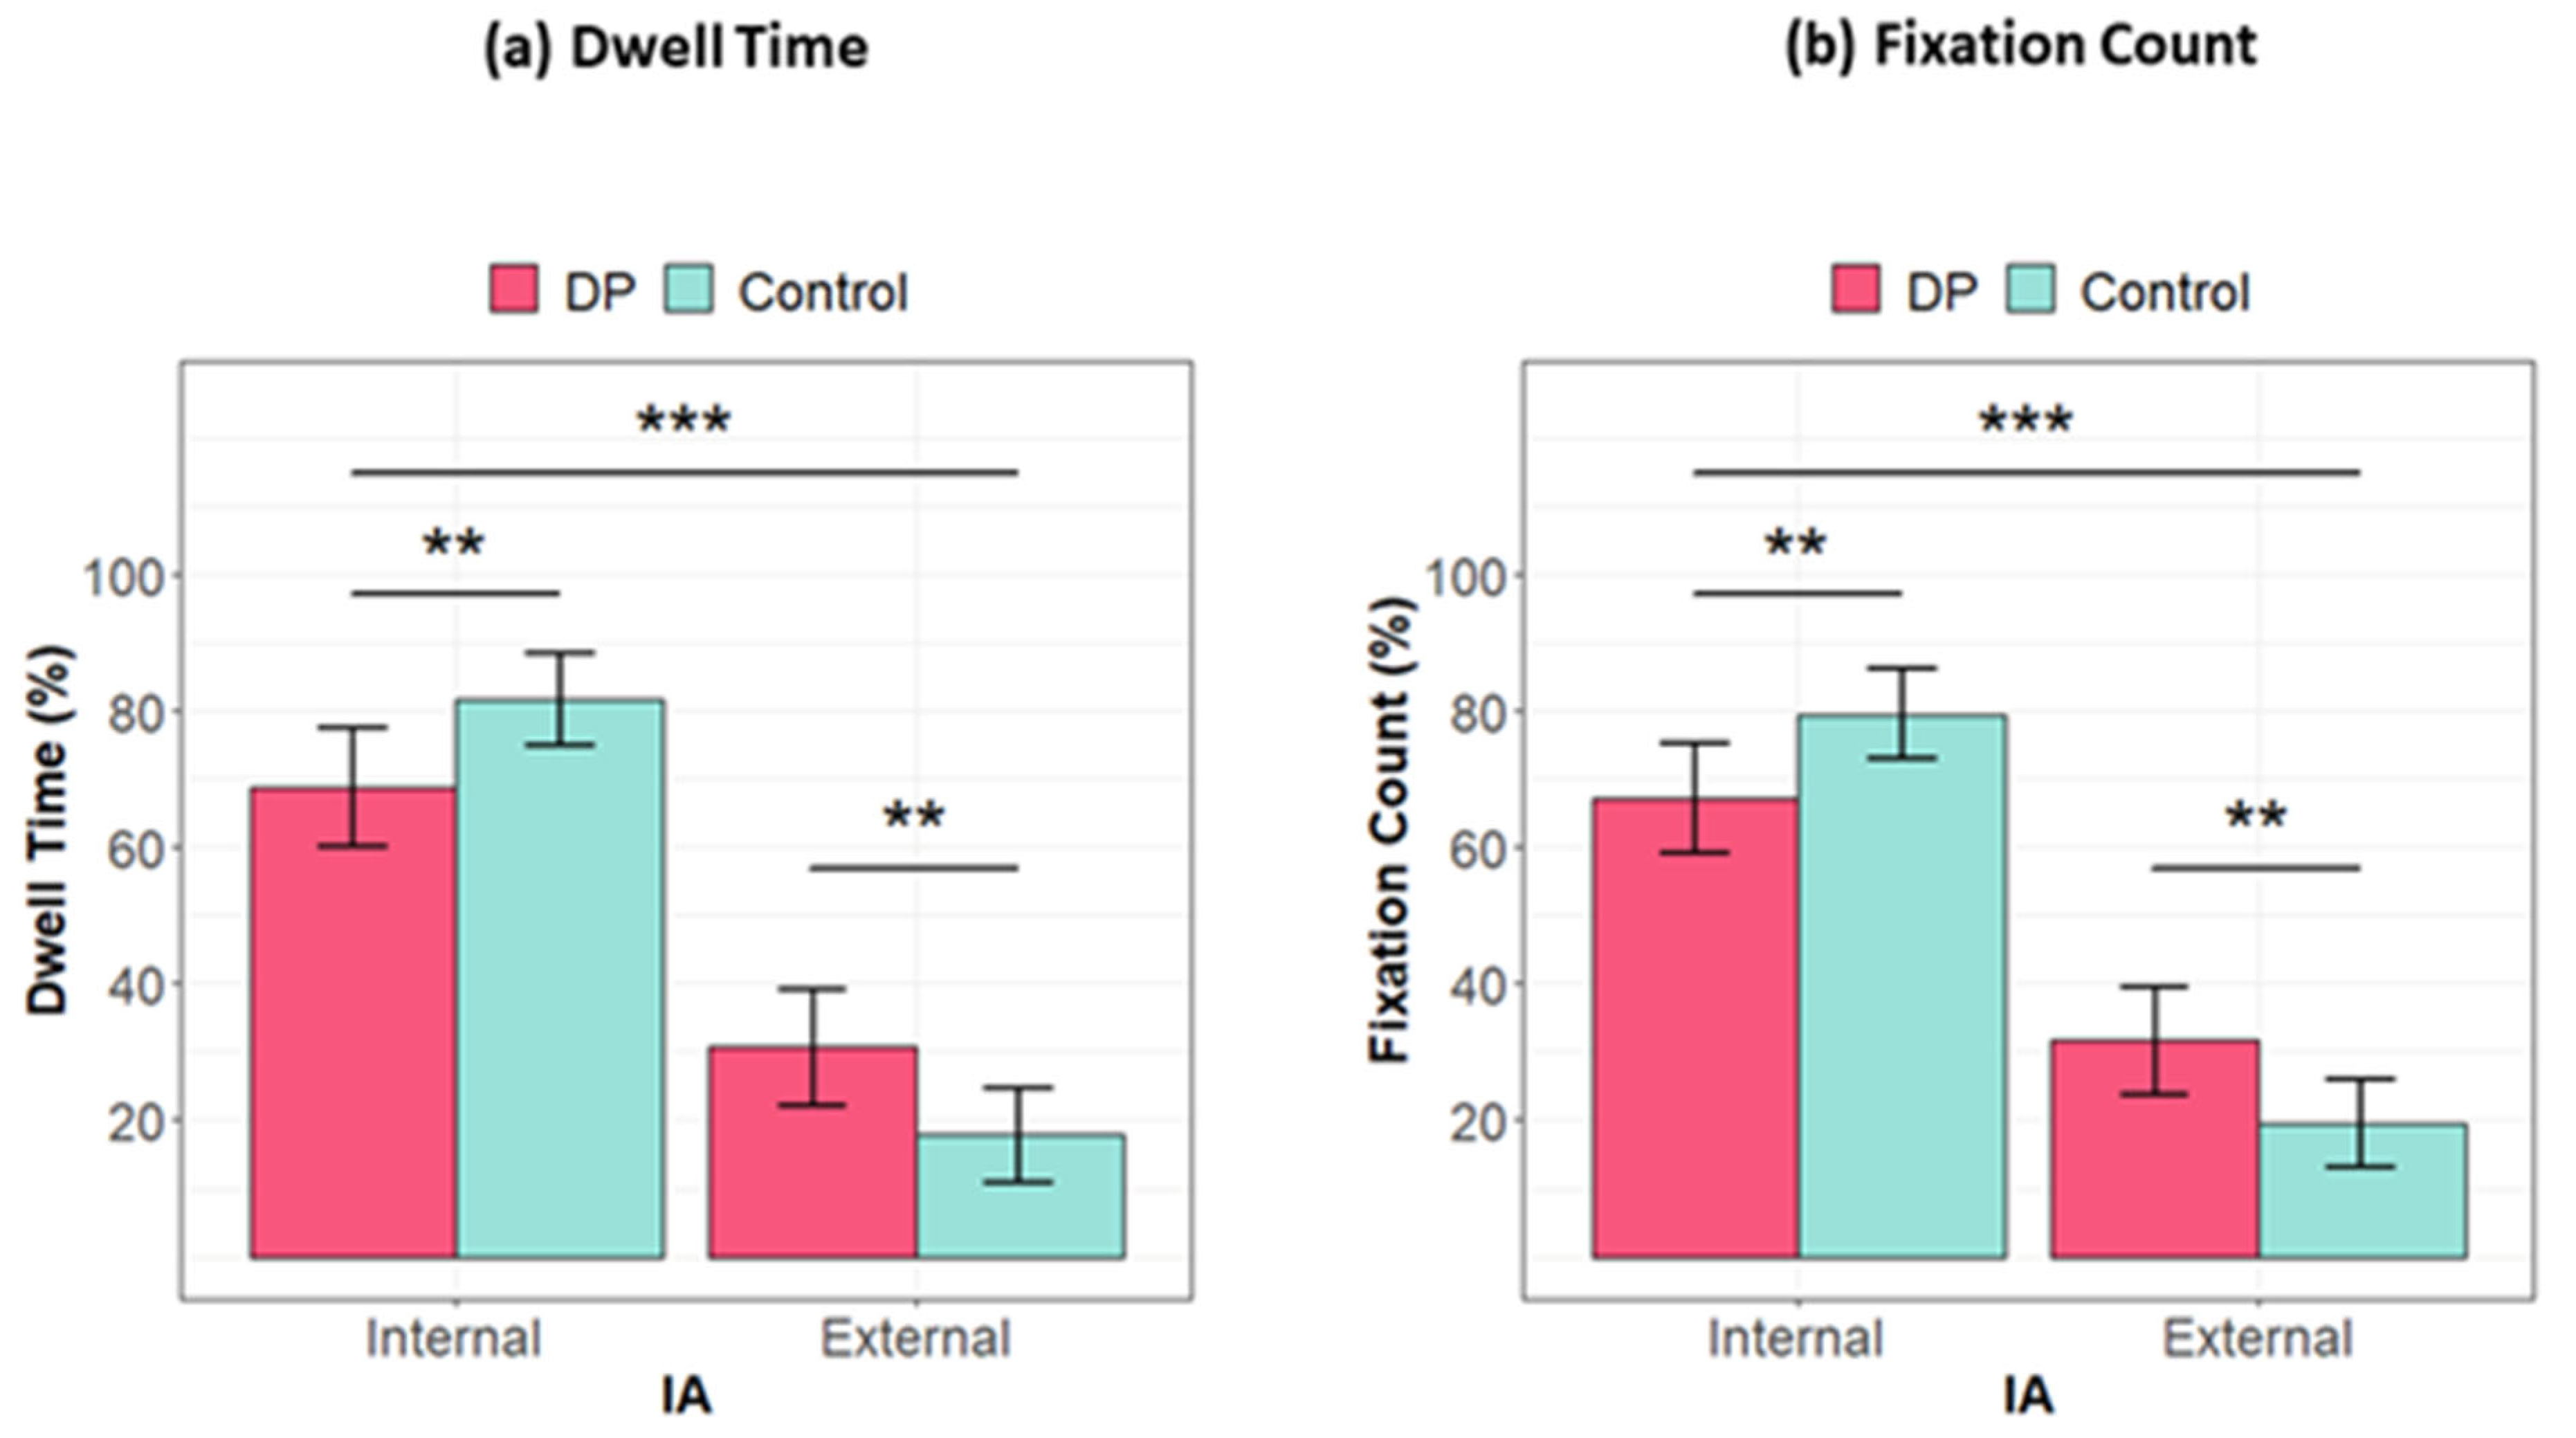
A 2 (presentation style) × 2 (interest area: internal vs. external) × 2 (group) ANOVA showed a main effect of interest area for both dwell time, F(1, 28) = 128.97, p < 0.001, ω2 = 0.82, and fixation count, F(1, 28) = 146.70, p < 0.001, ω2 = 0.84, with greater attention directed to the internal features. A main effect of presentation style was also observed for dwell time only, F(1, 28) = 69.72, p < 0.001, ω2 = 0.30, with greater overall face-directed dwell time (i.e., proportion of viewing time allocated to the face relative to the background) in the static condition. Although statistically significant, this effect reflected only a small absolute difference in viewing behaviour, with participants directing slightly more attention towards the background in the moving condition.
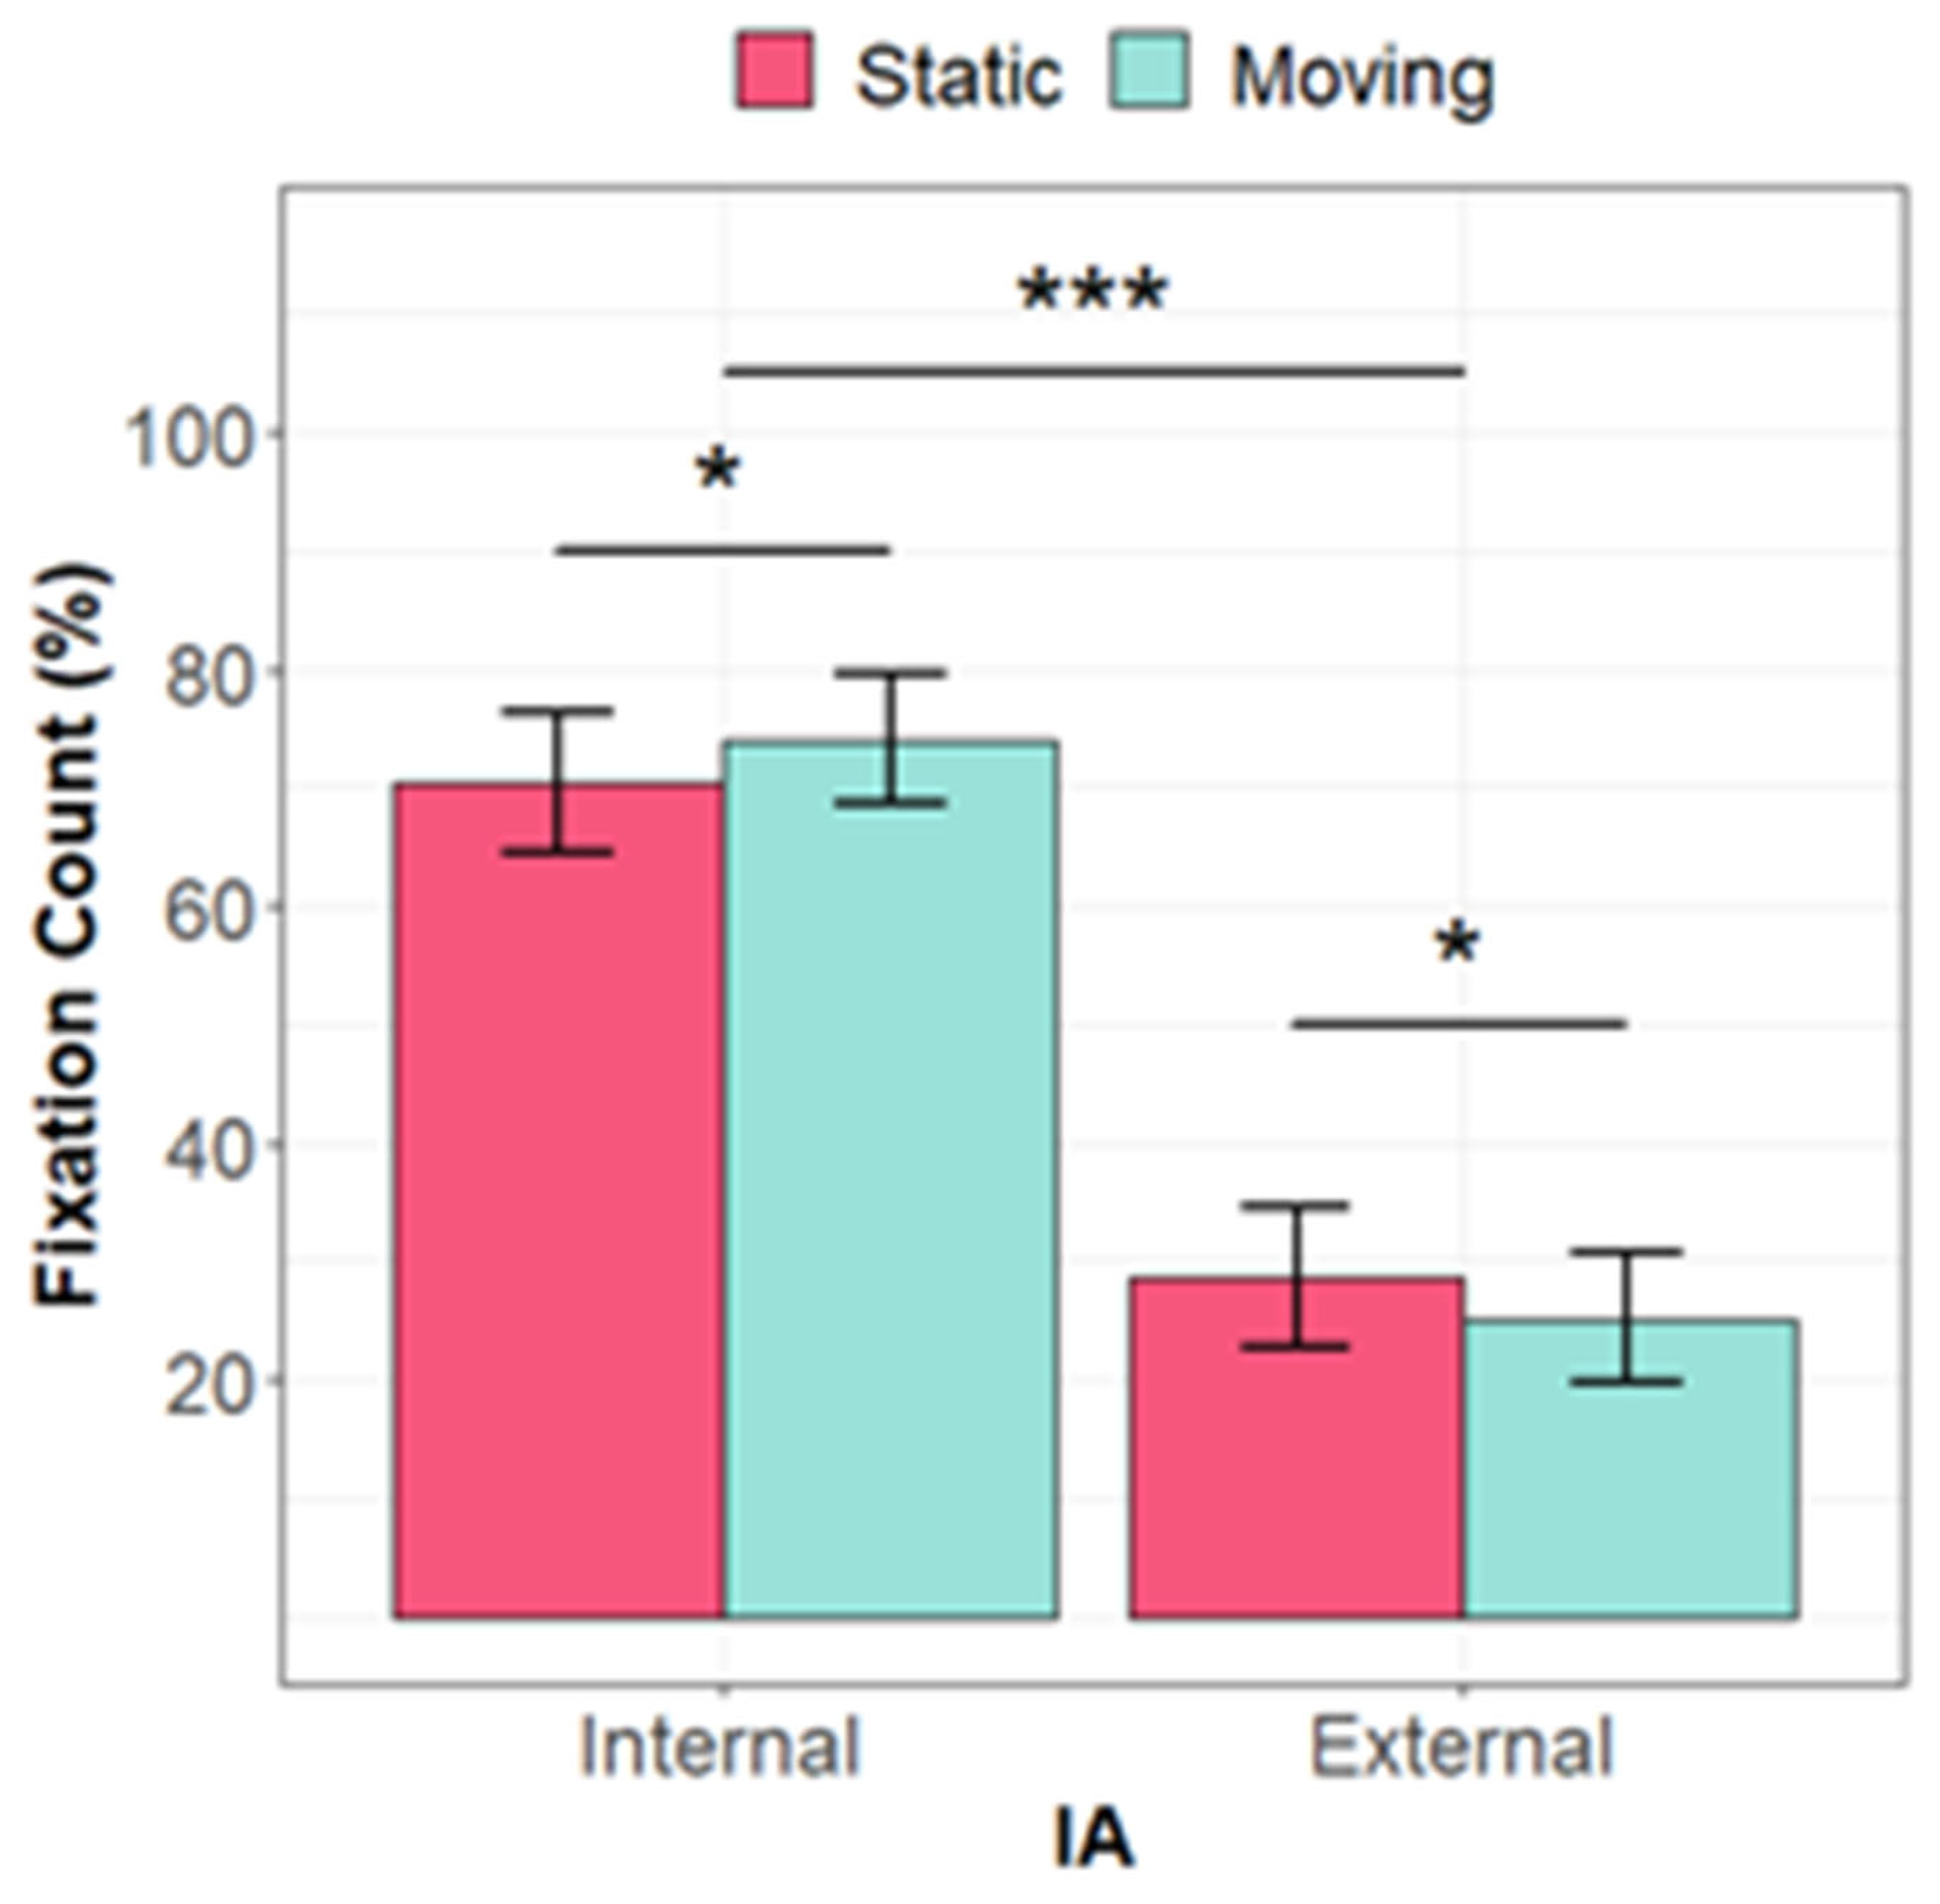
A significant interaction between presentation style and interest area was observed for fixation count,
F(1, 28) = 5.86,
p < 0.05, ω
2 = 0.14 (
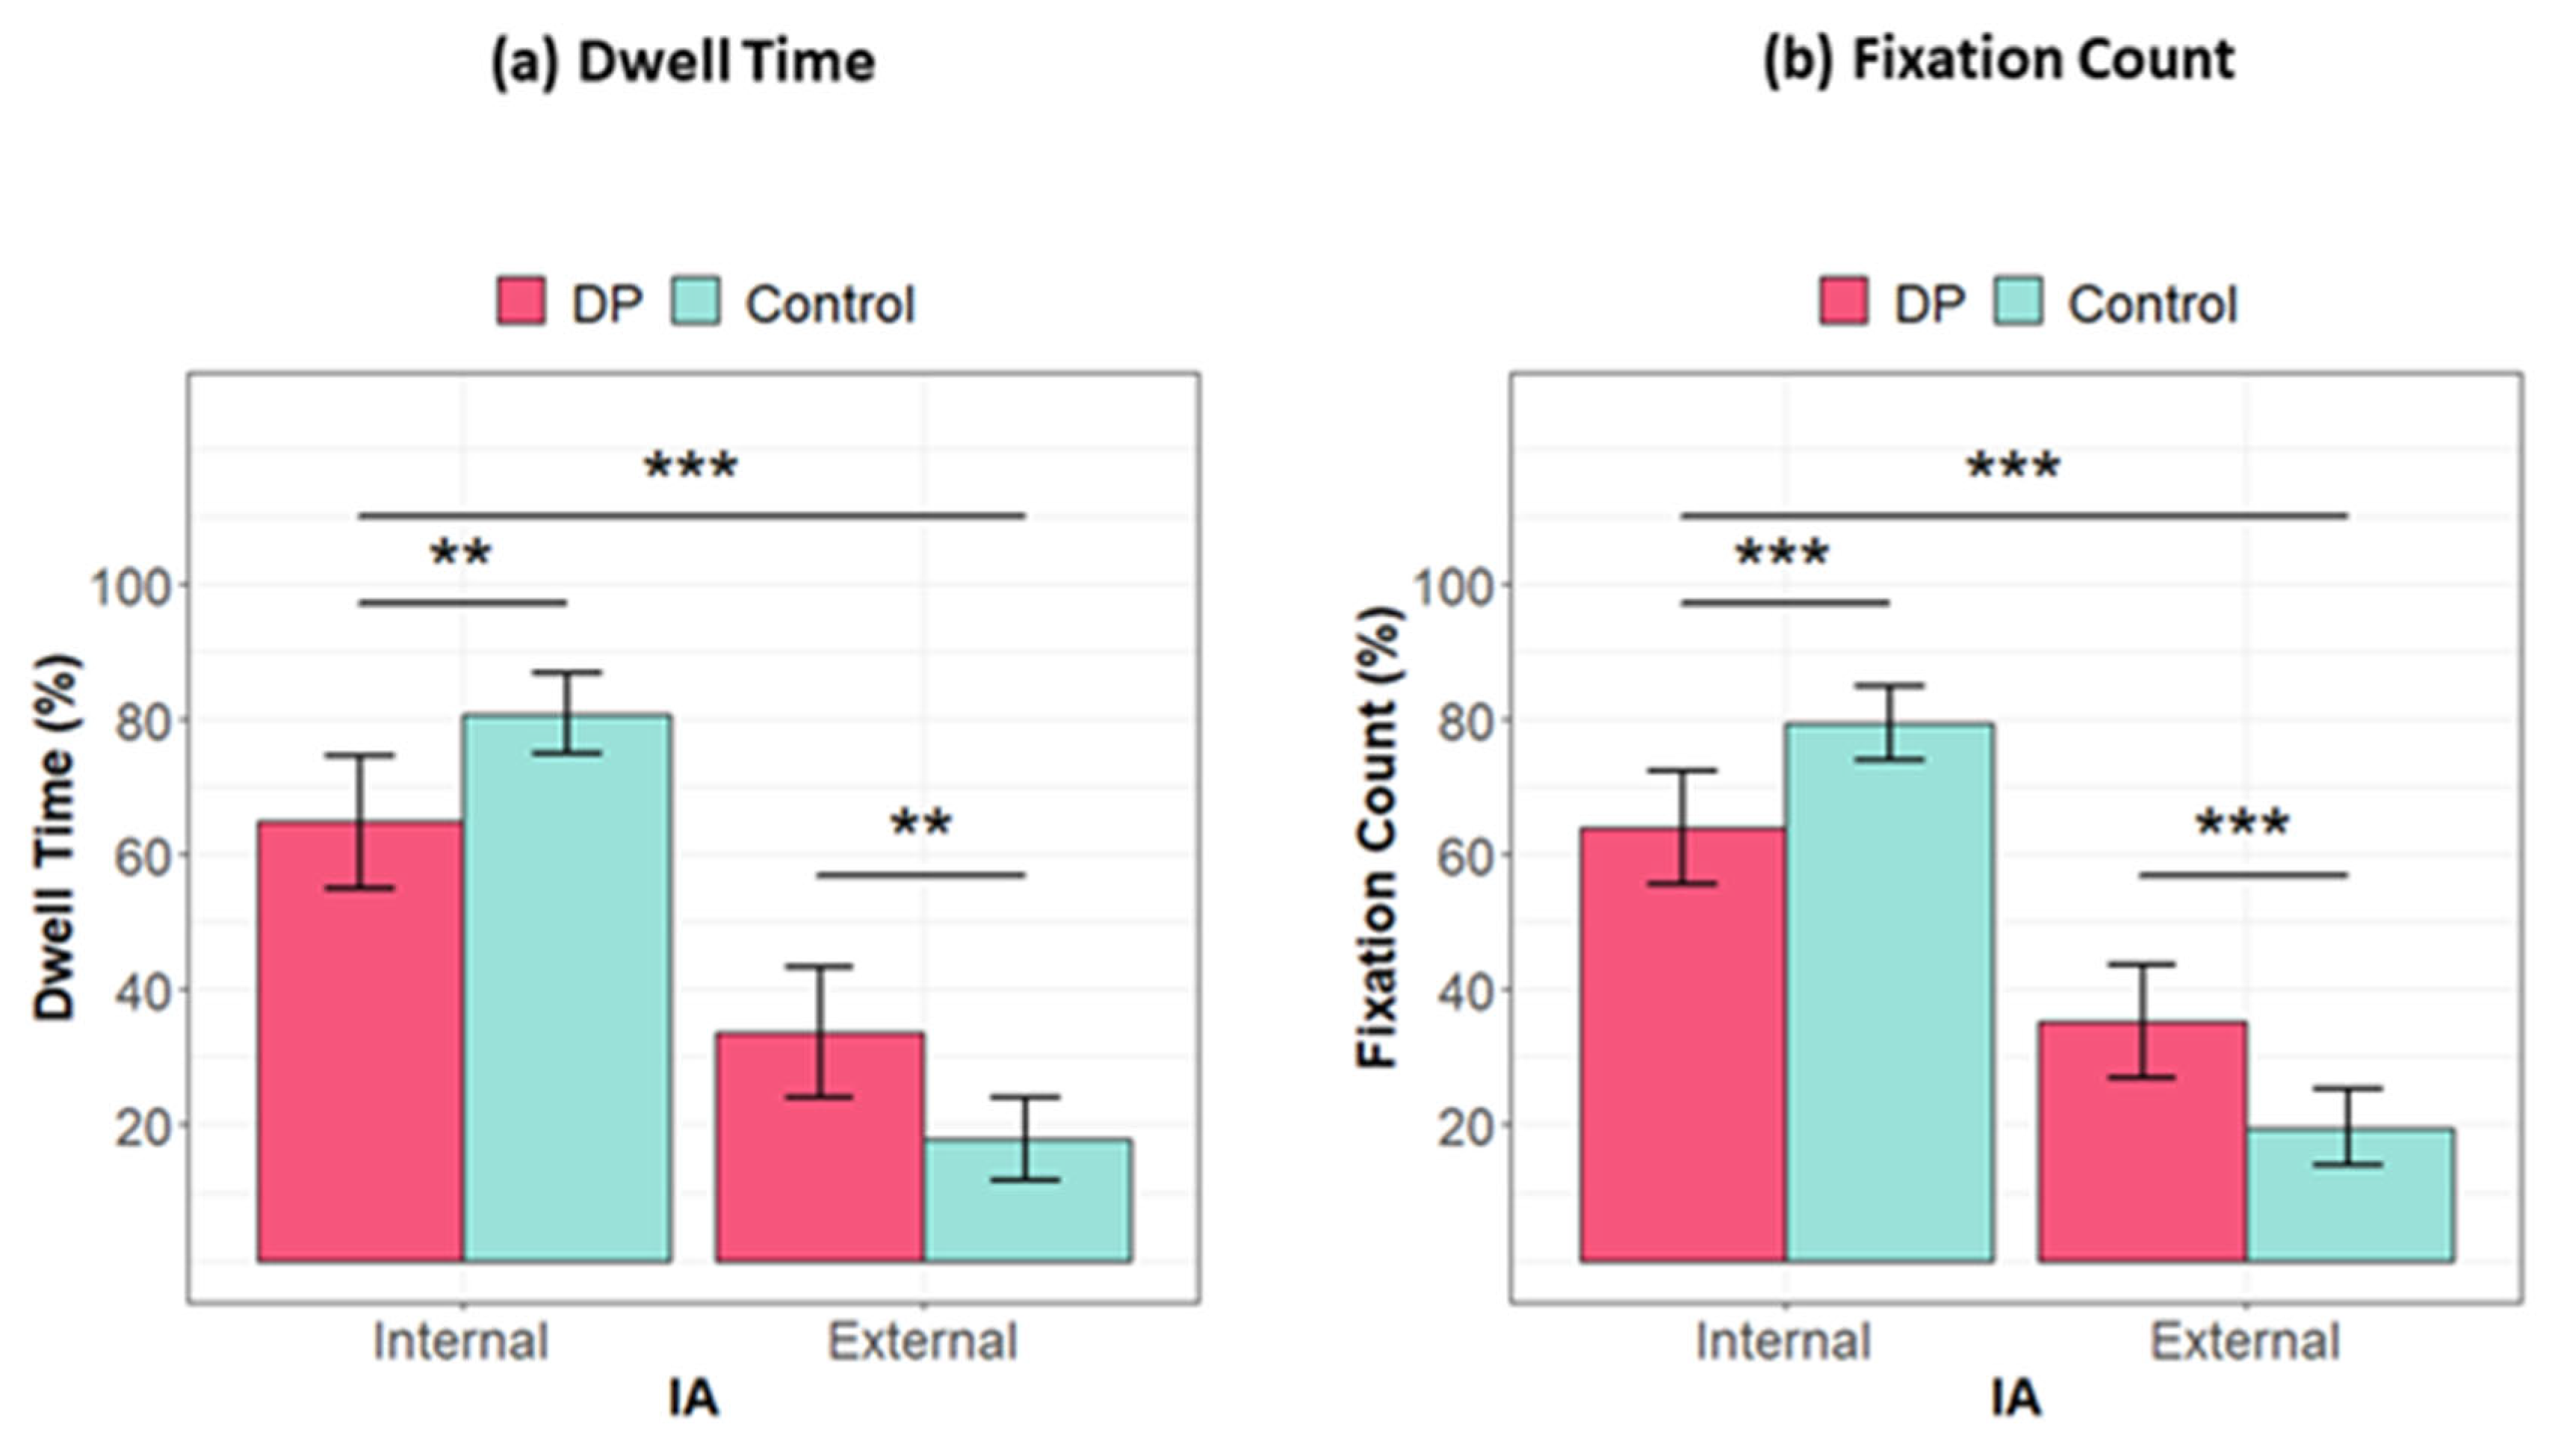
Figure 3), but not dwell time, indicating that a greater proportion of fixations was directed to the internal features in the moving condition relative to the static condition (mean difference = 3.62%, 95% CI [0.575, 6.67]). A larger interaction between interest area and group was also found for both dwell time,
F(1, 28) = 14.73,
p < 0.01, ω
2 = 0.32, and fixation count,
F(1, 28) = 18.11,
p < 0.001, ω
2 = 0.37 (
Figure 4). Participants in the control group directed relatively more fixations to the internal features than the DP group (mean difference = 15.43%, 95% CI [7.67, 23.19]), whereas the DP group directed relatively more fixations to the external features than the control group (mean difference = 15.69%, 95% CI [8.41, 22.97]). A similar pattern was observed for dwell time. All other main and interaction effects were non-significant (
ps > 0.05).
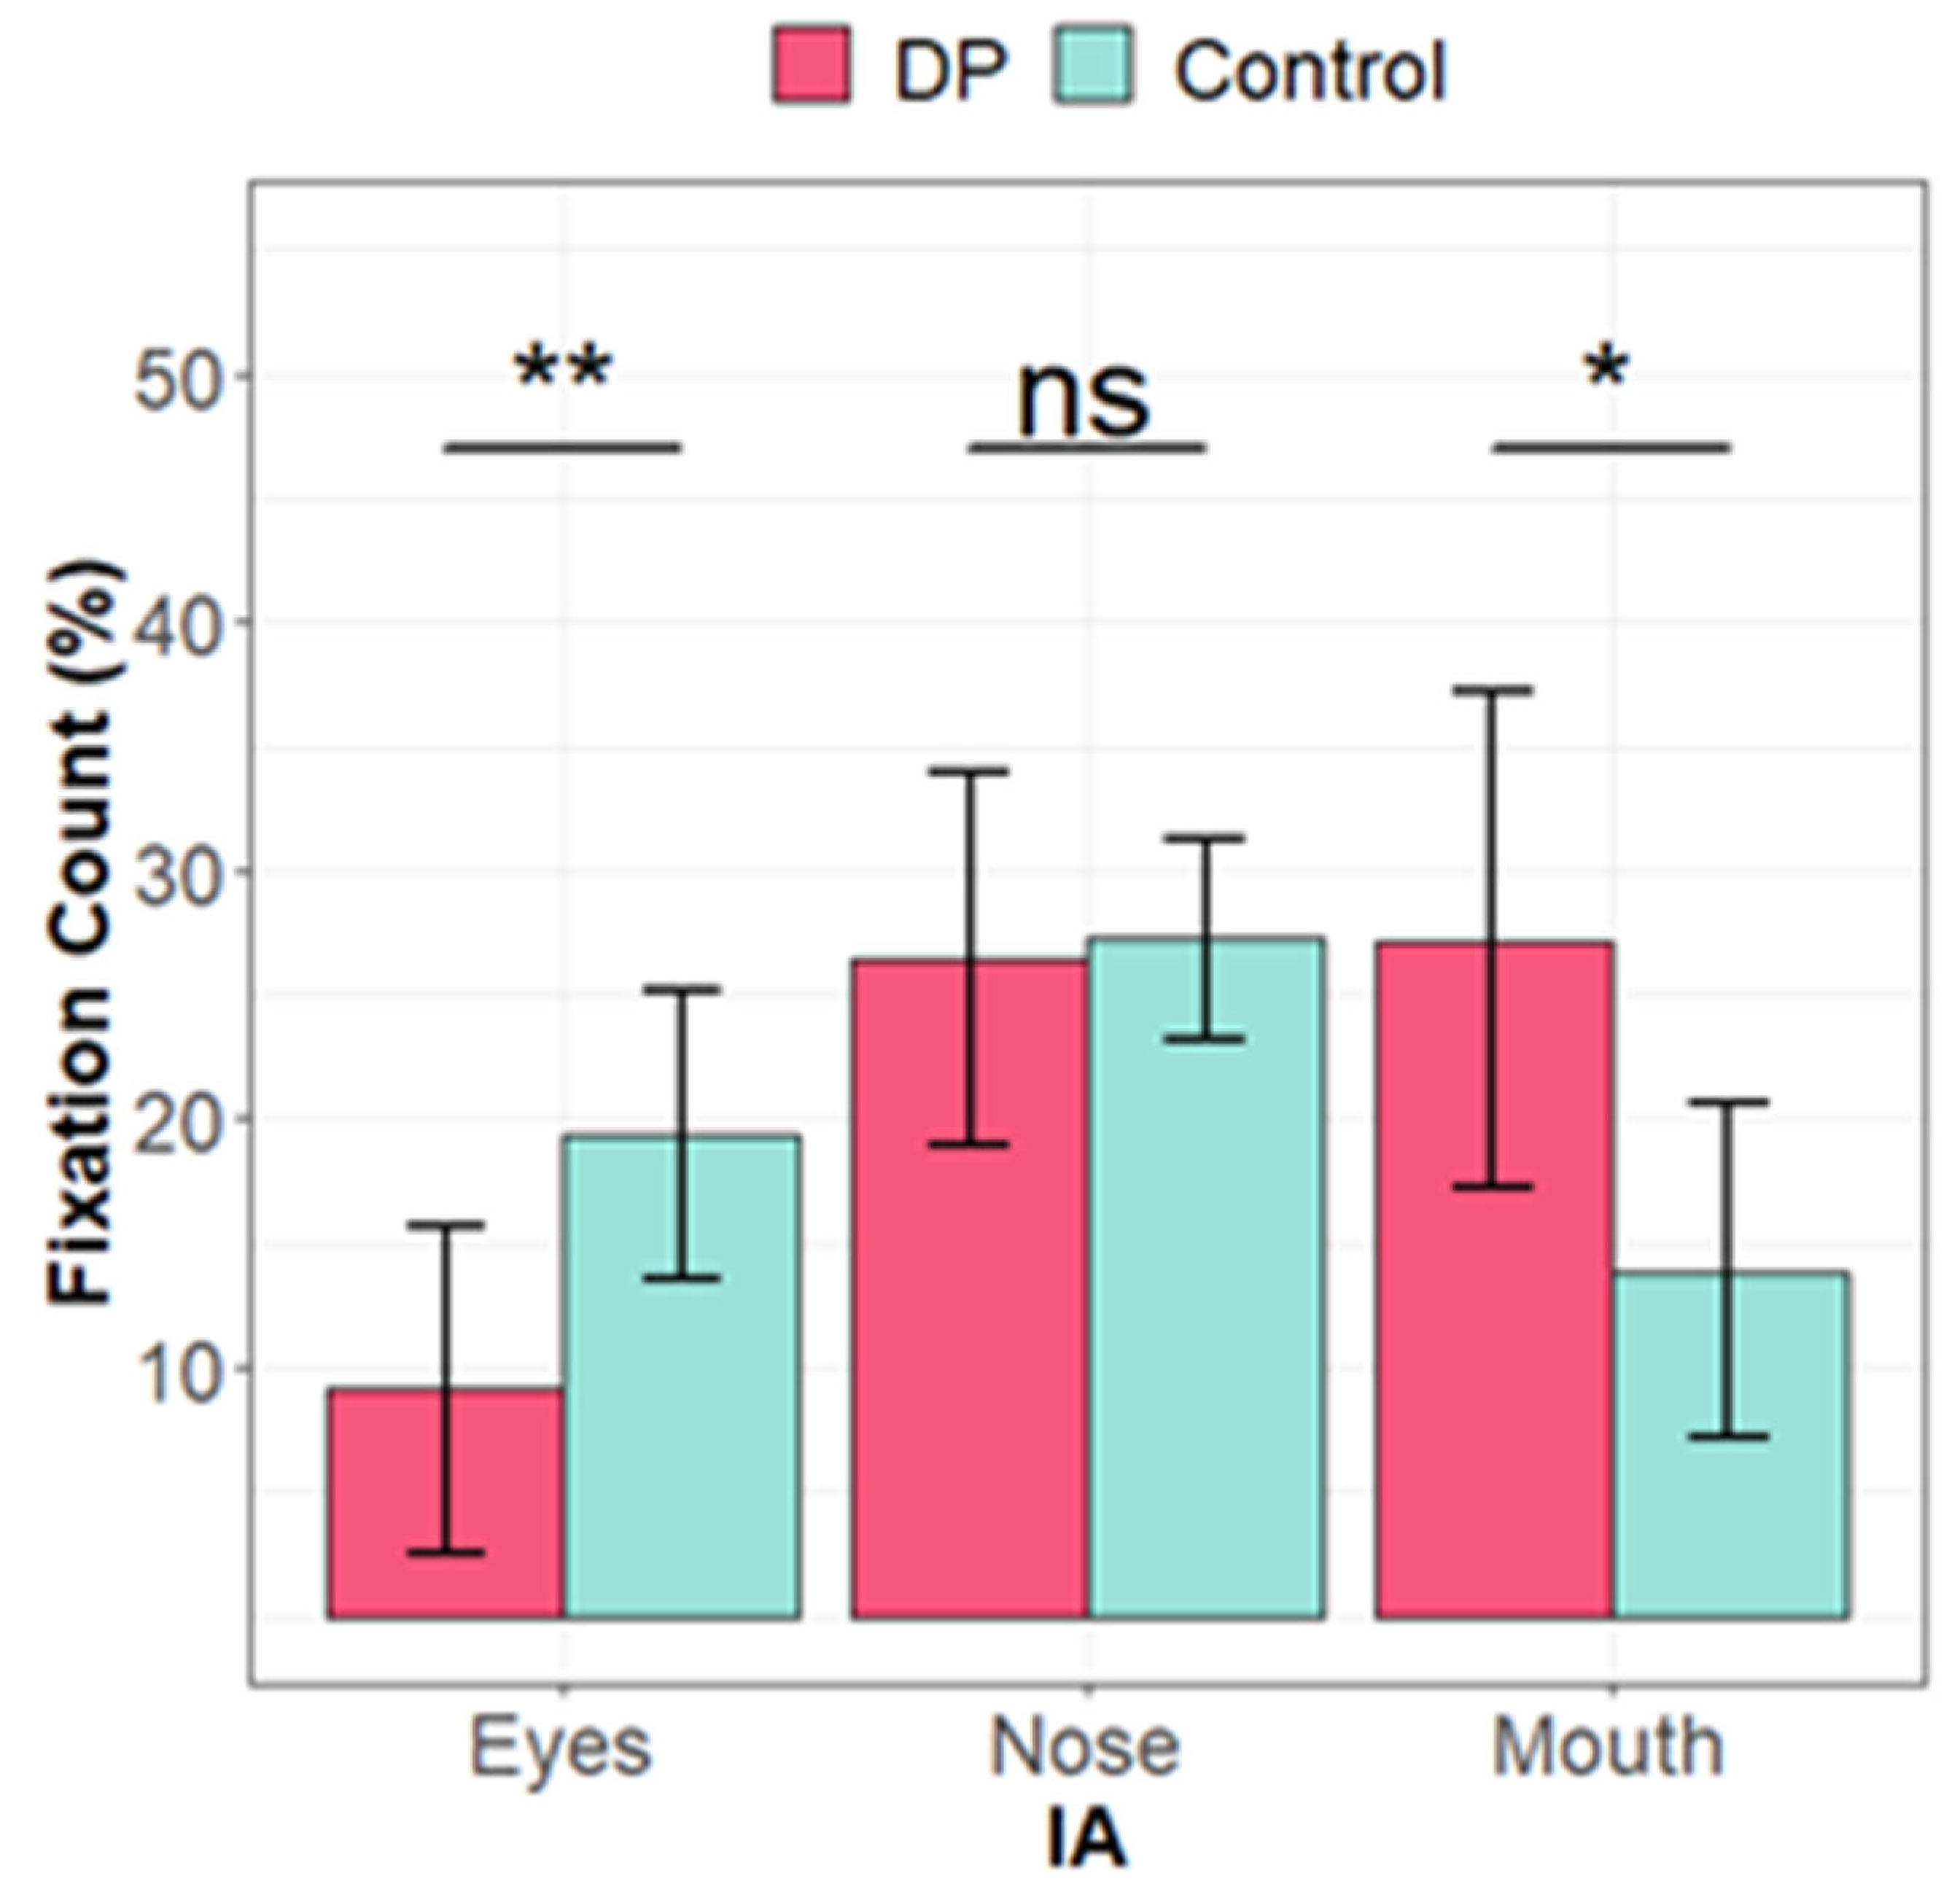
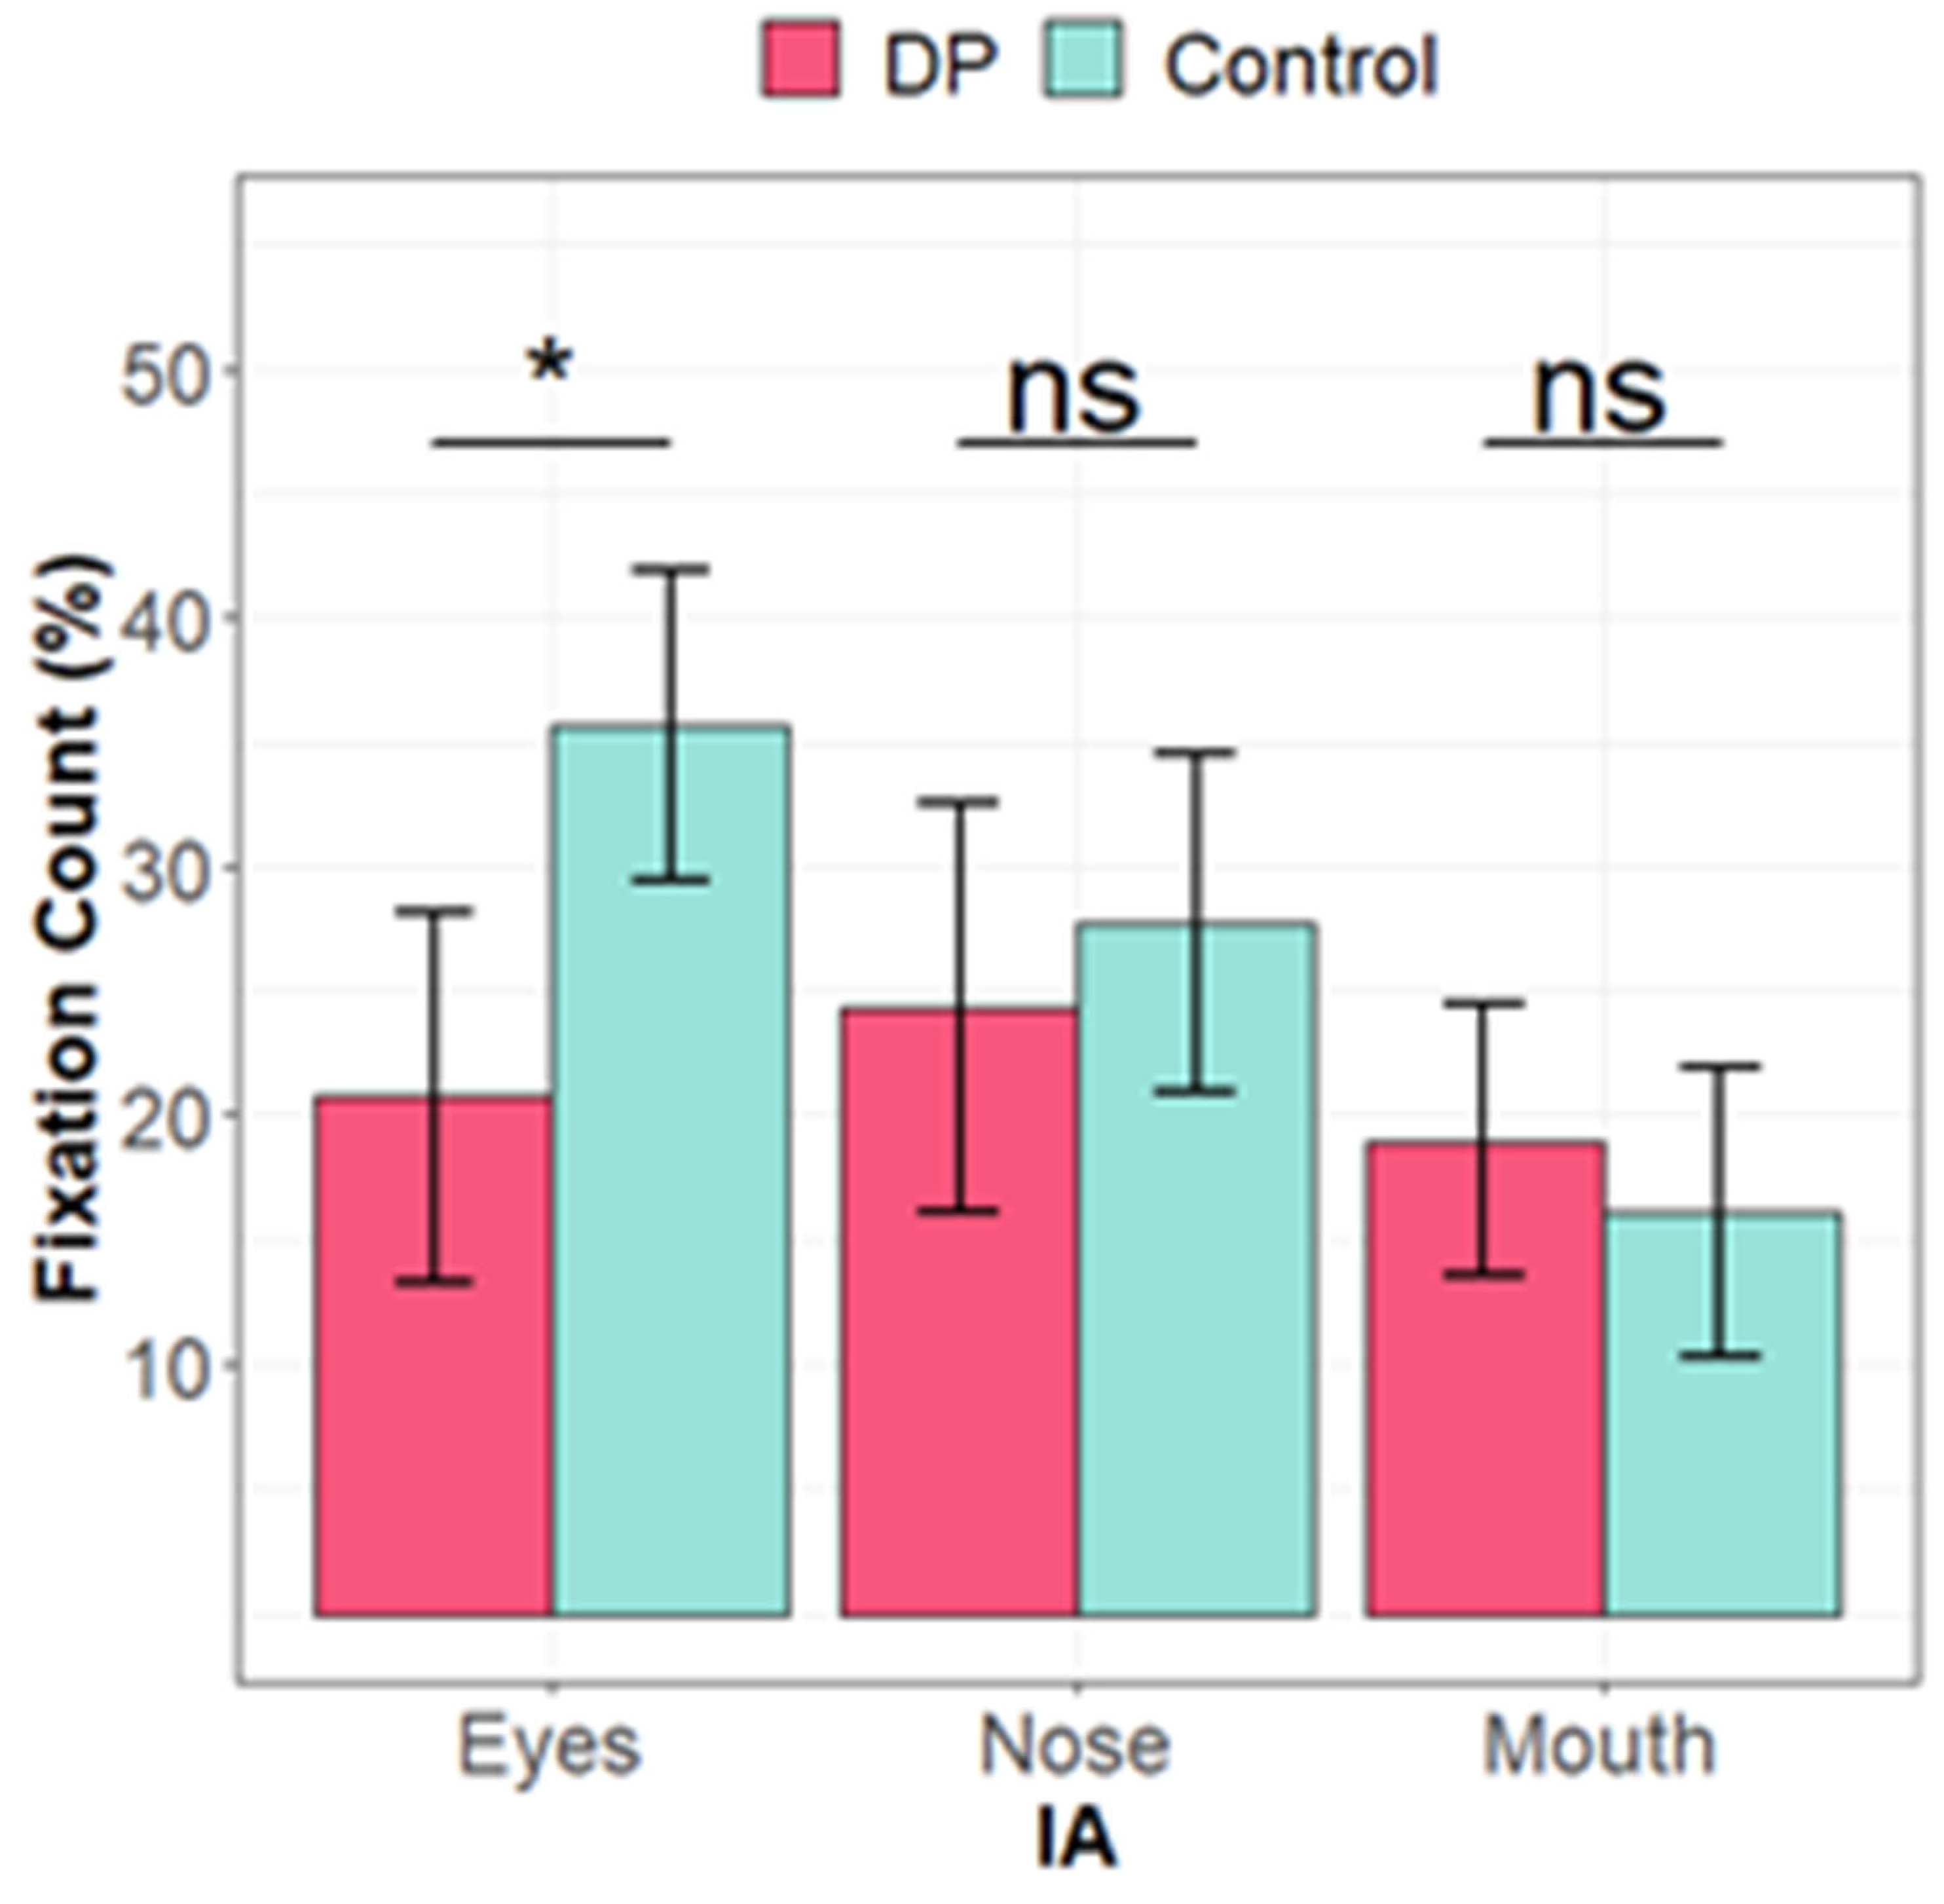
A 2 (presentation style) × 3 (interest area: eyes, nose and mouth) × 2 (group) ANOVA was performed to determine if the increased proportion of fixations directed to the internal features during moving trials relative to static could be attributed to attention to one specific feature. The ANOVA revealed a significant main effect of presentation style on fixation count,
F(1, 28) = 5.93,
p < 0.05, ω
2 = 0.02, with a greater proportion of fixations directed to the internal features when faces were presented in motion. There was also a significant main effect of IA,
F(2, 56) = 7.04,
p < 0.01, ω
2 = 0.16, with more attention directed to the nose than the mouth. An interaction between interest area and group,
F(2, 56) = 4.52,
p < 0.05, ω
2 = 0.10, reflected greater fixation to the eye region in the control group relative to the DP group (mean difference = 16.29%, 95% CI [5.81, 26.77],
Figure 5). No other effects were significant.
Descriptive statistics for proportional dwell time and fixation count directed to the internal and external features during the recognition phase are presented in
Table 6. A three-way ANOVA revealed a main effect of interest area on dwell time,
F(1, 28) = 171.93,
p < 0.001, ω
2 = 0.85, and fixation count,
F(1, 28) = 178.84,
p < 0.001, ω
2 = 0.86, with greater attention to internal features. This was qualified by an interaction with group (dwell time:
F(1, 28) = 10.94,
p < 0.01, ω
2 = 0.25; fixation count:
F(1, 28) = 11.88,
p < 0.01, ω
2 = 0.27), again reflecting reduced internal feature and increased external feature attention in the DP group. For fixation count, the control group directed a greater proportion of fixations to the internal features than the DP group (mean difference = 12.84%, 95% CI [4.87, 20.82]); a similar pattern was observed for dwell time (see
Figure 6).
Fixation-shifting counts at learning and test were analysed using 2 (presentation style) × 2 (group) ANOVA. Results revealed a main effect of presentation style during face learning, F(1, 28) = 4.24, p < 0.05, ω2 = 0.01, with fewer fixation shifts for faces learned in motion than for those learned in a static form (mean difference = 0.39, 95% CI [0.002, 0.79]. No group differences or interactions were observed (ps > 0.33). During recognition, there was a main effect of group, F(1, 28) = 9.12, p < 0.01, ω2 = 0.12, with more fixation shifts in the DP group compared to the control group (mean difference = 3.36, 95% CI [1.08, 5.62]. No other effects were significant.