
Idiopathic Syringomyelia: Diagnostic Value of Cranial Morphometric Parameters


Abstract
1. Introduction
2. Materials and Methods
2.1. Study Design and Participants
2.2. Inclusion and Exclusion Criteria
2.3. Data Collection and Imaging Parameters
- T1-weighted: TR 250 ms, TE 4.76 ms.
- T2-weighted: TR 3000–4000 ms, TE 100–120 ms.
- Slice thickness: 3 mm, inter-slice gap: 0.5 mm.
- Field of view: 230–280 mm.
- Matrix: 205 × 256 (T1) and 320 × 320 (T2).
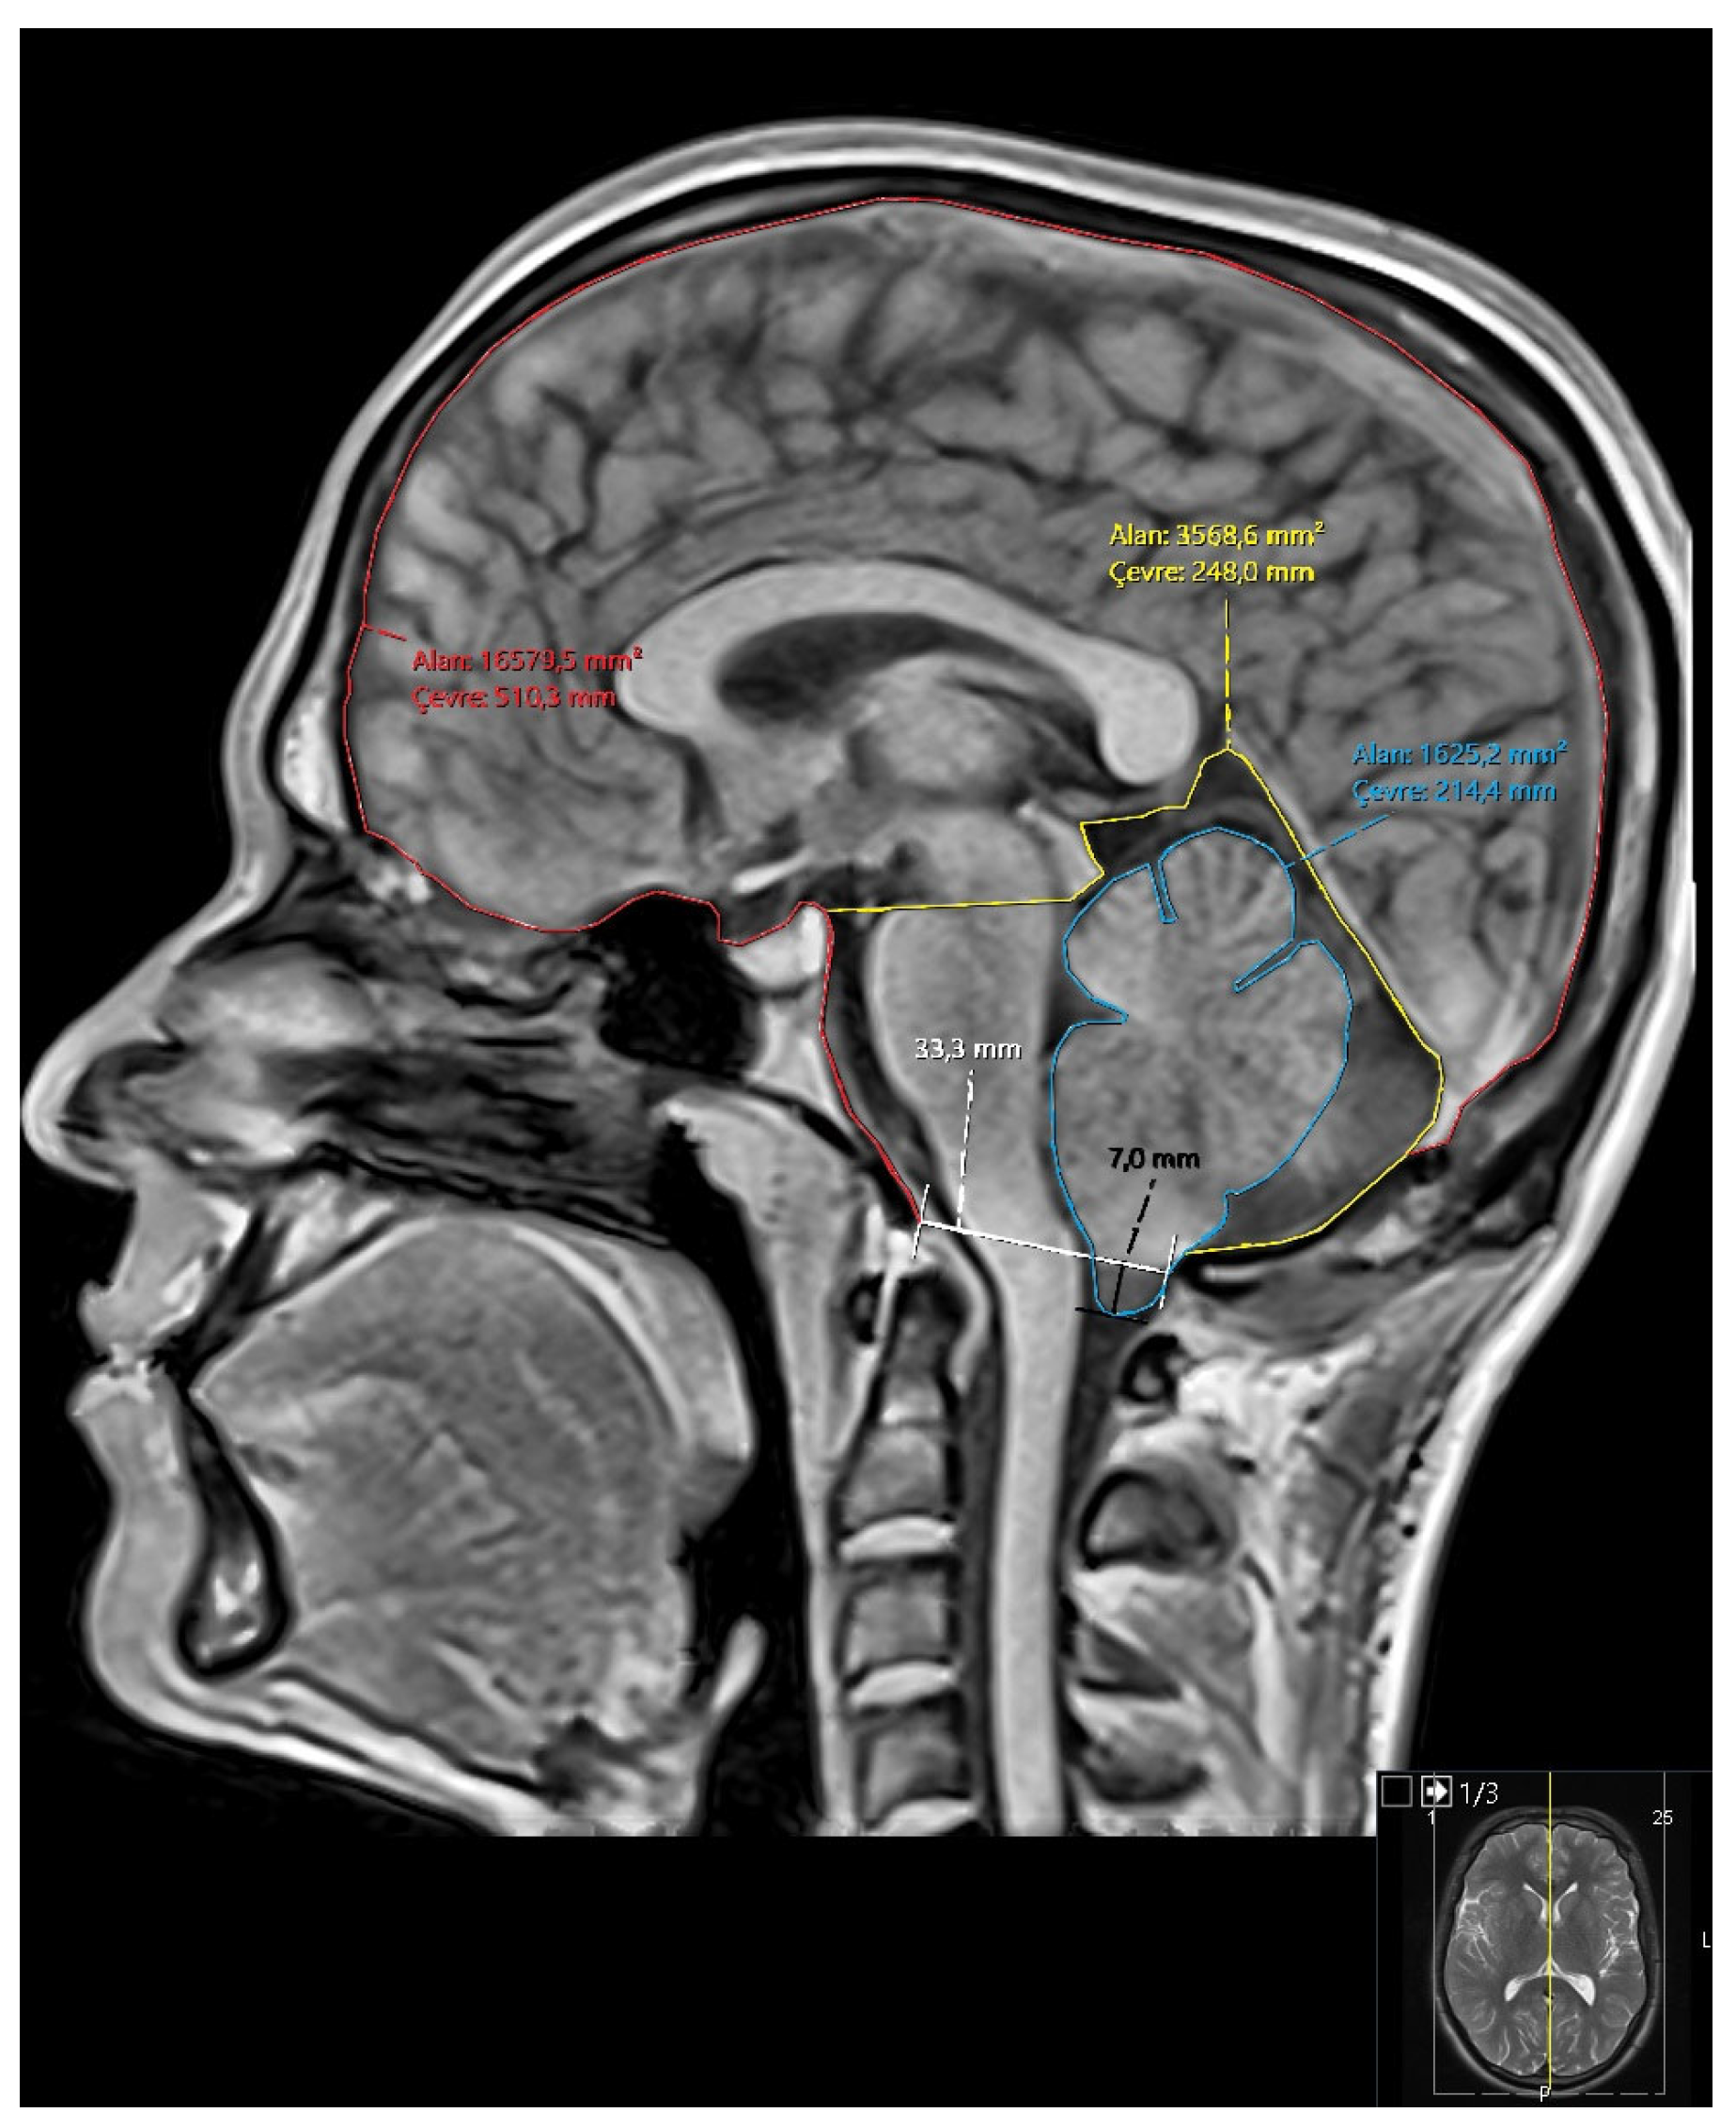
- Diameter of the foramen magnum.
- Degree of tonsillar descent (for Groups 2 and 3).
- Area and perimeter of the posterior fossa.
- Area and perimeter of the cerebellum.
- Area and perimeter of the intracranial cavity.
- Ratios: cerebellum/posterior fossa, posterior fossa/intracranial area, cerebellum/intracranial area (Figure 1).
2.4. Group Classification
- Group 1 (Control): Healthy individuals with no pathological findings on brain or spinal MRI.
- Group 2 (Chiari): Patients with ≥5 mm cerebellar tonsil herniation.
- Group 3 (Chiari + SM): Patients with both tonsillar herniation and SM.
- Group 4 (Idiopathic SM): Patients who met criteria for idiopathic SM.
2.5. Statistical Analysis
3. Results
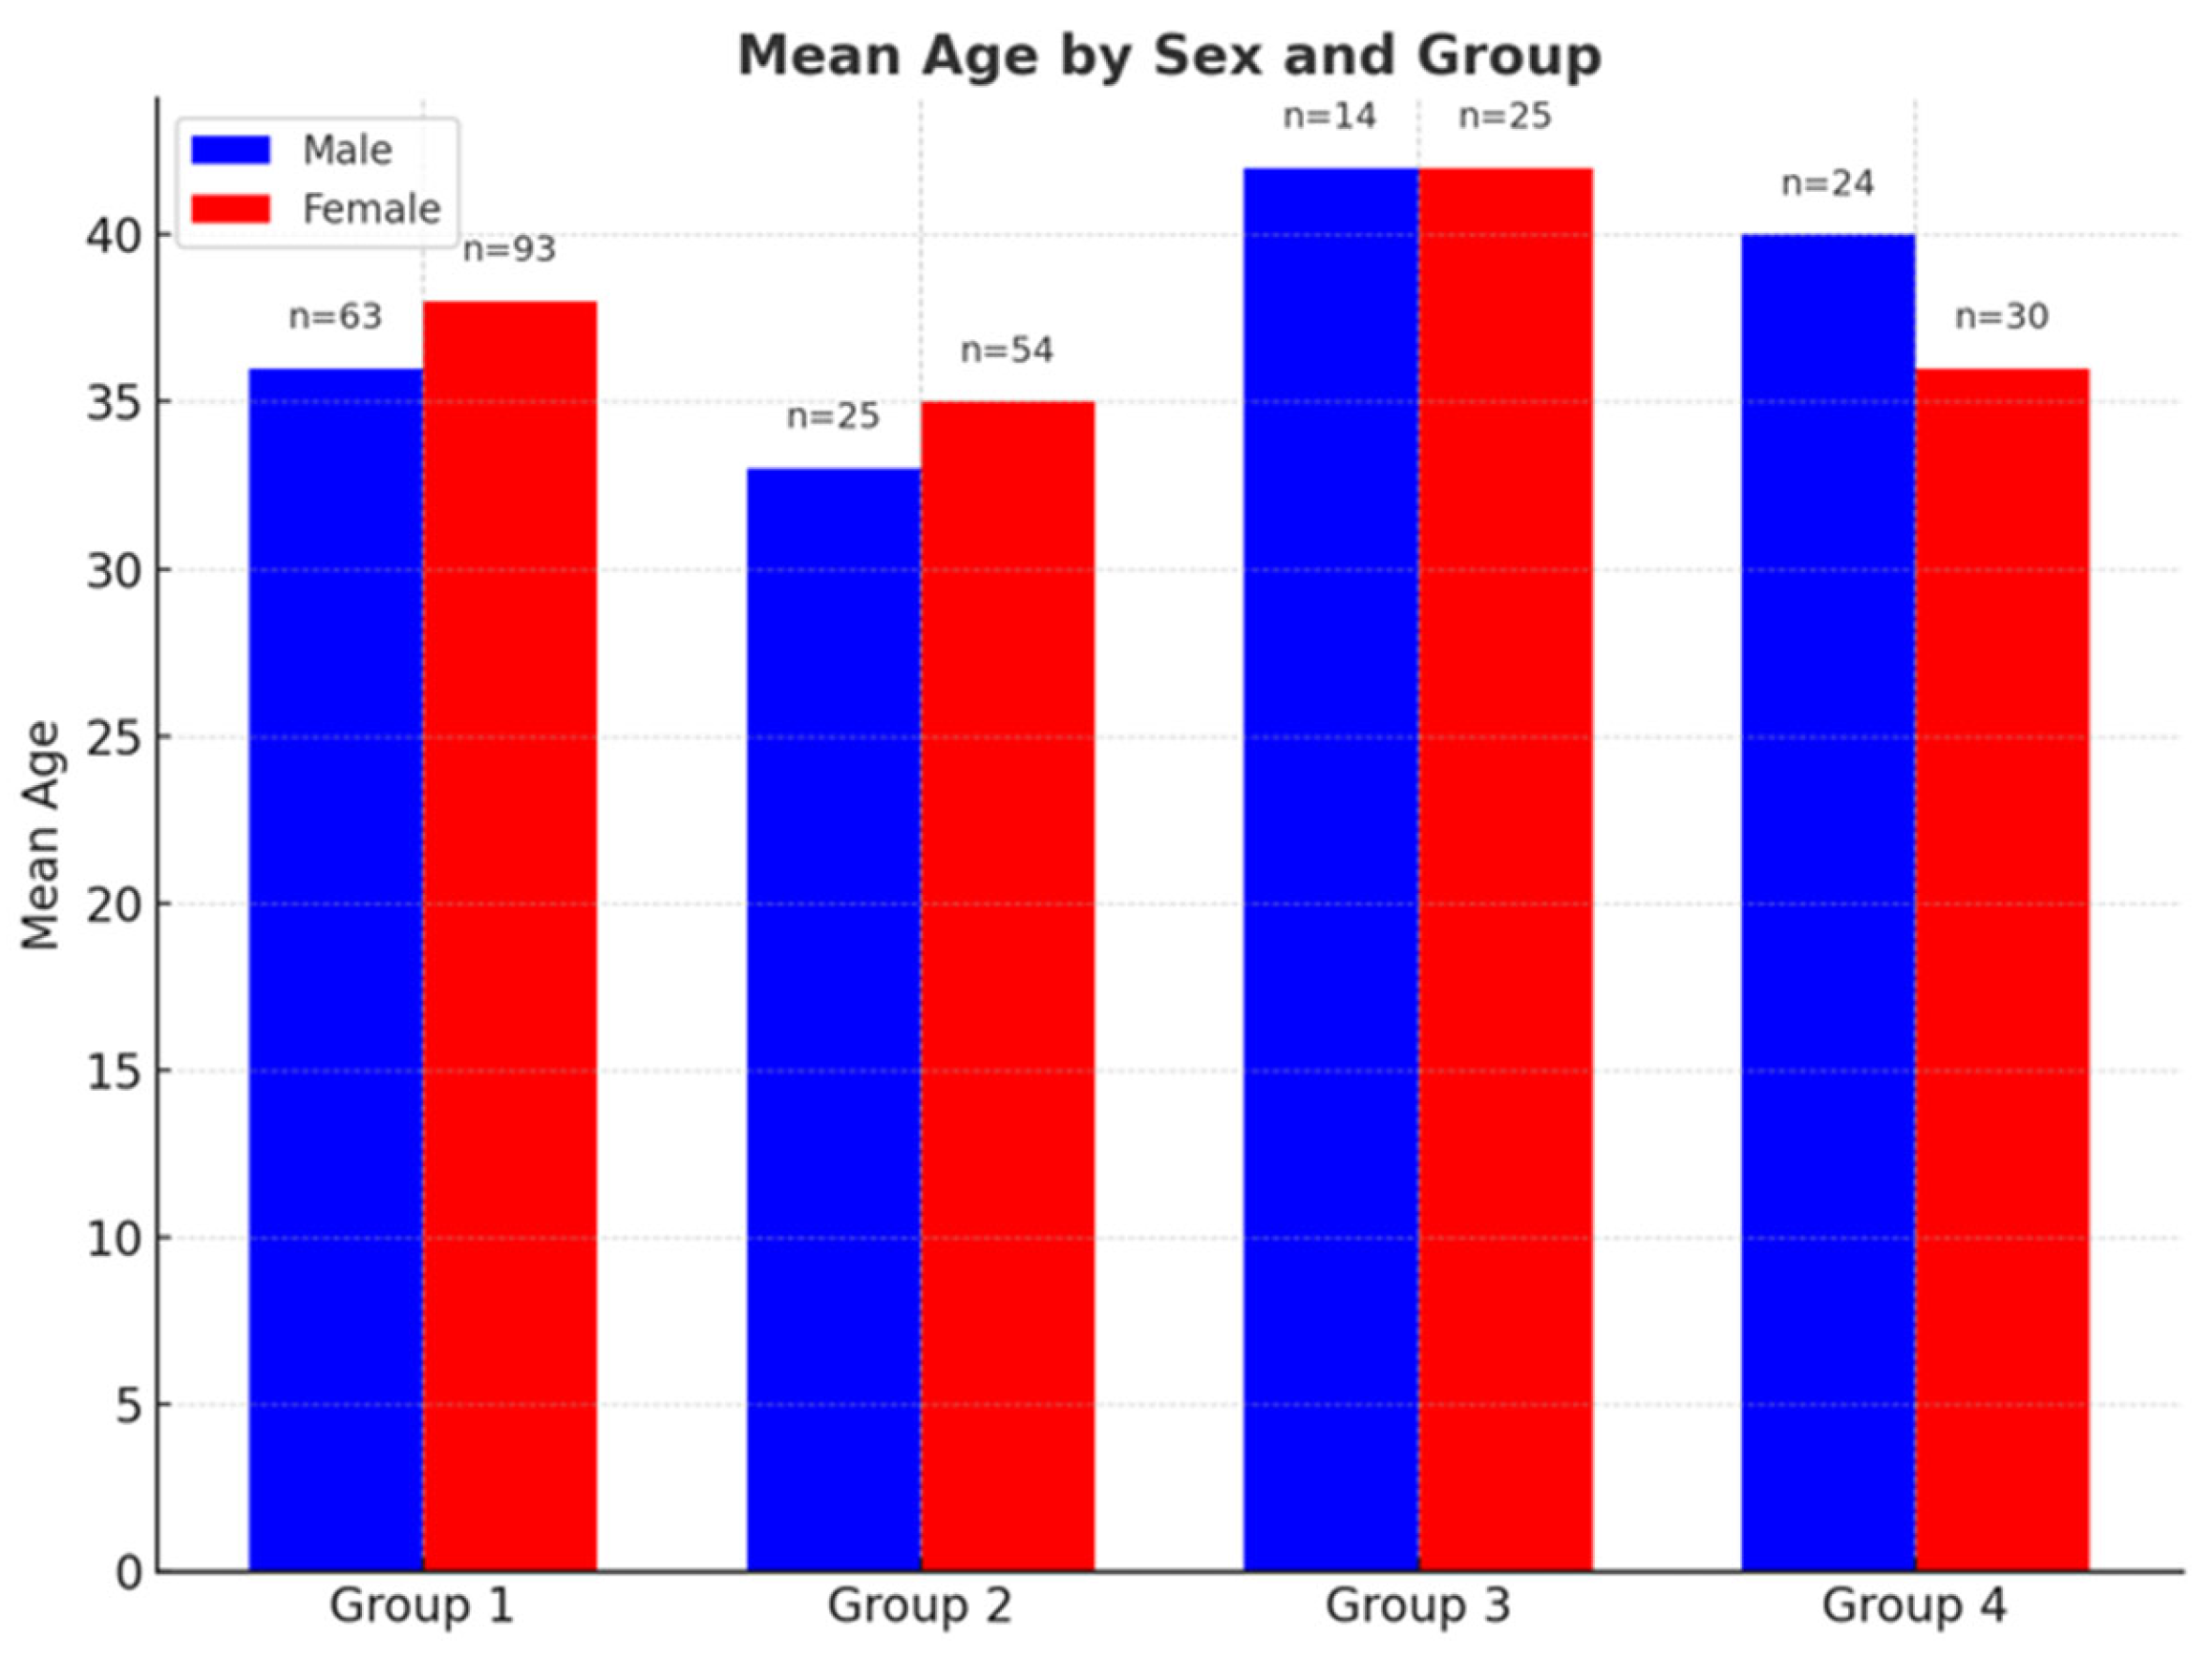
3.1. Participants
- Group 1: 36.83 years (range: 18–60).
- Group 2: 34.08 years (19–60).
- Group 3: 42.36 years (24–60).
- Group 4: 41.08 years (18–60).
- Group 1: 37.97 years (range: 18–60).
- Group 2: 38.74 years (18–60).
- Group 3: 42.84 years (23–60).
- Group 4: 34.57 years (18–60) (Figure 2).
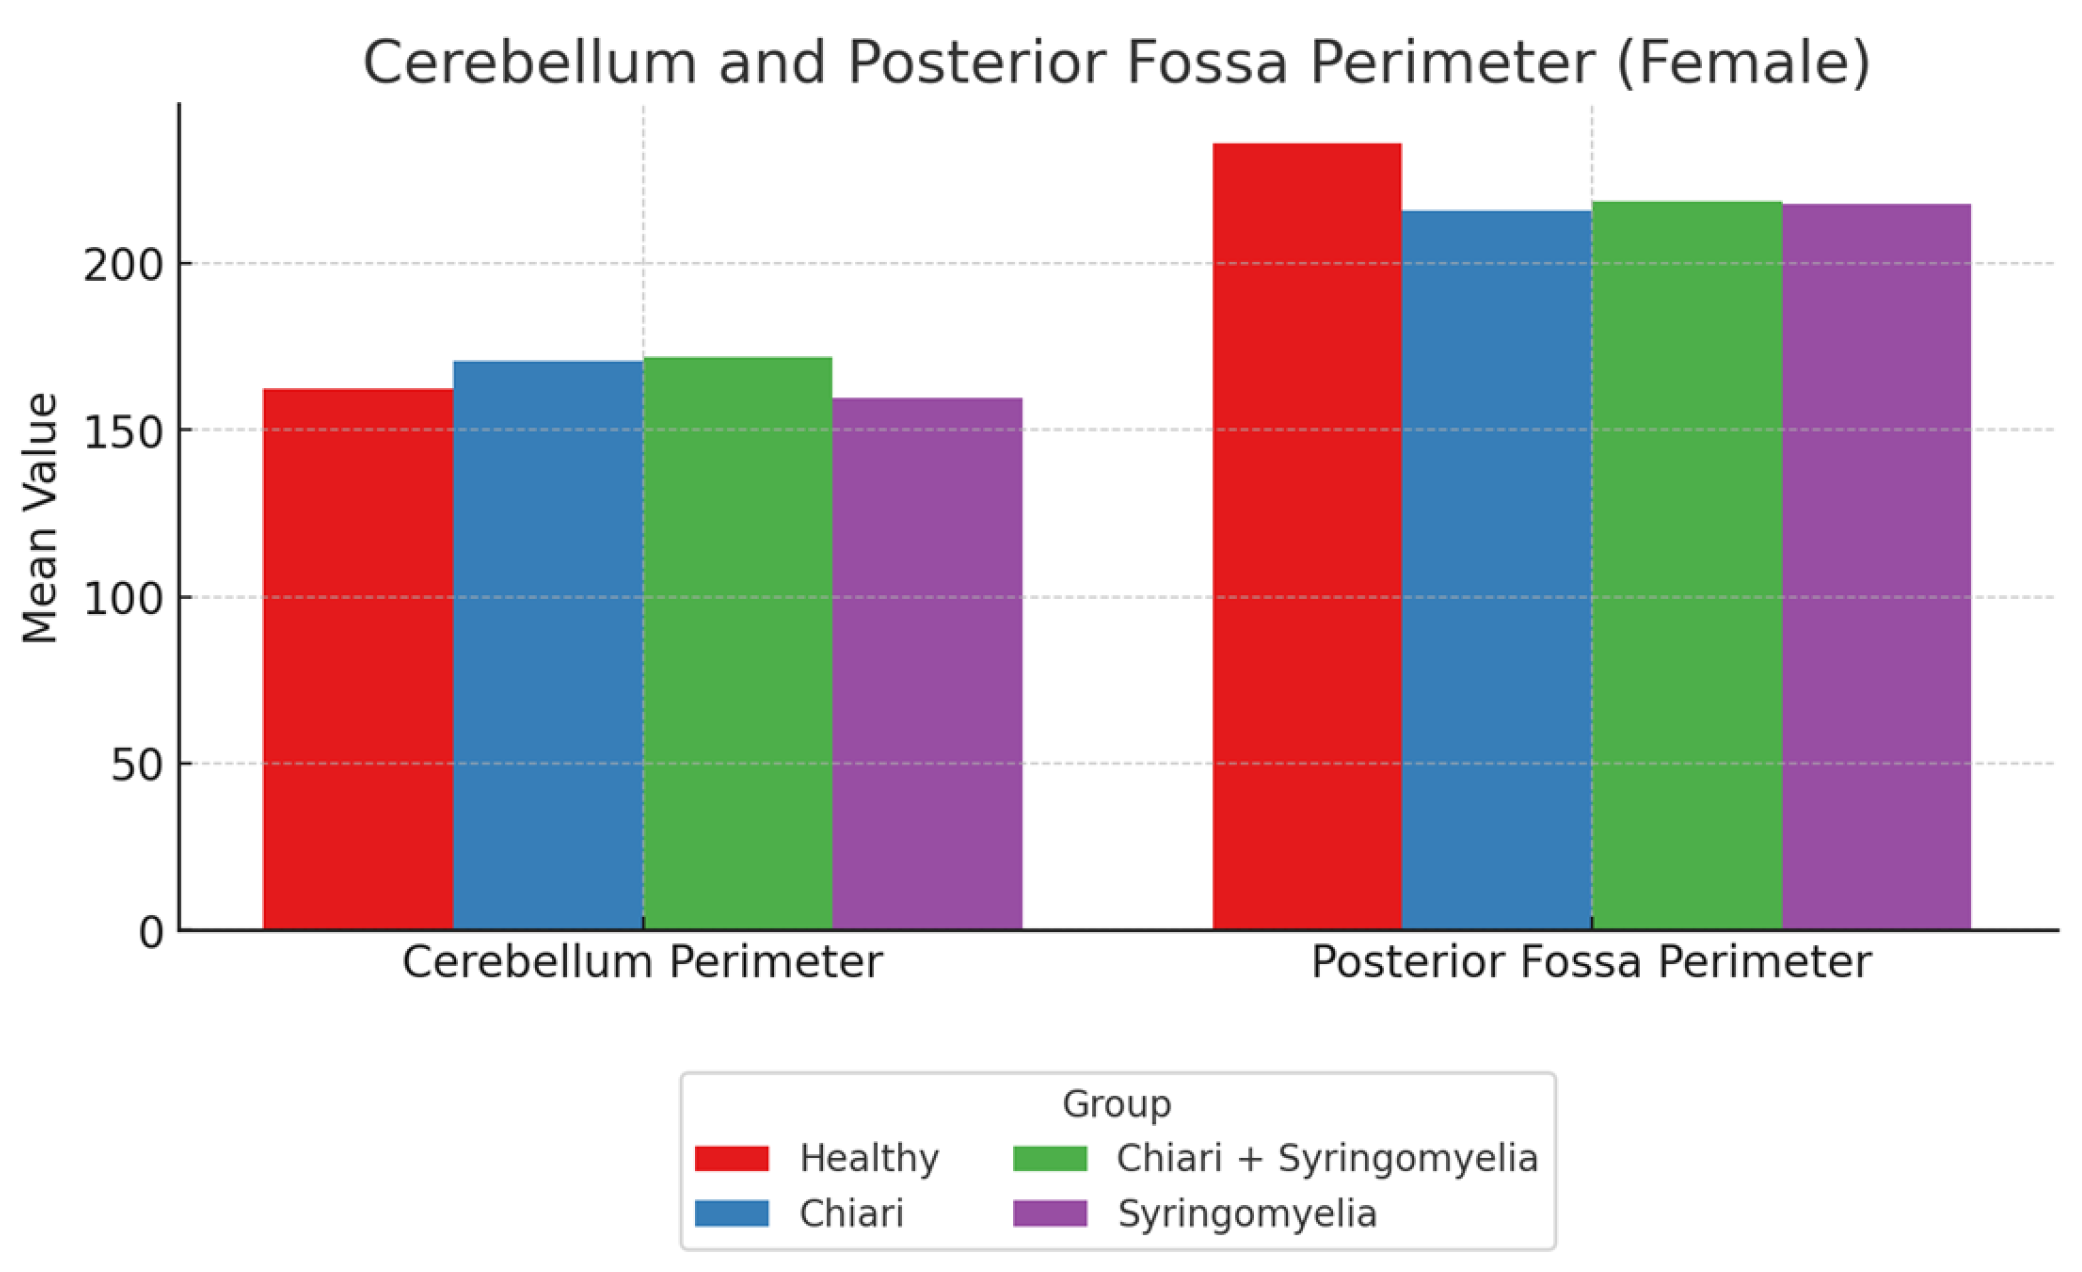
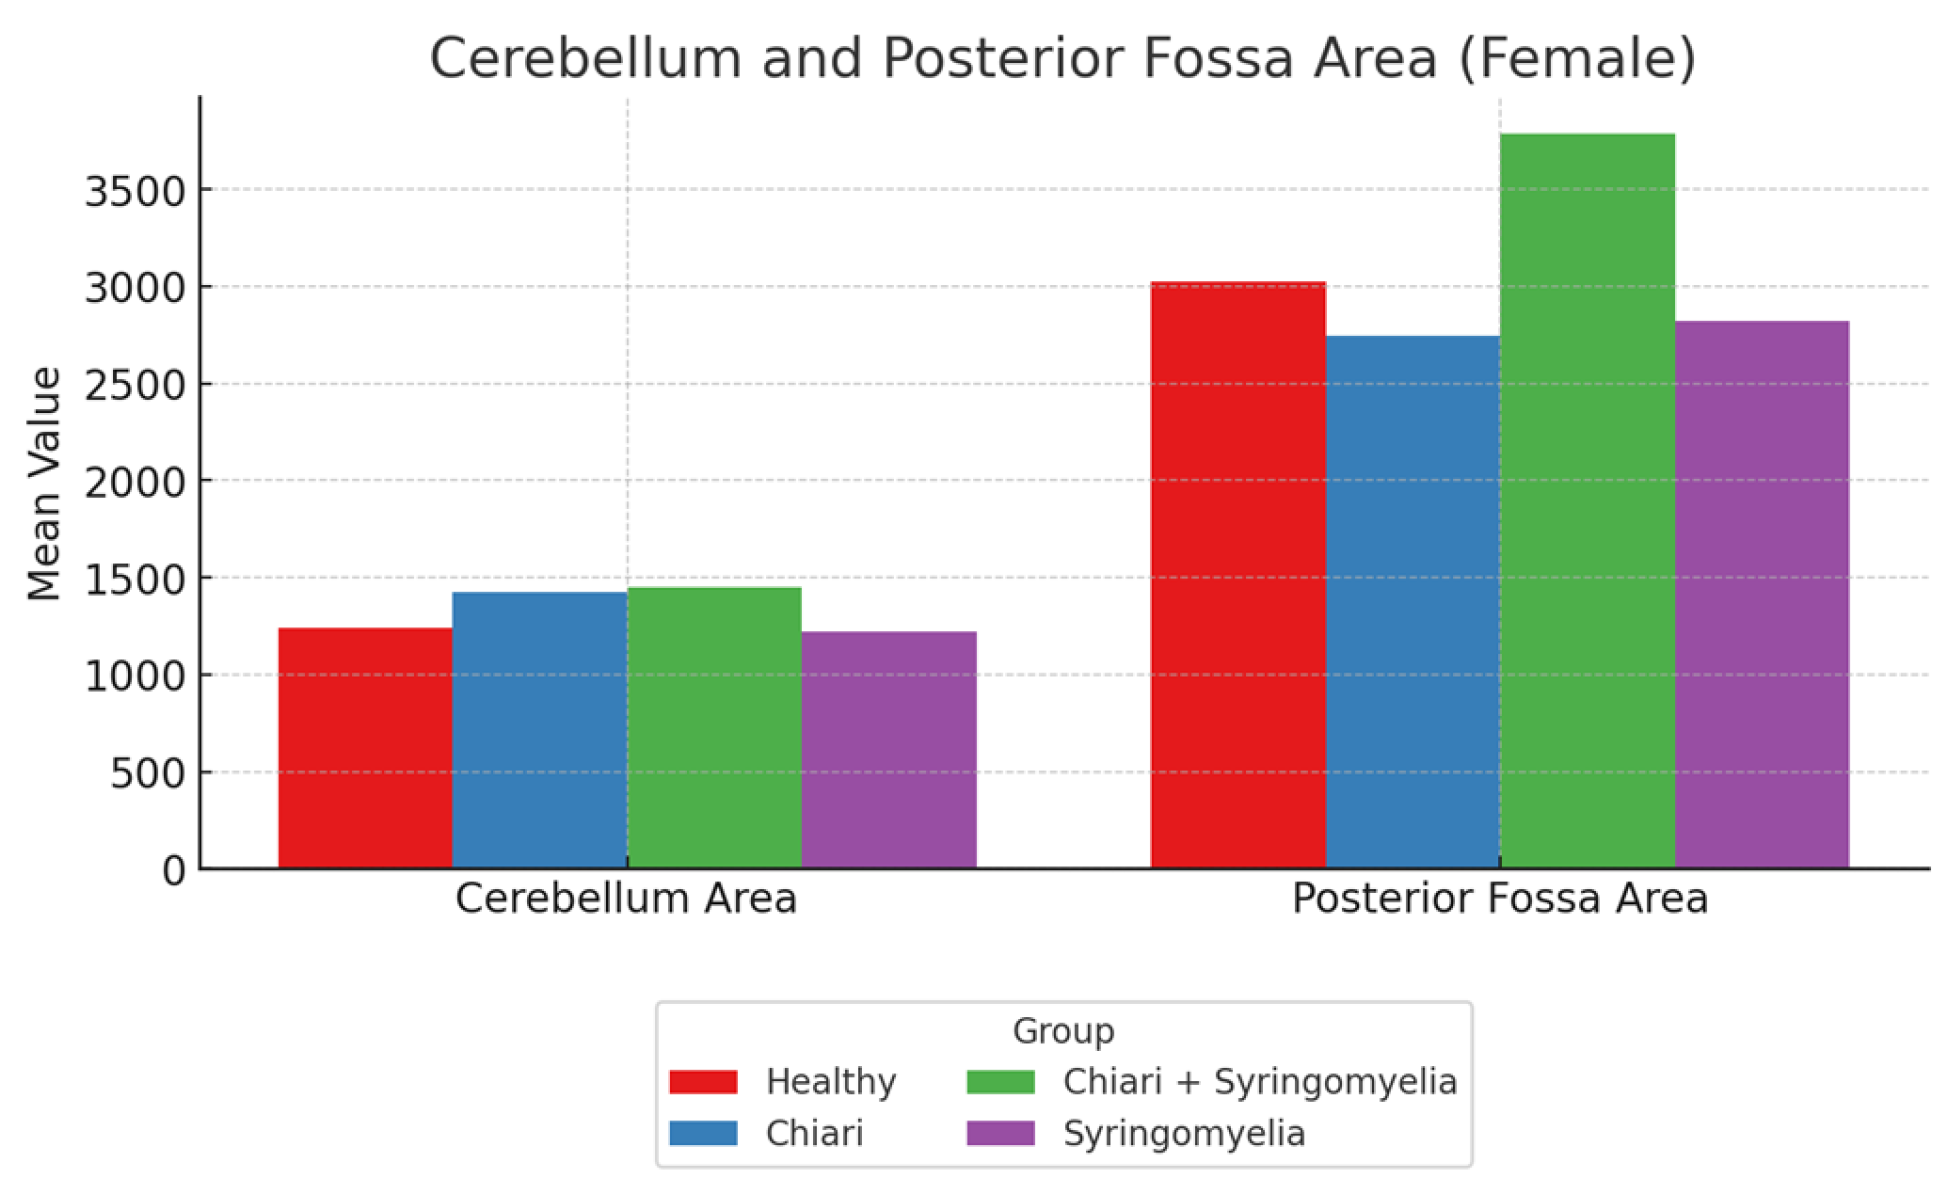
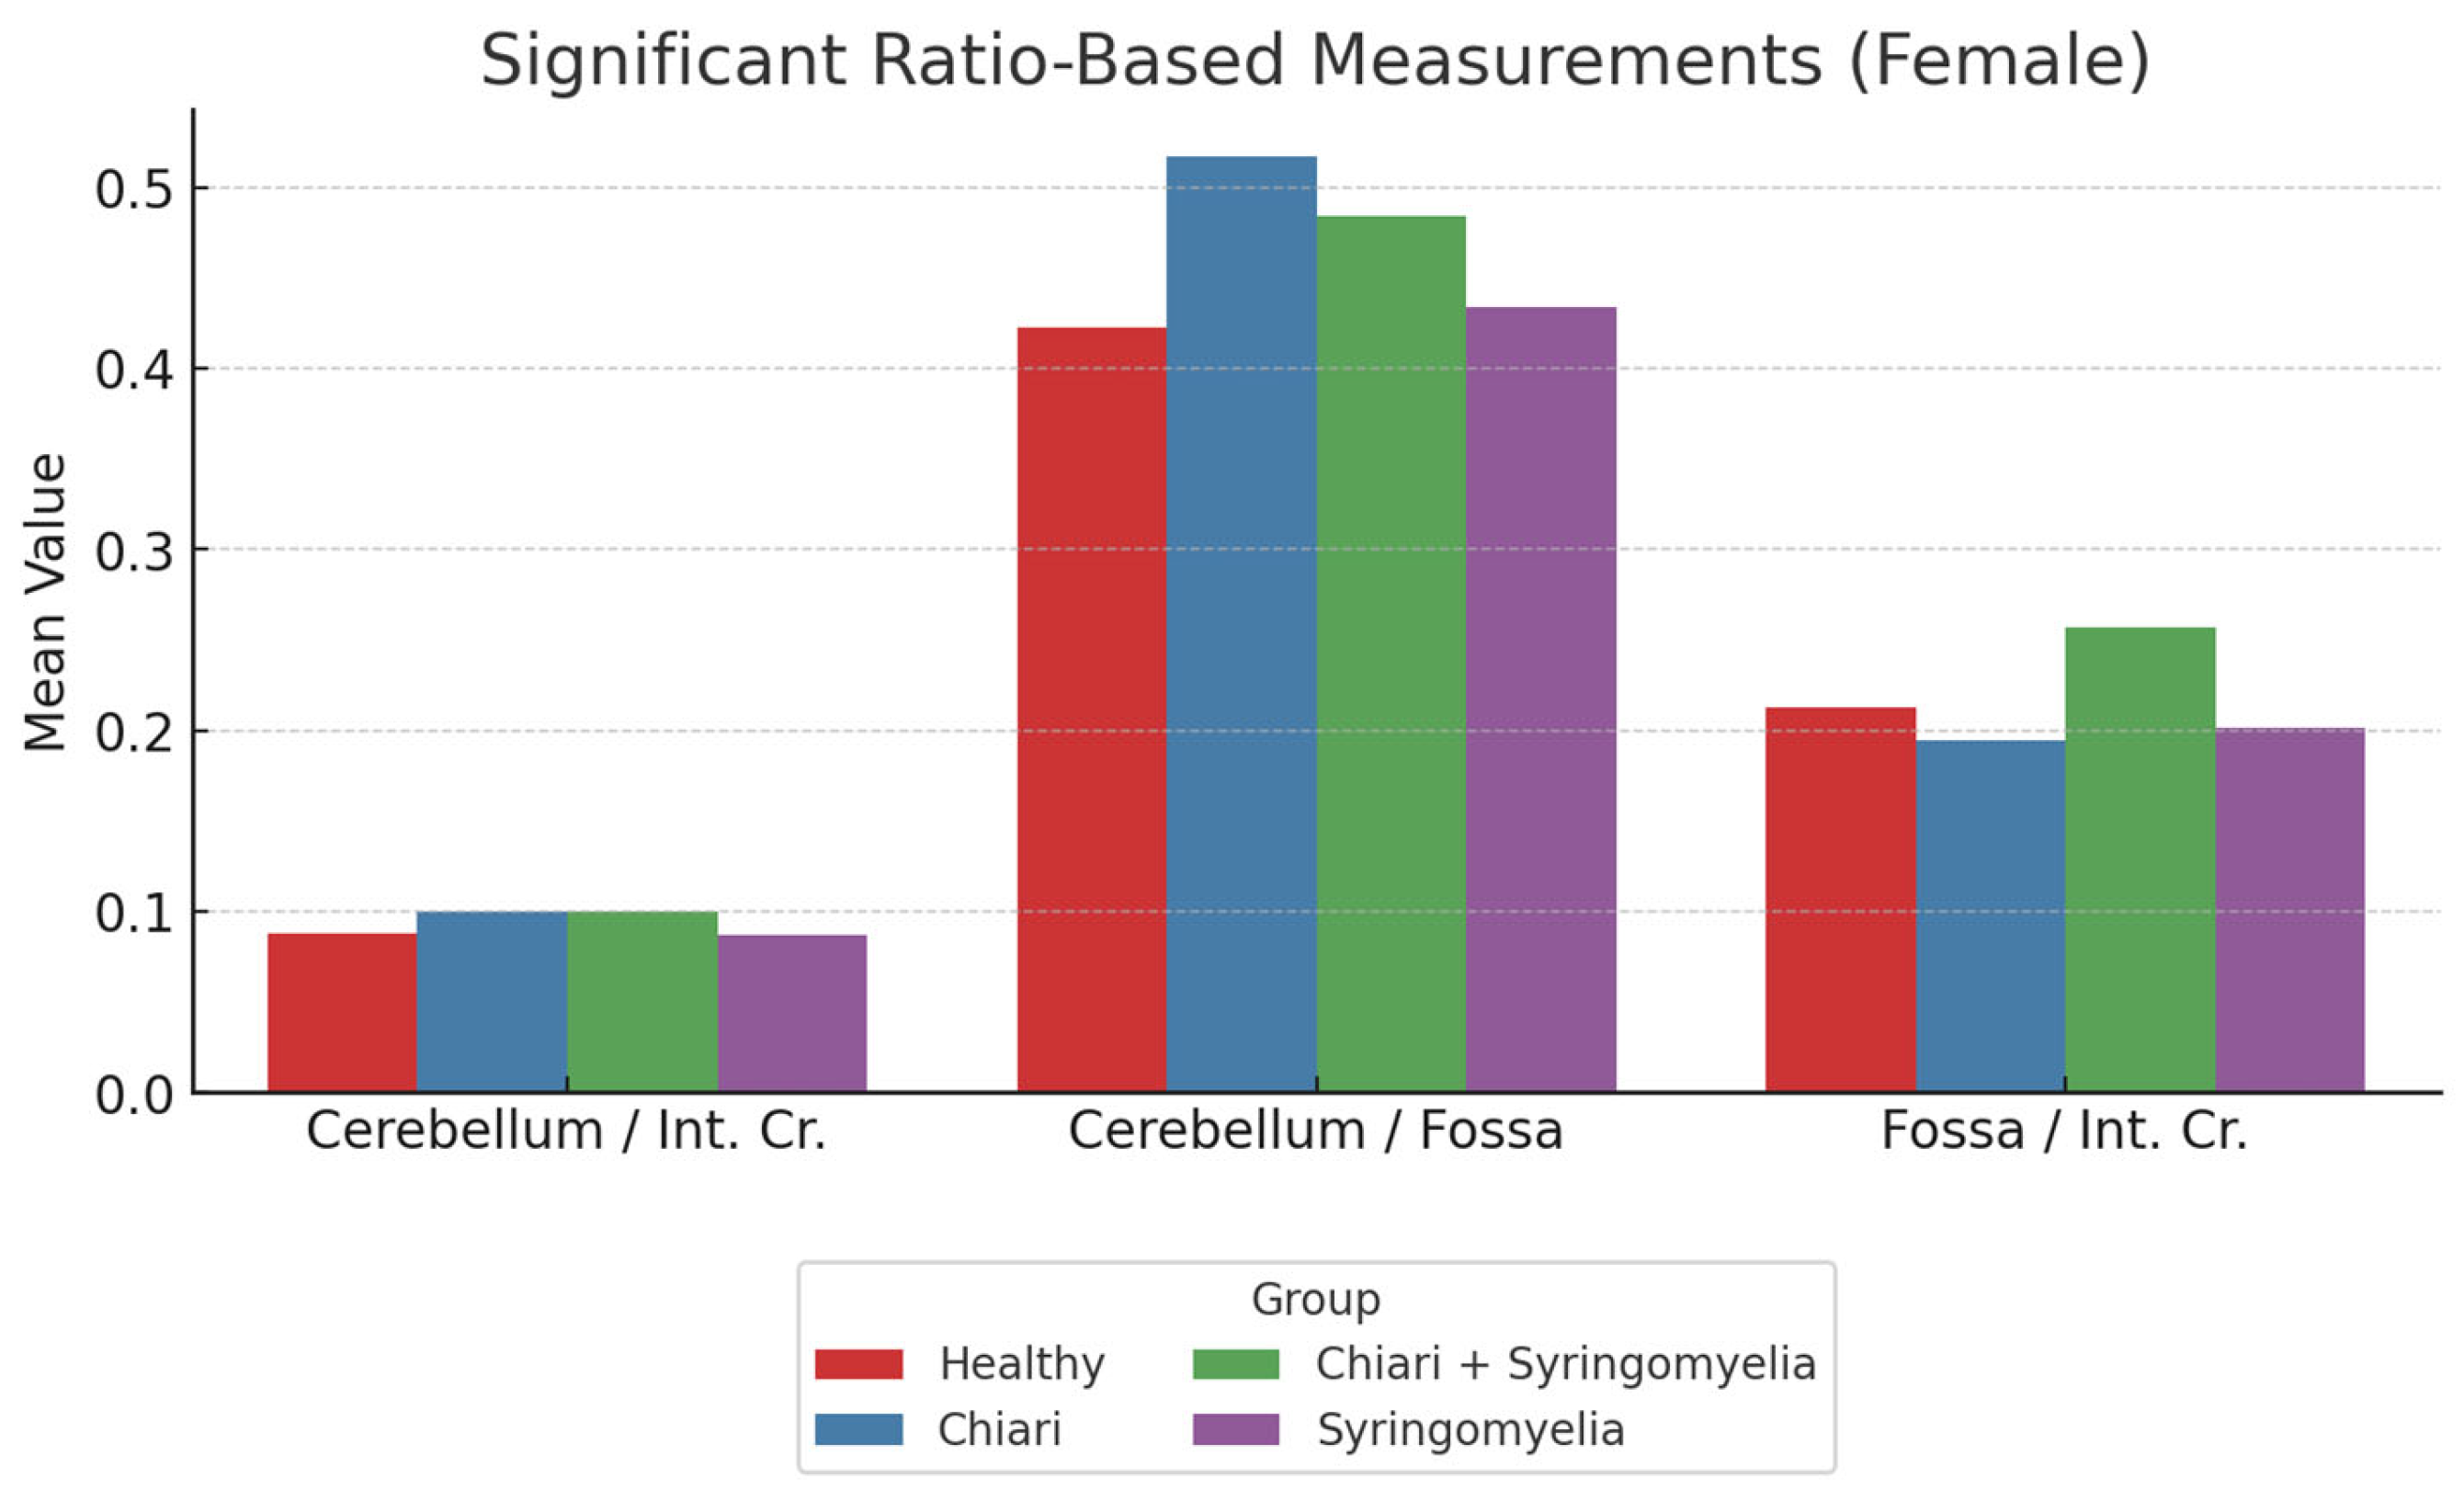
3.2. Morphometric Analysis in Female Participants
- The posterior fossa/intracranial area ratio was higher in Group 1 than in Groups 2 and 3; and higher in Group 3 than Group 2 (p < 0.05).
- The cerebellum/posterior fossa ratio was significantly higher in Groups 2 and 3 compared with Group 1 (p < 0.05).
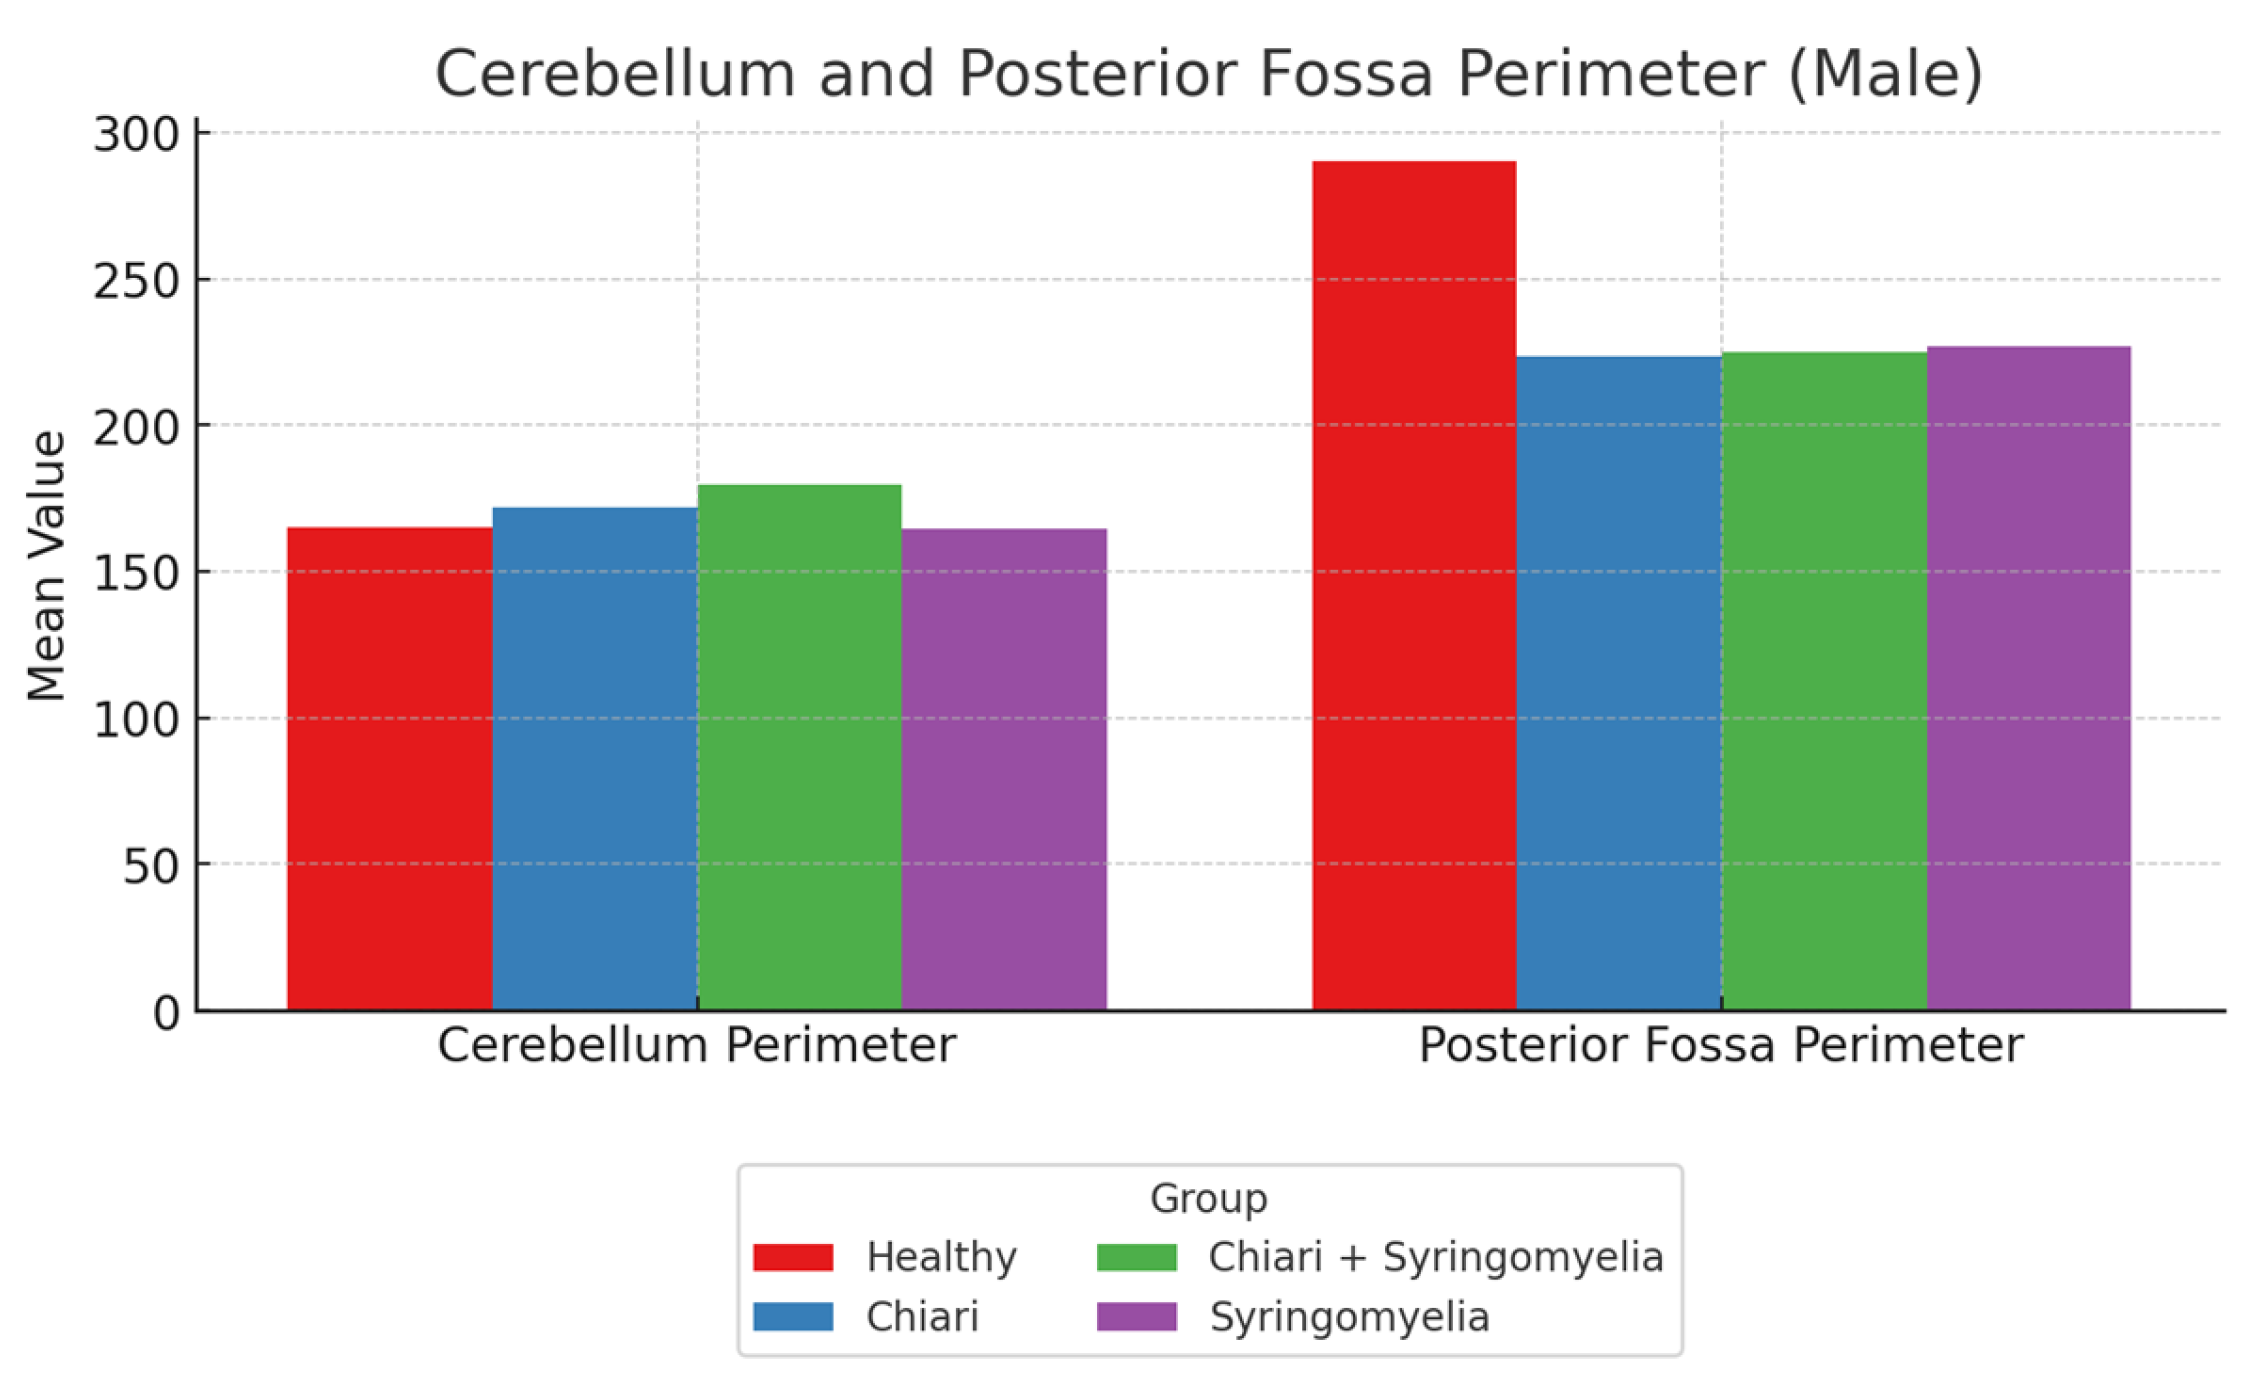
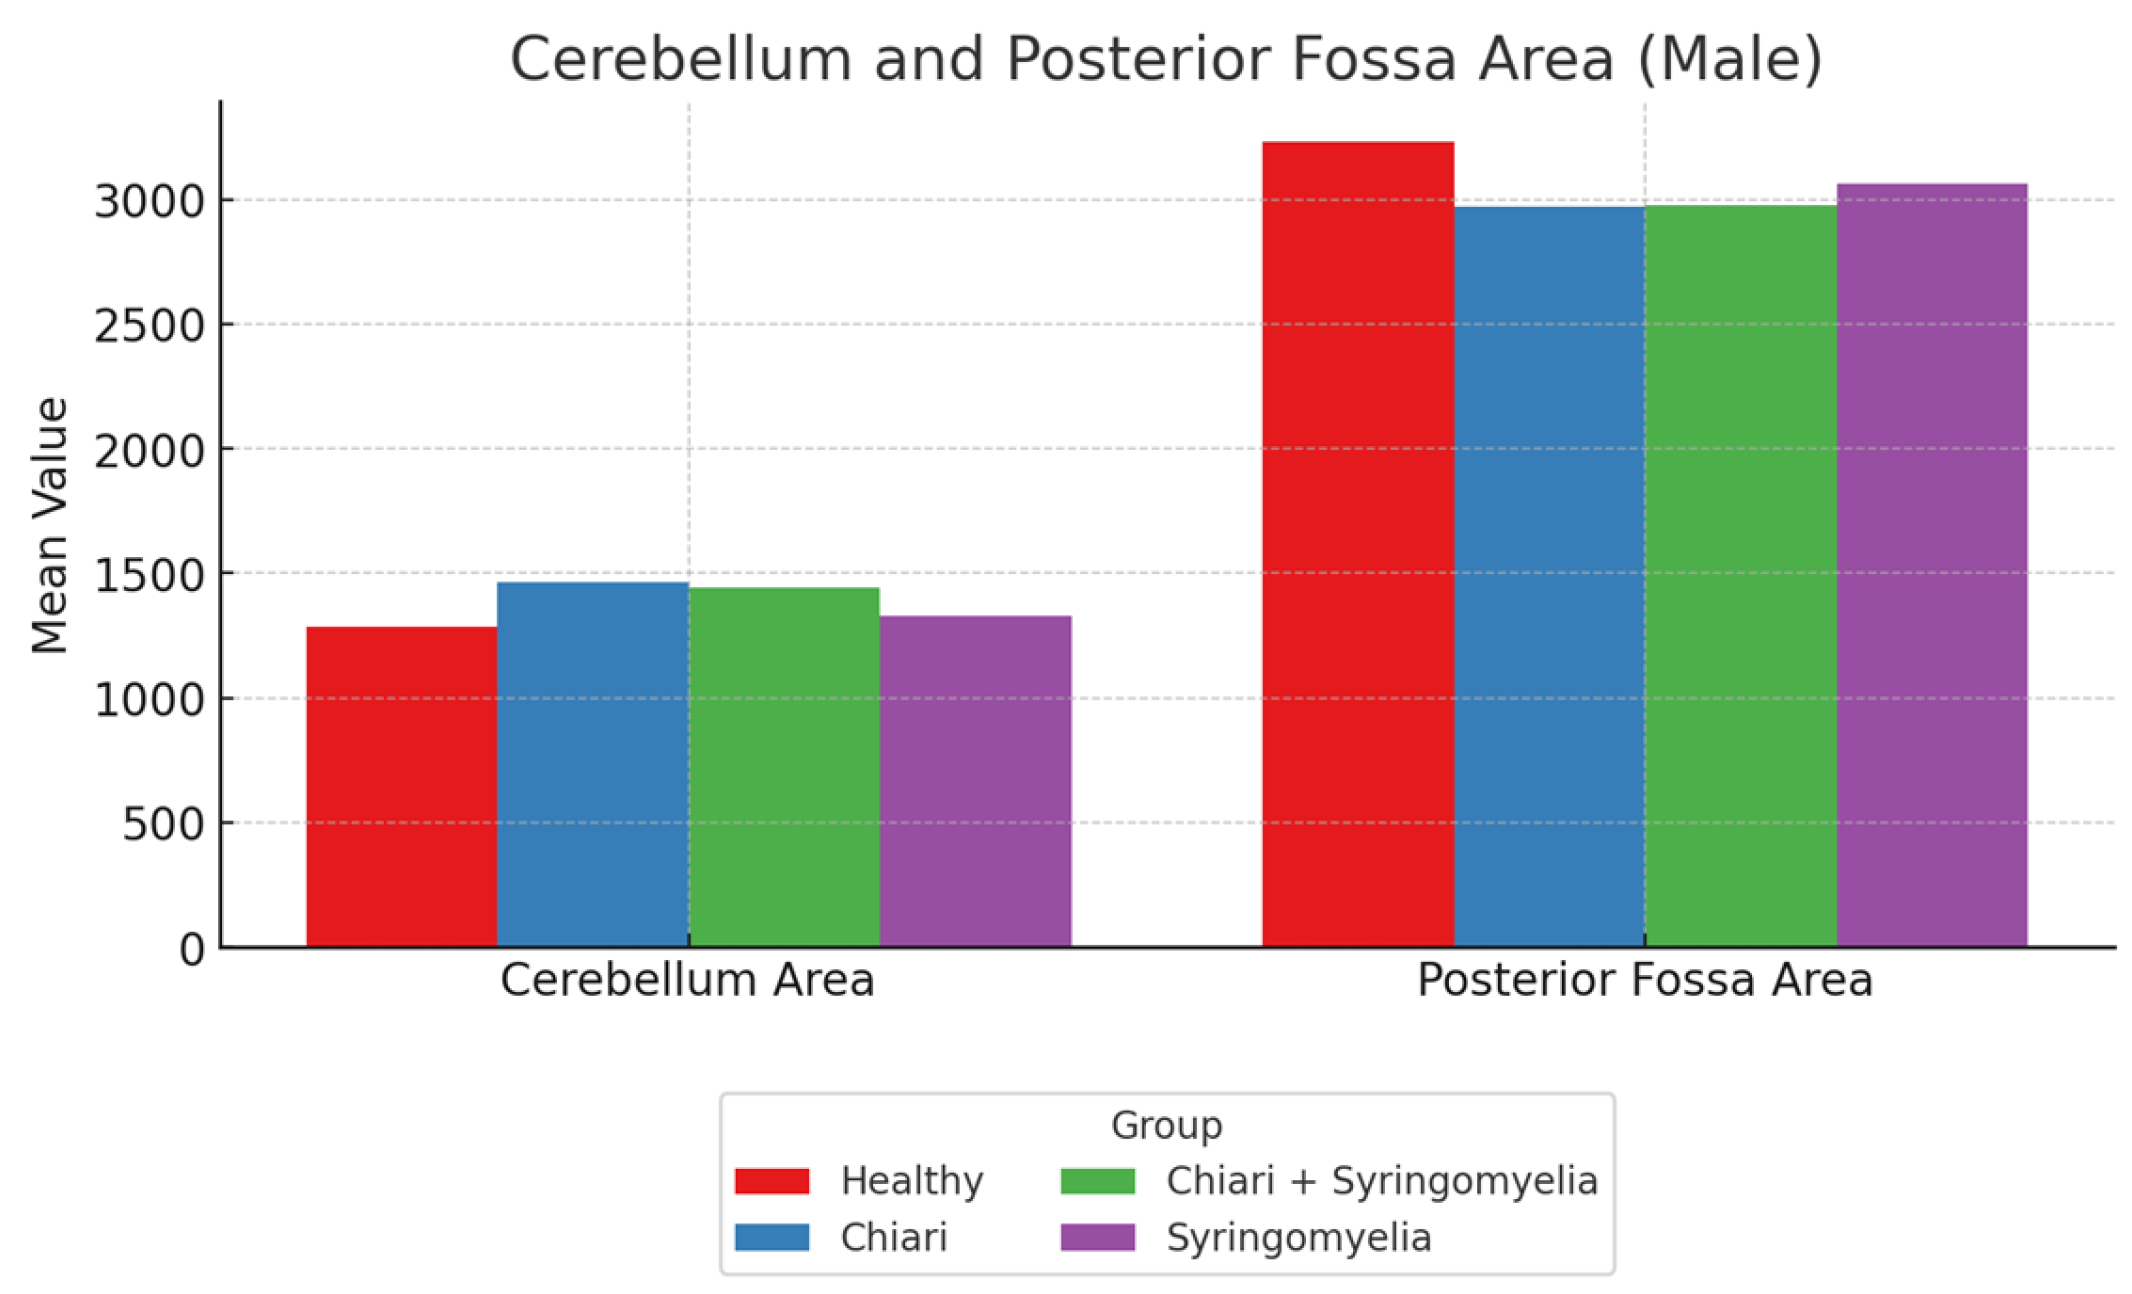
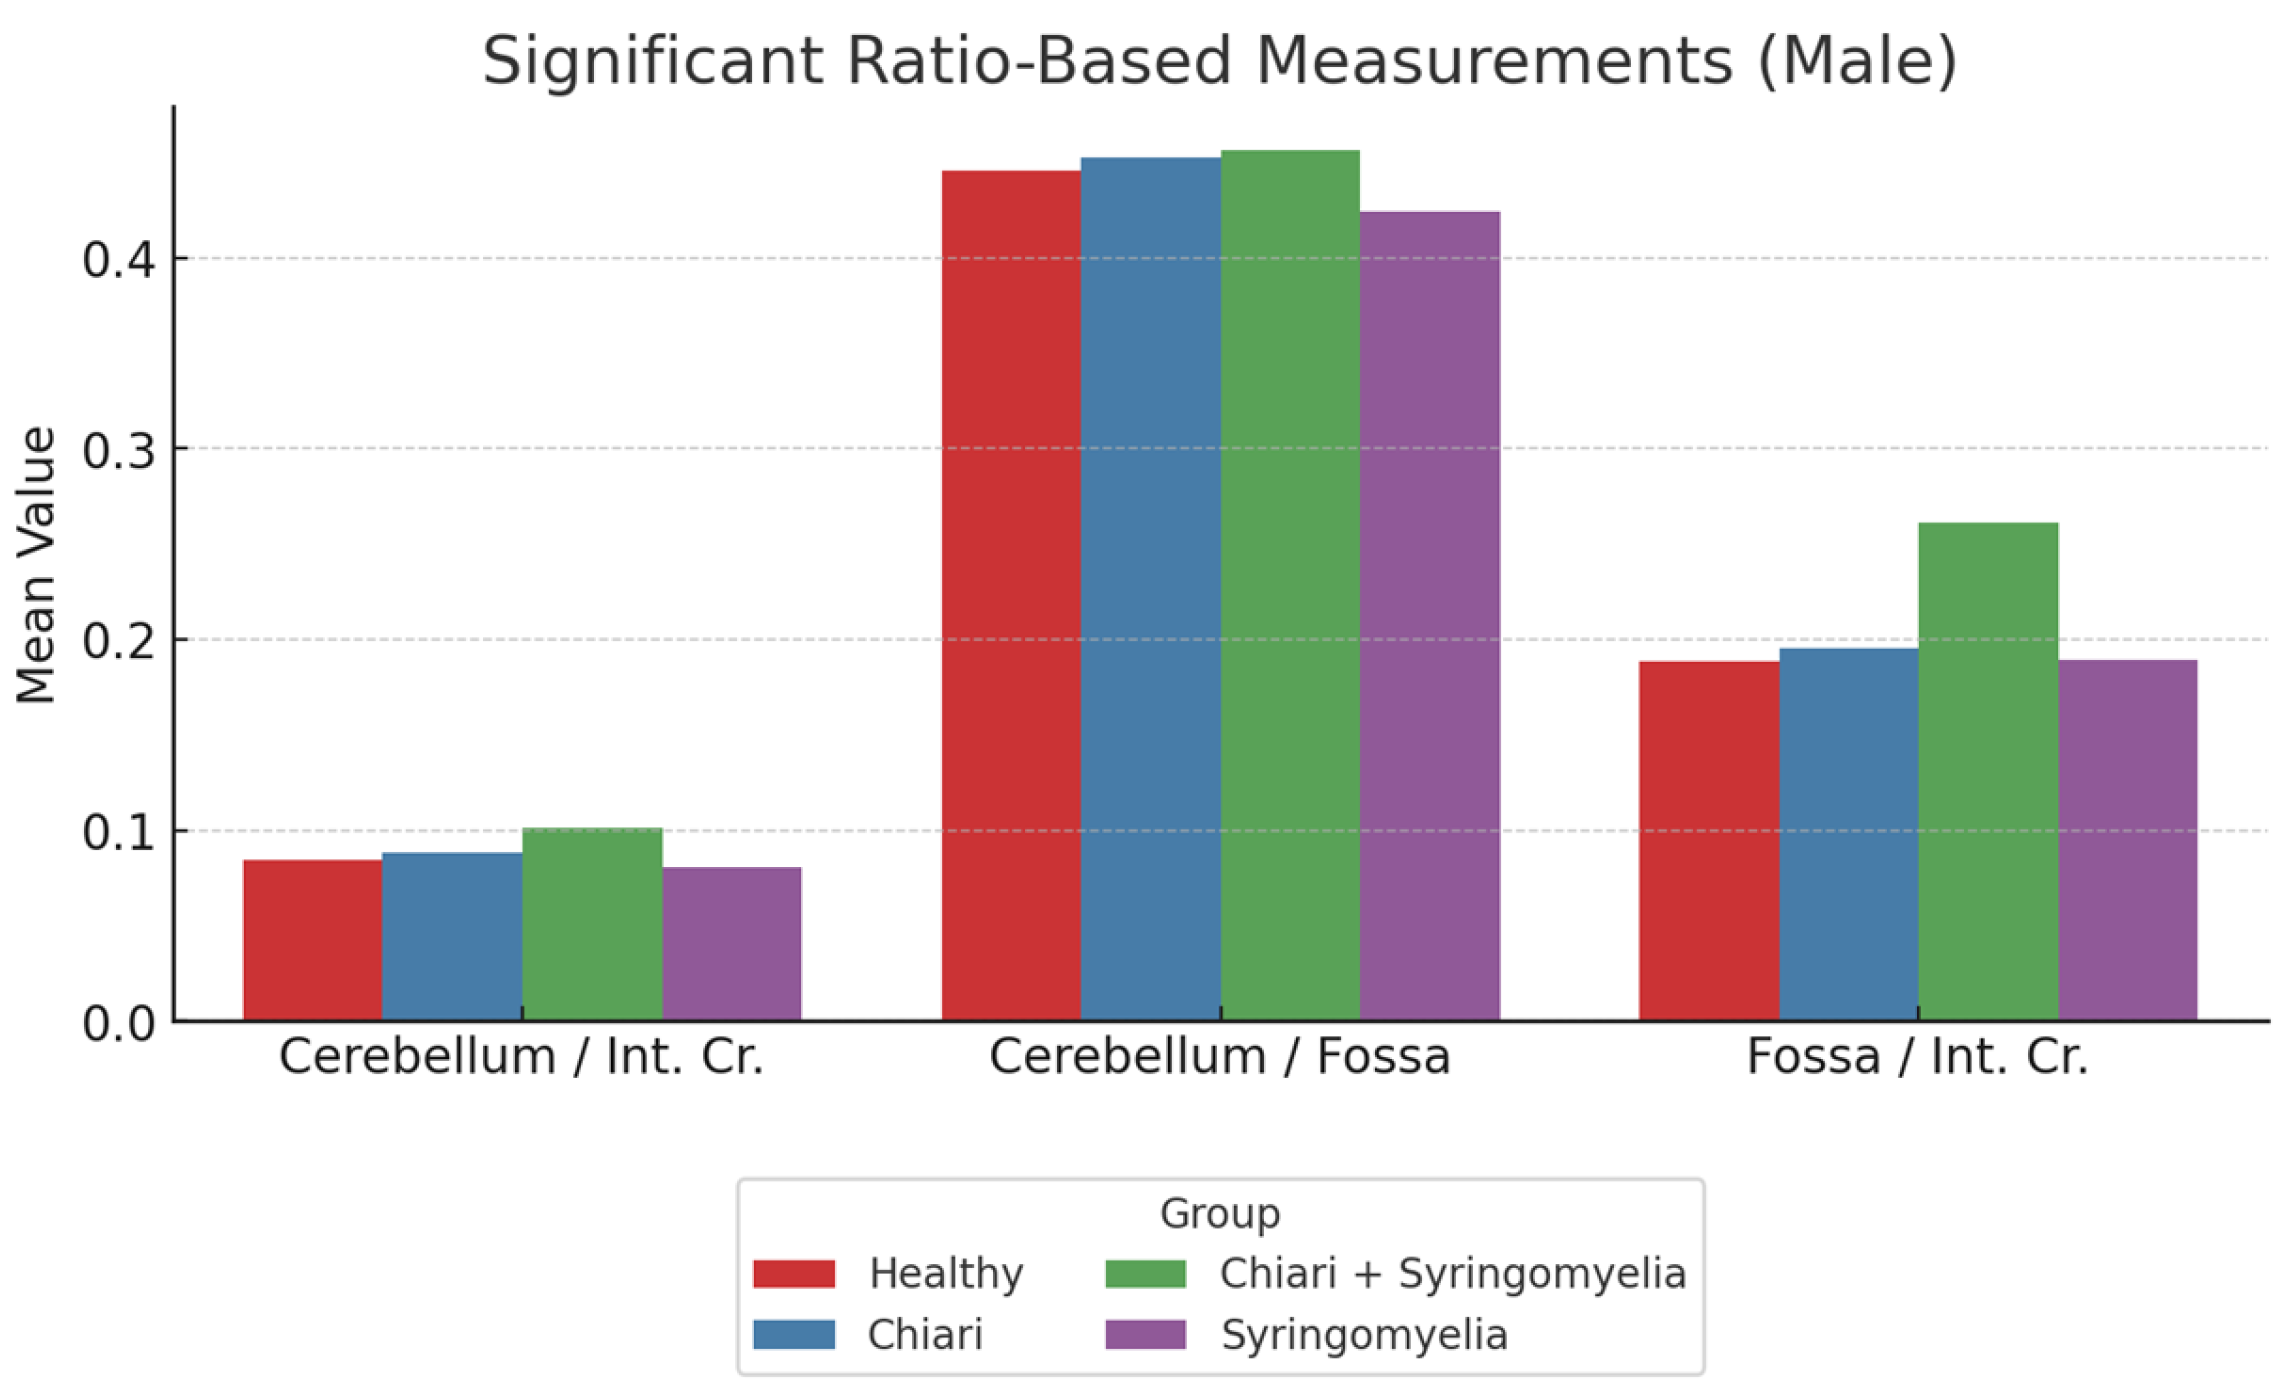
3.3. Morphometric Analysis in Male Participants
- The cerebellum/posterior fossa ratio was lowest in Group 1 and significantly higher in Groups 2 and 3 (p < 0.05).
- The posterior fossa/intracranial area ratio was significantly higher in Group 1 than all other groups; and in Group 4 compared with Group 2 (p < 0.05).
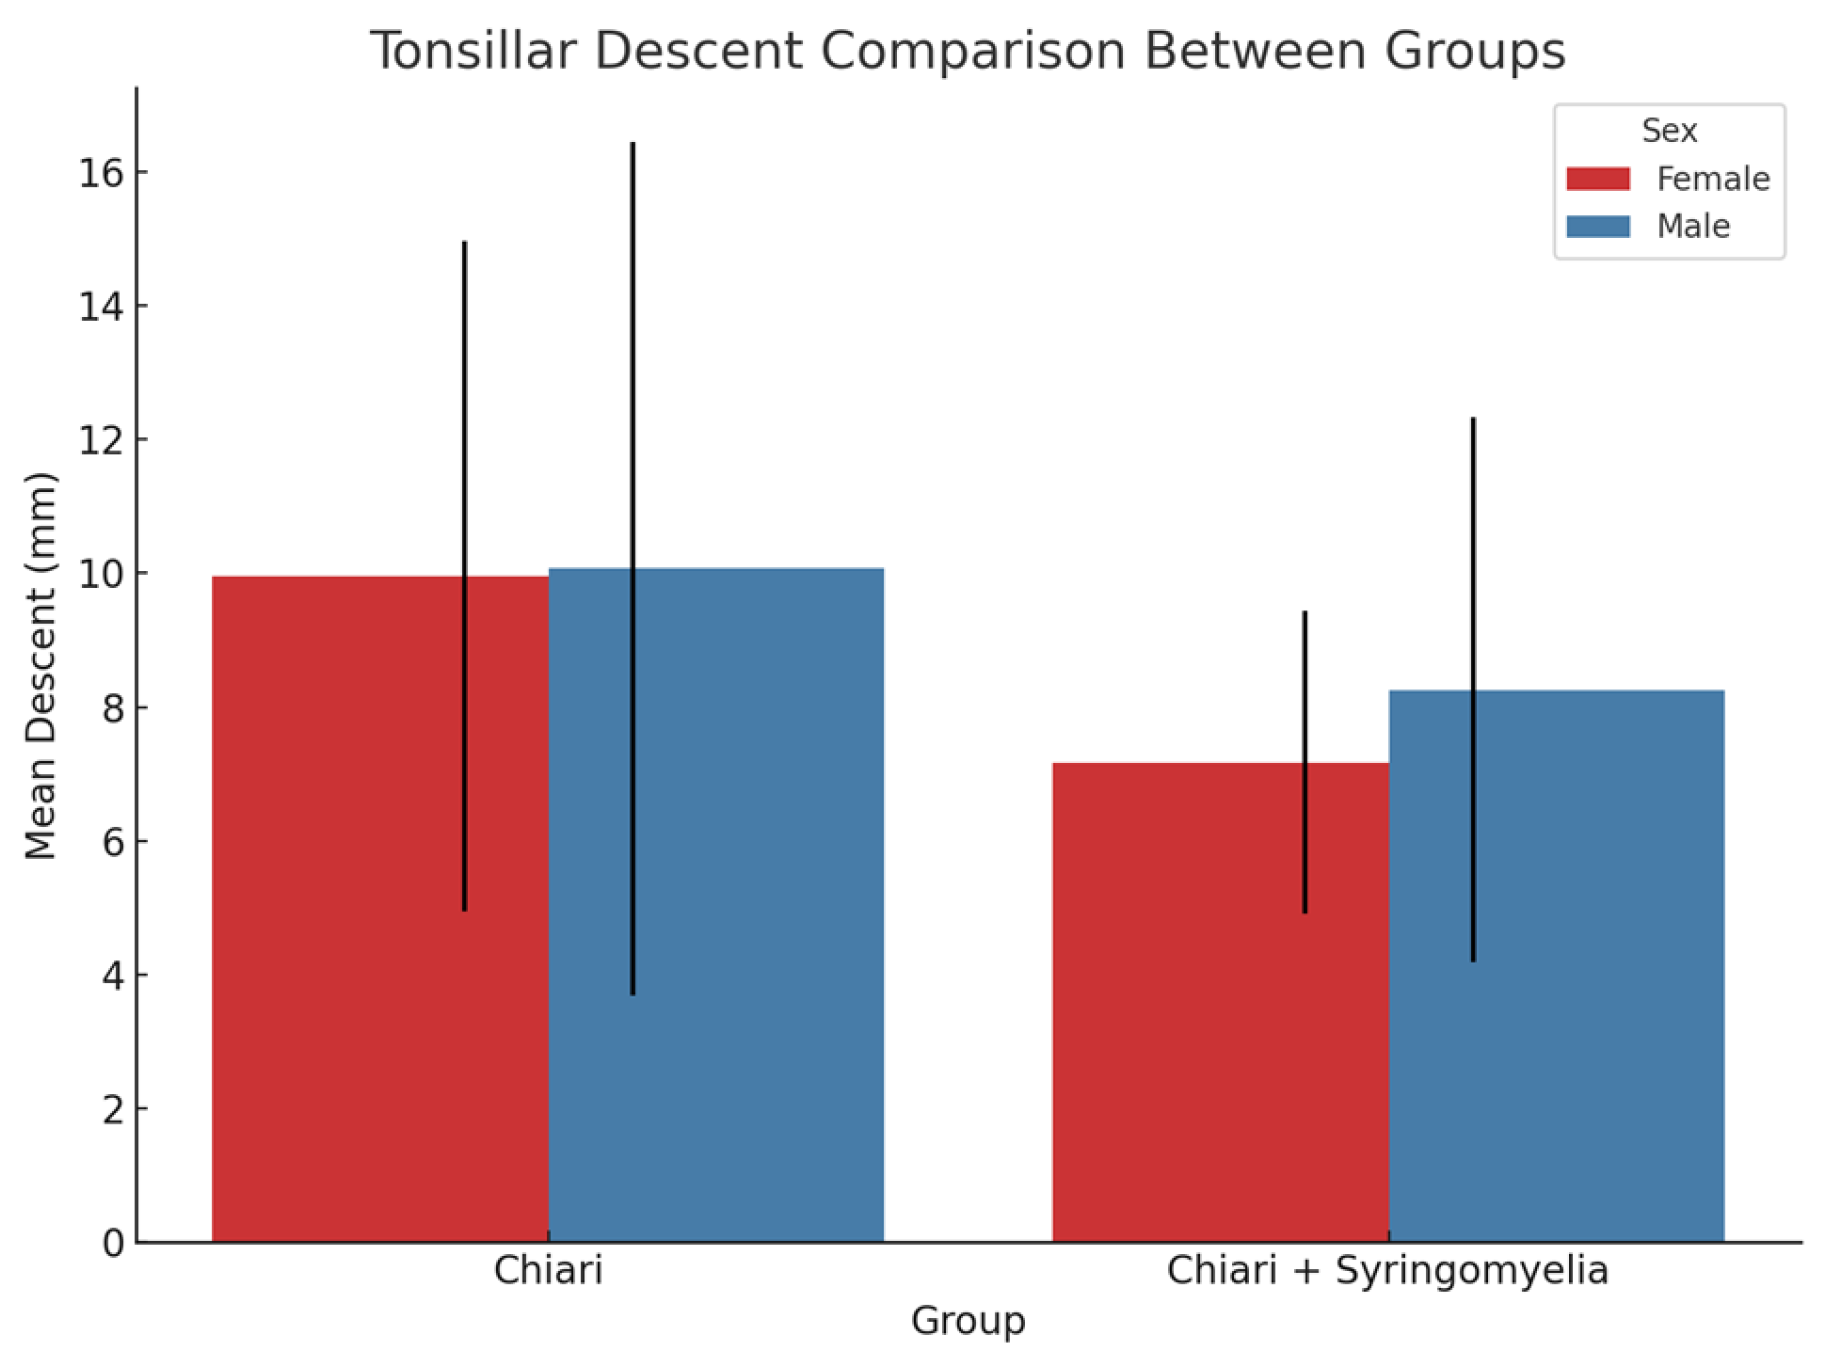
3.4. Tonsillar Herniation and Correlation Analysis
3.5. Syrinx Location and Distribution
4. Discussion
5. Conclusions
Author Contributions
Funding
Institutional Review Board Statement
Informed Consent Statement
Data Availability Statement
Acknowledgments
Conflicts of Interest
Abbreviations
| Fossa | Posterior Fossa Area |
| Int. Cr. | Intracranial area |
| SM | Syringomyelia |
| CM-1 | Chiari Type 1 |
| CM-0 | Chiari Type 0 |
| CSF | Cerebrospinal fluid |
References
- Fadila, M.; Sarrabia, G.; Shapira, S.; Yaacobi, E.; Baruch, Y.; Engel, I.; Ohana, N. Orthopedic Manifestations of Syringomyelia: A Comprehensive Review. J. Clin. Med. 2025, 14, 3145. [Google Scholar] [CrossRef] [PubMed]
- Roy, A.K.; Slimack, N.P.; Ganju, A. Idiopathic syringomyelia: Retrospective case series, comprehensive review, and update on management. Neurosurg. Focus 2011, 31, E15. [Google Scholar] [CrossRef]
- Flint, G. Syringomyelia: Diagnosis and management. Pract. Neurol. 2021, 21, 403–411. [Google Scholar] [CrossRef] [PubMed]
- Costa, F.; Ait Benali, S.; Dantas, F.; Restelli, F.; Mazzapicchi, E.; Baeesa, S.; Yaman, O.; Sharif, S.; Alves, O.L.; Zileli, M.; et al. Chiari Malformation: Diagnosis, Classifications, Natural History, and Conservative Management. World Federation of Neurosurgical Societies Spine Committee Recommendations. Spine 2025, 50, 767–778. [Google Scholar] [CrossRef] [PubMed]
- Arnautovic, A.; Splavski, B.; Boop, F.A.; Arnautovic, K.I. Pediatric and adult Chiari malformation Type I surgical series 1965–2013: A review of demographics, operative treatment, and outcomes. J. Neurosurg. Pediatr. 2015, 15, 161–177. [Google Scholar] [CrossRef]
- Nishikawa, M.; Sakamoto, H.; Hakuba, A.; Nakanishi, N.; Inoue, Y. Pathogenesis of Chiari malformation: A morphometric study of the posterior cranial fossa. Neurosurgery 1997, 86, 40–47. [Google Scholar] [CrossRef]
- Milhorat, T.H.; Bolognese, P.A.; Nishikawa, M.; McDonnell, N.B.; Francomano, C.A. Syndrome of occipitoatlantoaxial hypermobility, cranial settling, and chiari malformation type I in patients with hereditary disorders of connective tissue. J. Neurosurg. Spine 2007, 7, 601–609. [Google Scholar] [CrossRef]
- Oldfield, E.H.; Muraszko, K.; Shawker, T.H.; Patronas, N.J. Pathophysiology of syringomyelia associated with Chiari I malformation of the cerebellar tonsils. Implications for diagnosis and treatment. J. Neurosurg. 1994, 80, 3–15. [Google Scholar] [CrossRef]
- Heiss, J.D. Cerebrospinal Fluid Hydrodynamics in Chiari I Malformation and Syringomyelia: Modeling Pathophysiology. Neurosurg. Clin. N. Am. 2023, 34, 81–90. [Google Scholar] [CrossRef]
- Tubbs, R.S.; Elton, S.; Grabb, P.; Dockery, S.E.; Bartolucci, A.A.; Oakes, W.J. Analysis of the Posterior Fossa in Children with the Chiari 0 Malformation. Neurosurgery 2001, 48, 1050–1054. [Google Scholar] [CrossRef]
- Kular, S.; Cascella, M. Chiari Malformation Type 1. In StatPearls; StatPearls Publishing: Treasure Island, FL, USA, 2025. Available online: https://www.ncbi.nlm.nih.gov/books/NBK554609/ (accessed on 1 April 2025).
- Munakomi, S.; Sampath, R.; Shenoy, V.S. Syringomyelia. In StatPearls; StatPearls Publishing: Treasure Island, FL, USA, 2024. Available online: https://www.ncbi.nlm.nih.gov/books/NBK537110/ (accessed on 1 April 2025).
- Cleveland Clinic. Syringomyelia: What It Is, Symptoms, Causes & Treatment; Cleveland Clinic: Cleveland, OH, USA, 2024; Available online: https://my.clevelandclinic.org/health/diseases/6126-syringomyelia (accessed on 1 April 2025).
- Hatgaonkar, A.M.; Mahajan, S.M.; Hatgoankar, K.A.; Bandre, G.R. MRI Insights in Chiari Malformation Type 1 and Variations with Hydrosyringomyelia. Cureus 2024, 16, e55676. [Google Scholar] [CrossRef] [PubMed]
- Meziani, S.; Handis, C.; Felissi, Y.; Bouchekoura, H.; Morsli, A. Diagnosis and surgical management of Chiari malformation type I. SVOA Neurol. 2023, 4, 134–142. [Google Scholar] [CrossRef]
- Heiss, J.D.; Patronas, N.; DeVroom, H.L.; Shawker, T.; Ennis, R.; Kammerer, W.; Eidsath, A.; Talbot, T.; Morris, J.; Eskioglu, E.; et al. Elucidating the pathophysiology of syringomyelia. J. Neurosurg. 1999, 91, 553–562. [Google Scholar] [CrossRef] [PubMed]
- Koo, T.K.; Li, M.Y. A guideline of selecting and reporting intraclass correlation coefficients for reliability research. J. Chiropr. Med. 2016, 15, 155–163. [Google Scholar] [CrossRef]
- Faul, F.; Erdfelder, E.; Buchner, A.; Lang, A.G. Statistical Power Analyses Using G*Power 3.1: Tests for Correlation and Regression Analyses. Behav. Res. Methods 2009, 41, 1149–1160. [Google Scholar] [CrossRef]
- Milhorat, T.H.; Chou, M.W.; Trinidad, E.M.; Kula, R.W.; Mandell, M.; Wolpert, C.; Speer, M.C. Chiari I Malformation Redefined: Clinical and Radiographic Findings for 364 Symptomatic Patients. Neurosurgery 1999, 44, 1005–1017. [Google Scholar] [CrossRef]
- Bogdanov, E.I.; Faizutdinova, A.T.; Heiss, J.D. Posterior Cranial Fossa and Cervical Spine Morphometric Abnormalities in Symptomatic Chiari Type 0 and Chiari Type 1 Malformation Patients with and without Syringomyelia. Acta Neurochir. 2021, 163, 3051–3064. [Google Scholar] [CrossRef]
- Giedd, J.N.; Blumenthal, J.; Jeffries, N.O.; Castellanos, F.X.; Liu, H.; Zijdenbos, A.; Paus, T.; Evans, A.C.; Rapoport, J.L. Brain Development During Childhood and Adolescence: A Longitudinal MRI Study. Nat. Neurosci. 1999, 2, 861–863. [Google Scholar] [CrossRef]
- Sowell, E.R.; Thompson, P.M.; Peterson, B.S.; Thompson, P.M.; Welcome, S.E.; Henkenius, A.L.; Toga, A.W. Mapping Cortical Change Across the Human Life Span. Nat. Neurosci. 2003, 6, 309–315. [Google Scholar] [CrossRef]
- Uysal, S.; Dursun, N.; Aydin, O. A Rare Cause of Sudden Death: Chiari Malformation Type 1 Associated with Syringomyelia. J. Forensic Sci. Med. 2016, 2, 126–129. [Google Scholar]
- Öktem, H.; Dilli, A.; Kürkçüoğlu, A.; Soysal, H.; Yazıcı, C.; Pelin, C. Prevalence of Chiari Type I Malformation on Cervical Magnetic Resonance Imaging: A Retrospective Study. Anatomy 2016, 10, 40–45. [Google Scholar] [CrossRef]
- Marty, P.; Urbizu, A.; Macaya, A.; Sahuquillo, J.; Poca, M.A.; Martin, B. Gender-Specific Differences in Adult Type I Chiari Malformation Morphometrics (P4.174). Neurology 2015, 84 (Suppl. S14), P4.174. Available online: https://www.researchgate.net/publication/313043183 (accessed on 1 April 2025).
- Bogdanov, E.I.; Faizutdinova, A.T.; Heiss, J.D. The Small Posterior Cranial Fossa Syndrome and Chiari Malformation Type 0. J. Clin. Med. 2022, 11, 5472. [Google Scholar] [CrossRef] [PubMed]
- Allen, P.A.; O’Connell, M.A.; Kiernan, C.; McGinnity, T.M.; O’Keeffe, F. Intracranial Morphology in Chiari I Malformation: A Volumetric MRI Study. Neurosurg. Rev. 2012, 35, 235–242. [Google Scholar]
- Rindler, R.S.; Chern, J.J. Newer Subsets: Chiari 1.5 and Chiari 0 Malformations. In The Chiari Malformations; Tubbs, R., Turgut, M., Oakes, W., Eds.; Springer: Cham, Switzerland, 2020. [Google Scholar] [CrossRef]
- Ross, P.C.; Simon, V.; Lucas, L.; Mark, J.C. Cerebral cortex: An MRI-based study of volume and variance with age and sex. J. Clin. Neurosci. 2006, 13, 60–72. [Google Scholar] [CrossRef] [PubMed]
- Heiss, J.D.; Suffredini, G.; Smith, R.; DeVroom, H.L.; Patronas, N.J.; Butman, J.A.; Thomas, F.; Oldfield, E.H. Pathophysiology of persistent syringomyelia after decompressive craniocervical surgery. J. Neurosurg. Spine 2010, 13, 729–742. [Google Scholar] [CrossRef]
- Oh, C.H.; Lee, M.S.; Kim, Y.J.; Yoon, S.H.; Park, H.C.; Park, C.O. Increased Detection Rate of Syringomyelia by Whole Spine Sagittal Magnetic Resonance Images: Based on the Data from Military Conscription of Korean Young Males. J. Korean Soc. Radiol. 2012, 67, 149–156. [Google Scholar] [CrossRef]
- Saygı, T.; Kayhan, A.; Demirel, N. Morphometric Analysis of the Posterior Fossa and Cervical Spinal Canal in Type 1 Chiari Malformation and Its Effects on Syringomyelia Development. Istanb. Med. J. 2024, 25, 207–213. [Google Scholar] [CrossRef]
- Bogdanov, E.I.; Heiss, J.D.; Mendelevich, E.G.; Mikhaylov, I.M.; Haass, A. Clinical and neuroimaging features of “idiopathic” syringomyelia. Neurology 2004, 62, 791–794. [Google Scholar] [CrossRef]
- Tubbs, R.S.; McGirt, M.J.; Oakes, W.J. Surgical experience in 130 pediatric patients with Chiari I malformations. J. Neurosurg. 2003, 99, 291–296. [Google Scholar] [CrossRef]
- Kleesiek, J.; Urban, G.; Hubert, A.; Schwarz, D.; Maier-Hein, K.; Bendszus, M.; Biller, A. Deep MRI brain extraction: A 3D convolutional neural network for skull stripping. Neuroimage 2016, 129, 460–469. [Google Scholar] [CrossRef] [PubMed]
- Chuang, Y.C.; Carrasquilla, A.; Bilgili, G.; Pionteck, A.; Liu, X.; Abderezaei, J.; Quinones, A.; Shuman, W.H.; Zhao, S.; Ellenbogen, R.; et al. Multi-dimensional morphometric and volumetric analysis of the posterior cranial fossa to study type I Chiari Malformation. World Neurosurg. 2024, 191, e279–e288. [Google Scholar] [CrossRef] [PubMed]

| Measurement | Healthy (Mean ± SD) | Chiari (Mean ± SD) | Chiari + SM (Mean ± SD) | Idiopathic SM (Mean ± SD) |
|---|---|---|---|---|
| Foramen Magnum Diameter | 34.19 ± 2.78 | 34.63 ± 4.77 | 35.29 ± 4.65 | 33.82 ± 3.02 |
| Intracranial Perimeter | 466.74 ± 15.19 | 465.59 ± 19.83 | 470.42 ± 17.34 | 462.73 ± 12.93 |
| Posterior Fossa Perimeter | 235.93 ± 13.70 | 215.68 ± 9.36 | 218.40 ± 10.76 | 217.82 ± 9.21 |
| Cerebellum Perimeter | 162.22 ± 14.91 | 170.69 ± 13.70 | 171.66 ± 13.93 | 159.49 ± 17.25 |
| Intracranial Area | 14,230.10 ± 874.84 | 14,207.31 ± 1133.66 | 14,480.87 ± 1124.79 | 14,042.73 ± 889.31 |
| Posterior Fossa Area | 3025.94 ± 287.07 | 2748.22 ± 235.44 | 2912.37 ± 254.14 | 2824.09 ± 185.54 |
| Cerebellum Area | 1242.60 ± 241.88 | 1421.41 ± 171.25 | 1450.79 ± 214.13 | 1223.66 ± 187.90 |
| Cerebellum/Fossa. Ratio | 0.423 ± 0.199 | 0.517 ± 0.042 | 0.484 ± 0.103 | 0.434 ± 0.064 |
| P.Fos/int. Cr. Ratio | 0.213 ± 0.018 | 0.194 ± 0.017 | 0.198 ± 0.016 | 0.202 ± 0.016 |
| Cerebellum/int. Cr. Ratio | 0.088 ± 0.017 | 0.100 ± 0.012 | 0.100 ± 0.013 | 0.087 ± 0.012 |
| Measurement | Healthy (Mean ± SD) | Chiari (Mean ± SD) | Chiari + SM (Mean ± SD) | Idiopathic SM (Mean ± SD) |
|---|---|---|---|---|
| Foramen Magnum Diameter | 36.02 ± 2.70 | 35.38 ± 3.76 | 37.61 ± 4.91 | 34.41 ± 4.06 |
| Intracranial Perimeter | 487.22 ± 16.20 | 487.45 ± 18.54 | 484.16 ± 25.01 | 479.25 ± 42.49 |
| Posterior Fossa Perimeter | 239.82 ± 13.83 | 223.51 ± 13.38 | 224.97 ± 10.26 | 226.88 ± 15.31 |
| Cerebellum Perimeter | 165.15 ± 12.66 | 172.02 ± 14.64 | 179.86 ± 16.50 | 164.48 ± 13.62 |
| Intracranial Area | 15,238.88 ± 1051.16 | 15,385.07 ± 1322.68 | 14,553.84 ± 4049.92 | 15,153.08 ± 1150.84 |
| Posterior Fossa Area | 3231.17 ± 465.48 | 2971.29 ± 300.12 | 2978.95 ± 251.44 | 3065.40 ± 217.21 |
| Cerebellum Area | 1286.03 ± 130.95 | 1463.55 ± 168.59 | 1441.55 ± 139.99 | 1328.27 ± 188.41 |
| Cerebellum/Fossa Ratio | 0.474 ± 0.645 | 0.494 ± 0.052 | 0.485 ± 0.041 | 0.434 ± 0.054 |
| Fossa/int. Cr. Ratio | 0.212 ± 0.030 | 0.193 ± 0.012 | 0.196 ± 0.018 | 0.203 ± 0.015 |
| Cerebellum/int. Cr Ratio | 0.085 ± 0.010 | 0.095 ± 0.008 | 0.094 ± 0.010 | 0.088 ± 0.012 |
Disclaimer/Publisher’s Note: The statements, opinions and data contained in all publications are solely those of the individual author(s) and contributor(s) and not of MDPI and/or the editor(s). MDPI and/or the editor(s) disclaim responsibility for any injury to people or property resulting from any ideas, methods, instructions or products referred to in the content. |
© 2025 by the authors. Licensee MDPI, Basel, Switzerland. This article is an open access article distributed under the terms and conditions of the Creative Commons Attribution (CC BY) license (https://creativecommons.org/licenses/by/4.0/).
Share and Cite
Özkal, B.; Özçelik, H. Idiopathic Syringomyelia: Diagnostic Value of Cranial Morphometric Parameters. Brain Sci. 2025, 15, 811. https://doi.org/10.3390/brainsci15080811
Özkal B, Özçelik H. Idiopathic Syringomyelia: Diagnostic Value of Cranial Morphometric Parameters. Brain Sciences. 2025; 15(8):811. https://doi.org/10.3390/brainsci15080811
Chicago/Turabian StyleÖzkal, Birol, and Hakan Özçelik. 2025. "Idiopathic Syringomyelia: Diagnostic Value of Cranial Morphometric Parameters" Brain Sciences 15, no. 8: 811. https://doi.org/10.3390/brainsci15080811
APA StyleÖzkal, B., & Özçelik, H. (2025). Idiopathic Syringomyelia: Diagnostic Value of Cranial Morphometric Parameters. Brain Sciences, 15(8), 811. https://doi.org/10.3390/brainsci15080811