
Comparative Analysis of the ABC/2 Score and e-ASPECTS Software in the Determination of Acute Ischaemic Stroke Volume from Non-Contrast CT

 , , ,
, , ,
Abstract
1. Introduction
2. Subjects and Methods
2.1. Patients
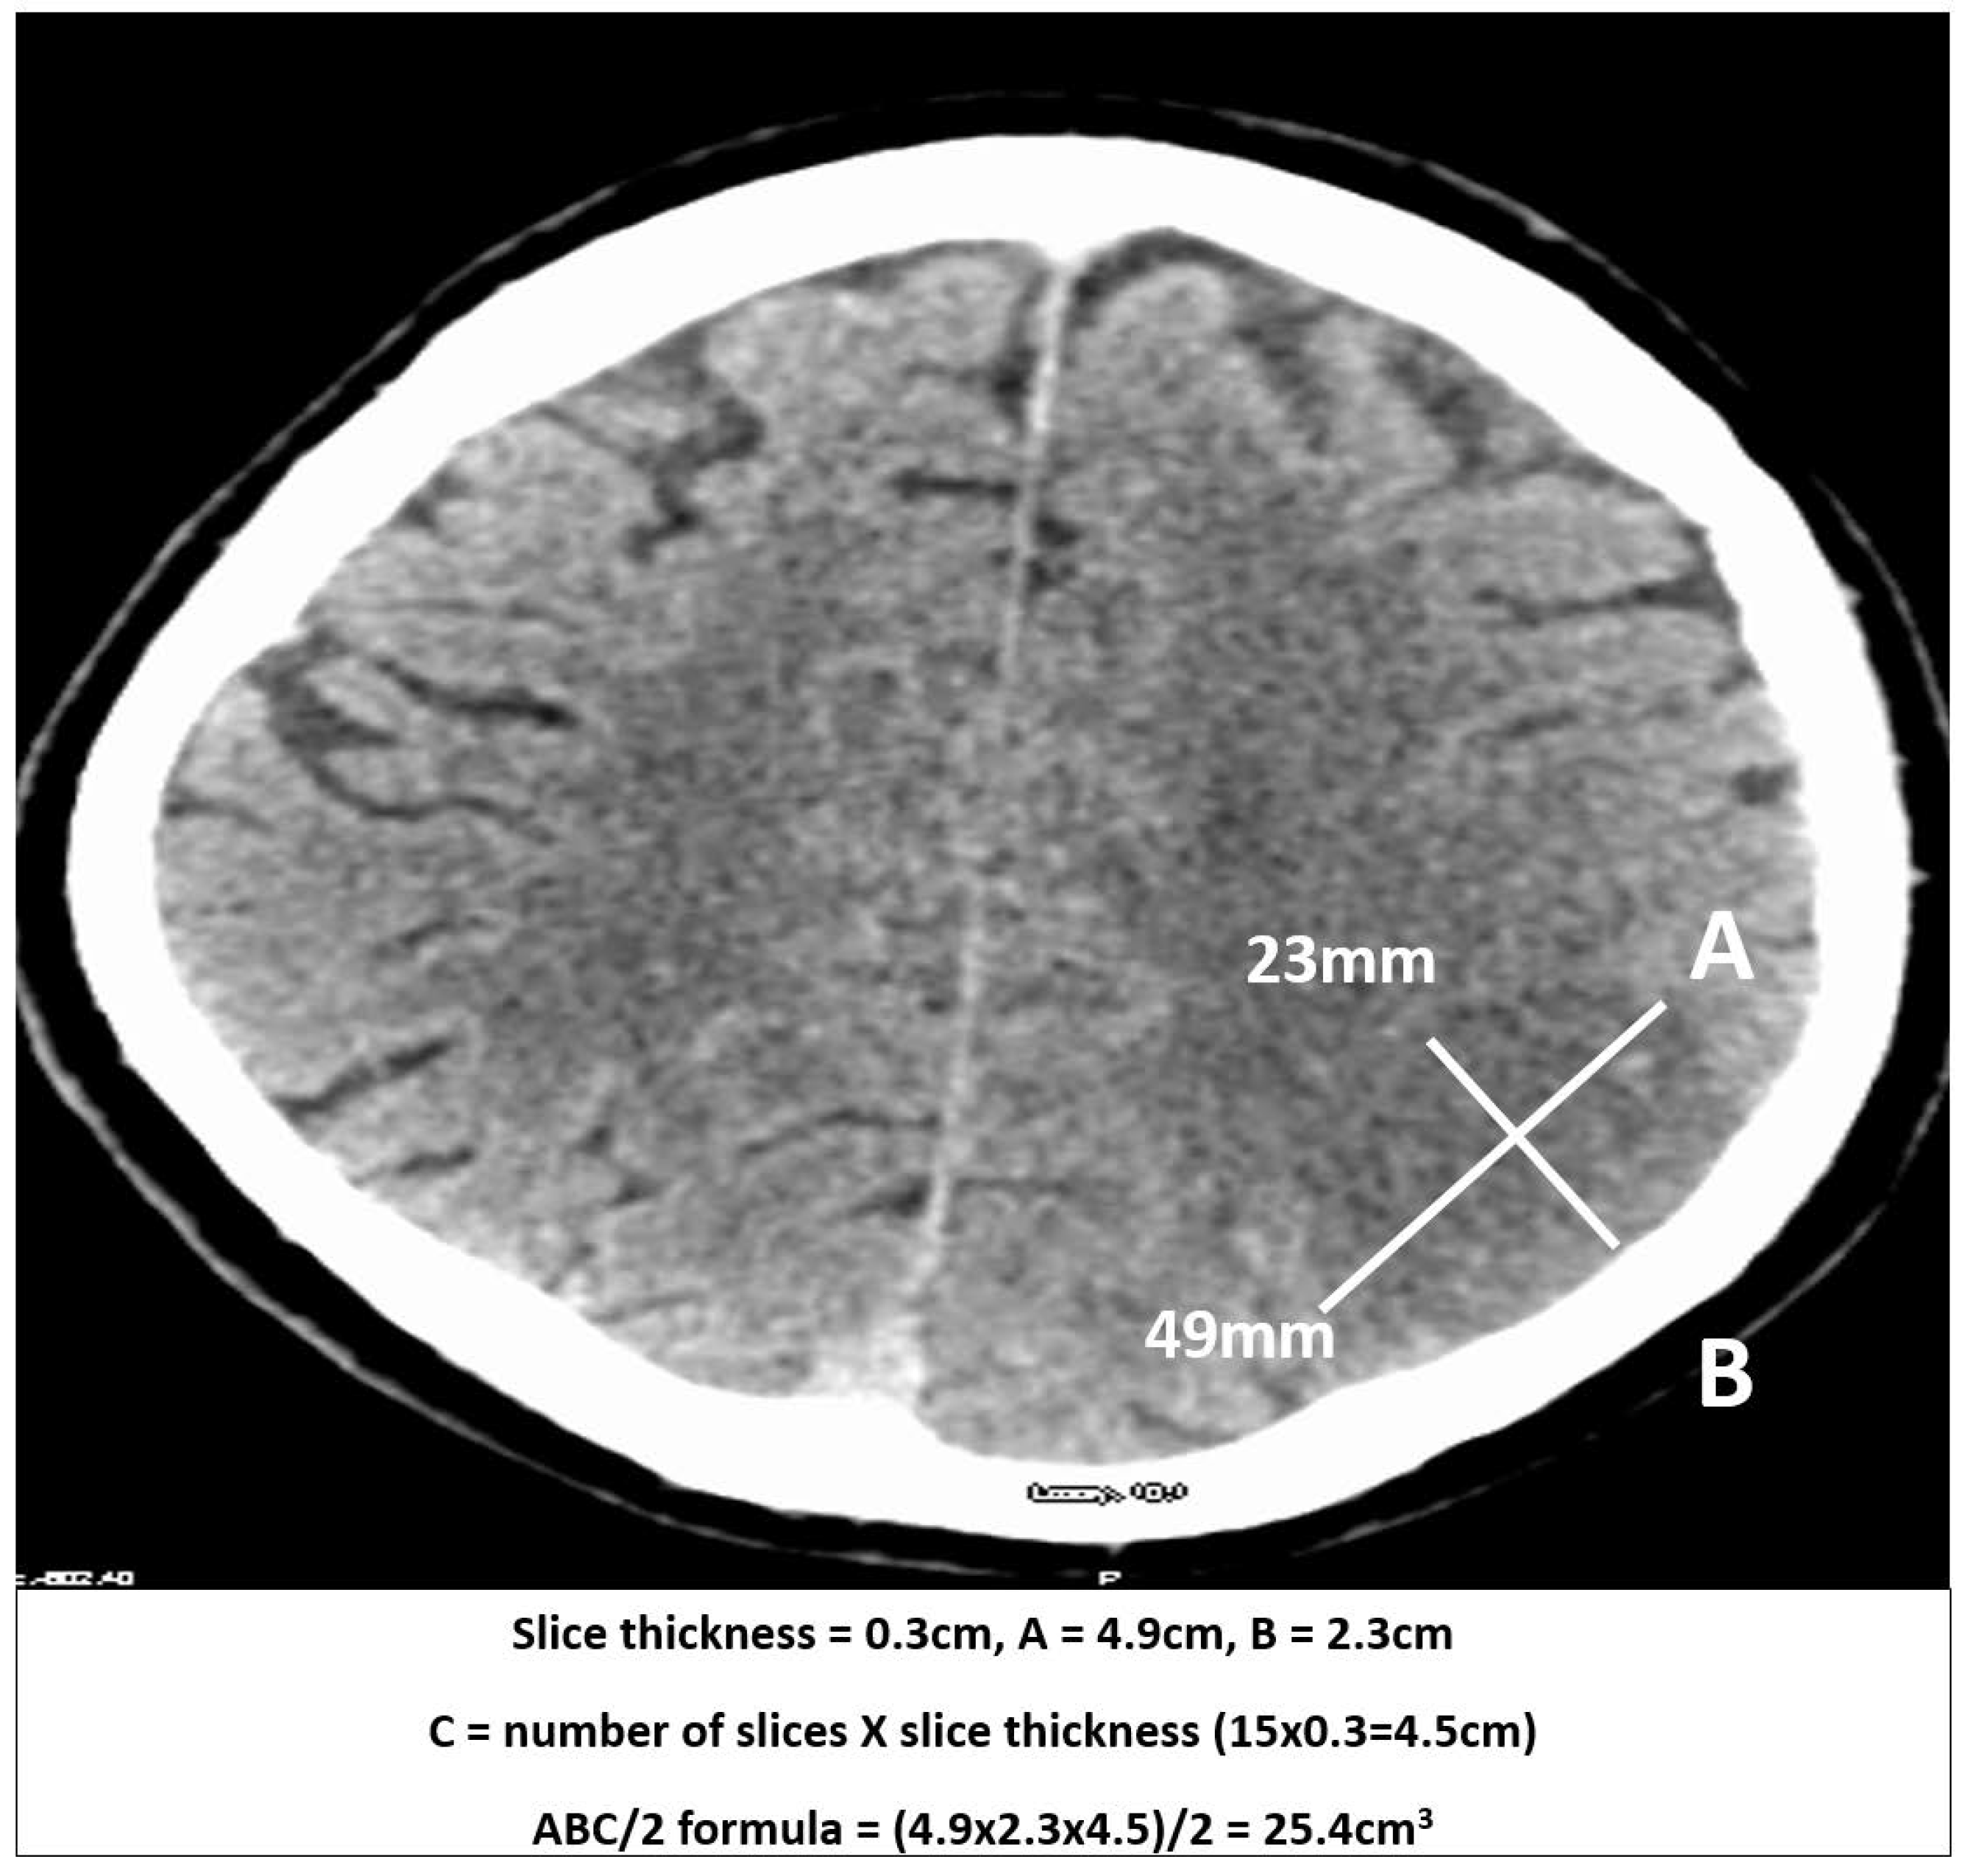
2.2. Measurements
2.3. Automated Ischaemic Volume by e-ASPECTS
2.4. Statistical Analysis
3. Results
3.1. Clinical Characteristics
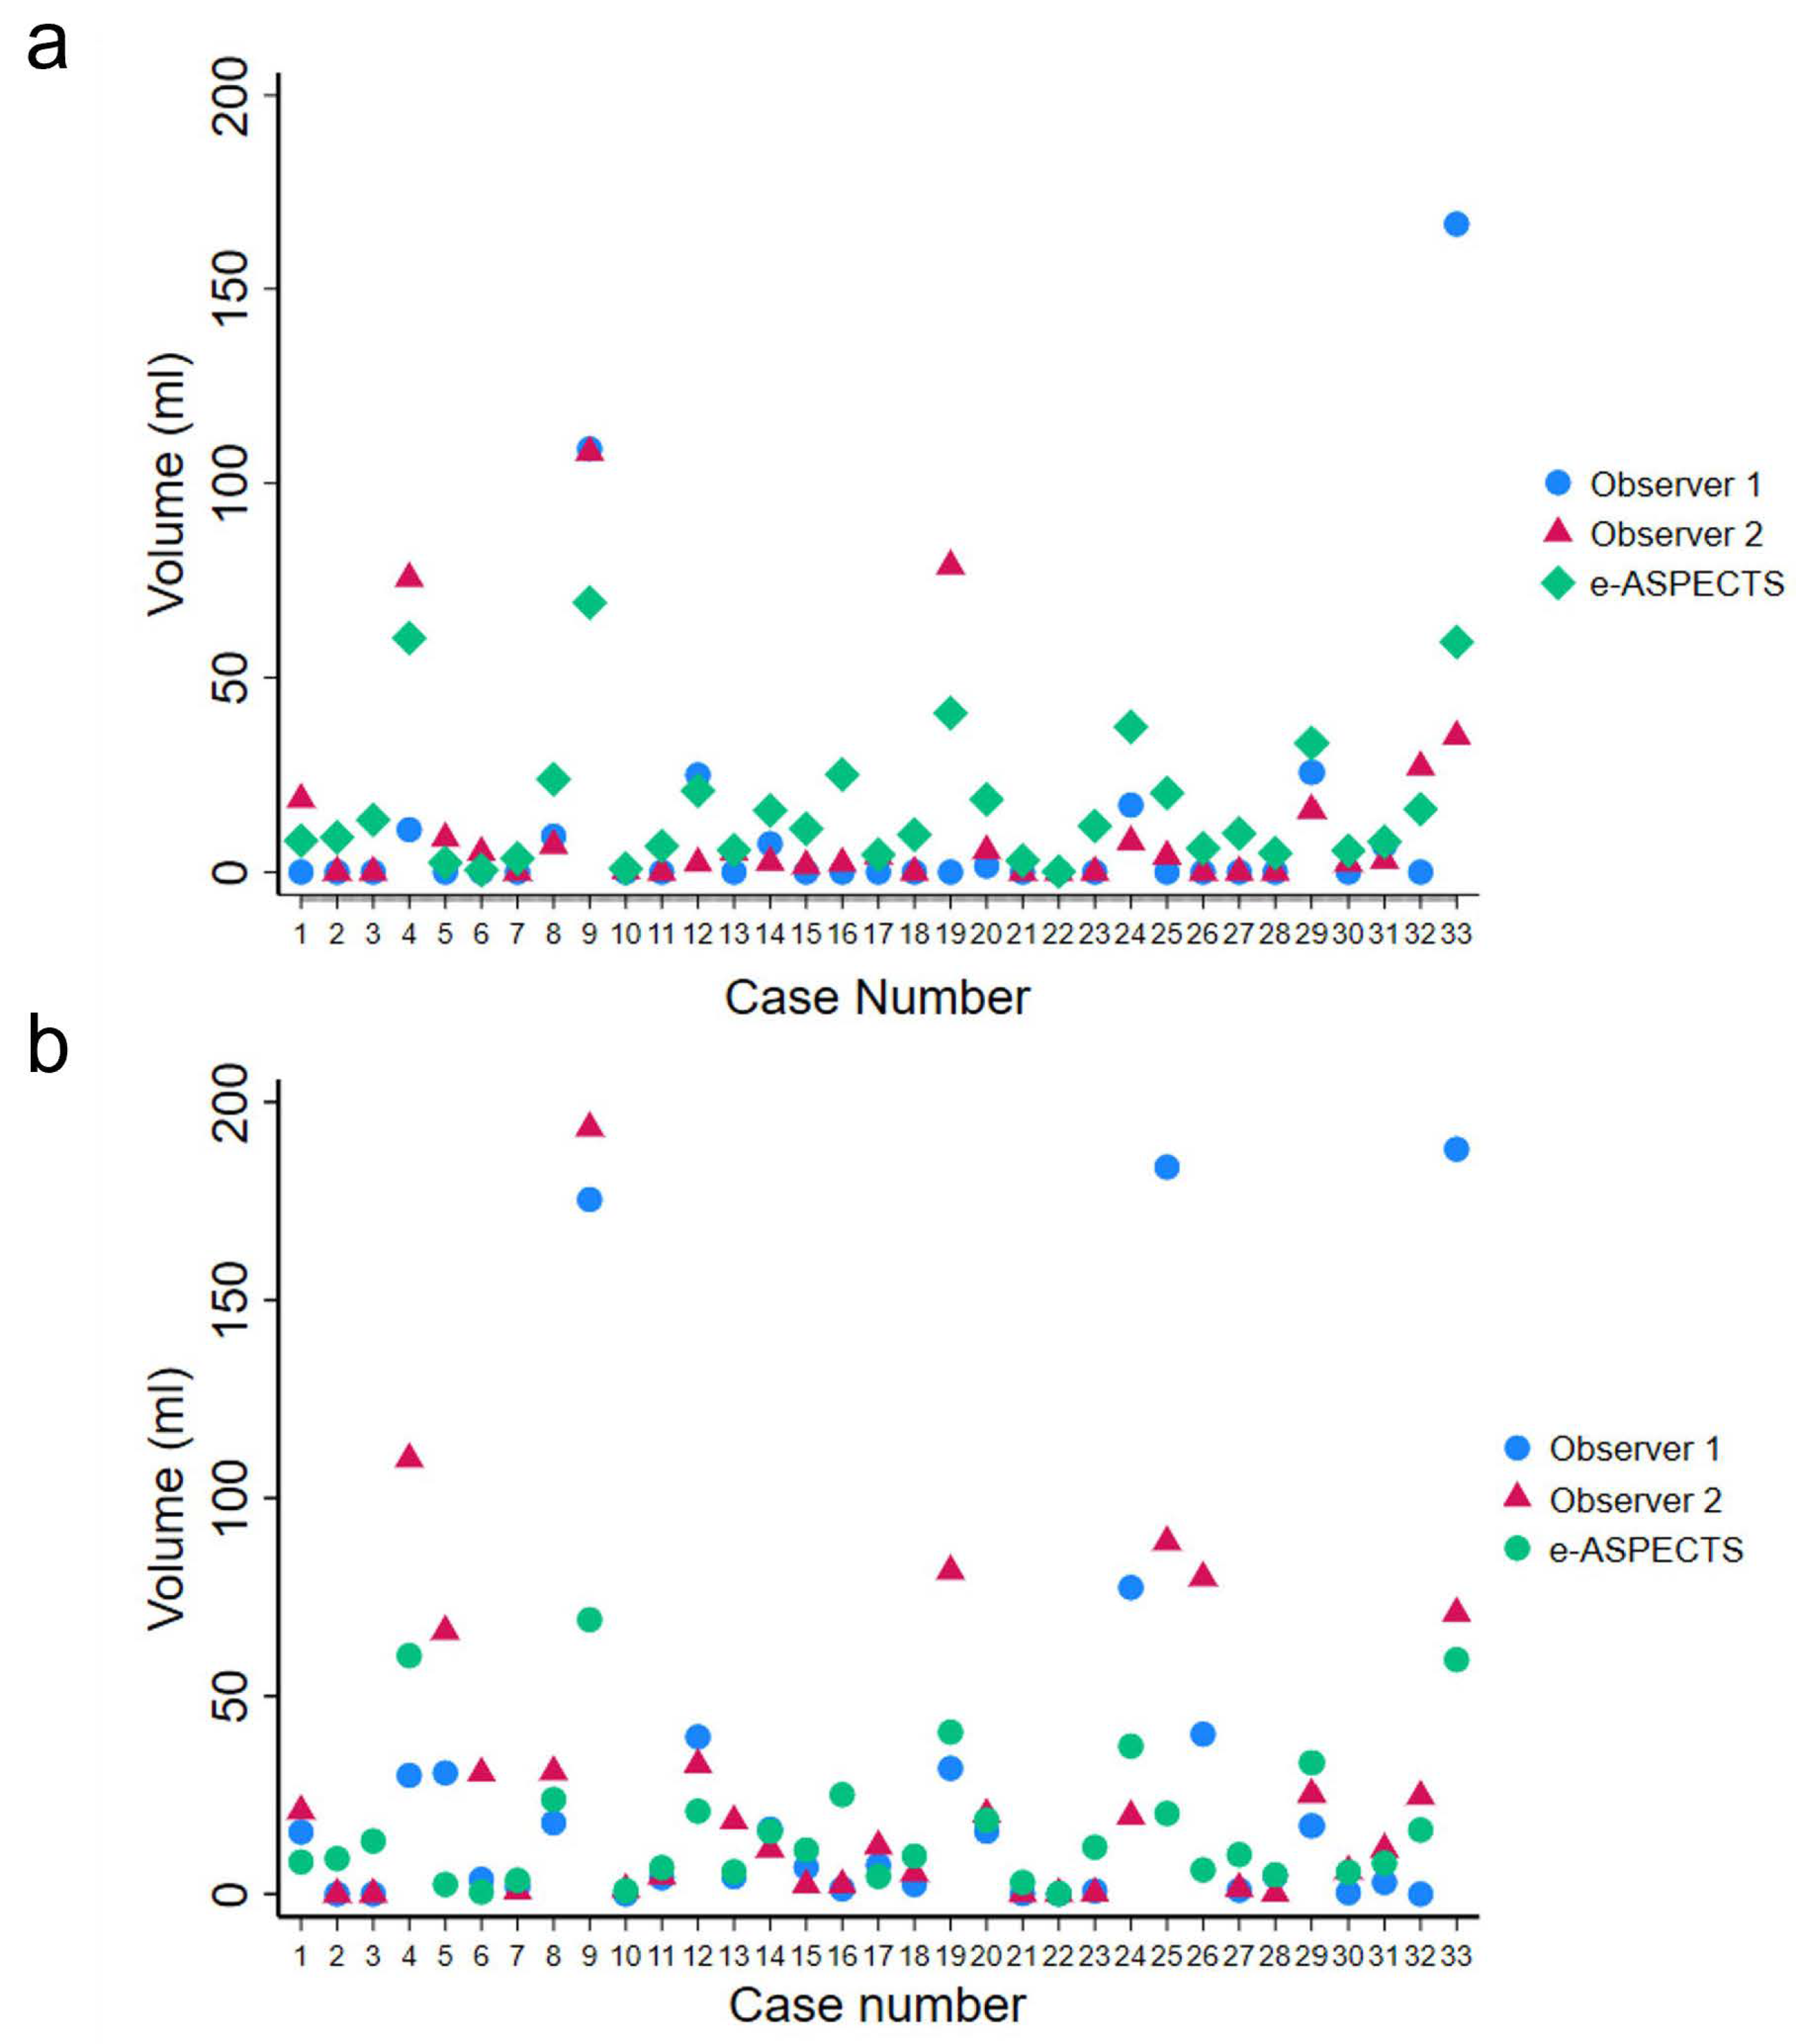
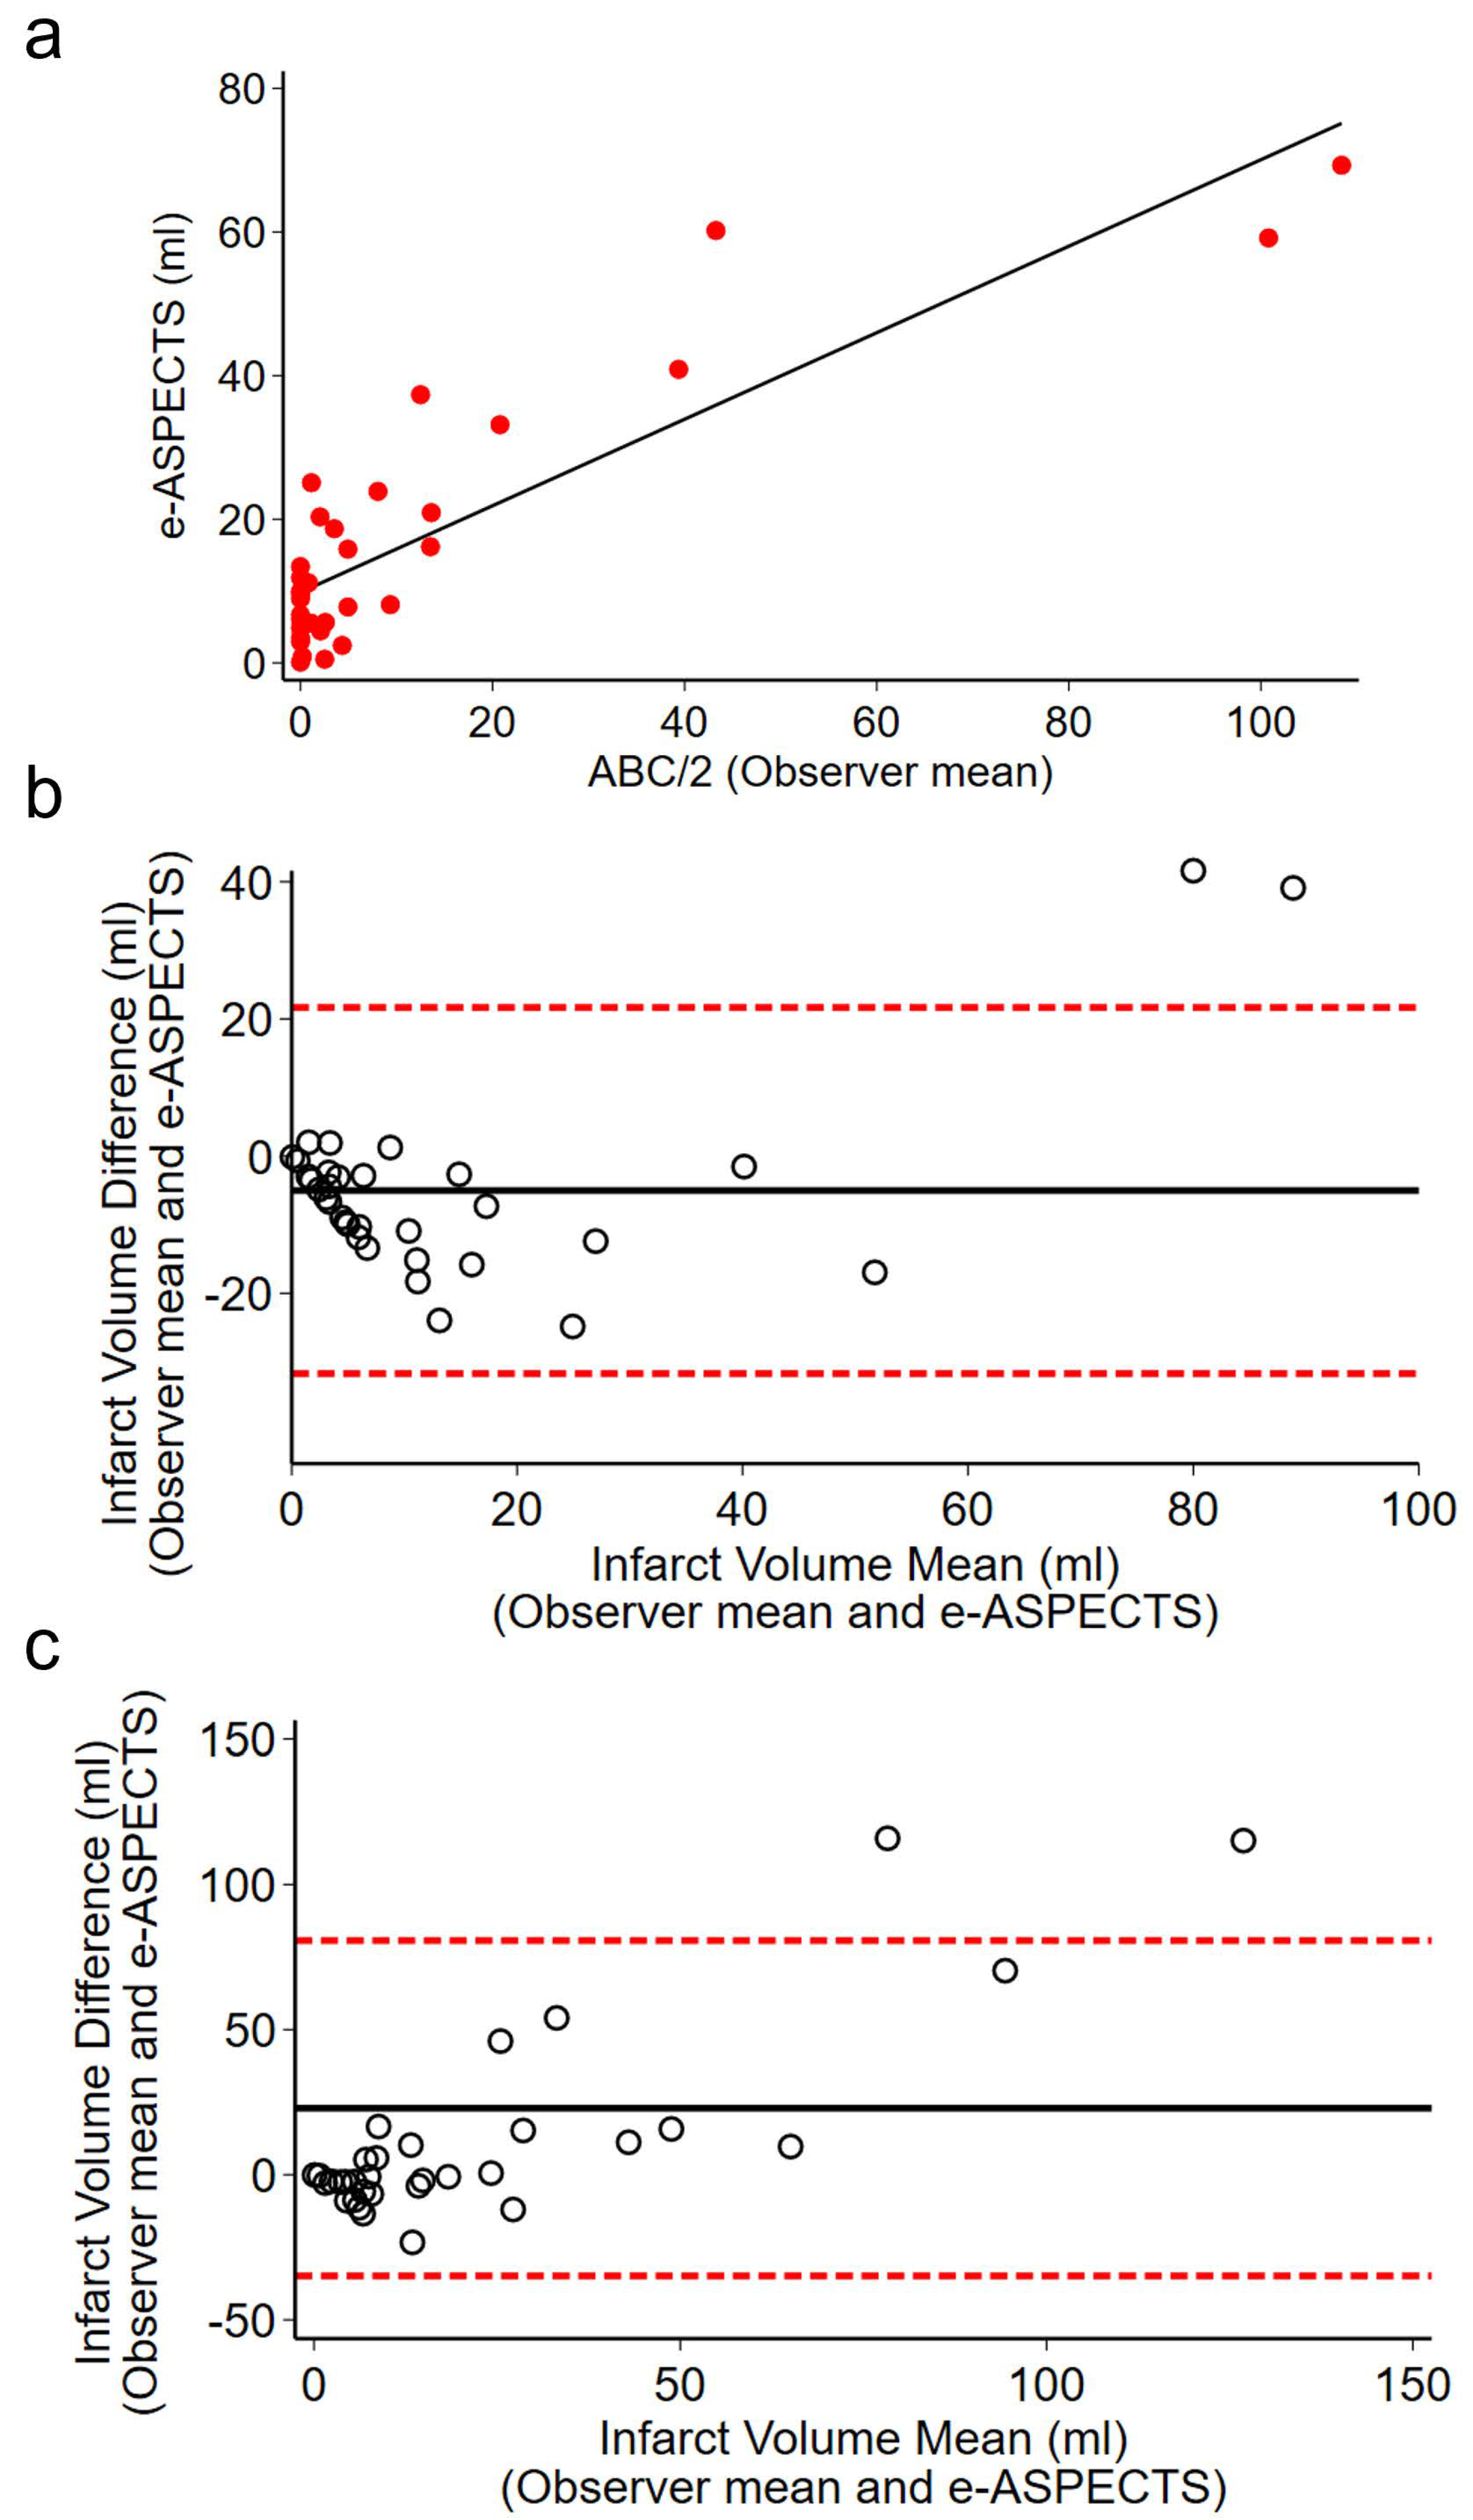
3.2. Infarct Volume
3.3. Interobserver Agreement
3.4. Sensitivity Analysis
4. Discussion
5. Conclusions
Supplementary Materials
Author Contributions
Funding
Institutional Review Board Statement
Informed Consent Statement
Data Availability Statement
Conflicts of Interest
Abbreviations
References
- Ospel, J.M.; Hill, M.D.; Menon, B.K.; Demchuk, A.; McTaggart, R.; Nogueira, R.; Poppe, A.; Haussen, D.; Qiu, W.; Mayank, A.; et al. Strength of Association between Infarct Volume and Clinical Outcome Depends on the Magnitude of Infarct Size: Results from the ESCAPE-NA1 Trial. Am. J. Neuroradiol. 2021, 42, 1375–1379. [Google Scholar] [CrossRef] [PubMed]
- Han, M.; Choi, J.W.; Rim, N.J.; Kim, S.Y.; Suh, H.I.; Lee, K.S.; Hong, J.M.; Lee, J.S. Cerebral infarct volume measurements to improve patient selection for endovascular treatment. Medicine 2016, 95, e4702. [Google Scholar] [CrossRef] [PubMed]
- Boers, A.M.M.; Jansen, I.G.H.; Brown, S.; Lingsma, H.F.; Beenen, L.F.M.; Devlin, T.G.; Román, L.S.; Heo, J.-H.; Ribó, M.; Almekhlafi, M.A.; et al. Mediation of the Relationship Between Endovascular Therapy and Functional Outcome by Follow-up Infarct Volume in Patients With Acute Ischemic Stroke. JAMA Neurol. 2019, 76, 194–202. [Google Scholar] [CrossRef] [PubMed]
- Nogueira, R.G.; Jadhav, A.P.; Haussen, D.C.; Bonafe, A.; Budzik, R.F.; Bhuva, P.; Yavagal, D.R.; Ribo, M.; Cognard, C.; Hanel, R.A.; et al. Thrombectomy 6 to 24 Hours after Stroke with a Mismatch between Deficit and Infarct. N. Engl. J. Med. 2018, 378, 11–21. [Google Scholar] [CrossRef]
- Albers, G.W.; Marks, M.P.; Kemp, S.; Christensen, S.; Tsai, J.P.; Ortega-Gutierrez, S.; McTaggart, R.A.; Torbey, M.T.; Kim-Tenser, M.; Leslie-Mazwi, T.; et al. Thrombectomy for Stroke at 6 to 16 Hours with Selection by Perfusion Imaging. N. Engl. J. Med. 2018, 378, 708–718. [Google Scholar] [CrossRef]
- Ma, H.; Campbell, B.C.V.; Parsons, M.W.; Churilov, L.; Levi, C.R.; Hsu, C.; Kleinig, T.J.; Wijeratne, T.; Curtze, S.; Dewey, H.M.; et al. Thrombolysis Guided by Perfusion Imaging up to 9 Hours after Onset of Stroke. N. Engl. J. Med. 2019, 380, 1795–1803. [Google Scholar] [CrossRef]
- Yoo, A.J.; Verduzco, L.A.; Schaefer, P.W.; Hirsch, J.A.; Rabinov, J.D.; Gonzalez, R.G. MRI-based selection for intra-arterial stroke therapy: Value of pretreatment diffusion-weighted imaging lesion volume in selecting patients with acute stroke who will benefit from early recanalization. Stroke 2009, 40, 2046–2054. [Google Scholar] [CrossRef]
- Albers, G.W.; Thijs, V.N.; Wechsler, L.; Kemp, S.; Schlaug, G.; Skalabrin, E.; Bammer, R.; Kakuda, W.; Lansberg, M.G.; Shuaib, A.; et al. Magnetic resonance imaging profiles predict clinical response to early reperfusion: The diffusion and perfusion imaging evaluation for understanding stroke evolution (DEFUSE) study. Ann. Neurol. 2006, 60, 508–517. [Google Scholar] [CrossRef]
- Webb, A.J.S.; Ullman, N.L.; Morgan, T.C.; Muschelli, J.; Kornbluth, J.; Awad, I.A.; Mayo, S.; Rosenblum, M.; Ziai, W.; Zuccarrello, M.; et al. Accuracy of the ABC/2 Score for Intracerebral Hemorrhage: Systematic Review and Analysis of MISTIE, CLEAR-IVH, and CLEAR III. Stroke 2015, 46, 2470–2476. [Google Scholar] [CrossRef]
- van der Worp, H.B.; Claus, S.P.; Bar, P.R.; Ramos, L.M.; Algra, A.; van Gijn, J.; Kappelle, L.J. Reproducibility of measurements of cerebral infarct volume on CT scans. Stroke 2001, 32, 424–430. [Google Scholar] [CrossRef]
- Sims, J.R.; Gharai, L.R.; Schaefer, P.W.; Vangel, M.; Rosenthal, E.S.; Lev, M.H.; Schwamm, L.H. ABC/2 for rapid clinical estimate of infarct, perfusion, and mismatch volumes. Neurology 2009, 72, 2104–2110. [Google Scholar] [CrossRef] [PubMed]
- Nagel, S.; Joly, O.; Pfaff, J.; Papanagiotou, P.; Fassbender, K.; Reith, W.; Möhlenbruch, M.A.; Herweh, C.; Grunwald, I.Q. e-ASPECTS derived acute ischemic volumes on non-contrast-enhanced computed tomography images. Int. J. Stroke 2020, 15, 995–1001. [Google Scholar] [CrossRef]
- Lyden, P.D.; Zweifler, R.; Mahdavi, Z.; Lonzo, L. A rapid, reliable, and valid method for measuring infarct and brain compartment volumes from computed tomographic scans. Stroke 1994, 25, 2421–2428. [Google Scholar] [CrossRef]
- Pedraza, S.; Puig, J.; Blasco, G.; Daunis, I.E.J.; Boada, I.; Bardera, A.; Castellanos, M.; Serena, J. Reliability of the ABC/2 method in determining acute infarct volume. J. Neuroimaging 2012, 22, 155–159. [Google Scholar] [CrossRef]
- Sananmuang, T.; Dejsiripongsa, T.; Keandoungchun, J.; Apirakkan, M. Reliability of ABC/2 Method in Measuring of Infarct Volume in Magnetic Resonance Diffusion-Weighted Image. Asian J. Neurosurg. 2019, 14, 801–807. [Google Scholar] [CrossRef] [PubMed]
- Yoshimoto, T.; Inoue, M.; Tanaka, K.; Kanemaru, K.; Koge, J.; Shiozawa, M.; Kamogawa, N.; Kimura, S.; Chiba, T.; Satow, T.; et al. Identifying large ischemic core volume ranges in acute stroke that can benefit from mechanical thrombectomy. J. NeuroInterv. Surg. 2020, 13, 1081–1087. [Google Scholar] [CrossRef]
- Boisseau, W.; Dargazanli, C.; Smajda, S.; Capron, J.; Piotin, M.; Ducroux, C.; Shamy, M.; Dowlatshahi, D.; Aviv, R.I.; Fahed, R. Use of the ABC/2 Method to Select Patients for Thrombectomy After 6 Hours of Symptom Onset. Neurology 2021, 96, e10–e18. [Google Scholar] [CrossRef] [PubMed]
- Grunwald, I.Q.; Ragoschke-Schumm, A.; Kettner, M.; Schwindling, L.; Roumia, S.; Helwig, S.; Manitz, M.; Walter, S.; Yilmaz, U.; Greveson, E.; et al. First Automated Stroke Imaging Evaluation via Electronic Alberta Stroke Program Early CT Score in a Mobile Stroke Unit. Cerebrovasc. Dis. 2016, 42, 332–338. [Google Scholar] [CrossRef]
- Guberina, N.; Dietrich, U.; Radbruch, A.; Goebel, J.; Deuschl, C.; Ringelstein, A.; Köhrmann, M.; Kleinschnitz, C.; Forsting, M.; Mönninghoff, C. Detection of early infarction signs with machine learning-based diagnosis by means of the Alberta Stroke Program Early CT score (ASPECTS) in the clinical routine. Neuroradiology 2018, 60, 889–901. [Google Scholar] [CrossRef]
- Herweh, C.; Ringleb, P.A.; Rauch, G.; Gerry, S.; Behrens, L.; Möhlenbruch, M.; Gottorf, R.; Richter, D.; Schieber, S.; Nagel, S. Performance of e-ASPECTS software in comparison to that of stroke physicians on assessing CT scans of acute ischemic stroke patients. Int. J. Stroke 2016, 11, 438–445. [Google Scholar] [CrossRef]
- Pfaff, J.; Herweh, C.; Schieber, S.; Schönenberger, S.; Bösel, J.; Ringleb, P.A.; Möhlenbruch, M.; Bendszus, M.; Nagel, S. e-ASPECTS Correlates with and Is Predictive of Outcome after Mechanical Thrombectomy. AJNR Am. J. Neuroradiol. 2017, 38, 1594–1599. [Google Scholar] [CrossRef] [PubMed]

| O1 | O2 | Mean (O1, O2) | e-ASPECTS | O1 vs. O2 | O1 vs. e-ASPECTS | O2 vs. e-ASPECTS | Mean (O1, O2) vs. e-ASPECTS | |||||
|---|---|---|---|---|---|---|---|---|---|---|---|---|
| Volume (mL) | Diff (mL) | p | Diff (mL) | p | Diff (mL) | p | Diff (mL) | p | ||||
| CT on admission (n = 33) | 11.5 ± 34.1 | 12.8 ± 25.9 | 12.1 ± 26.0 | 17.1 ± 18.0 | −1.3 | 0.81 | −5.7 | 0.20 | −4.4 | 0.10 | −5.0 | 0.04 |
| CT at 24 h (n = 33) | 27.9 ± 52.4 | 29.5 ± 42.3 | 28.7 ± 4.2 | −1.6 | 0.80 | 10.8 | 0.15 | 12.4 | 0.03 | 11.6 | 0.05 | |
| Concordance Correlation | Confidence Interval (CI) | p-Value | ||
|---|---|---|---|---|
| CT on admission (n = 33) | O1 vs. O2 | 0.490 | 0.236–0.743 | <0.001 |
| O1 vs. e-ASPECTS | 0.576 | 0.409–0.744 | <0.001 | |
| O2 vs. e-ASPECTS | 0.756 | 0.629–0.883 | <0.001 | |
| Mean (O1, O2) vs. e-ASPECTS | 0.794 | 0.691–0.898 | <0.001 | |
| CT at 24 h (n = 33) | O1 vs. O2 | 0.724 | 0.564–0.884 | <0.001 |
| O1 vs. e-ASPECTS | 0.399 | 0.252–0.546 | <0.001 | |
| O2 vs. e-ASPECTS | 0.492 | 0.339–0.645 | <0.001 | |
| Mean (O1, O2) vs. e-ASPECTS | 0.495 | 0.350–0.640 | <0.001 |
Disclaimer/Publisher’s Note: The statements, opinions and data contained in all publications are solely those of the individual author(s) and contributor(s) and not of MDPI and/or the editor(s). MDPI and/or the editor(s) disclaim responsibility for any injury to people or property resulting from any ideas, methods, instructions or products referred to in the content. |
© 2025 by the authors. Licensee MDPI, Basel, Switzerland. This article is an open access article distributed under the terms and conditions of the Creative Commons Attribution (CC BY) license (https://creativecommons.org/licenses/by/4.0/).
Share and Cite
Bejleri, J.; Power, S.; Boland, F.; Joly, O.; Williams, D.J.; Thornton, J.J.; Pfeiffer, S. Comparative Analysis of the ABC/2 Score and e-ASPECTS Software in the Determination of Acute Ischaemic Stroke Volume from Non-Contrast CT. Brain Sci. 2025, 15, 560. https://doi.org/10.3390/brainsci15060560
Bejleri J, Power S, Boland F, Joly O, Williams DJ, Thornton JJ, Pfeiffer S. Comparative Analysis of the ABC/2 Score and e-ASPECTS Software in the Determination of Acute Ischaemic Stroke Volume from Non-Contrast CT. Brain Sciences. 2025; 15(6):560. https://doi.org/10.3390/brainsci15060560
Chicago/Turabian StyleBejleri, Jorin, Sarah Power, Fiona Boland, Olivier Joly, David J. Williams, John J. Thornton, and Shona Pfeiffer. 2025. "Comparative Analysis of the ABC/2 Score and e-ASPECTS Software in the Determination of Acute Ischaemic Stroke Volume from Non-Contrast CT" Brain Sciences 15, no. 6: 560. https://doi.org/10.3390/brainsci15060560
APA StyleBejleri, J., Power, S., Boland, F., Joly, O., Williams, D. J., Thornton, J. J., & Pfeiffer, S. (2025). Comparative Analysis of the ABC/2 Score and e-ASPECTS Software in the Determination of Acute Ischaemic Stroke Volume from Non-Contrast CT. Brain Sciences, 15(6), 560. https://doi.org/10.3390/brainsci15060560