
Neural Differences in Relation to Risk Preferences during Reward Processing: An Event-Related Potential Study


Abstract
1. Introduction
2. Materials and Methods
2.1. Participants
2.2. The Balloon Analog Risk Task (BART)
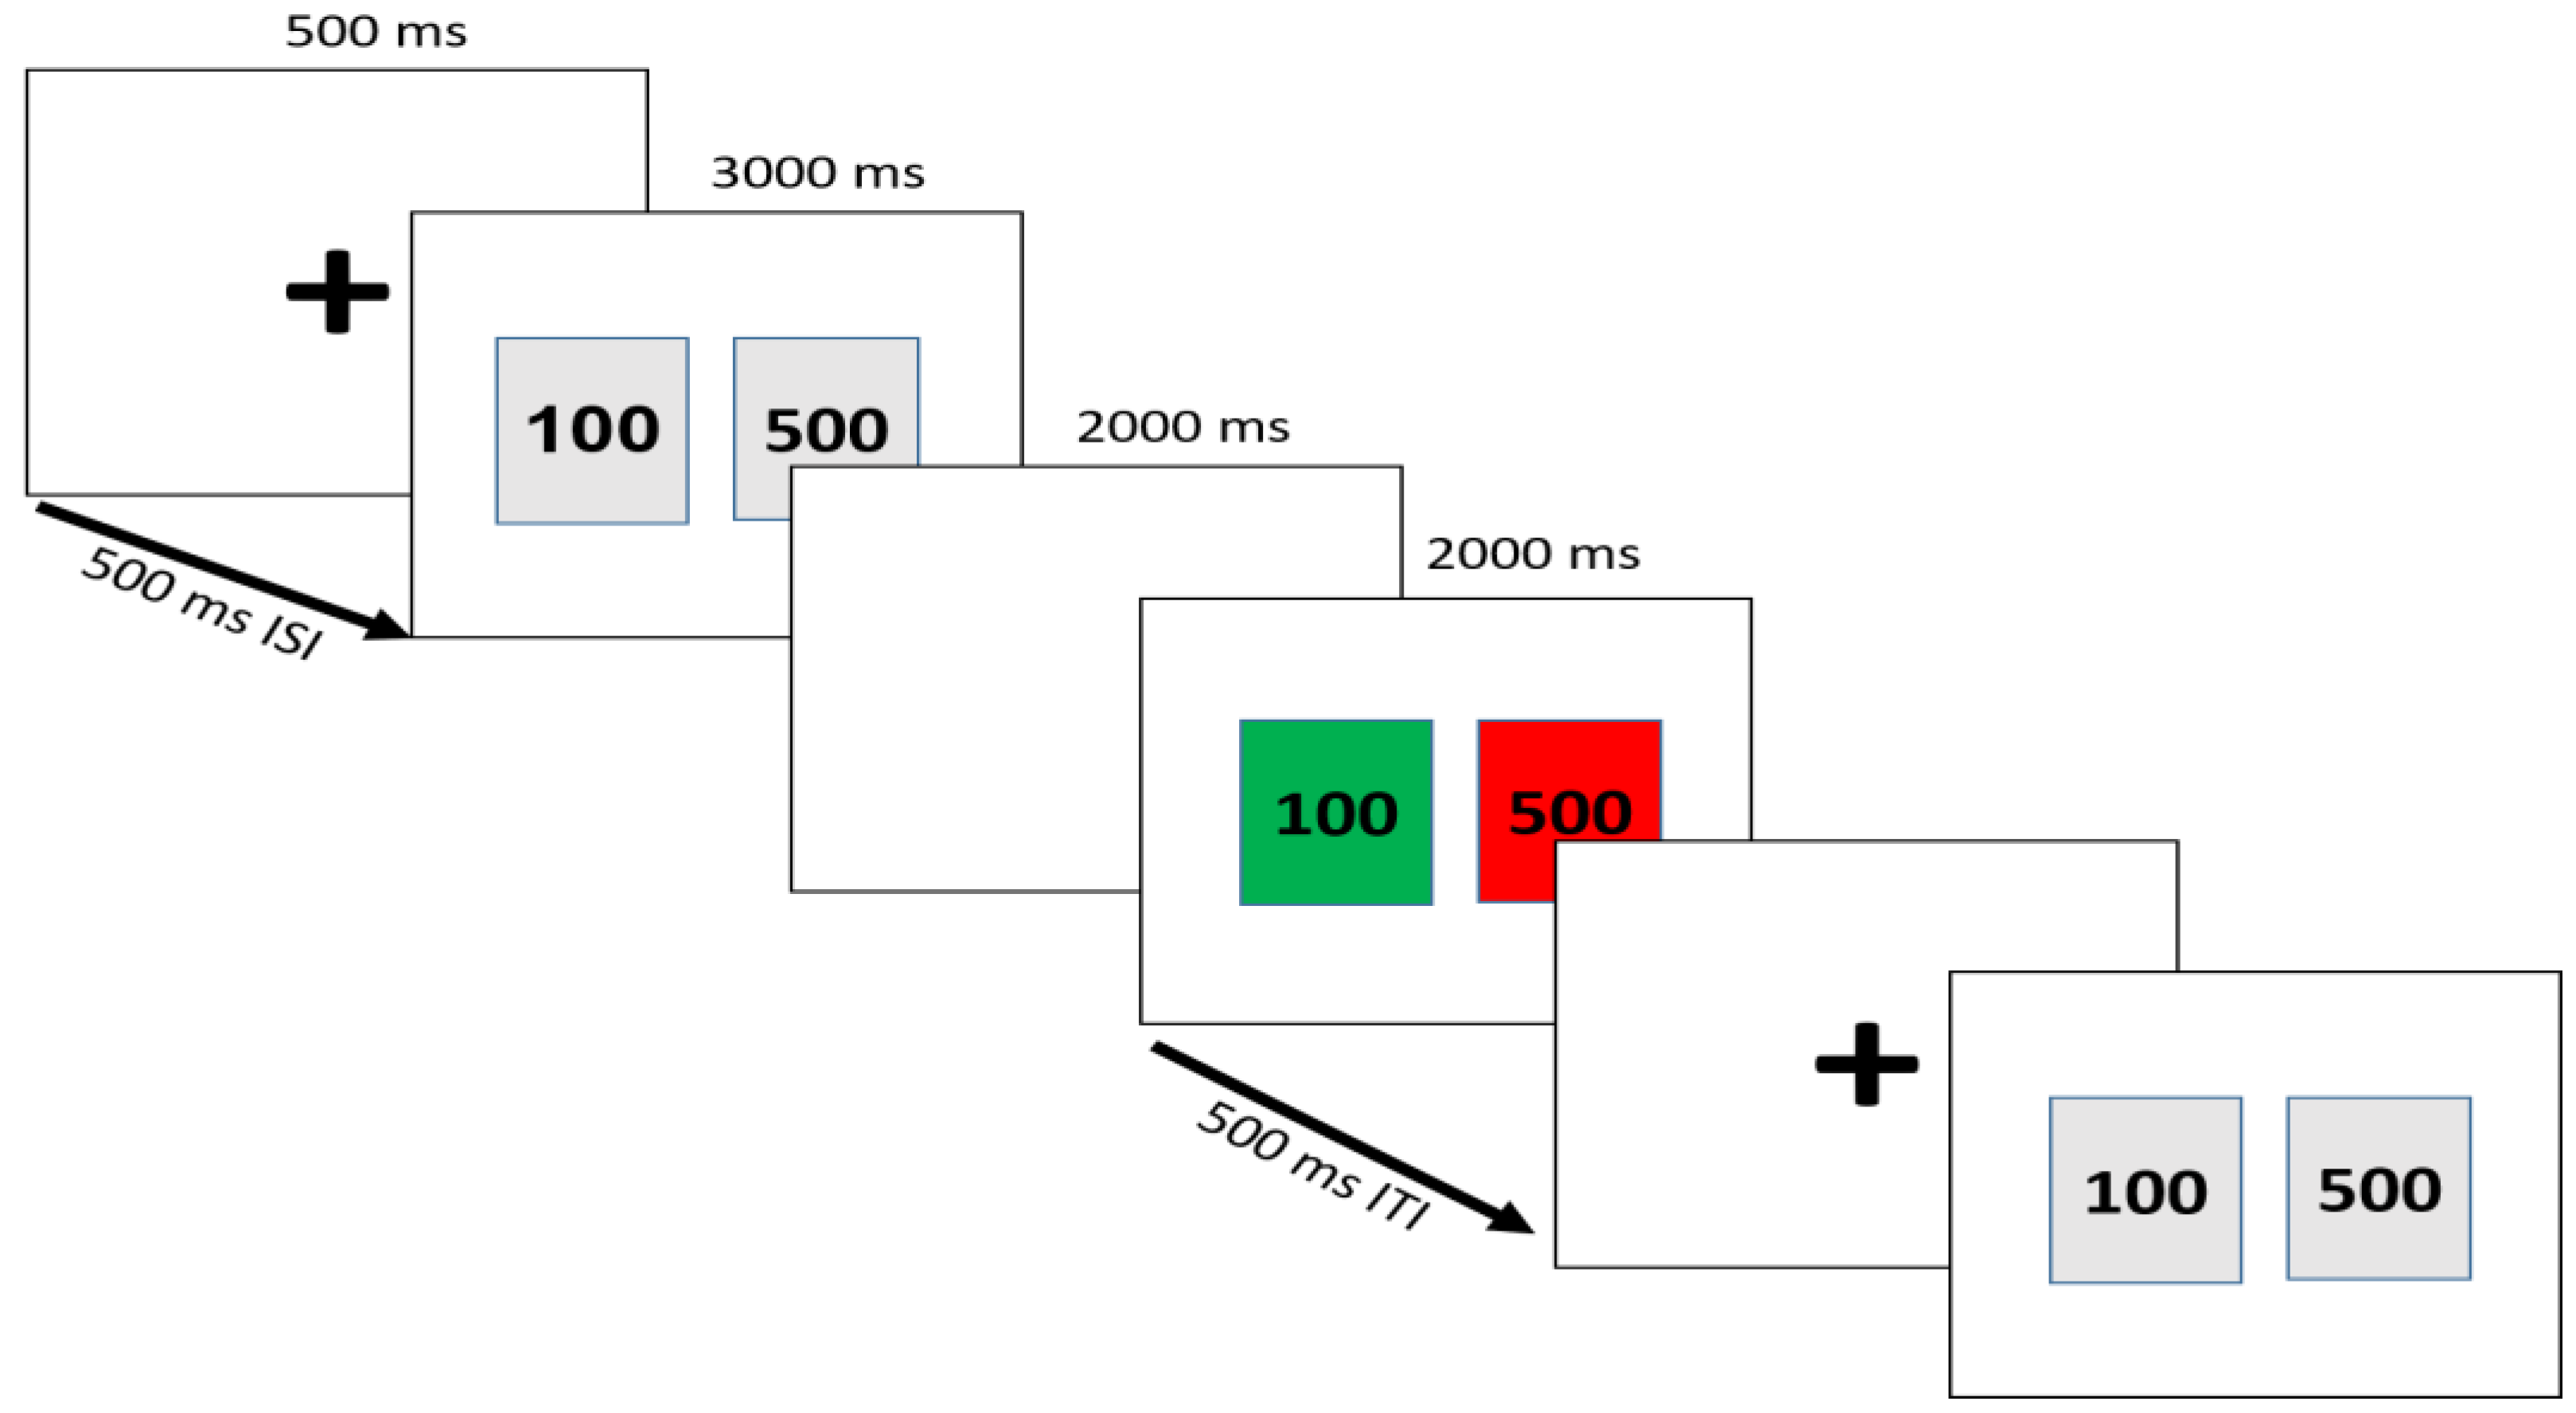
2.3. Task and Procedure
2.4. EEG Recording and Data Processing
3. Results
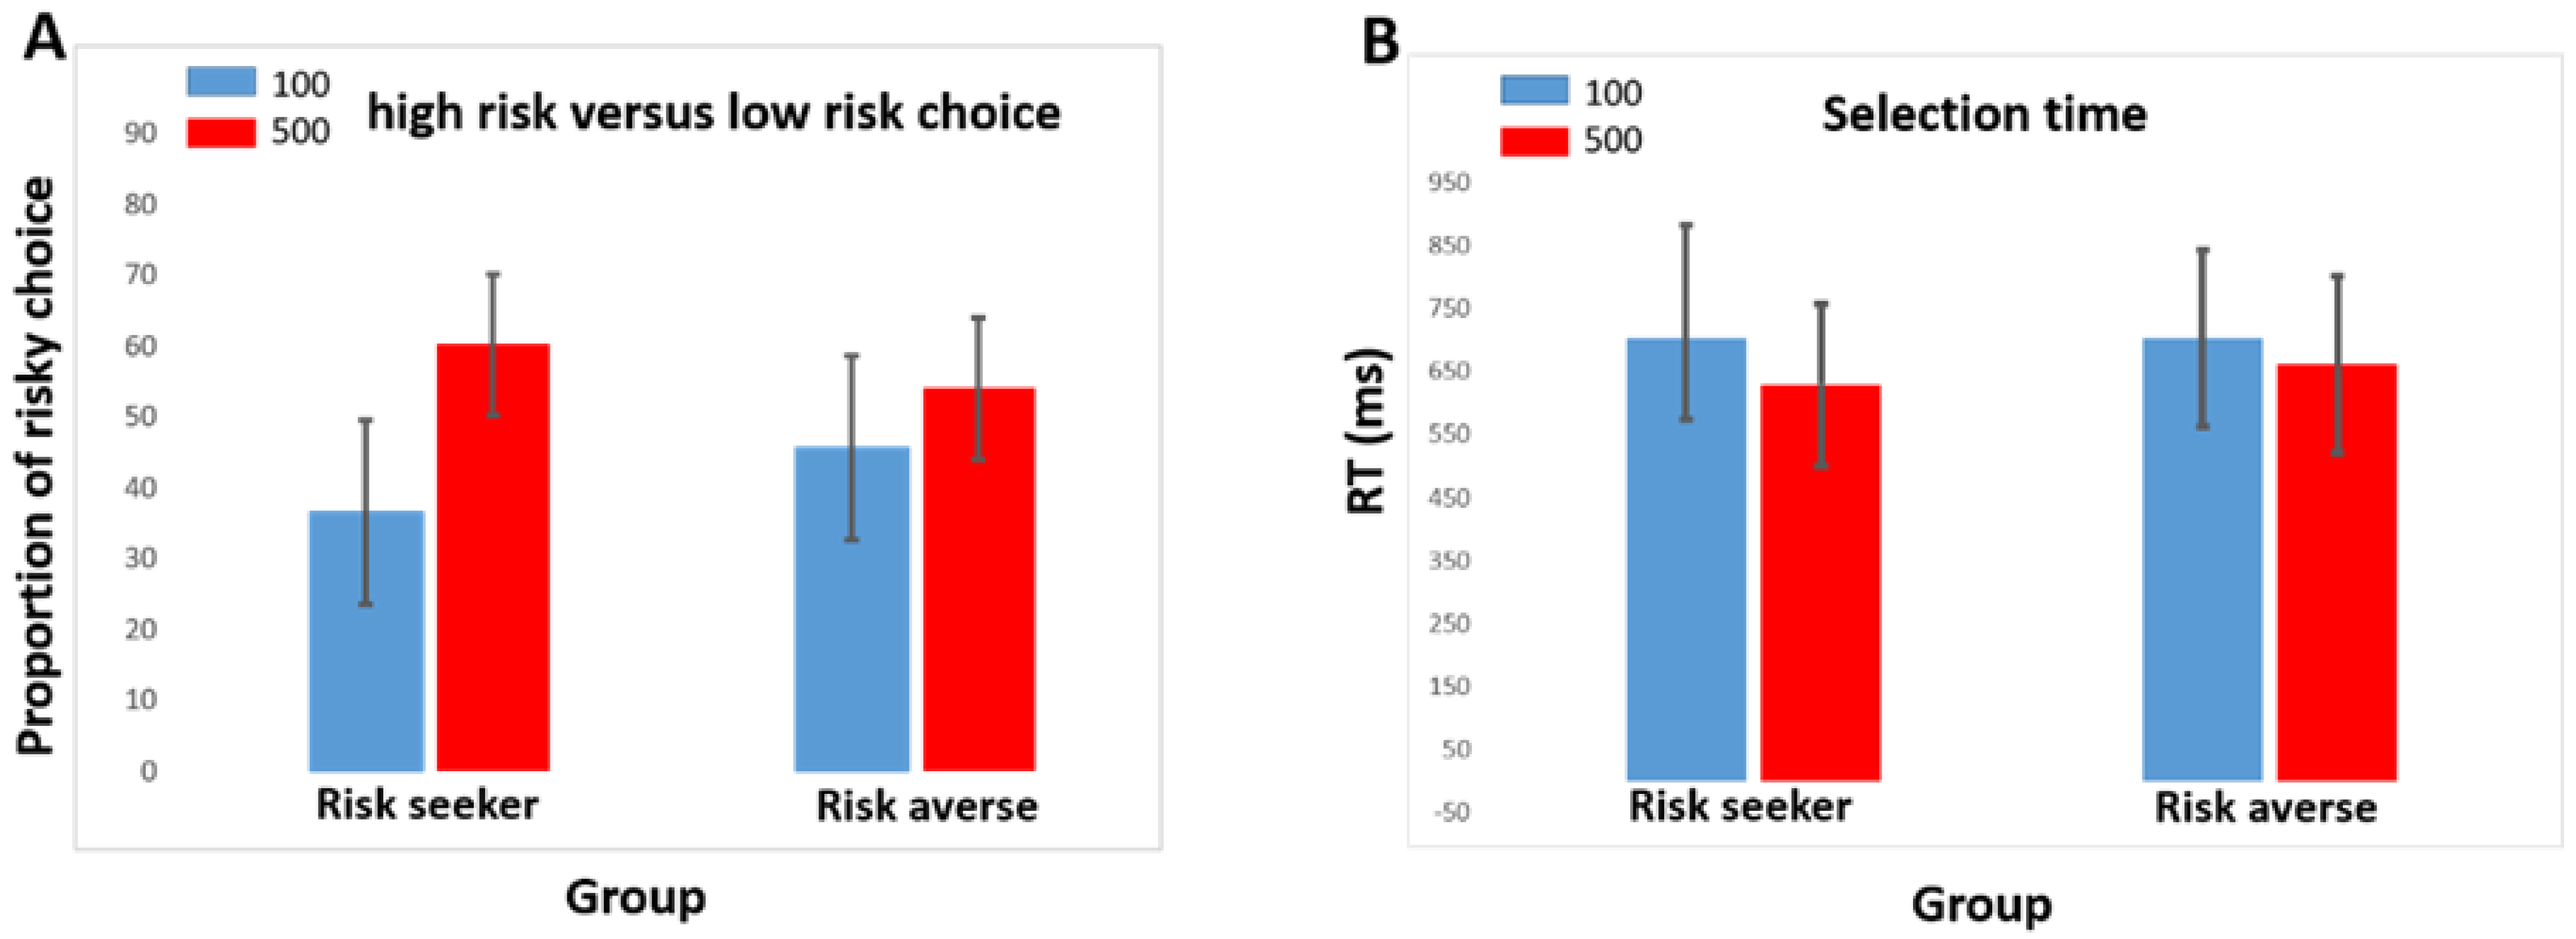
3.1. Demographic and Behavioral Data
3.2. Electroencephalography Data
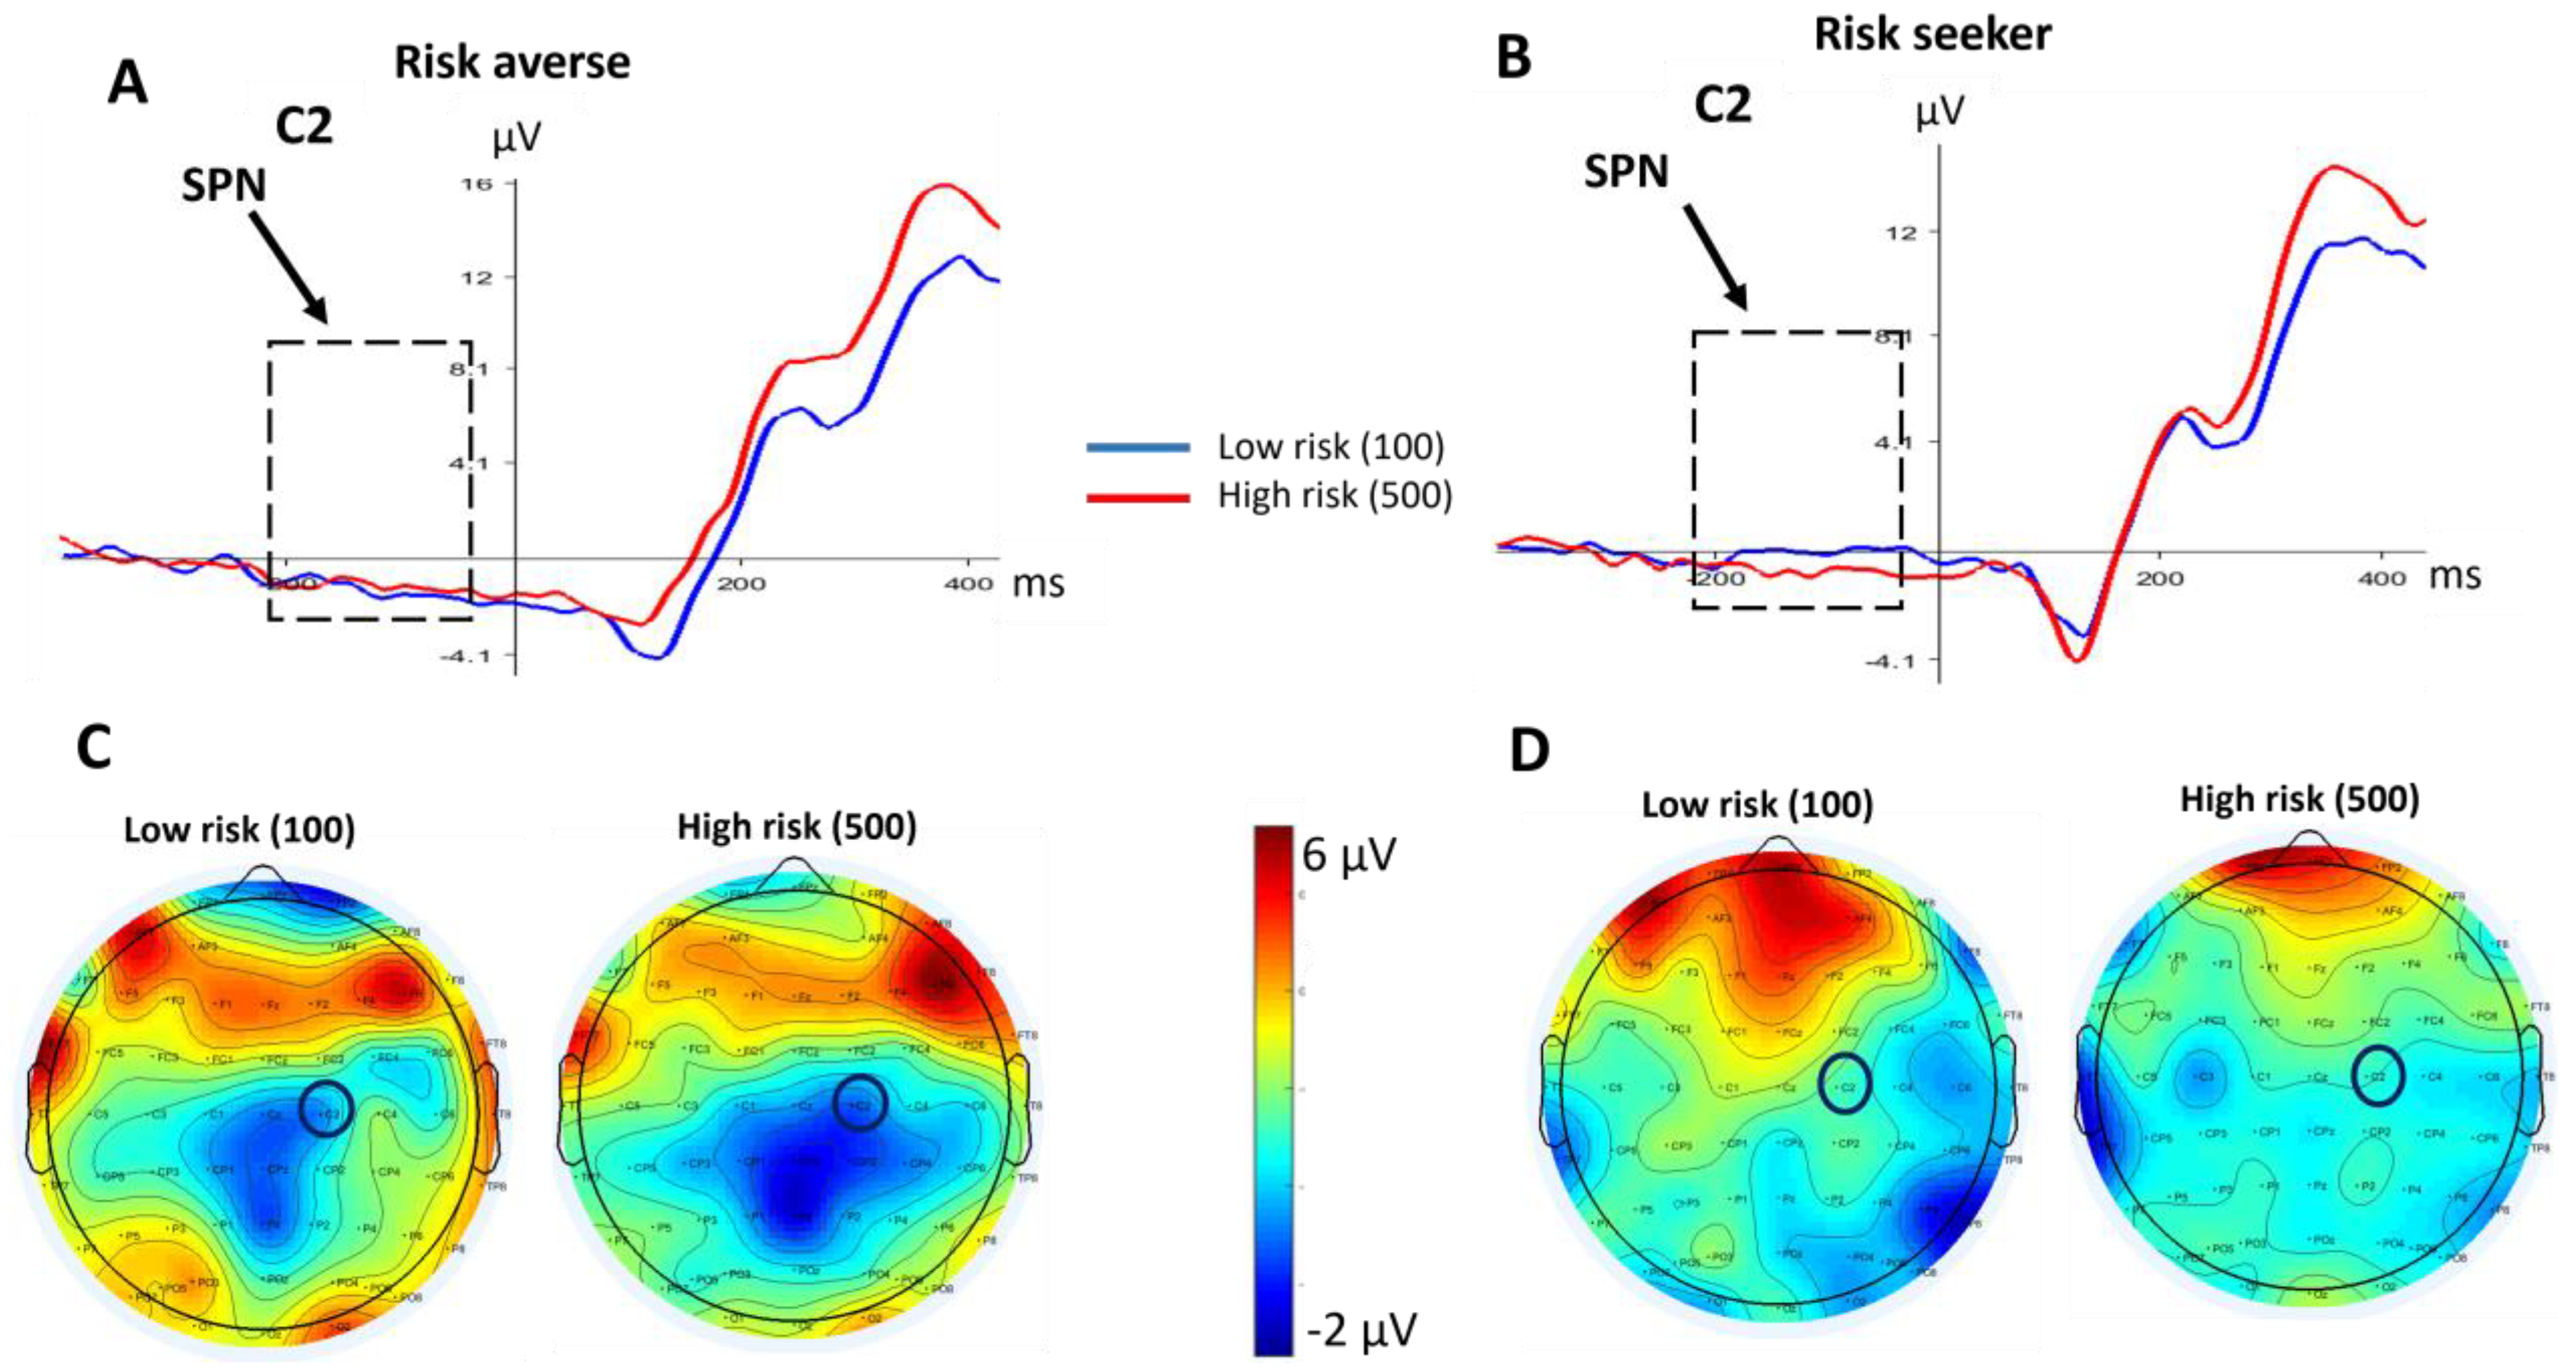
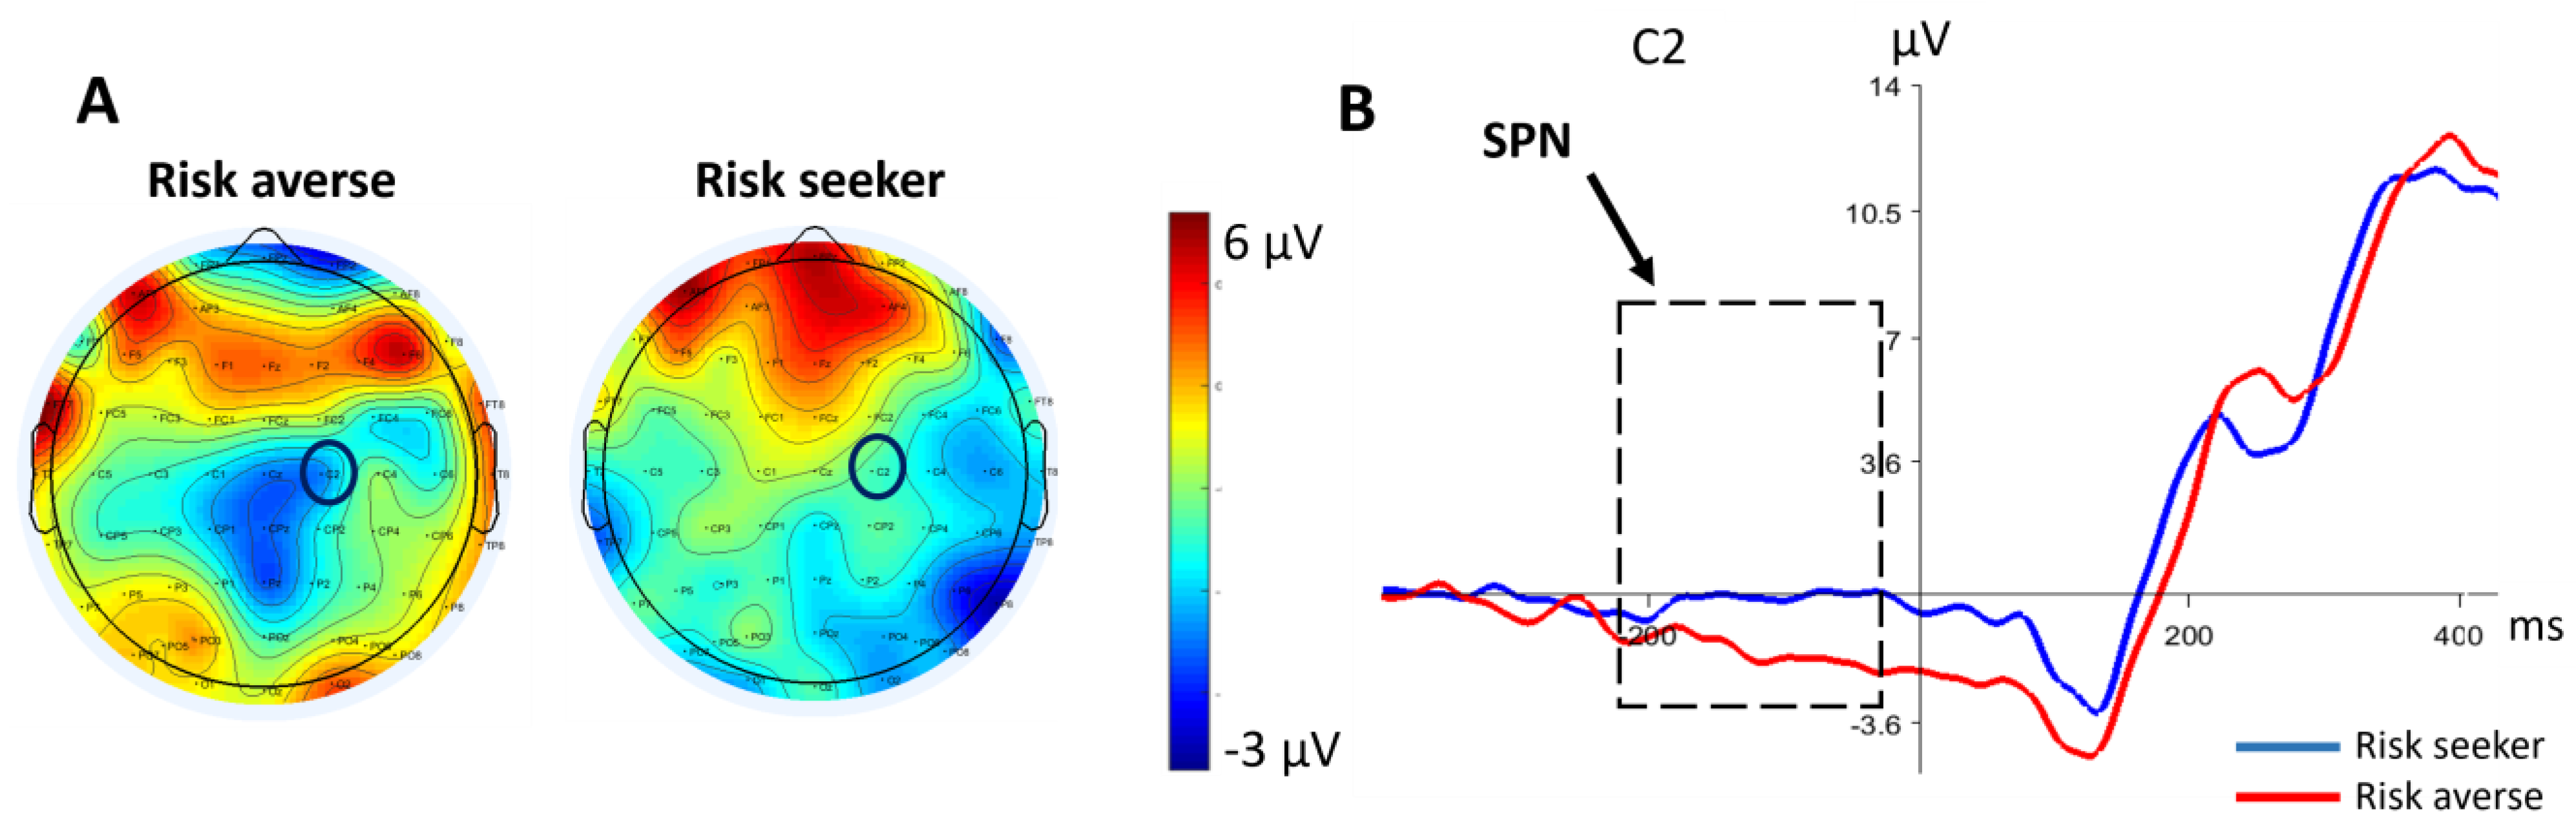
3.2.1. SPN
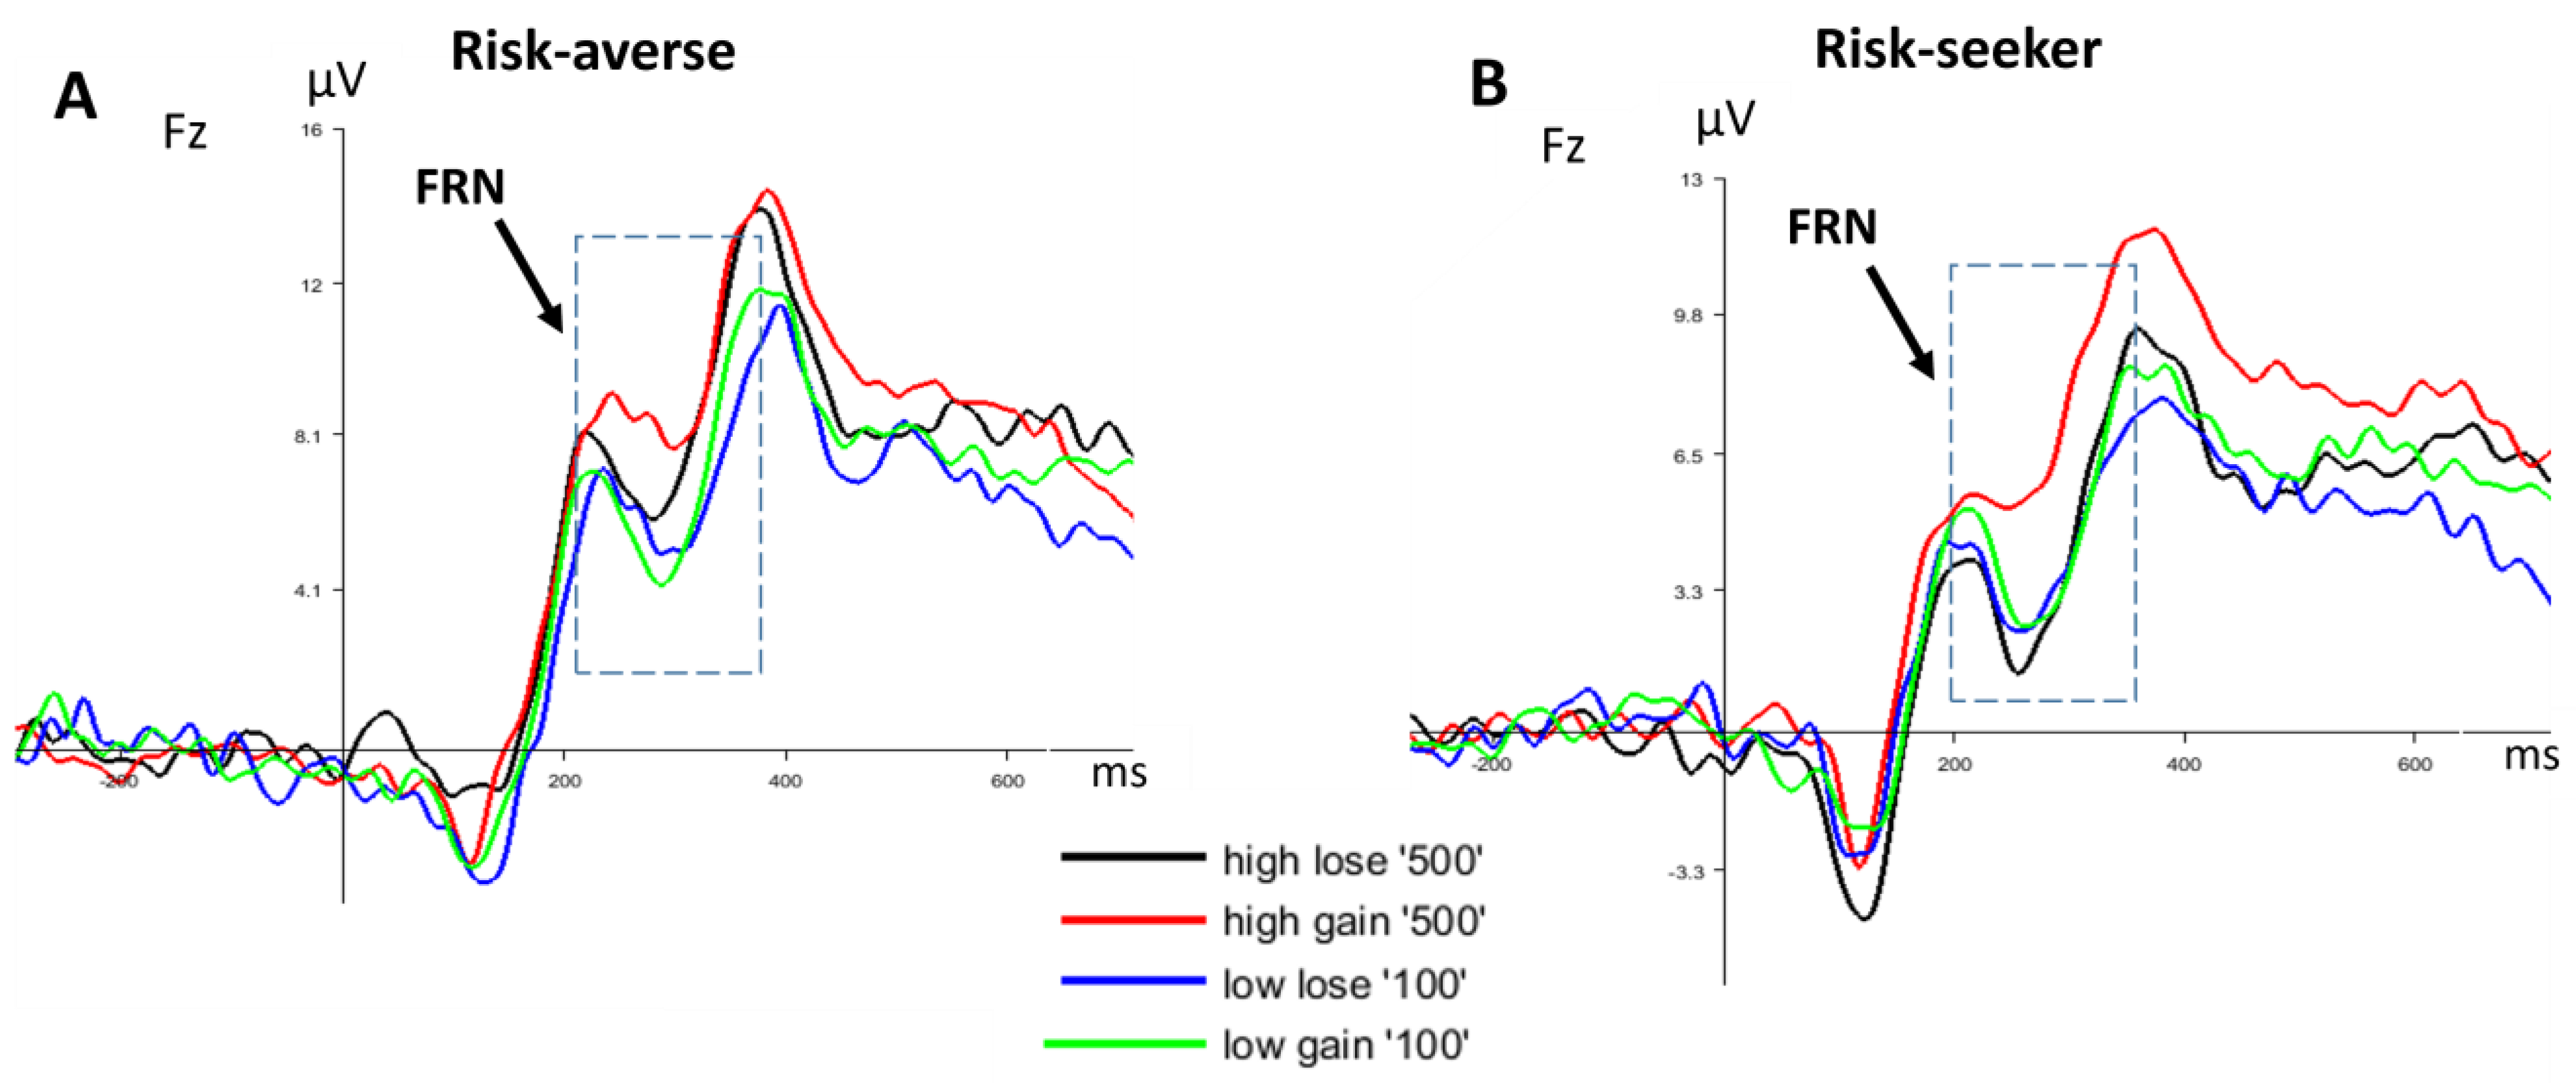
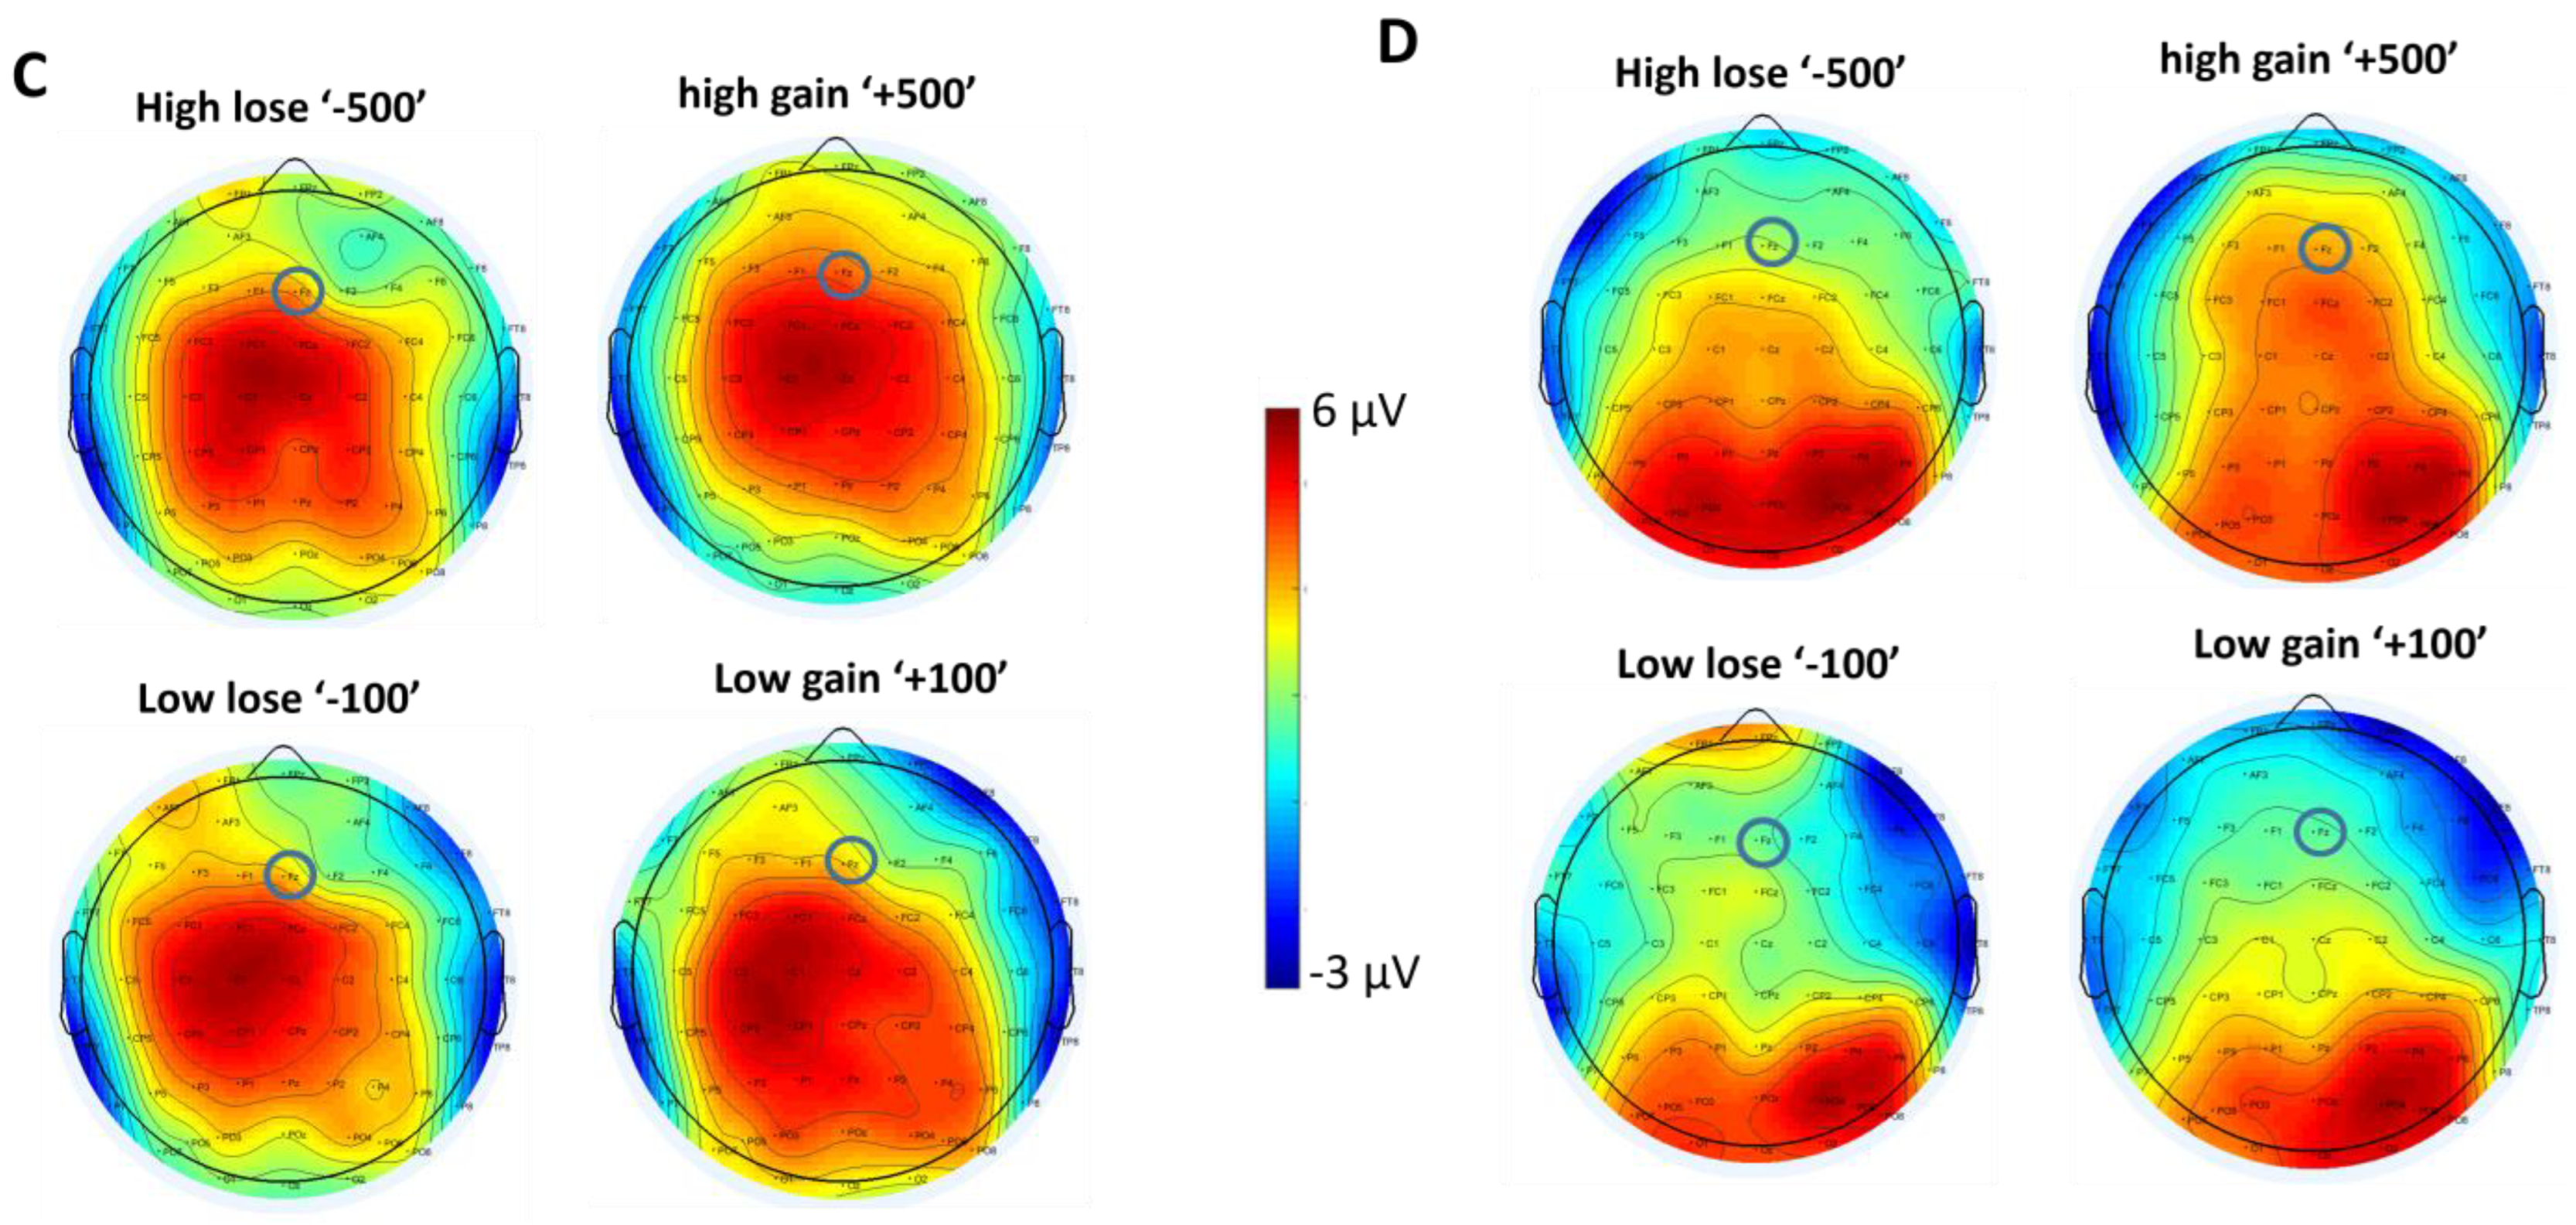
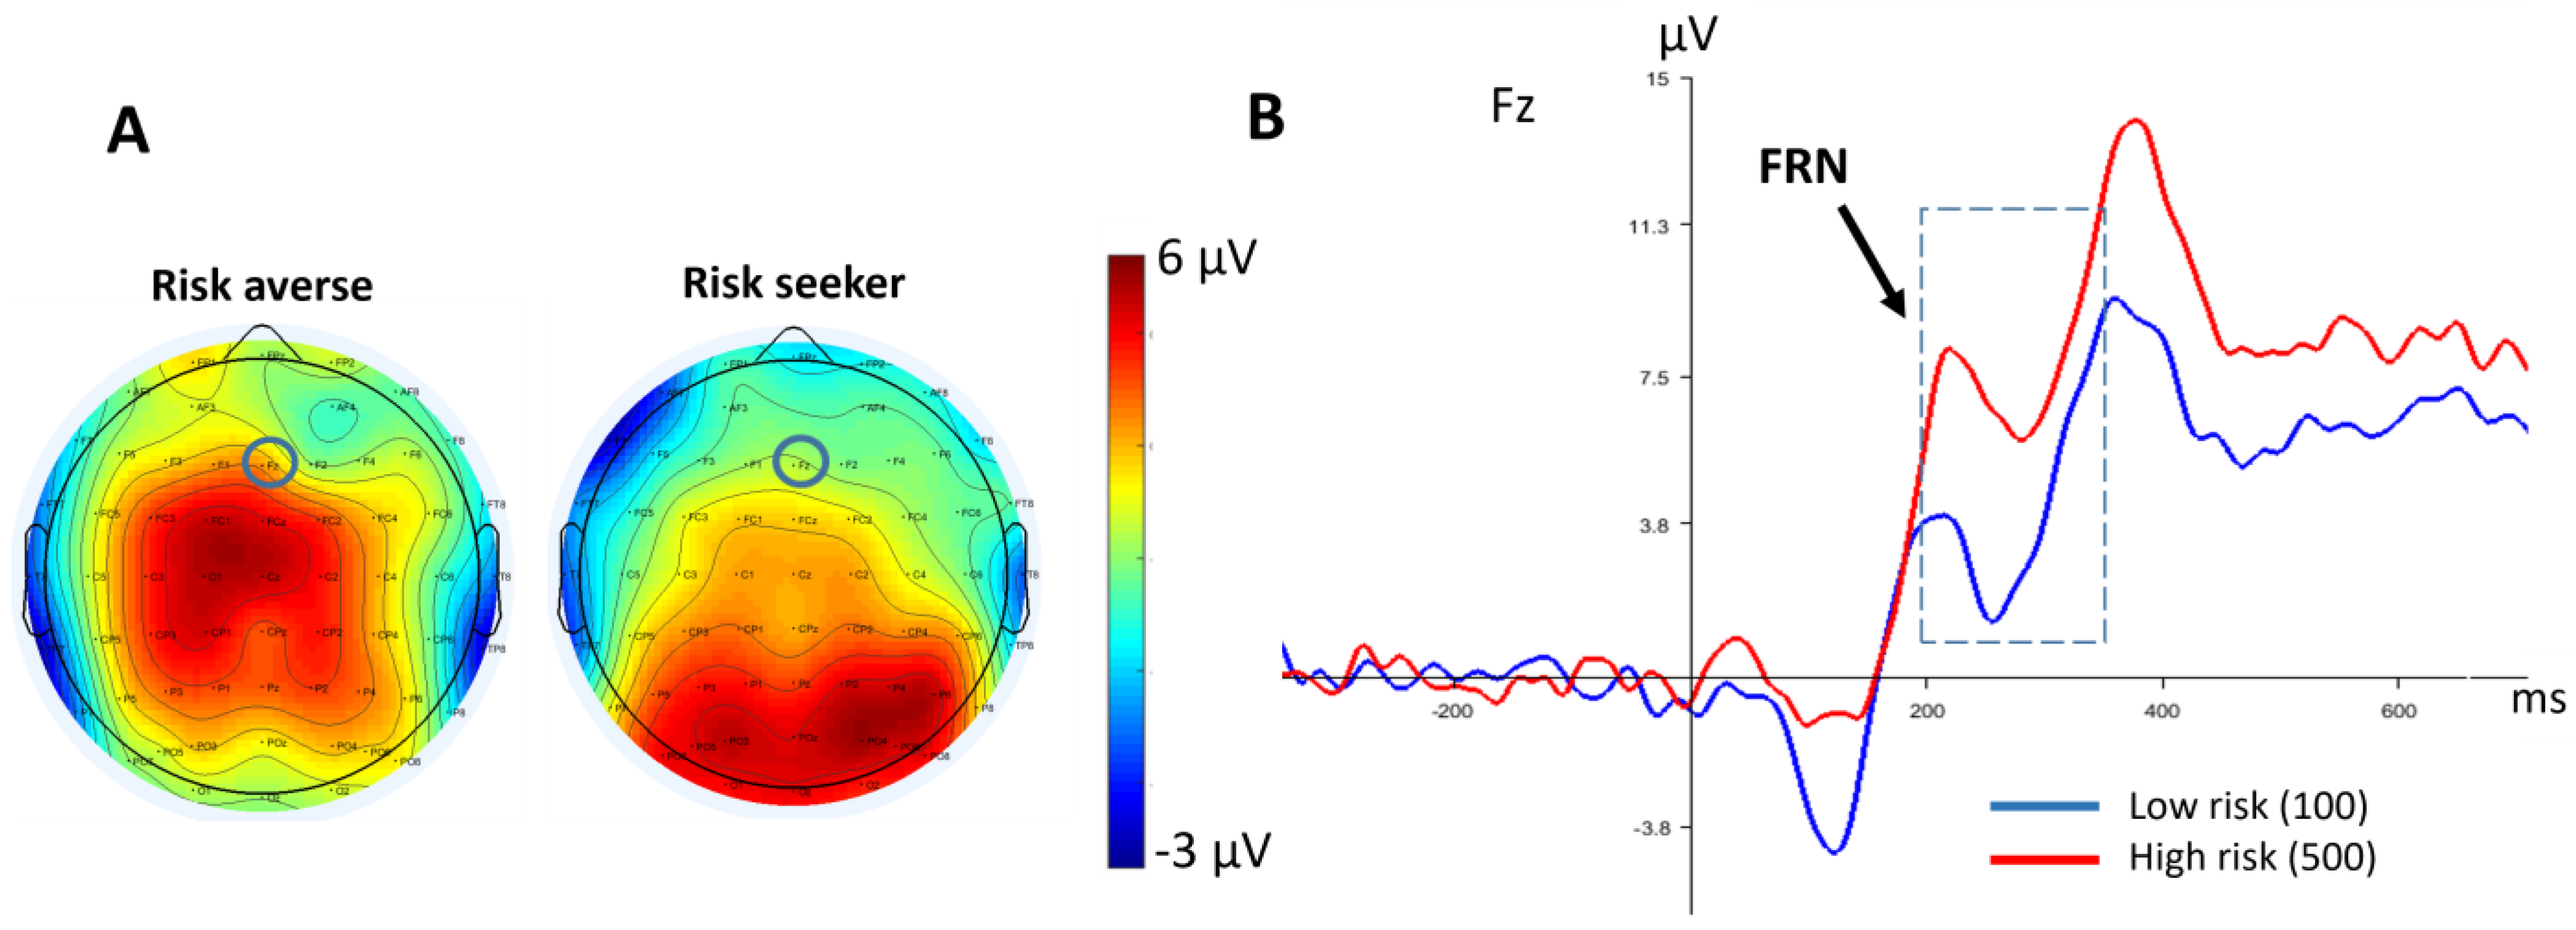
3.2.2. FRN
4. Discussion
Author Contributions
Funding
Institutional Review Board Statement
Informed Consent Statement
Data Availability Statement
Conflicts of Interest
References
- Charness, G.; Gneezy, U.; Imas, A. Experimental methods: Eliciting risk preferences. J. Econ. Behav. Organ. 2013, 87, 43–51. [Google Scholar] [CrossRef]
- Weber, E.U.; Milliman, R.A. Perceived risk attitudes: Relating risk perception to risky choice. Manag. Sci. 1997, 43, 123–144. [Google Scholar] [CrossRef]
- Frey, R.; Pedroni, A.; Mata, R.; Rieskamp, J.; Hertwig, R. Risk preference shares the psychometric structure of major psychological traits. Sci. Adv. 2017, 3, e1701381. [Google Scholar] [CrossRef] [PubMed]
- Wang, W.; Liu, X.; Chen, X.; Qin, Y. Risk assessment based on hybrid FMEA framework by considering decision maker’s psychological behavior character. Comput. Ind. Eng. 2019, 136, 516–527. [Google Scholar] [CrossRef]
- Yarosh, H.L.; Hyatt, C.J.; Meda, S.A.; Jiantonio-Kelly, R.; Potenza, M.N.; Assaf, M.; Pearlson, G.D. Relationships between reward sensitivity, risk-taking and family history of alcoholism during an interactive competitive fMRI task. PLoS ONE 2014, 9, e88188. [Google Scholar] [CrossRef]
- Gu, R.; Zhang, D.; Luo, Y.; Wang, H.; Broster, L.S. Predicting risk decisions in a modified Balloon Analogue Risk Task: Conventional and single-trial ERP analyses. Cogn. Affect. Behav. Neurosci. 2018, 18, 99–116. [Google Scholar] [CrossRef] [PubMed]
- Dennis, L.E.; Kohno, M.; McCready, H.D.; Schwartz, D.L.; Schwartz, B.; Lahna, D.; Nagel, B.J.; Mitchell, S.H.; Hoffman, W.F. Neural correlates of reward magnitude and delay during a probabilistic delay discounting task in alcohol use disorder. Psychopharmacology 2020, 237, 263–278. [Google Scholar] [CrossRef]
- Lobo, D.S.; Souza, R.P.; Tong, R.P.; Casey, D.M.; Hodgins, D.C.; Smith, G.J.; Williams, R.J.; Schopflocher, D.P.; Wood, R.T.; Kennedy, J.L.; et al. Association of functional variants in the dopamine D2-like receptors with risk for gambling behaviour in healthy Caucasian subjects. Biol. Psychol. 2010, 85, 33–37. [Google Scholar] [CrossRef] [PubMed]
- Raiha, S.; Yang, G.; Wang, L.; Dai, W.; Wu, H.; Meng, G.; Zhong, B.; Liu, X. Altered reward processing system in internet gaming disorder. Front. Psychiatry 2020, 11, 599141. [Google Scholar] [CrossRef]
- Hammond, D.; Wadsworth, E.; Reid, J.L.; Burkhalter, R. Prevalence and modes of cannabis use among youth in Canada, England, and the US, 2017 to 2019. Drug Alcohol Depend. 2021, 219, 108505. [Google Scholar] [CrossRef]
- Blum, K.; Gardner, E.; Oscar-Berman, M.; Gold, M. “Liking” and “wanting” linked to Reward Deficiency Syndrome (RDS): Hypothesizing differential responsivity in brain reward circuitry. Curr. Pharm. Des. 2012, 18, 113–118. [Google Scholar] [CrossRef] [PubMed]
- Dreber, A.; Hoffman, M. Biological Basis of Sex Differences in Risk Aversion and Competitiveness; Stockhom School of Economicsl: Stockholm, Sweden, 2010. [Google Scholar]
- Kuhnen, C.M.; Chiao, J.Y. Genetic determinants of financial risk taking. PLoS ONE 2009, 4, e4362. [Google Scholar] [CrossRef] [PubMed]
- Fiorillo, C.D.; Tobler, P.N.; Schultz, W. Evidence that the delay-period activity of dopamine neurons corresponds to reward uncertainty rather than backpropagating TD errors. Behav. Brain Funct. 2005, 1, 7. [Google Scholar] [CrossRef] [PubMed][Green Version]
- Alexander, W.H.; Fukunaga, R.; Finn, P.; Brown, J.W. Reward salience and risk aversion underlie differential ACC activity in substance dependence. NeuroImage Clin. 2015, 8, 59–71. [Google Scholar] [CrossRef]
- Brown, J.W.; Braver, T.S. Risk prediction and aversion by anterior cingulate cortex. Cogn. Affect. Behav. Neurosci. 2007, 7, 266–277. [Google Scholar] [CrossRef]
- Paulus, M.P.; Rogalsky, C.; Simmons, A.; Feinstein, J.S.; Stein, M.B. Increased activation in the right insula during risk-taking decision making is related to harm avoidance and neuroticism. Neuroimage 2003, 19, 1439–1448. [Google Scholar] [CrossRef]
- Kuhnen, C.M.; Knutson, B. The neural basis of financial risk taking. Neuron 2005, 47, 763–770. [Google Scholar] [CrossRef]
- Tsurumi, K.; Kawada, R.; Yokoyama, N.; Sugihara, G.; Sawamoto, N.; Aso, T.; Fukuyama, H.; Murai, T.; Takahashi, H. Insular activation during reward anticipation reflects duration of illness in abstinent pathological gamblers. Front. Psychol. 2014, 5, 1013. [Google Scholar] [CrossRef]
- Damasio, A.R. The somatic marker hypothesis and the possible functions of the prefrontal cortex. Philos. Trans. R. Soc. London. Ser. B Biol. Sci. 1996, 351, 1413–1420. [Google Scholar]
- Rudorf, S.; Preuschoff, K.; Weber, B. Neural correlates of anticipation risk reflect risk preferences. J. Neurosci. 2012, 32, 16683–16692. [Google Scholar] [CrossRef]
- Seo, D.; Lacadie, C.M.; Tuit, K.; Hong, K.I.; Constable, R.T.; Sinha, R. Disrupted ventromedial prefrontal function, alcohol craving, and subsequent relapse risk. JAMA Psychiatry 2013, 70, 727–739. [Google Scholar] [CrossRef]
- Knutson, B.; Fong, G.W.; Adams, C.M.; Varner, J.L.; Hommer, D. Dissociation of reward anticipation and outcome with event-related fMRI. Neuroreport 2001, 12, 3683–3687. [Google Scholar] [CrossRef]
- Salamone, J.D.; Correa, M. The mysterious motivational functions of mesolimbic dopamine. Neuron 2012, 76, 470–485. [Google Scholar] [CrossRef]
- Oldham, S.; Murawski, C.; Fornito, A.; Youssef, G.; Yücel, M.; Lorenzetti, V. The anticipation and outcome phases of reward and loss processing: A neuroimaging meta-analysis of the monetary incentive delay task. Hum. Brain Mapp. 2018, 39, 3398–3418. [Google Scholar] [CrossRef] [PubMed]
- Glazer, J.E.; Kelley, N.J.; Pornpattananangkul, N.; Mittal, V.A.; Nusslock, R. Beyond the FRN: Broadening the time-course of EEG and ERP components implicated in reward processing. Int. J. Psychophysiol. 2018, 132, 184–202. [Google Scholar] [CrossRef] [PubMed]
- Liu, X.; Wang, N.; Gu, L.; Guo, J.; Wang, J.; Luo, F. Reward processing under chronic pain from the perspective of “liking” and “wanting”: A narrative review. Pain Res. Manag. 2019, 2019, 6760121. [Google Scholar] [CrossRef] [PubMed]
- Zheng, Y.; Li, Q.; Zhang, Y.; Li, Q.; Shen, H.; Gao, Q.; Zhou, S. Reward processing in gain versus loss context: An ERP study. Psychophysiology 2017, 54, 1040–1053. [Google Scholar] [CrossRef]
- Yeung, N.; Botvinick, M.M.; Cohen, J.D. The neural basis of error detection: Conflict monitoring and the error-related negativity. Psychol. Rev. 2004, 111, 931. [Google Scholar] [CrossRef] [PubMed]
- Meadows, C.C.; Gable, P.A.; Lohse, K.R.; Miller, M.W. The effects of reward magnitude on reward processing: An averaged and single trial event-related potential study. Biol. Psychol. 2016, 118, 154–160. [Google Scholar] [CrossRef]
- Teti Mayer, J.; Compagne, C.; Nicolier, M.; Grandperrin, Y.; Chabin, T.; Giustiniani, J.; Haffen, E.; Bennabi, D.; Gabriel, D. Towards a functional neuromarker of impulsivity: Feedback-related brain potential during risky decision-making associated with self-reported impulsivity in a non-clinical sample. Brain Sci. 2021, 11, 671. [Google Scholar] [CrossRef]
- Hauser, T.U.; Iannaccone, R.; Stämpfli, P.; Drechsler, R.; Brandeis, D.; Walitza, S.; Brem, S. The feedback-related negativity (FRN) revisited: New insights into the localization, meaning and network organization. Neuroimage 2014, 84, 159–168. [Google Scholar] [CrossRef] [PubMed]
- Hajcak, G.; Moser, J.S.; Holroyd, C.B.; Simons, R.F. The feedback-related negativity reflects the binary evaluation of good versus bad outcomes. Biol. Psychol. 2006, 71, 148–154. [Google Scholar] [CrossRef] [PubMed]
- Holroyd, C.B.; Coles, M.G. The neural basis of human error processing: Reinforcement learning, dopamine, and the error-related negativity. Psychol. Rev. 2002, 109, 679. [Google Scholar] [CrossRef] [PubMed]
- Glimcher, P.W. Understanding dopamine and reinforcement learning: The dopamine reward prediction error hypothesis. Proc. Natl. Acad. Sci. USA 2011, 108 (Suppl. S3), 15647–15654. [Google Scholar] [CrossRef] [PubMed]
- Garrido-Chaves, R.; Perez-Alarcón, M.; Perez, V.; Hidalgo, V.; Pulopulos, M.M.; Salvador, A. FRN and P3 during the Iowa gambling task: The importance of gender. Psychophysiology 2021, 58, e13734. [Google Scholar] [CrossRef]
- Kotani, Y.; Kishida, S.; Hiraku, S.; Suda, K.; Ishii, M.; Aihara, Y. Effects of information and reward on stimulus-preceding negativity prior to feedback stimuli. Psychophysiology 2003, 40, 818–826. [Google Scholar] [CrossRef]
- Brunia, C.H.; Hackley, S.A.; van Boxtel, G.J.; Kotani, Y.; Ohgami, Y. Waiting to perceive: Reward or punishment? Clin. Neurophysiol. 2011, 122, 858–868. [Google Scholar] [CrossRef]
- Hackley, S.A.; Hirao, T.; Onoda, K.; Ogawa, K.; Masaki, H. Anterior insula activity and the effect of agency on the Stimulus-Preceding Negativity. Psychophysiology 2020, 57, e13519. [Google Scholar] [CrossRef]
- Ohgami, Y.; Kotani, Y.; Yoshida, N.; Kunimatsu, A.; Kiryu, S.; Inoue, Y. Voice, rhythm, and beep stimuli differently affect the right hemisphere preponderance and components of stimulus-preceding negativity. Biol. Psychol. 2021, 160, 108048. [Google Scholar] [CrossRef]
- Deng, L.; Li, Q.; Zhang, M.; Shi, P.; Zheng, Y. Distinct neural dynamics underlying risk and ambiguity during valued-based decision making. Psychophysiology 2023, 60, e14201. [Google Scholar] [CrossRef]
- Kotani, Y.; Ohgami, Y.; Tsukamoto, T.; Inoue, Y. The Right hemisphere preponderance during expectation of feedback information as reward. In Psychophysiology; Commerce Place, 350 Main ST; Wiley-Blackwell Publishing, Inc.: Malden, MA, USA, 2009; Volume 46, p. S7. [Google Scholar]
- Nazari, M.A.; Naghel, S.; Valessi, A.; KhosroAbadi, R. Comparison of p300 in risk-seeker and risk-averse people during simple gambling task. Kharazmi J. Cogn. Psychol. 2023, 10, 1–18. [Google Scholar]
- Polezzi, D.; Sartori, G.; Rumiati, R.; Vidotto, G.; Daum, I. Brain correlates of risky decision-making. Neuroimage 2010, 49, 1886–1894. [Google Scholar] [CrossRef] [PubMed]
- Zheng, Y.; Liu, X. Blunted neural responses to monetary risk in high sensation seekers. Neuropsychologia 2015, 71, 173–180. [Google Scholar] [CrossRef] [PubMed]
- Lejuez, C.W.; Read, J.P.; Kahler, C.W.; Richards, J.B.; Ramsey, S.E.; Stuart, G.L.; Strong, D.R.; Brown, R.A. Evaluation of a behavioral measure of risk taking: The Balloon Analogue Risk Task (BART). J. Exp. Psychol. Appl. 2002, 8, 75. [Google Scholar] [CrossRef] [PubMed]
- Nasri, S.; Nazari, M.A.; Maiqani, E.; Shahrokhi, H.; Goodarzi, I. Risk-taking and behavioral inhibition interaction in ADHD-with and without conduct disorder-compared with control children. Shenakht J. Psychol. Psychiatry 2018, 5, 63–77. [Google Scholar] [CrossRef]
- Delorme, A.; Makeig, S. EEGLAB: An open-source toolbox for analysis of single-trial EEG dynamics including independent component analysis. J. Neurosci. Methods 2004, 134, 9–21. [Google Scholar] [CrossRef]
- Lopez-Calderon, J.; Luck, S.J. ERPLAB: An open-source toolbox for the analysis of event-related potentials. Front. Hum. Neurosci. 2014, 8, 213. [Google Scholar] [CrossRef]
- Jung, T.P.; Makeig, S.; Westerfield, M.; Townsend, J.; Courchesne, E.; Sejnowski, T.J. Analysis and visualization of single-trial event-related potentials. Human Brain Mapp. 2001, 14, 166–185. [Google Scholar] [CrossRef]
- Böcker, K.B.; Brunia, C.H.; van den Berg-Lenssen, M.M. A spatiotemporal dipole model of the stimulus preceding negativity (SPN) prior to feedback stimuli. Brain Topogr. 1994, 7, 71–88. [Google Scholar] [CrossRef]
- Morís, J.; Luque, D.; Rodríguez-Fornells, A. Learning-induced modulations of the stimulus-preceding negativity. Psychophysiology 2013, 50, 931–939. [Google Scholar] [CrossRef]
- Kotani, Y.; Ohgami, Y.; Yoshida, N.; Kiryu, S.; Inoue, Y. Anticipation process of the human brain measured by stimulus-preceding negativity (SPN). J. Phys. Fit. Sports Med. 2017, 6, 7–14. [Google Scholar] [CrossRef]
- Lee, R.S.; Mattar, M.G.; Parker, N.F.; Witten, I.B.; Daw, N.D. Reward prediction error does not explain movement selectivity in DMS-projecting dopamine neurons. Elife 2019, 8, e42992. [Google Scholar] [CrossRef] [PubMed]
- Paulsen, D.J.; Carter, R.M.; Platt, M.L.; Huettel, S.A.; Brannon, E.M. Neurocognitive development of risk aversion from early childhood to adulthood. Front. Hum. Neurosci. 2012, 5, 178. [Google Scholar] [CrossRef] [PubMed]
- Simmons, A.N.; Stein, M.B.; Strigo, I.A.; Arce, E.; Hitchcock, C.; Paulus, M.P. Anxiety positive subjects show altered processing in the anterior insula during anticipation of negative stimuli. Hum. Brain Mapp. 2011, 32, 1836–1846. [Google Scholar] [CrossRef] [PubMed]
- Tanovic, E.; Joormann, J. Anticipating the unknown: The stimulus-preceding negativity is enhanced by uncertain threat. Int. J. Psychophysiol. 2019, 139, 68–73. [Google Scholar] [CrossRef]
- Carleton, R.N. Fear of the unknown: One fear to rule them all? J. Anxiety Disord. 2016, 41, 5–21. [Google Scholar] [CrossRef]
- Maner, J.K.; Schmidt, N.B. The role of risk avoidance in anxiety. Behav. Ther. 2006, 37, 181–189. [Google Scholar] [CrossRef]
- Lorian, C.N.; Grisham, J.R. The safety bias: Risk-avoidance and social anxiety pathology. Behav. Chang. 2010, 27, 29–41. [Google Scholar] [CrossRef]
- Lorian, C.N.; Grisham, J.R. Clinical implications of risk aversion: An online study of risk-avoidance and treatment utilization in pathological anxiety. J. Anxiety Disord. 2011, 25, 840–848. [Google Scholar] [CrossRef]
- Paulus, M.P.; Stein, M.B. An insular view of anxiety. Biol. Psychiatry 2006, 60, 383–387. [Google Scholar] [CrossRef]
- Alvarez, R.P.; Kirlic, N.; Misaki, M.; Bodurka, J.; Rhudy, J.L.; Paulus, M.P.; Drevets, W.C. Increased anterior insula activity in anxious individuals is linked to diminished perceived control. Transl. Psychiatry 2015, 5, e591. [Google Scholar] [CrossRef]
- Mattox, S.T.; Valle-Inclán, F.; Hackley, S.A. Psychophysiological evidence for impaired reward anticipation in Parkinson’s disease. Clin. Neurophysiol. 2006, 117, 2144–2153. [Google Scholar] [CrossRef]
- Poli, S.; Sarlo, M.; Bortoletto, M.; Buodo, G.; Palomba, D. Stimulus-preceding negativity and heart rate changes in anticipation of affective pictures. Int. J. Psychophysiol. 2007, 65, 32–39. [Google Scholar] [CrossRef] [PubMed]
- Sambrook, T.D.; Goslin, J. A neural reward prediction error revealed by a meta-analysis of ERPs using great grand averages. Psychol. Bull. 2015, 141, 213. [Google Scholar] [CrossRef] [PubMed]
- Proudfit, G.H. The reward positivity: From basic research on reward to a biomarker for depression. Psychophysiology 2015, 52, 449–459. [Google Scholar] [CrossRef] [PubMed]
- Walentowska, W.; Severo, M.C.; Moors, A.; Pourtois, G. When the outcome is different than expected: Subjective expectancy shapes reward prediction error at the FRN level. Psychophysiology 2019, 56, e13456. [Google Scholar] [CrossRef]
- Gehring, W.J.; Willoughby, A.R. The medial frontal cortex and the rapid processing of monetary gains and losses. Science 2002, 295, 2279–2282. [Google Scholar] [CrossRef]
- Kujawa, A.; Smith, E.; Luhmann, C.; Hajcak, G. The feedback negativity reflects favorable compared to nonfavorable outcomes based on global, not local, alternatives. Psychophysiology 2013, 50, 134–138. [Google Scholar] [CrossRef] [PubMed]
- Schuermann, B.; Endrass, T.; Kathmann, N. Neural correlates of feedback processing in decision-making under risk. Front. Hum. Neurosci. 2012, 6, 204. [Google Scholar] [CrossRef]
- Braem, S.; King, J.A.; Korb, F.M.; Krebs, R.M.; Notebaert, W.; Egner, T. The role of anterior cingulate cortex in the affective evaluation of conflict. J. Cogn. Neurosci. 2017, 29, 137–149. [Google Scholar] [CrossRef]
- Brown, J.W.; Alexander, W.H. Foraging value, risk avoidance, and multiple control signals: How the anterior cingulate cortex controls value-based decision-making. J. Cogn. Neurosci. 2017, 29, 1656–1673. [Google Scholar] [CrossRef] [PubMed]


| Feedback Target | Chosen Card | Condition | |
|---|---|---|---|
| 100 | 500 | 100 | +100 Gain and correct |
| 500 | −500 Lose and error | ||
| 100 | 500 | 100 | −100 Lose and error |
| 500 | +500 Gain and correct | ||
| 100 | 500 | 100 | +100 Gain and error |
| 500 | +500 Gain and correct | ||
| 100 | 500 | 100 | −100 Lose and correct |
| 500 | −500 Lose and error | ||
| Risk-Seeker | Risk-Averse | p Value | |
|---|---|---|---|
| Gender (M/F) | 5/9 | 4/10 | |
| Age | 28.7 ± 7.6 | 28.5 ± 6.7 | 0.917 |
| BART (adjusted value) | 67.35 ± 10.4 | 14.55 ± 4.47 | 0.001 |
| Gambling task performance: | |||
| % Low-risk choice (100) | 36.56 ± 10.4 | 45.74 ± 12.2 | 0.041 |
| % High-risk choice (500) | 60.29 ± 10.1 | 54.12 ± 4.6 | 0.049 |
| Reaction time for 100 | 703.6 ± 116.8 | 702.2 ± 156.6 | 0.978 |
| Reaction time for 500 | 660.9 ± 120.9 | 629 ± 121.10 | 0.491 |
| Barratt impulsiveness scale | |||
| Attentional impulsiveness | 20.72 ± 3.25 | 22.07 ± 3.2 | 0.211 |
| Motor impulsiveness | 18.07 ± 3.6 | 19.92 ± 3.9 | 0.603 |
| Non-planing impulsiveness | 21.57 ± 4.12 | 22.35 ± 3.75 | 0.400 |
| Total Barratt score | 22.64 ± 4.78 | 24 ± 3.5 | 0.285 |
Disclaimer/Publisher’s Note: The statements, opinions and data contained in all publications are solely those of the individual author(s) and contributor(s) and not of MDPI and/or the editor(s). MDPI and/or the editor(s) disclaim responsibility for any injury to people or property resulting from any ideas, methods, instructions or products referred to in the content. |
© 2023 by the authors. Licensee MDPI, Basel, Switzerland. This article is an open access article distributed under the terms and conditions of the Creative Commons Attribution (CC BY) license (https://creativecommons.org/licenses/by/4.0/).
Share and Cite
Naghel, S.; Vallesi, A.; Sabouri Moghadam, H.; Nazari, M.A. Neural Differences in Relation to Risk Preferences during Reward Processing: An Event-Related Potential Study. Brain Sci. 2023, 13, 1235. https://doi.org/10.3390/brainsci13091235
Naghel S, Vallesi A, Sabouri Moghadam H, Nazari MA. Neural Differences in Relation to Risk Preferences during Reward Processing: An Event-Related Potential Study. Brain Sciences. 2023; 13(9):1235. https://doi.org/10.3390/brainsci13091235
Chicago/Turabian StyleNaghel, Sedigheh, Antonino Vallesi, Hassan Sabouri Moghadam, and Mohammad Ali Nazari. 2023. "Neural Differences in Relation to Risk Preferences during Reward Processing: An Event-Related Potential Study" Brain Sciences 13, no. 9: 1235. https://doi.org/10.3390/brainsci13091235
APA StyleNaghel, S., Vallesi, A., Sabouri Moghadam, H., & Nazari, M. A. (2023). Neural Differences in Relation to Risk Preferences during Reward Processing: An Event-Related Potential Study. Brain Sciences, 13(9), 1235. https://doi.org/10.3390/brainsci13091235