
How Sample Size Impacts Probabilistic Stimulation Maps in Deep Brain Stimulation


Abstract
1. Introduction
2. Materials and Methods
2.1. Clinical Data
2.2. Electric Field Simulations
2.3. Image Normalization
2.4. Probabilistic Stimulation Maps
2.5. Evaluation of Sample Size
2.6. Data Analysis
3. Results
4. Discussion
5. Conclusions
Author Contributions
Funding
Institutional Review Board Statement
Informed Consent Statement
Data Availability Statement
Acknowledgments
Conflicts of Interest
References
- Lozano, A.M.; Lipsman, N.; Bergman, H.; Brown, P.; Chabardes, S.; Chang, J.W.; Matthews, K.; McIntyre, C.C.; Schlaepfer, T.E.; Schulder, M.; et al. Deep brain stimulation: Current challenges and future directions. Nat. Rev. Neurol. 2019, 15, 148–160. [Google Scholar] [CrossRef] [PubMed]
- Shah, A.; Vogel, D.; Alonso, F.; Lemaire, J.-J.; Pison, D.; Coste, J.; Wårdell, K.; Schkommodau, E.; Hemm, S. Stimulation maps: Visualization of results of quantitative intraoperative testing for deep brain stimulation surgery. Med. Biol. Eng. Comput. 2020, 58, 771–784. [Google Scholar] [CrossRef] [PubMed]
- Nordin, T.; Vogel, D.; Osterlund, E.; Johansson, J.; Blomstedt, P.; Fytagoridis, A.; Hemm, S.; Wardell, K. Probabilistic maps for deep brain stimulation—Impact of methodological differences. Brain Stimul. 2022, 15, 1139–1152. [Google Scholar] [CrossRef] [PubMed]
- Dembek, T.A.; Barbe, M.T.; Åström, M.; Hoevels, M.; Visser-Vandewalle, V.; Fink, G.R.; Timmermann, L. Probabilistic map-ping of deep brain stimulation effects in essential tremor. NeuroImage Clin. 2017, 13, 164–173. [Google Scholar] [CrossRef] [PubMed]
- Elias, G.J.B.; Boutet, A.; Joel, S.E.; Germann, J.; Gwun, D.; Neudorfer, C.; Gramer, R.M.; Algarni, M.; Paramanandam, V.; Prasad, S.; et al. Probabilistic Mapping of Deep Brain Stimulation: Insights from 15 Years of Therapy. Ann. Neurol. 2021, 89, 426–443. [Google Scholar] [CrossRef]
- Wårdell, K.; Nordin, T.; Vogel, D.; Zsigmond, P.; Westin, C.-F.; Hariz, M.; Hemm, S. Deep Brain Stimulation: Emerging Tools for Simulation, Data Analysis, and Visualization. Front. Neurosci. 2022, 16, 834026. [Google Scholar] [CrossRef]
- Eisenstein, S.A.; Koller, J.M.; Black, K.D.; Campbell, M.C.; Lugar, H.M.; Ushe, M.; Tabbal, S.D.; Karimi, M.; Hershey, T.; Perlmutter, J.S.; et al. Functional anatomy of subthalamic nucleus stimulation in Parkinson disease. Ann. Neurol. 2014, 76, 279–295. [Google Scholar] [CrossRef]
- Dembek, T.A.; Roediger, J.; Horn, A.; Reker, P.; Oehrn, C.; Dafsari, H.S.; Li, N.; Kuhn, A.A.; Fink, G.R.; Visser-Vandewalle, V.; et al. Probabilistic sweet spots predict motor outcome for deep brain stimulation in Parkinson disease. Ann. Neurol. 2019, 86, 527–538. [Google Scholar] [CrossRef]
- Akram, H.; Sotiropoulos, S.N.; Jbabdi, S.; Georgiev, D.; Mahlknecht, P.; Hyam, J.; Foltynie, T.; Limousin, P.; De Vita, E.; Jahanshahi, M.; et al. Subthalamic deep brain stimulation sweet spots and hyperdirect cortical connectivity in Parkinson’s disease. NeuroImage 2017, 158, 332–345. [Google Scholar] [CrossRef]
- Nowacki, A.; Schober, M.; Nader, L.; Saryyeva, A.; Nguyen, T.-A.K.; Green, A.L.; Pollo, C.; Krauss, J.K.; Fontaine, D.; Aziz, T.Z. Deep Brain Stimulation for Chronic Cluster Headache: Meta-Analysis of Individual Patient Data. Ann. Neurol. 2020, 88, 956–969. [Google Scholar] [CrossRef]
- Nguyen, T.A.K.; Nowacki, A.; Debove, I.; Petermann, K.; Tinkhauser, G.; Wiest, R.; Schüpbach, M.; Krack, P.; Pollo, C. Direc-tional stimulation of subthalamic nucleus sweet spot predicts clinical efficacy: Proof of concept. Brain Stimul. 2019, 12, 1127–1134. [Google Scholar] [CrossRef]
- Persson, R.S.; Nordin, T.; Hariz, G.-M.; Wårdell, K.; Forsgren, L.; Hariz, M.; Blomstedt, P. Deep Brain Stimulation of Caudal Zona Incerta for Parkinson’s Disease: One-Year Follow-Up and Electric Field Simulations. Neuromodulation Technol. Neural Interface 2021, 25, 935–944. [Google Scholar] [CrossRef]
- Kübler, D.; Kroneberg, D.; Al-Fatly, B.; Schneider, G.-H.; Ewert, S.; van Riesen, C.; Gruber, D.; Ebersbach, G.; Kühn, A.A. Determining an efficient deep brain stimulation target in essential tremor—Cohort study and review of the literature. Park. Relat. Disord. 2021, 89, 54–62. [Google Scholar] [CrossRef]
- Akbarian-Tefaghi, L.; Akram, H.; Johansson, J.; Zrinzo, L.; Kefalopoulou, Z.; Limousin, P.; Joyce, E.; Hariz, M.; Wårdell, K.; Foltynie, T. Refining the Deep Brain Stimulation Target within the Limbic Globus Pallidus Internus for Tourette Syndrome. Stereotact. Funct. Neurosurg. 2017, 95, 251–258. [Google Scholar] [CrossRef]
- Reich, M.M.; Horn, A.; Lange, F.; Roothans, J.; Paschen, S.; Runge, J.; Wodarg, F.; Pozzi, N.G.; Witt, K.; Nickl, R.C.; et al. Probabilistic mapping of the antidystonic effect of pallidal neurostimulation: A multicentre imaging study. Brain 2019, 142, 1386–1398. [Google Scholar] [CrossRef]
- Nowacki, A.; Barlatey, S.; Al-Fatly, B.; Dembek, T.; Bot, M.; Green, A.L.; Kubler, D.; Lachenmayer, M.L.; Debove, I.; Se-gura-Amil, A.; et al. Probabilistic Mapping Reveals Optimal Stimulation Site in Essential Tremor. Ann. Neurol. 2022, 91, 602–612. [Google Scholar] [CrossRef]
- Blomstedt, P.; Sandvik, U.; Tisch, S. Deep brain stimulation in the posterior subthalamic area in the treatment of essential tremor. Mov. Disord. 2010, 25, 1350–1356. [Google Scholar] [CrossRef]
- Fahn, S.; Tolosa, E.; Marín, C. Clinical rating scale for tremor. In Parkinson’s Disease and Movement Disorders; Jankovic, J., Tolo-sa, E., Eds.; Urban and Schwarzenberg Baltimore: Münich, Germany, 1988; Volume 2, pp. 225–234. [Google Scholar]
- Åström, M.; Zrinzo, L.U.; Tisch, S.; Tripoliti, E.; Hariz, M.I.; Wårdell, K. Method for patient-specific finite element modeling and simulation of deep brain stimulation. Med. Biol. Eng. Comput. 2009, 47, 21–28. [Google Scholar] [CrossRef]
- Alonso, F.; Hemm-Ode, S.; Wårdell, K. Influence on Deep Brain Stimulation from Lead Design, Operating Mode and Tissue Impedance Changes—A Simulation Study. Brain Disord. Ther. 2015, 4, 169. [Google Scholar] [CrossRef]
- Fonov, V.; Evans, A.C.; Botteron, K.; Almli, C.R.; McKinstry, R.C.; Collins, D.L. Unbiased average age-appropriate atlases for pediatric studies. NeuroImage 2011, 54, 313–327. [Google Scholar] [CrossRef]
- Morel, A. Stereotactic Atlas of the Human Thalamus and Basal Ganglia; CRC Press: Boca Raton, FL, USA, 2007. [Google Scholar]
- Jakab, A.; Blanc, R.; Berényi, E.L.; Székely, G. Generation of Individualized Thalamus Target Maps by Using Statistical Shape Models and Thalamocortical Tractography. Am. J. Neuroradiol. 2012, 33, 2110. [Google Scholar] [CrossRef] [PubMed]
- Nichols, T.E.; Holmes, A.P. Nonparametric permutation tests for functional neuroimaging: A primer with examples. Hum. Brain Mapp. 2002, 15, 1–25. [Google Scholar] [CrossRef] [PubMed]
- Wichmann, T.; DeLong, M.R. Deep Brain Stimulation for Movement Disorders of Basal Ganglia Origin: Restoring Function or Functionality? Neurotherapeutics 2016, 13, 264–283. [Google Scholar] [CrossRef] [PubMed]


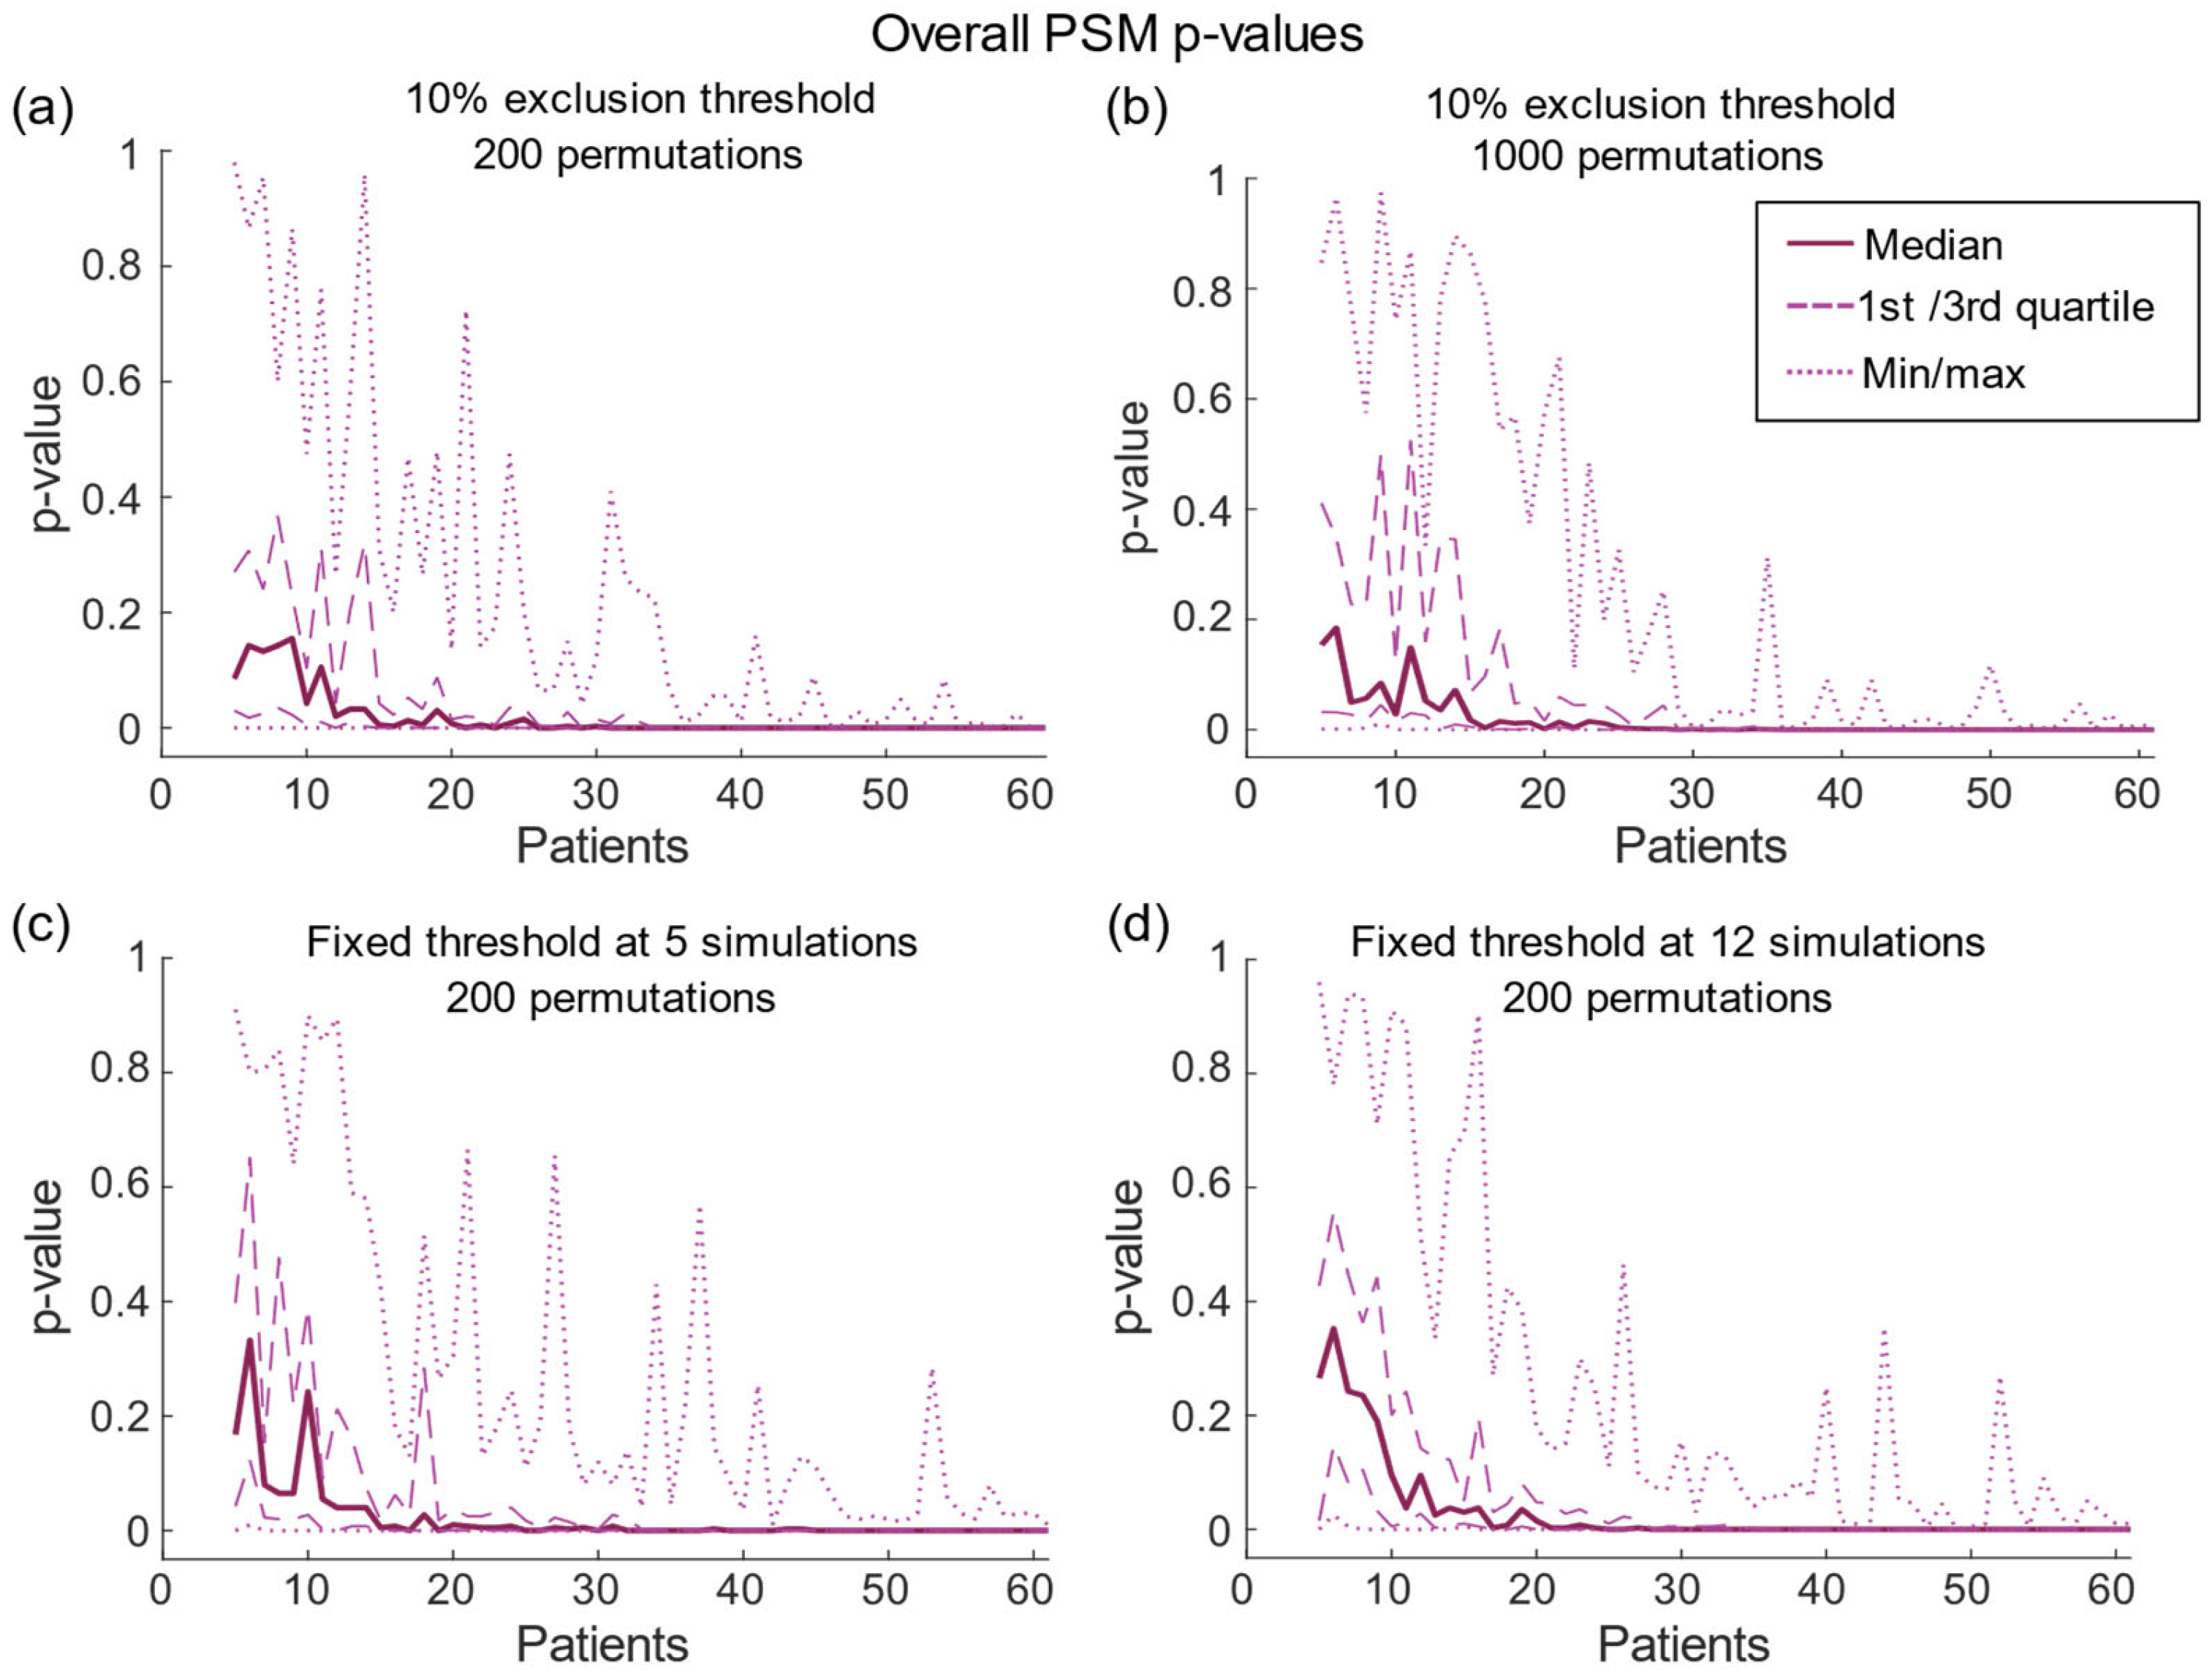
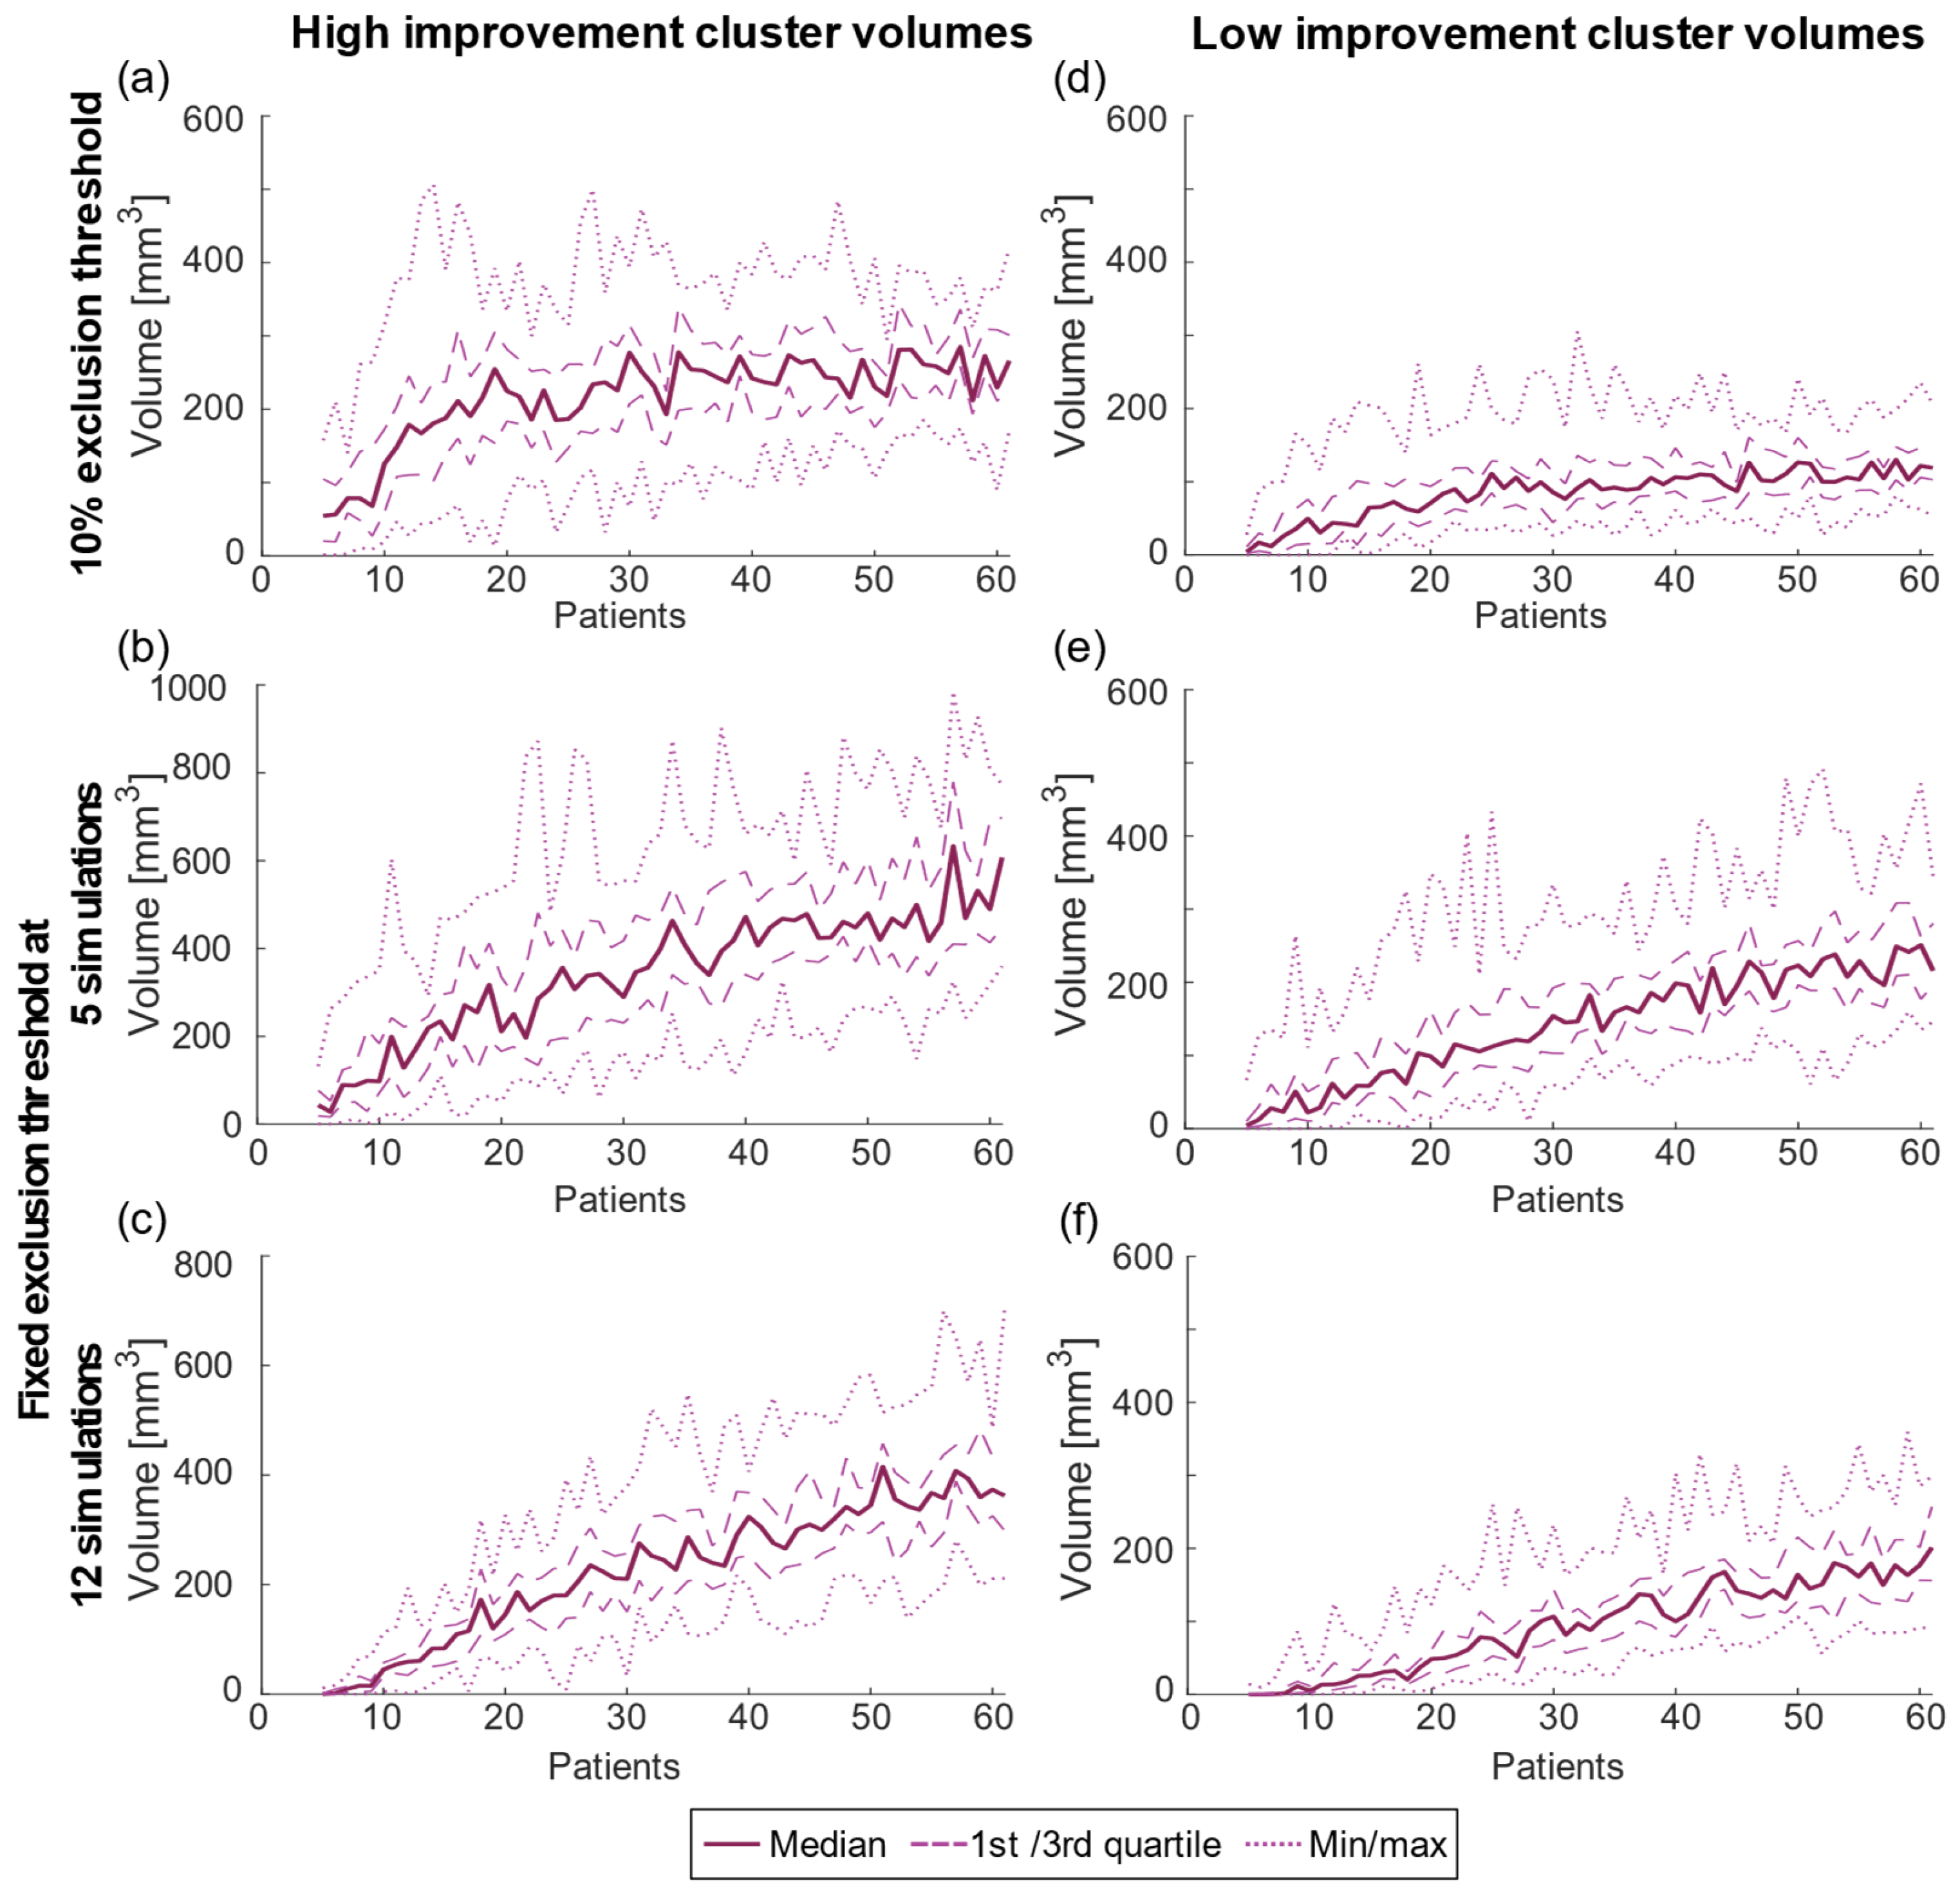
| 10% Threshold | Fixed Threshold of 5 | Fixed Threshold of 12 | |
|---|---|---|---|
| High improvement | |||
| Median volume [mm3] | |||
| n = 5 | 54 | 44 | 0.3 |
| n = 30 | 277 | 290 | 227 |
| n = 60 | 229 | 490 | 373 |
| IQR [mm3] | 96 ± 24 | 187 ± 64 | 94 ± 43 |
| Low improvement | |||
| Median volume [mm3] | |||
| n = 5 | 3.9 | 4.1 | 0 |
| n = 30 | 89 | 154 | 107 |
| n = 60 | 121 | 251 | 177 |
| IQR [mm3] | 51 ± 14 | 75 ± 22 | 50 ± 26 |
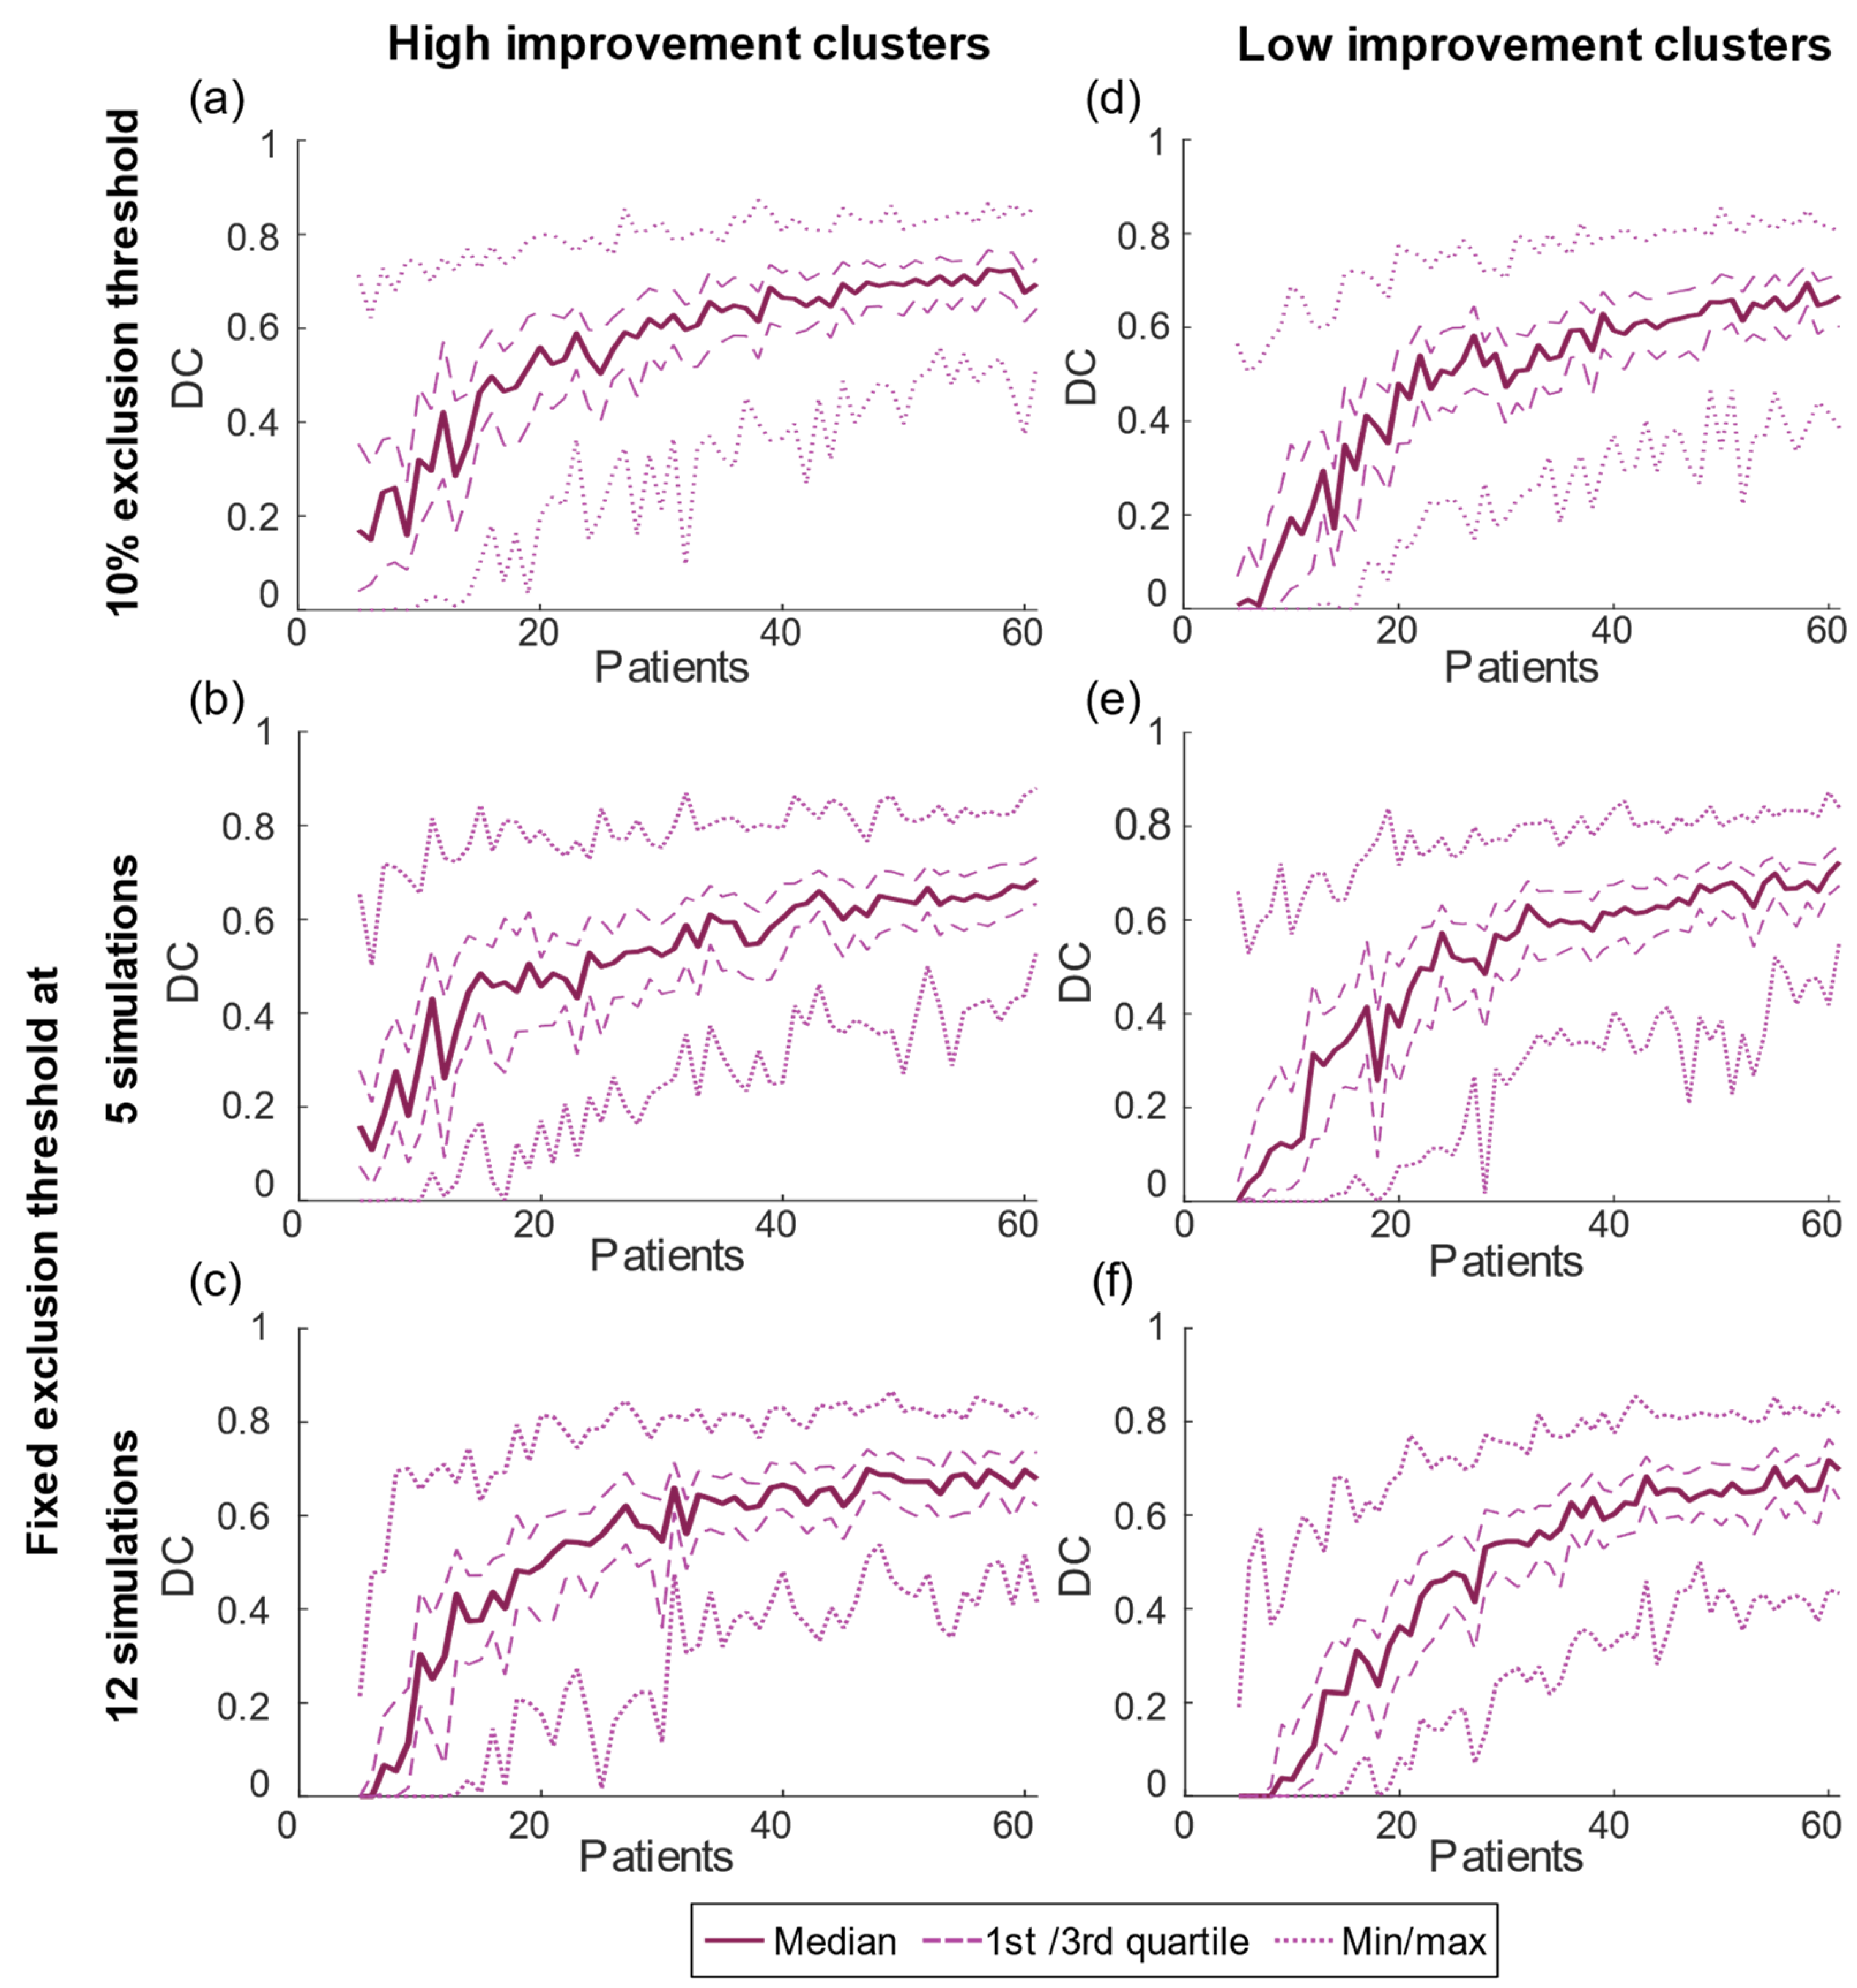
| 10% Threshold | Fixed Threshold of 5 | Fixed Threshold of 12 | |
|---|---|---|---|
| High improvement | |||
| DC max | 0.73 (n = 57) | 0.68 (n = 61) | 0.70 (n = 47) |
| IQR | 0.16 ± 0.06 | 0.17 ± 0.06 | 0.15 ± 0.06 |
| Low improvement | |||
| DC max | 0.69 (n = 58) | 0.72 (n = 61) | 0.72 (n = 60) |
| IQR | 0.15 ± 0.05 | 0.15 ± 0.06 | 0.13 ± 0.06 |
Disclaimer/Publisher’s Note: The statements, opinions and data contained in all publications are solely those of the individual author(s) and contributor(s) and not of MDPI and/or the editor(s). MDPI and/or the editor(s) disclaim responsibility for any injury to people or property resulting from any ideas, methods, instructions or products referred to in the content. |
© 2023 by the authors. Licensee MDPI, Basel, Switzerland. This article is an open access article distributed under the terms and conditions of the Creative Commons Attribution (CC BY) license (https://creativecommons.org/licenses/by/4.0/).
Share and Cite
Nordin, T.; Blomstedt, P.; Hemm, S.; Wårdell, K. How Sample Size Impacts Probabilistic Stimulation Maps in Deep Brain Stimulation. Brain Sci. 2023, 13, 756. https://doi.org/10.3390/brainsci13050756
Nordin T, Blomstedt P, Hemm S, Wårdell K. How Sample Size Impacts Probabilistic Stimulation Maps in Deep Brain Stimulation. Brain Sciences. 2023; 13(5):756. https://doi.org/10.3390/brainsci13050756
Chicago/Turabian StyleNordin, Teresa, Patric Blomstedt, Simone Hemm, and Karin Wårdell. 2023. "How Sample Size Impacts Probabilistic Stimulation Maps in Deep Brain Stimulation" Brain Sciences 13, no. 5: 756. https://doi.org/10.3390/brainsci13050756
APA StyleNordin, T., Blomstedt, P., Hemm, S., & Wårdell, K. (2023). How Sample Size Impacts Probabilistic Stimulation Maps in Deep Brain Stimulation. Brain Sciences, 13(5), 756. https://doi.org/10.3390/brainsci13050756