
The Reliability and Validity of Speech-Language Pathologists’ Estimations of Intelligibility in Dysarthria


Abstract
:1. Introduction
1.1. Subjective Ratings of Speech Intelligibility
1.2. Predicting Naïve Listeners’ Perceptions of Speech
1.3. Current Study
2. Methods
2.1. Participants
2.1.1. Listeners
2.1.2. Speakers and Speech Stimuli
2.2. Procedures
2.2.1. Naïve Listener Procedure
2.2.2. SLP Listener Procedure
2.3. Measures and Data Preparation
2.4. Statistical Analysis
3. Results
3.1. Research Question 1
3.2. Research Question 2
3.3. Research Question 3
4. Discussion
4.1. Percent Estimations vs. VAS Ratings of Intelligibility
4.2. Predicting Orthographic Transcriptions Using Subjective Measures of Intelligibility
5. Clinical Implications
6. Limitations and Future Directions
7. Conclusions
Author Contributions
Funding
Institutional Review Board Statement
Informed Consent Statement
Data Availability Statement
Acknowledgments
Conflicts of Interest
References
- Yorkston, K.M.; Dowden, P.A.; Beukelman, D.R. Intelligibility measurement as a tool in the clinical management of dysarthric speakers. In Intelligibility in Speech Disorders: Theory, Measurement, and Management; Kent, R.D., Ed.; John Benjamins Publishing: Amsterdam, The Netherlands, 1992; pp. 265–285. [Google Scholar]
- Kent, R.D.; Weismer, G.; Kent, J.F.; Rosenbek, J.C. Toward phonetic intelligibility testing in dysarthria. J. Speech Hear. Disord. 1989, 54, 482–499. [Google Scholar] [CrossRef] [PubMed]
- Stipancic, K.L.; Palmer, K.M.; Rowe, H.P.; Yunusova, Y.; Berry, J.D.; Green, J.R. “You say severe, I say mild”: Toward an empirical classification of dysarthria severity. J. Speech Lang. Hear. Res. 2021, 64, 4718–4735. [Google Scholar] [CrossRef] [PubMed]
- Walshe, M.; Miller, N.; Leahy, M.; Murray, A. Intelligibility of dysarthric speech: Perceptions of speakers and listeners. Int. J. Lang. Commun. Disord. 2008, 43, 633–648. [Google Scholar] [CrossRef] [PubMed]
- American Speech-Language-Hearing Association. Dysarthria in Adults. Available online: https://www.asha.org/practice-portal/clinical-topics/dysarthria-in-adults/#collapse_5 (accessed on 29 June 2022).
- American Speech-Language-Hearing Association. Overview of Documentation for Medicare Outpatient Therapy Services. Available online: https://www.asha.org/practice/reimbursement/medicare/medicare_documentation/ (accessed on 29 June 2022).
- Yorkston, K.M.; Beukelman, D.R.; Traynor, C. Assessment of Intelliigbility of Dysarthric Speech; Pro-Ed: Austin, TX, USA, 1984. [Google Scholar]
- Dorsey, M.; Yorkston, K.; Beukelman, D.; Hakel, M. Speech Intelligibility Test for Windows; Institute for Rehabilitation Science and Engineering at Madonna Rehabilitation Hospital: Lincoln, NE, USA, 2007. [Google Scholar]
- Gurevich, N.; Scamihorn, S.L. Speech-language pathologists’ use of intelligibility measures in adults with dysarthria. Am. J. Speech-Lang. Pathol. 2017, 26, 873–892. [Google Scholar] [CrossRef]
- King, J.M.; Watson, M.; Lof, G.L. Practice patterns of speech-language pathologists assessing intelligibility of dysarthric speech. J. Med. Speech-Lang. Pathol. 2012, 20, 1–10. [Google Scholar]
- Yorkston, K.M.; Beukelman, D.R. A comparison of techniques for measuring intelligibility of dysarthric speech. J. Commun. Disord. 1978, 11, 499–512. [Google Scholar] [CrossRef]
- Hustad, K.C. Estimating the intelligibility of speakers with dysarthria. Folia Phoniatr. Logop. 2006, 58, 217–228. [Google Scholar] [CrossRef] [PubMed]
- Fletcher, A.R.; McAuliffe, M.J.; Lansford, K.L.; Sinex, D.G.; Liss, J.M. Predicting intelligibility gains in individuals with dysarthria from baseline speech features. J. Speech Lang. Hear. Res. 2017, 60, 3043–3057. [Google Scholar] [CrossRef] [PubMed]
- Fletcher, A.R.; Wisler, A.A.; McAuliffe, M.J.; Lansford, K.L.; Liss, J.M. Predicting intelligibility gains in dysarthria through automated speech feature analysis. J. Speech Lang. Hear. Res. 2017, 60, 3058–3068. [Google Scholar] [CrossRef] [PubMed]
- Tjaden, K.; Sussman, J.E.; Wilding, G.E. Impact of clear, loud, and slow speech on scaled intelligibility and speech severity in Parkinson’s disease and multiple sclerosis. J. Speech Lang. Hear. Res. 2014, 57, 779–792. [Google Scholar] [CrossRef] [Green Version]
- Stipancic, K.L.; Tjaden, K.; Wilding, G. Comparison of intelligibility measures for adults with Parkinson’s disease, adults with multiple sclerosis, and healthy controls. J. Speech Lang. Hear. Res. 2016, 59, 230–238. [Google Scholar] [CrossRef] [PubMed] [Green Version]
- Abur, D.; Enos, N.M.; Stepp, C.E. Visual analog scale ratings and orthographic transcription measures of sentence intelligibility in Parkinson’s disease with variable listener exposure. Am. J. Speech-Lang. Pathol. 2019, 28, 1222–1232. [Google Scholar] [CrossRef] [PubMed]
- Adams, S.G.; Dykstra, A.; Jenkins, M.; Jog, M. Speech-to-noise levels and conversational intelligibility in hypophonia and parkinson’s disease. J. Med. Speech-Lang. Pathol. 2008, 16, 165–172. [Google Scholar]
- Miller, N. Measuring up to speech intelligibility. Int. J. Lang. Commun. Disord. 2013, 48, 601–612. [Google Scholar] [CrossRef]
- D’Innocenzo, J.; Tjaden, K.; Greenman, G. Intelligibility in dysarthria: Effects of listener familiarity and speaking condition. Clin. Linguist. Phon. 2006, 20, 659–675. [Google Scholar] [CrossRef] [PubMed]
- Hirsch, M.E.; Lansford, K.L.; Barrett, T.S.; Borrie, S.A. Generalized learning of dysarthric speech between male and female talkers. J. Speech Lang. Hear. Res. 2021, 64, 444–451. [Google Scholar] [CrossRef] [PubMed]
- Borrie, S.A.; Lansford, K.L.; Barrett, T.S. Generalized adaptation to dysarthric speech. J. Speech Lang. Hear. Res. 2017, 60, 3110–3117. [Google Scholar] [CrossRef] [PubMed] [Green Version]
- Borrie, S.A.; Lansford, K.L.; Barrett, T.S. A clinical advantage: Experience informs recognition and adaptation to a novel talker with dysarthria. J. Speech Lang. Hear. Res. 2021, 64, 1503–1514. [Google Scholar] [CrossRef] [PubMed]
- Dagenais, P.A.; Watts, C.R.; Turnage, L.M.; Kennedy, S. Intelligibility and acceptability of moderately dysarthric speech by three types of listeners. J. Med. Speech-Lang. Pathol. 1999, 7, 91–95. [Google Scholar]
- Lansford, K.L.; Liss, J.M.; Norton, R.E. Free-classification of perceptually similar speakers with dysarthria. J. Speech Lang. Hear. Res. 2014, 57, 2051–2064. [Google Scholar] [CrossRef] [PubMed]
- Lansford, K.L.; Liss, J.M. Vowel acoustics in dysarthria: Mapping to perception. J. Speech Lang. Hear. Res. 2014, 57, 68–80. [Google Scholar] [CrossRef]
- Lansford, K.L.; Liss, J.M. Vowel acoustics in dysarthria: Speech disorder diagnosis and classification. J. Speech Lang. Hear. Res. 2014, 57, 57–67. [Google Scholar] [CrossRef]
- Darley, F.L.; Aronson, A.E.; Brown, J.R. Motor Speech Disorders; Saunders: Philadelphia, PA, USA, 1975. [Google Scholar]
- Qualtrics. Qualtrics; Qualtrics: Provo, UT, USA, 2022. [Google Scholar]
- Borrie, S.A.; Barrett, T.S.; Yoho, S.E. Autoscore: An open-source automated tool for scoring listener perception of speech. J. Acoust. Soc. Am. 2019, 145, 392. [Google Scholar] [CrossRef] [Green Version]
- Schober, P.; Boer, C.; Schwarte, L.A. Correlation coefficients: Appropriate use and interpretation. Anesth. Analg. 2018, 126, 1763–1768. [Google Scholar] [CrossRef] [PubMed]
- Koo, T.K.; Li, M.Y. A Guideline of Selecting and Reporting Intraclass Correlation Coefficients for Reliability Research. J. Chiropr. Med. 2016, 15, 155–163. [Google Scholar] [CrossRef] [PubMed] [Green Version]
- R Core Team. R: A Language and Environment for Statistical Computing, 4.1.0; R Foundation for Statistical Computing: Vienna, Austria, 2021.
- Wickham, H.; Averick, M.; Bryan, J.; Chang, W.; McGowan, L.D.A.; François, R.; Grolemund, G.; Hayes, A.; Henry, L.; Hester, J. Welcome to the tidyverse. J. Open Source Softw. 2019, 4, 1686. [Google Scholar] [CrossRef]
- Gamer, M.; Lemon, J.; Fellows, I.; Singh, P. irr: Various Coefficients of Interrater Reliability and Agreement, 0.84.1; CRAN: Online, 2019.
- Lüdecke, D.; Ben-Shachar, M.S.; Patil, I.; Waggoner, P.; Makowski, D. performance: An R package for assessment, comparison and testing of statistical models. J. Open Source Softw. 2021, 6, 3139. [Google Scholar] [CrossRef]
- Harrell, F.E., Jr. Package ‘Hmisc’, 4.7-0; CRAN: Online, 2022.
- Bakdash, J.Z.; Marusich, L.R. Repeated measures correlation. Front. Psychol. 2017, 8, 456. [Google Scholar] [CrossRef] [PubMed] [Green Version]
- Darley, F.L.; Aronson, A.E.; Brown, J.R. Clusters of deviant speech dimensions in the dysarthrias. J. Speech Hear. Res. 1969, 12, 462–496. [Google Scholar] [CrossRef] [PubMed]
- De Bodt, M.S.; Hernández-Díaz Huici, M.E.; Van De Heyning, P.H. Intelligibility as a linear combination of dimensions in dysarthric speech. J. Commun. Disord. 2002, 35, 283–292. [Google Scholar] [CrossRef]
- Rong, P.; Yunusova, Y.; Wang, J.; Green, J.R. Predicting early bulbar decline in amyotrophic lateral sclerosis: A speech subsystem approach. Behav. Neurol. 2015, 2015, 183027. [Google Scholar] [CrossRef] [PubMed] [Green Version]
- Lehner, K.; Ziegler, W. Indicators of Communication Limitation in Dysarthria and Their Relation to Auditory-Perceptual Speech Symptoms: Construct Validity of the KommPaS Web App. J. Speech Lang. Hear. Res. 2022, 65, 22–42. [Google Scholar] [CrossRef] [PubMed]


| Statistical Approach | Interpretation | Evaluation Criteria | |
|---|---|---|---|
| Intrarater Reliability | |||
| Pearson correlation coefficient (r) (Research Question 1) | SLPs’ agreement with their own intelligibility ratings. | <0.40 0.40–0.75 0.75–0.90 >0.90 | Weak Moderate Strong Very Strong |
| Interrater Reliability | |||
| Average two-way ICC (ICC) (Research Question 1) | The reliability of the average intelligibility ratings across SLPs. | <0.50 0.50–0.75 0.75–0.90 >0.90 | Poor Moderate Good Excellent |
| Single two-way ICC (ICC) (Research Question 1) | The reliability of individual SLP intelligibility ratings. | ||
| Convergent Validity | |||
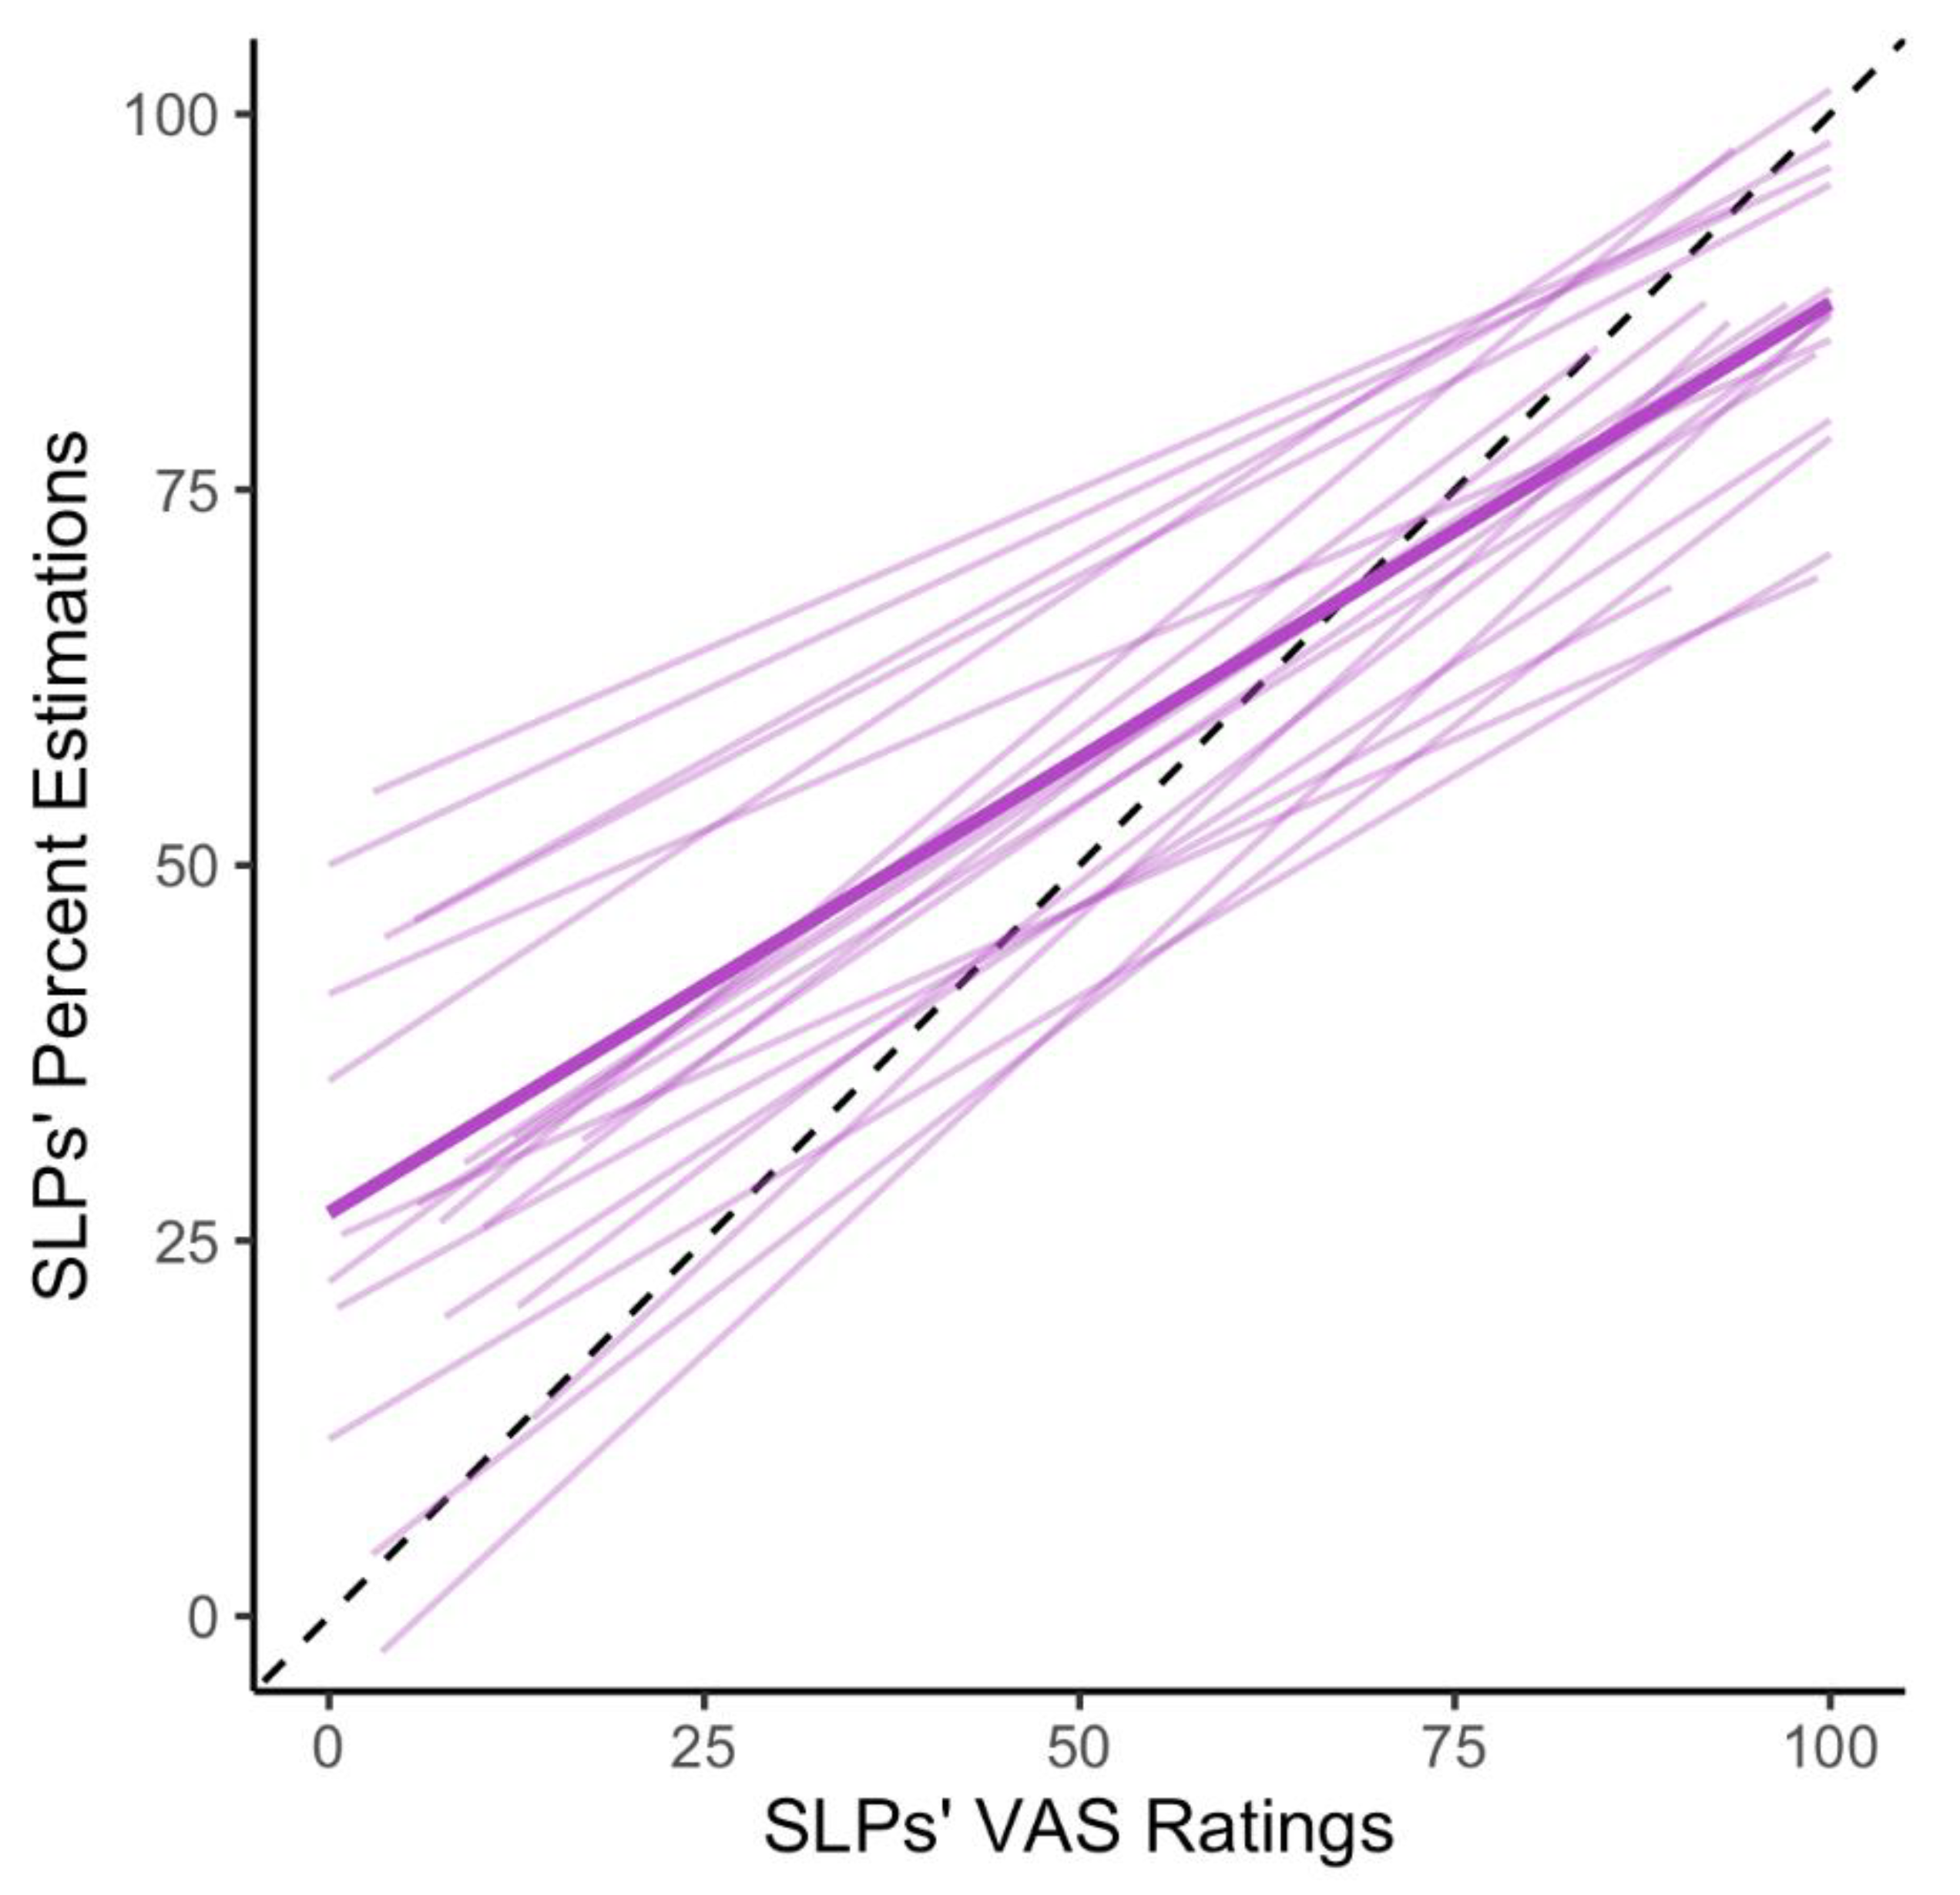
| Repeated measures correlation (rrm) (Research Question 2) | The strength of the relationship between SLP VAS ratings and percent estimations of intelligibility. | <0.40 0.40–0.75 0.75–0.90 >0.90 | Weak Moderate Strong Very Strong |
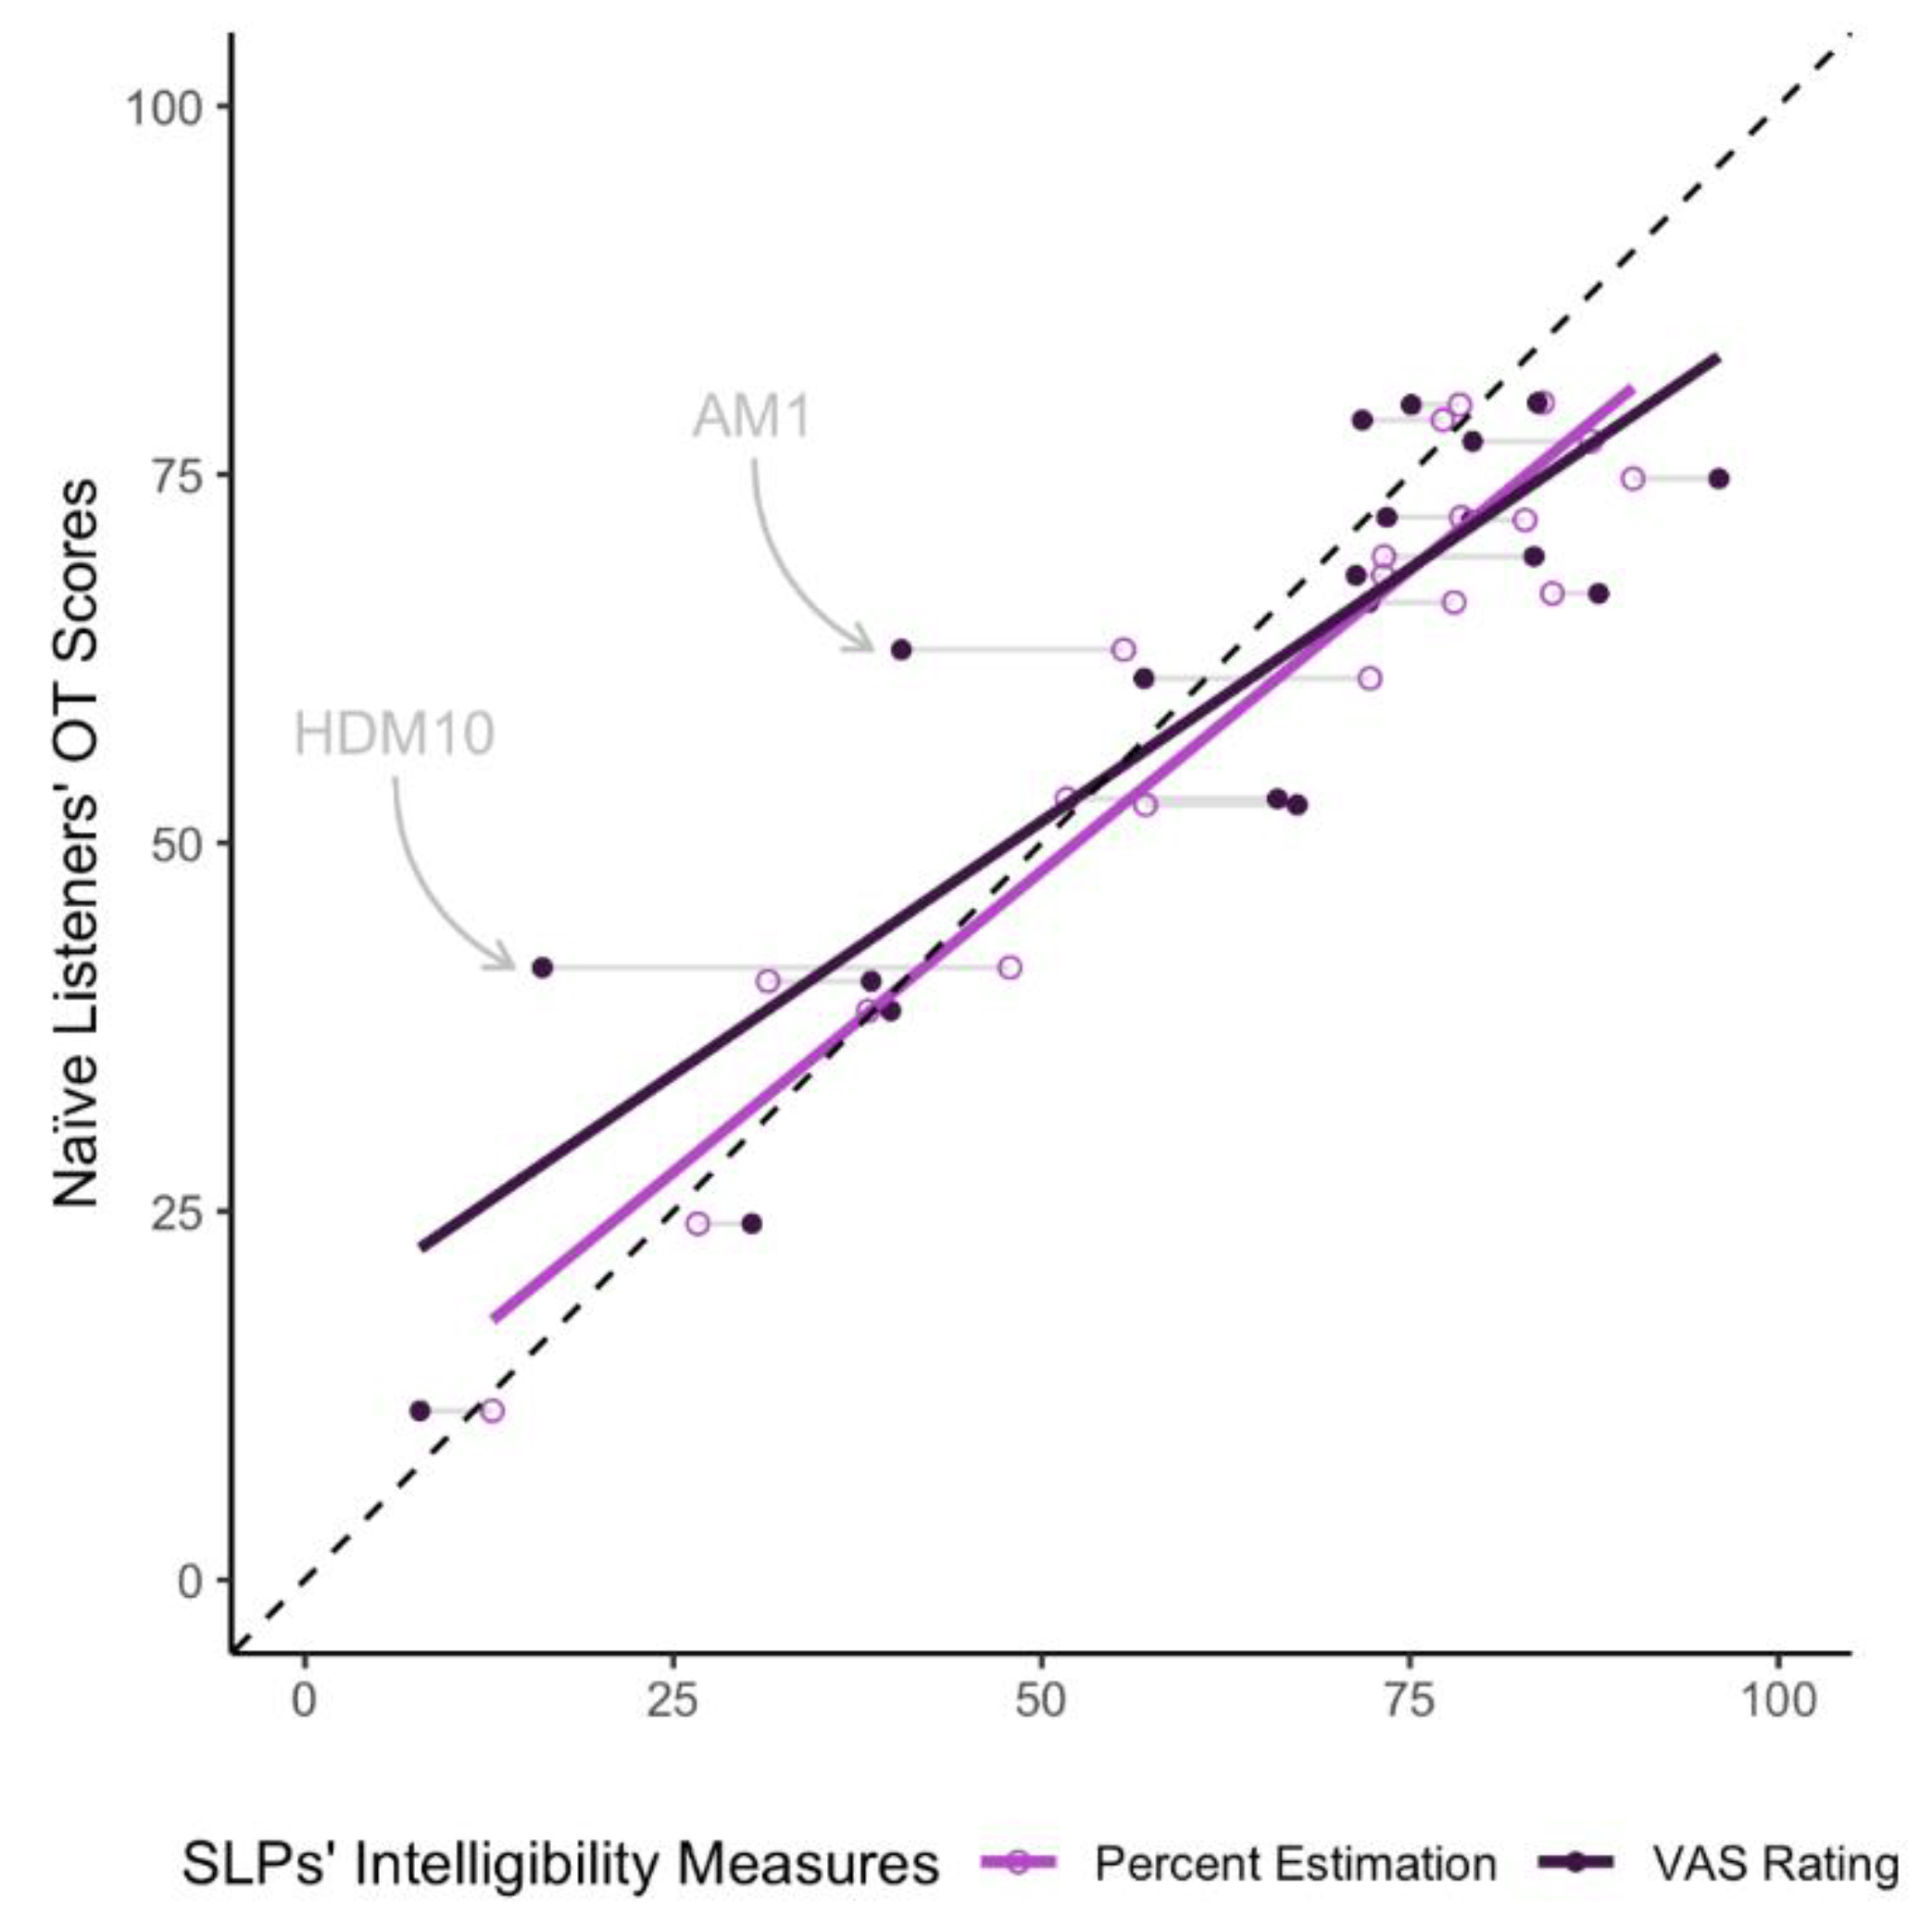
| Linear Regression (R2) (Research Question 3) | The predictive relationship between the two SLP intelligibility measures and naïve listener orthographic transcription scores. | The % of the variance of orthographic transcriptions that can be explained by the SLP intelligibility measures. | |
| Naïve Listener Measures | SLP Listener Measures | |||||
|---|---|---|---|---|---|---|
| Etiology | Orthographic Transcription Score | VAS Ratings | Percent Estimations | |||
| M | SD | M | SD | M | SD | |
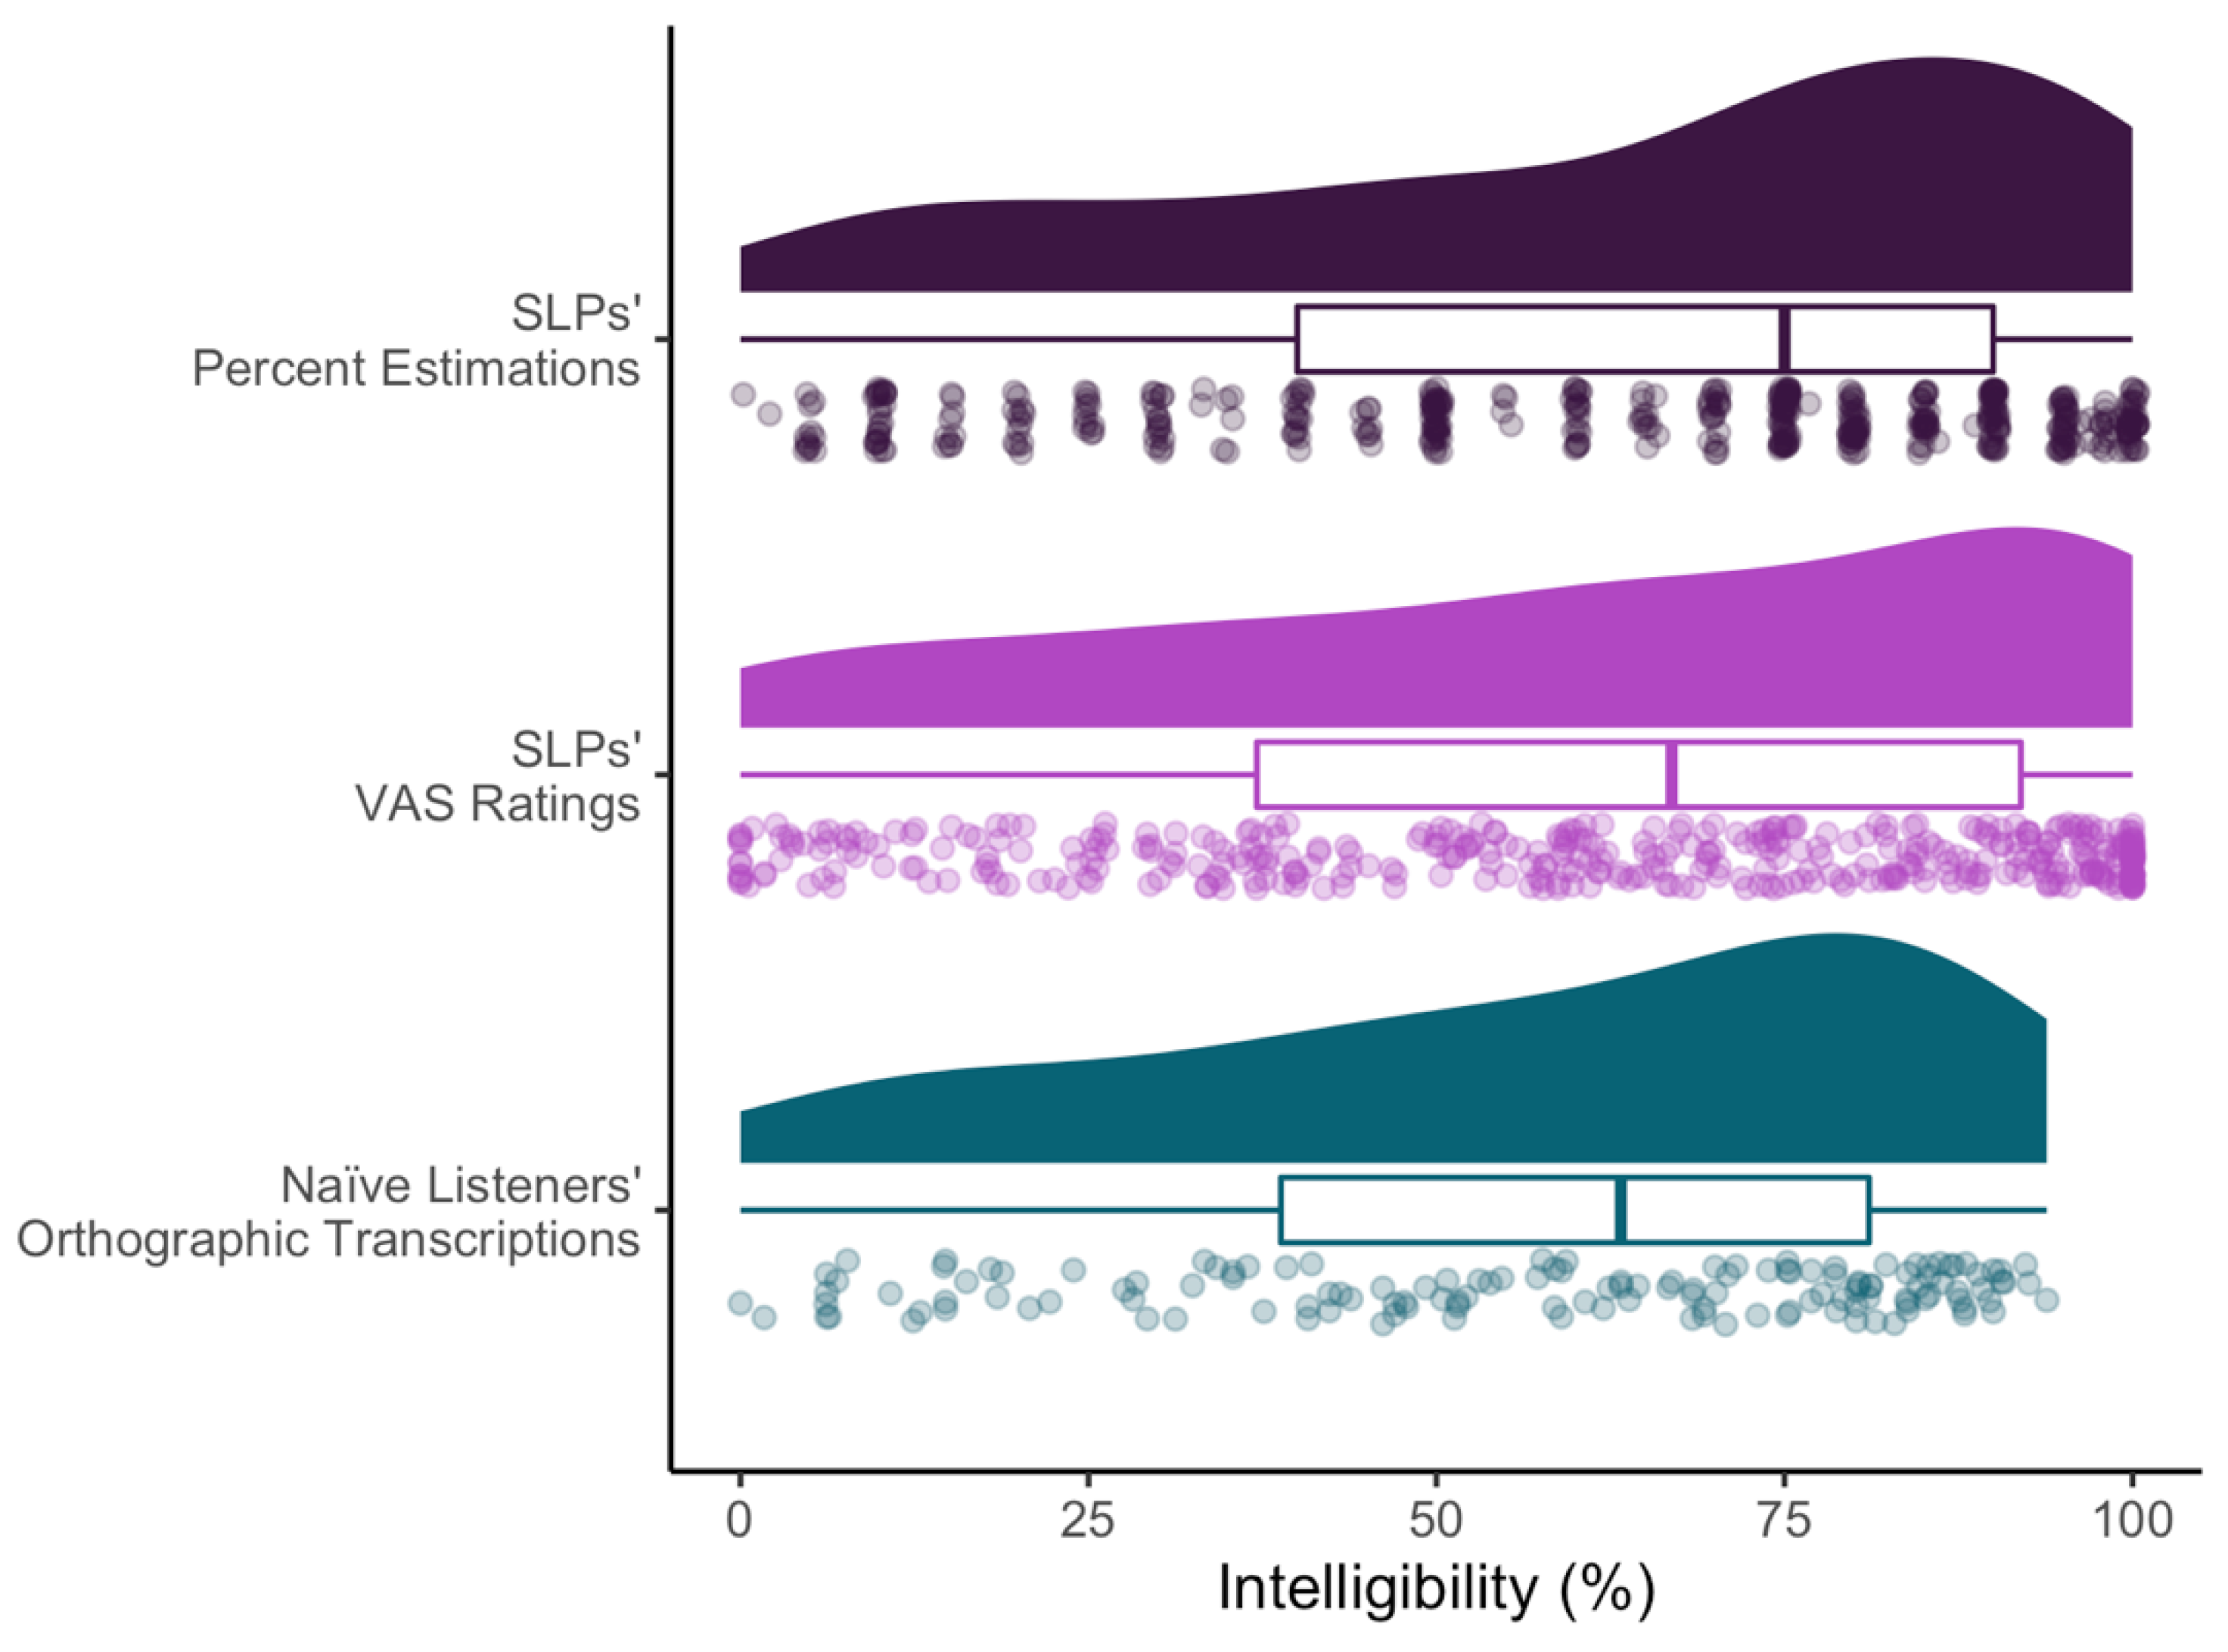
| All Speakers | 59.56 | 19.34 | 61.82 | 24.66 | 64.05 | 22.61 |
| Ataxia | 52.04 | 23.70 | 50.35 | 27.71 | 56.09 | 26.73 |
| ALS | 50.84 | 19.73 | 56.35 | 19.93 | 54.62 | 23.31 |
| PD | 72.32 | 5.83 | 81.09 | 6.24 | 80.48 | 6.74 |
| HD | 63.05 | 20.15 | 59.47 | 31.82 | 65.01 | 24.40 |
| Model 1 | Model 2 | |||||
|---|---|---|---|---|---|---|
| Predictors | Estimates | CI | Estimates | CI | ||
| (Intercept) | 7.23 | −1.23–15.69 | 0.089 | 17.12 | 4.70–29.55 | 0.010 |
| SLPs’ Percent Estimations | 0.82 | 0.69–0.94 | <0.001 | |||
| SLPs’ VAS Ratings | 0.69 | 0.50–0.87 | <0.001 | |||
| R2/R2 adjusted | 0.913/0.908 | 0.767/0.754 | ||||
Publisher’s Note: MDPI stays neutral with regard to jurisdictional claims in published maps and institutional affiliations. |
© 2022 by the authors. Licensee MDPI, Basel, Switzerland. This article is an open access article distributed under the terms and conditions of the Creative Commons Attribution (CC BY) license (https://creativecommons.org/licenses/by/4.0/).
Share and Cite
Hirsch, M.E.; Thompson, A.; Kim, Y.; Lansford, K.L. The Reliability and Validity of Speech-Language Pathologists’ Estimations of Intelligibility in Dysarthria. Brain Sci. 2022, 12, 1011. https://doi.org/10.3390/brainsci12081011
Hirsch ME, Thompson A, Kim Y, Lansford KL. The Reliability and Validity of Speech-Language Pathologists’ Estimations of Intelligibility in Dysarthria. Brain Sciences. 2022; 12(8):1011. https://doi.org/10.3390/brainsci12081011
Chicago/Turabian StyleHirsch, Micah E., Austin Thompson, Yunjung Kim, and Kaitlin L. Lansford. 2022. "The Reliability and Validity of Speech-Language Pathologists’ Estimations of Intelligibility in Dysarthria" Brain Sciences 12, no. 8: 1011. https://doi.org/10.3390/brainsci12081011
APA StyleHirsch, M. E., Thompson, A., Kim, Y., & Lansford, K. L. (2022). The Reliability and Validity of Speech-Language Pathologists’ Estimations of Intelligibility in Dysarthria. Brain Sciences, 12(8), 1011. https://doi.org/10.3390/brainsci12081011