
Age Effects in Emotional Memory and Associated Eye Movements

 ,
,
Abstract
:1. Introduction
2. Materials and Methods
2.1. Participants
2.2. Experimental Design and Stimuli
2.2.1. Stimuli
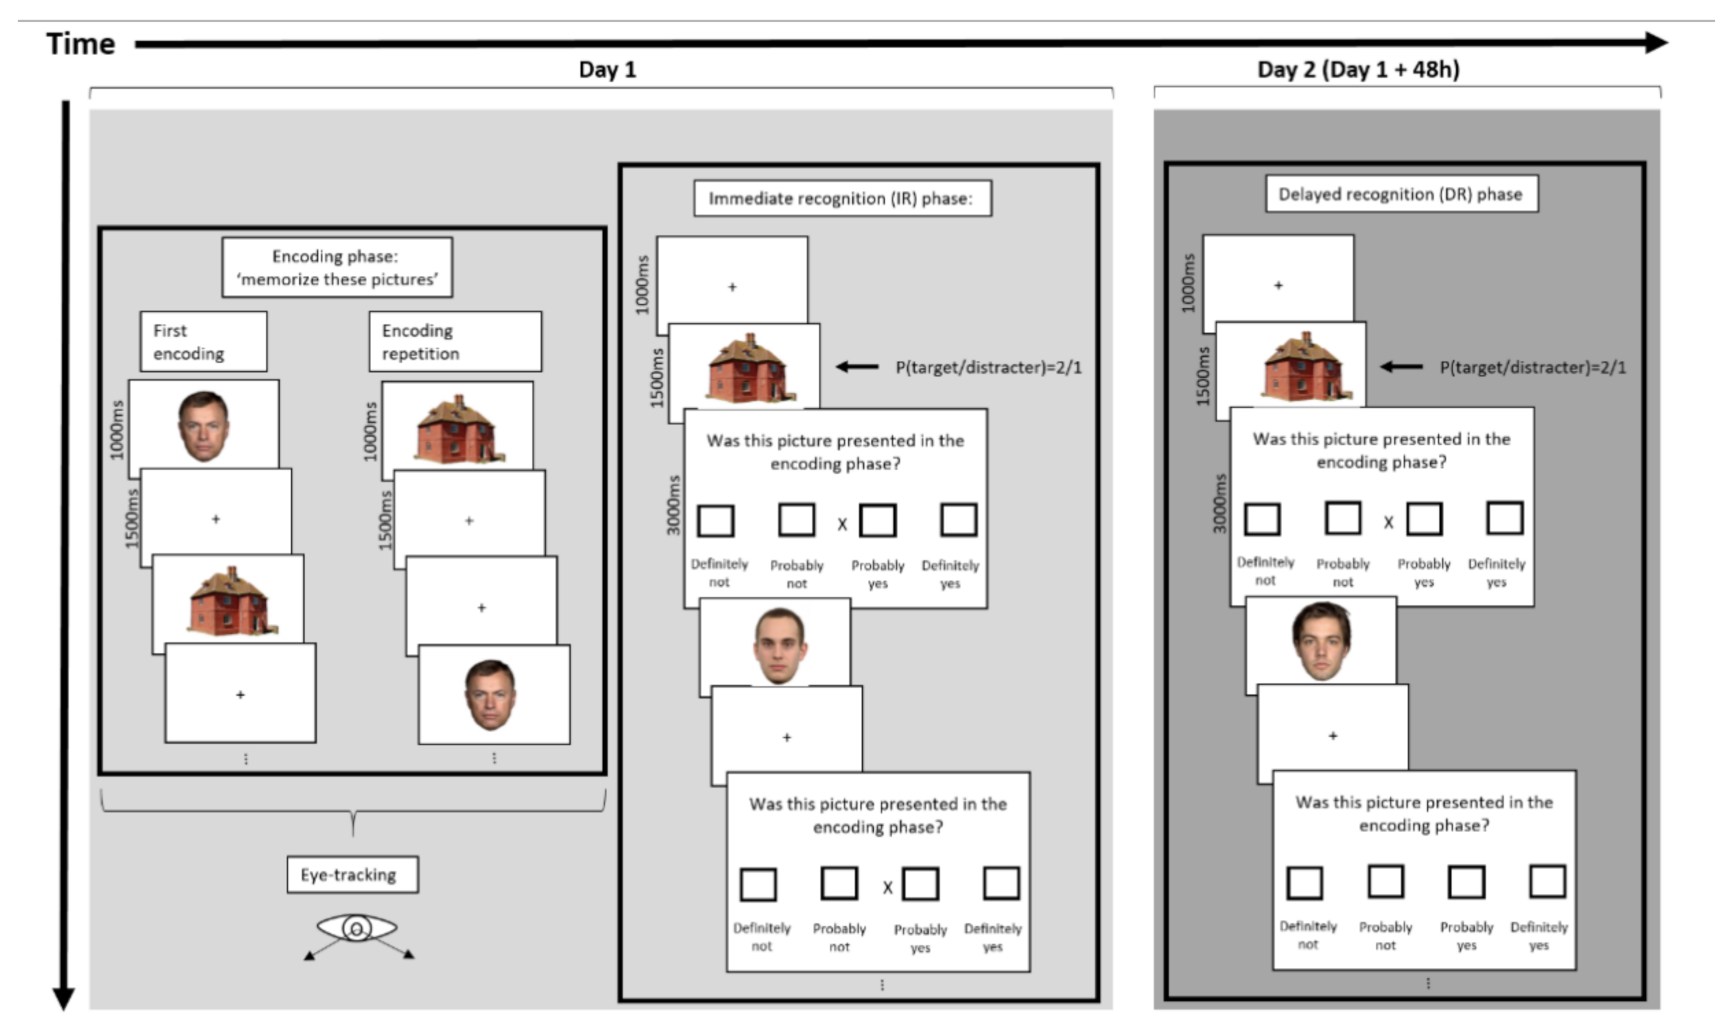
2.2.2. Procedure
2.3. Eye Tracker and Eye Movement Recordings
2.4. Statistical Analysis
2.4.1. Behavioral Analyses
2.4.2. Eye-Tracker Analyses
3. Results
3.1. Behavioral Results
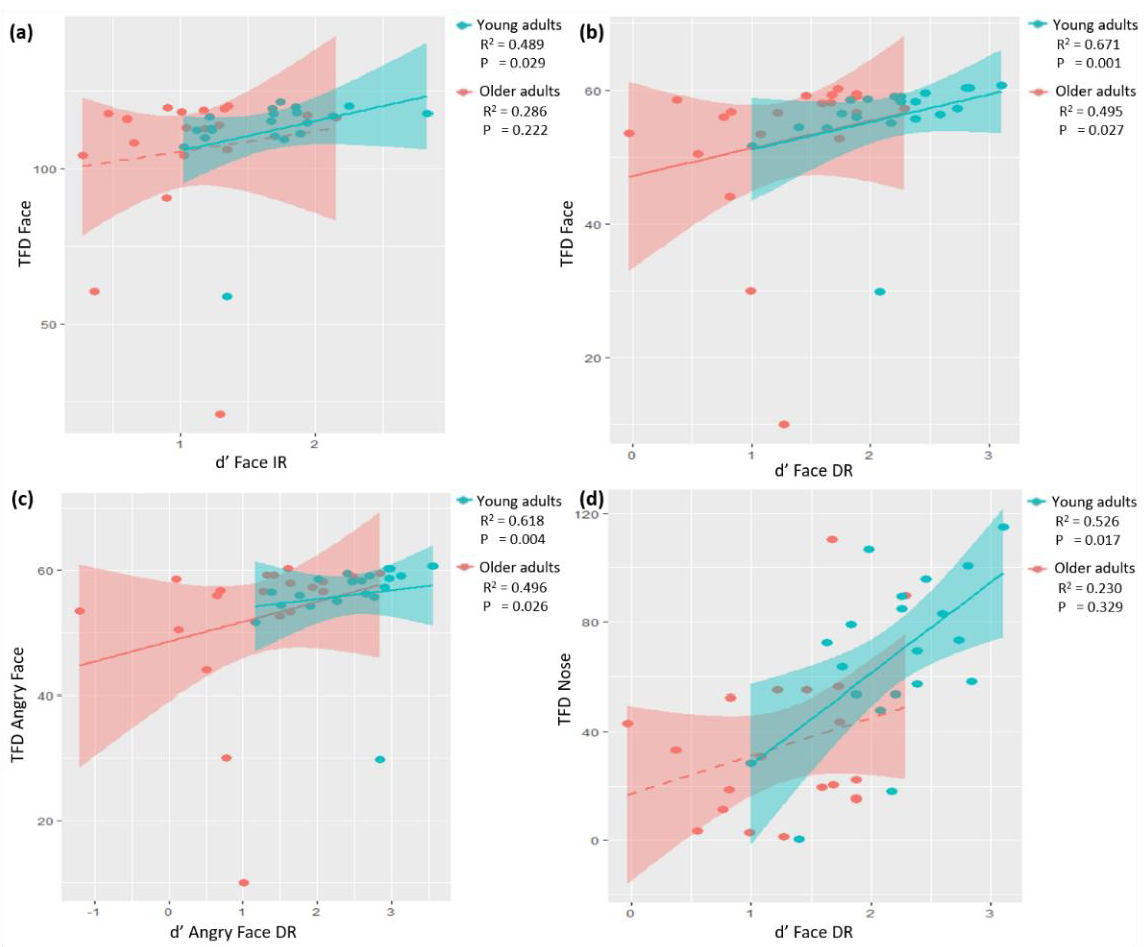
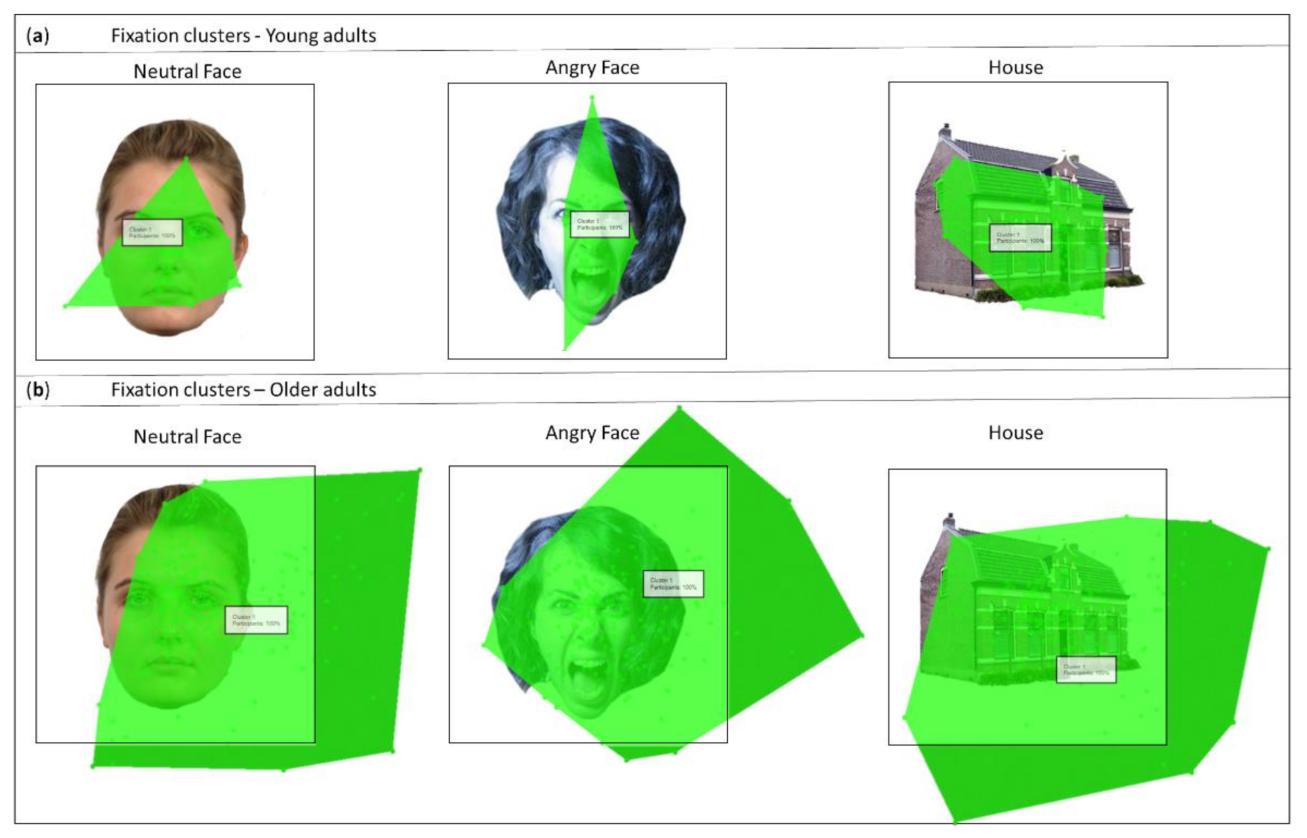
3.2. Eye-Tracking Data
4. Discussion
4.1. Emotional Enhanced Memory (EEM)
4.2. Overall Memory Decline and Eye-Scanning Pattern Association
4.3. Eye-Scanning Patterns within the Areas of Interest
4.4. Limitations and Future Directions
5. Conclusions
Author Contributions
Funding
Institutional Review Board Statement
Informed Consent Statement
Data Availability Statement
Conflicts of Interest
Appendix A

| Young Adults (N = 20) | Older Adults (N = 20) | p | Young Adults (N = 20) | Older Adults (N = 20) | p | |
|---|---|---|---|---|---|---|
| Total Fixation Duration | Fixation Count | |||||
| Face | 112.2 (13.2) | 105.8 (24.3) | 0.534 | 221.2 (73.2) | 424.9 (187.8) | <0.001 * |
| Angry Face | 56.0 (6.6) | 52.5 (12.2) | 0.344 | 114.9 (40.7) | 218.0 (94.1) | <0.001 * |
| Neutral Face | 56.2 (6.7) | 53.3 (12.1) | 0.925 | 106.3 (34.2) | 206.9 (94.7 | <0.001 * |
| House | 110.3 (12.7) | 110.1 (10.6) | 0.850 | 297.6 (73.1) | 531.9 (215.7) | <0.001 * |
| Mouth | 10.5 (9.5) | 5.1 (7.6) | 0.006 * | 24.8 (16.5) | 23.8 (21.4) | 0.500 |
| Angry Mouth | 7.0 (5.1) | 3.8 (4.3) | 0.012 * | 16.3 (8.9) | 16.2 (11.6) | 0.826 |
| Neutral Mouth | 3.5 (4.8) | 1.6 (2.9) | 0.059 | 8.5 (8.9) | 8.89 (10.5) | 0.918 |
| Nose | 67.5 (29.4) | 35.0 (28.8) | 0.002 * | 105.1 (39.6) | 99.2 (50.1) | 0.705 |
| Angry Nose | 34.6 (12.0) | 17.5 (13.6) | <0.001 * | 55.84 (15.3) | 53.1 (25.7) | 0.623 |
| Neutral Nose | 34.7 (15.8) | 17.5 (15.4) | 0.002 * | 52.1 (21.0) | 46.2 (25.3) | 0.473 |
| Eyes | 11.8 (15.1) | 12.87 (9.98) | 0.273 | 25.6 (30.7) | 46.2 (26.1) | 0.008 * |
| Angry Eyes | 5.2 (6.3) | 6.0 (4.6) | 0.342 | 12.2 (14.6) | 23.4 (12.3) | 0.004 * |
| Neutral Eyes | 6.9 (9.2) | 6.8 (5.8) | 0.500 | 14.0 (16.7) | 22.9 (14.4) | 0.020 * |
References
- LaBar, K.S.; Cabeza, R. Cognitive Neuroscience of Emotional Memory. Nat. Rev. Neurosci. 2006, 7, 54–64. [Google Scholar] [CrossRef] [PubMed]
- Dolcos, F.; Katsumi, Y.; Moore, M.; Berggren, N.; de Gelder, B.; Derakshan, N.; Hamm, A.O.; Koster, E.H.W.; Ladouceur, C.D.; Okon-Singer, H.; et al. Neural Correlates of Emotion-Attention Interactions: From Perception, Learning, and Memory to Social Cognition, Individual Differences, and Training Interventions. Neurosci. Biobehav. Rev. 2020, 108, 559–601. [Google Scholar] [CrossRef] [PubMed]
- Kensinger, E.A.; O’Brien, J.L.; Swanberg, K.; Garoff-Eaton, R.J.; Schacter, D.L. The Effects of Emotional Content on Reality-Monitoring Performance in Young and Older Adults. Psychol. Aging 2007, 22, 752–764. [Google Scholar] [CrossRef] [PubMed] [Green Version]
- Squire, L.R.; Genzel, L.; Wixted, J.T.; Morris, R.G. Memory Consolidation. Cold Spring Harb. Perspect. Biol. 2015, 7, a021766. [Google Scholar] [CrossRef] [PubMed]
- Dolcos, F.; LaBar, K.S.; Cabeza, R. Dissociable Effects of Arousal and Valence on Prefrontal Activity Indexing Emotional Evaluation and Subsequent Memory: An Event-Related FMRI Study. NeuroImage 2004, 23, 64–74. [Google Scholar] [CrossRef] [Green Version]
- Kensinger, E.A. Remembering Emotional Experiences: The Contribution of Valence and Arousal. Rev. Neurosci. 2004, 15, 241–251. [Google Scholar] [CrossRef] [PubMed]
- Mather, M. The Emotion Paradox in the Aging Brain: The Emotion Paradox in the Aging Brain. Ann. N. Y. Acad. Sci. 2012, 1251, 33–49. [Google Scholar] [CrossRef] [PubMed]
- Charles, S.T.; Mather, M.; Carstensen, L.L. Aging and Emotional Memory: The Forgettable Nature of Negative Images for Older Adults. J. Exp. Psychol. Gen. 2003, 132, 310–324. [Google Scholar] [CrossRef]
- Henderson, J.M.; Williams, C.C.; Falk, R.J. Eye Movements Are Functional during Face Learning. Mem. Cogn. 2005, 33, 98–106. [Google Scholar] [CrossRef] [Green Version]
- Firestone, A.; Turk-Browne, N.B.; Ryan, J.D. Age-Related Deficits in Face Recognition Are Related to Underlying Changes in Scanning Behavior. Aging Neuropsychol. Cogn. 2007, 14, 594–607. [Google Scholar] [CrossRef]
- Grainger, S.A.; Henry, J.D. Gaze Patterns to Emotional Faces throughout the Adult Lifespan. Psychol. Aging 2020, 35, 981–992. [Google Scholar] [CrossRef]
- Isaacowitz, D.M.; Wadlinger, H.A.; Goren, D.; Wilson, H.R. Selective Preference in Visual Fixation Away from Negative Images in Old Age? An Eye-Tracking Study. Psychol. Aging 2006, 21, 40–48. [Google Scholar] [CrossRef] [PubMed]
- Edmonds, E.C.; Glisky, E.L.; Bartlett, J.C.; Rapcsak, S.Z. Cognitive Mechanisms of False Facial Recognition in Older Adults. Psychol. Aging 2012, 27, 54–60. [Google Scholar] [CrossRef] [PubMed]
- Aguirre, G.K.; Zarahn, E.; D’Esposito, M. An Area within Human Ventral Cortex Sensitive to “Building” Stimuli: Evidence and Implications. Neuron 1998, 21, 373–383. [Google Scholar] [CrossRef] [PubMed] [Green Version]
- Epstein, R.; Kanwisher, N. A Cortical Representation of the Local Visual Environment. Nature 1998, 392, 598–601. [Google Scholar] [CrossRef]
- Levy, I.; Hasson, U.; Avidan, G.; Hendler, T.; Malach, R. Center–Periphery Organization of Human Object Areas. Nature Neuroscience 2001, 4, 533–539. [Google Scholar] [CrossRef]
- Van den Stock, J.; van de Riet, W.A.C.; Righart, R.; de Gelder, B. Neural Correlates of Perceiving Emotional Faces and Bodies in Developmental Prosopagnosia: An Event-Related FMRI-Study. PLoS ONE 2008, 3, e3195. [Google Scholar] [CrossRef] [Green Version]
- Haxby, J.V.; Gobbini, M.I. Distributed Neural Systems for Face Perception. In Oxford Handbook of Face Perception; Rhodes, G., Calder, A., Johnson, M., Haxby, J.V., Eds.; Oxford University Press: New York, NY, USA, 2011; pp. 93–110. [Google Scholar]
- Leder, H.; Carbon, C.-C. When Context Hinders! Learn–Test Compatibility in Face Recognition. Q. J. Exp. Psychol. Sect. A 2005, 58, 235–250. [Google Scholar] [CrossRef]
- Bartlett, J.C.; Leslie, J.E.; Tubbs, A.; Fulton, A. Aging and Memory for Pictures of Faces. Psychol. Aging 1989, 4, 276–283. [Google Scholar] [CrossRef]
- Crook, T.H.; Larrabee, G.J. Changes in Facial Recognition Memory Across the Adult Life Span. J. Gerontol. 1992, 47, P138–P141. [Google Scholar] [CrossRef]
- Smith, A.D.; Winograd, E. Adult Age Differences in Remembering Faces. Dev. Psychol. 1978, 14, 443–444. [Google Scholar] [CrossRef]
- Potts, C.; Richardson, J.; Bond, R.B.; Price, R.K.; Mulvenna, M.D.; Zvolsky, P.; Harvey, M.; Hughes, C.F.; Duffy, F. Reliability of Addenbrooke’s Cognitive Examination III in Differentiating between Dementia, Mild Cognitive Impairment and Older Adults Who Have Not Reported Cognitive Problems. Eur. J. Ageing 2021, 19, 495–507. [Google Scholar] [CrossRef]
- Van den Stock, J.; de Gelder, B. Emotional Information in Body and Background Hampers Recognition Memory for Faces. Neurobiol. Learn. Mem. 2012, 97, 321–325. [Google Scholar] [CrossRef]
- Van den Stock, J.V.; Vandenbulcke, M.; Sinke, C.B.A.; de Gelder, B. Affective Scenes Influence Fear Perception of Individual Body Expressions: Threat Perception in Bodies and Backgrounds. Hum. Brain Mapp. 2014, 35, 492–502. [Google Scholar] [CrossRef] [PubMed]
- Ebner, N.C.; Riediger, M.; Lindenberger, U. FACES—A Database of Facial Expressions in Young, Middle-Aged, and Older Women and Men: Development and Validation. Behav. Res. Methods 2010, 42, 351–362. [Google Scholar] [CrossRef] [PubMed]
- Langner, O.; Dotsch, R.; Bijlstra, G.; Wigboldus, D.H.J.; Hawk, S.T.; van Knippenberg, A. Presentation and Validation of the Radboud Faces Database. Cogn. Emot. 2010, 24, 1377–1388. [Google Scholar] [CrossRef]
- Simpson, A.J.; Fitter, M.J. What Is the Best Index of Detectability? Psychol. Bull. 1973, 80, 481–488. [Google Scholar] [CrossRef]
- Harvey, L.O. Rscore Plus, version 5.6.1. 2010. Available online: http://psych.colorado.edu/~lharvey/html/software.html (accessed on 2 January 2019).
- Stam, D.; Huang, Y.-A.; Vansteelandt, K.; Sunaert, S.; Peeters, R.; Sleurs, C.; Vrancken, L.; Emsell, L.; Vogels, R.; Vandenbulcke, M.; et al. Long Term FMRI Adaptation Depends on Adapter Response in Face-Selective Cortex. Commun. Biol. 2021, 4, 712. [Google Scholar] [CrossRef]
- Tobii Technology AB Tobii Eye Tracker TX300. Available online: http://www.tobii.se (accessed on 2 January 2019).
- Stanislaw, H.; Todorov, N. Calculation of Signal Detection Theory Measures. Behav. Res. Methods Instrum. Comput. 1999, 31, 137–149. [Google Scholar] [CrossRef] [Green Version]
- Molenberghs, G.; Verbeke, G. A Review on Linear Mixed Models for Longitudinal Data, Possibly Subject to Dropout. Stat. Model. 2001, 1, 235–269. [Google Scholar] [CrossRef]
- IBM Corp. IBM SPSS Statistics for Windows; Version 25.0; IBM SPSS: Armonk, NY, USA, 2017. [Google Scholar]
- Rozin, P.; Royzman, E.B. Negativity Bias, Negativity Dominance, and Contagion. Pers. Soc. Psychol. Rev. 2001, 5, 296–320. [Google Scholar] [CrossRef]
- Baumeister, R.F.; Bratslavsky, E.; Finkenauer, C.; Vohs, K.D. Bad Is Stronger than Good. Rev. Gen. Psychol. 2001, 5, 323–370. [Google Scholar] [CrossRef]
- Wood, S.; Kisley, M.A. The Negativity Bias Is Eliminated in Older Adults: Age-Related Reduction in Event-Related Brain Potentials Associated with Evaluative Categorization. Psychol. Aging 2006, 21, 815–820. [Google Scholar] [CrossRef] [PubMed] [Green Version]
- Grady, C.L.; Hongwanishkul, D.; Keightley, M.; Lee, W.; Hasher, L. The Effect of Age on Memory for Emotional Faces. Neuropsychology 2007, 21, 371–380. [Google Scholar] [CrossRef] [PubMed] [Green Version]
- Gunning-Dixon, F.M.; Gur, R.C.; Perkins, A.C.; Schroeder, L.; Turner, T.; Turetsky, B.I.; Chan, R.M.; Loughead, J.W.; Alsop, D.C.; Maldjian, J.; et al. Age-Related Differences in Brain Activation during Emotional Face Processing. Neurobiol. Aging 2003, 24, 285–295. [Google Scholar] [CrossRef] [PubMed]
- Iidaka, T.; Okada, T.; Murata, T.; Omori, M.; Kosaka, H.; Sadato, N.; Yonekura, Y. Age-Related Differences in the Medial Temporal Lobe Responses to Emotional Faces as Revealed by FMRI. Hippocampus 2002, 12, 352–362. [Google Scholar] [CrossRef]
- Mather, M.; Canli, T.; English, T.; Whitfield, S.; Wais, P.; Ochsner, K.; John, D.E.G.; Carstensen, L.L. Amygdala Responses to Emotionally Valenced Stimuli in Older and Younger Adults. Psychol. Sci. 2004, 15, 259–263. [Google Scholar] [CrossRef] [Green Version]
- Carstensen, L.L.; Fung, H.H.; Charles, S.T. Socioemotional Selectivity Theory and the Regulation of Emotion in the Second Half of Life. Motiv. Emot. 2003, 27, 103–123. [Google Scholar] [CrossRef]
- Isaacowitz, D.M.; Blanchard-Fields, F. Linking Process and Outcome in the Study of Emotion and Aging. Perspect. Psychol. Sci. 2012, 7, 3–17. [Google Scholar] [CrossRef] [Green Version]
- Nikitin, J.; Freund, A.M. Age and Motivation Predict Gaze Behavior for Facial Expressions. Psychol. Aging 2011, 26, 695–700. [Google Scholar] [CrossRef]
- Bayes-Marin, I.; Fernández, D.; Lara, E.; Martín-María, N.; Miret, M.; Moreno-Agostino, D.; Ayuso-Mateos, J.L.; Sanchez-Niubo, A.; Haro, J.M.; Olaya, B. Trajectories of Immediate and Delayed Verbal Memory in the Spanish General Population of Middle-Aged and Older Adults. Brain Sci. 2020, 10, 249. [Google Scholar] [CrossRef] [Green Version]
- Chalfonte, B.L.; Johnson, M.K. Feature Memory and Binding in Young and Older Adults. Mem. Cogn. 1996, 24, 403–416. [Google Scholar] [CrossRef] [PubMed]
- Tanaka, J.W.; Farah, M.J. Parts and Wholes in Face Recognition. Q. J. Exp. Psychol. Sect. A 1993, 46, 225–245. [Google Scholar] [CrossRef] [PubMed]
- Mitchell, K.J.; Johnson, M.K.; Raye, C.L.; D’Esposito, M. FMRI Evidence of Age-Related Hippocampal Dysfunction in Feature Binding in Working Memory. Cogn. Brain Res. 2000, 10, 197–206. [Google Scholar] [CrossRef] [PubMed]
- Naveh-Benjamin, M.; Guez, J.; Kilb, A.; Reedy, S. The Associative Memory Deficit of Older Adults: Further Support Using Face-Name Associations. Psychol. Aging 2004, 19, 541–546. [Google Scholar] [CrossRef] [Green Version]
- Noh, S.R.; Isaacowitz, D.M. Emotional Faces in Context: Age Differences in Recognition Accuracy and Scanning Patterns. Emotion 2013, 13, 238–249. [Google Scholar] [CrossRef] [PubMed] [Green Version]
- Althoff, R.R.; Cohen, N.J. Eye-Movement-Based Memory Effect: A Reprocessing Effect in Face Perception. J. Exp. Psychol. Learn. Mem. Cogn. 1999, 25, 997–1010. [Google Scholar] [CrossRef]
- Walker-Smith, G.J.; Gale, A.G.; Findlay, J.M. Eye Movement Strategies Involved in Face Perception. Perception 1977, 6, 313–326. [Google Scholar] [CrossRef]
- Macho, S.; Leder, H. Your Eyes Only? A Test of Interactive Influence in the Processing of Facial Features. J. Exp. Psychol. Hum. Percept. Perform. 1998, 24, 1486–1500. [Google Scholar] [CrossRef]
- Peterson, M.F.; Eckstein, M.P. Looking Just below the Eyes Is Optimal across Face Recognition Tasks. Proc. Natl. Acad. Sci. USA 2012, 109, E3314–E3323. [Google Scholar] [CrossRef]
- Schyns, P.G.; Bonnar, L.; Gosselin, F. Show Me the Features! Understanding Recognition From the Use of Visual Information. Psychol. Sci. 2002, 13, 402–409. [Google Scholar] [CrossRef]
- Hsiao, J.H.; Cottrell, G. Two Fixations Suffice in Face Recognition. Psychol. Sci. 2008, 19, 998–1006. [Google Scholar] [CrossRef] [PubMed]
- Stacchi, L.; Ramon, M.; Lao, J.; Caldara, R. Neural Representations of Faces Are Tuned to Eye Movements. J. Neurosci. 2019, 39, 4113–4123. [Google Scholar] [CrossRef] [Green Version]
- Arizpe, J.; Kravitz, D.J.; Yovel, G.; Baker, C.I. Start Position Strongly Influences Fixation Patterns during Face Processing: Difficulties with Eye Movements as a Measure of Information Use. PLoS ONE 2012, 7, e31106. [Google Scholar] [CrossRef] [PubMed] [Green Version]
- Di Domenico, A.; Palumbo, R.; Mammarella, N.; Fairfield, B. Aging and Emotional Expressions: Is There a Positivity Bias during Dynamic Emotion Recognition? Front. Psychol. 2015, 6, 1130. [Google Scholar] [CrossRef] [Green Version]
- Ebner, N.C.; Johnson, M.K. Young and Older Emotional Faces: Are There Age Group Differences in Expression Identification and Memory? Emotion 2009, 9, 329–339. [Google Scholar] [CrossRef] [PubMed] [Green Version]
- Isaacowitz, D.M.; Wadlinger, H.A.; Goren, D.; Wilson, H.R. Is There an Age-Related Positivity Effect in Visual Attention? A Comparison of Two Methodologies. Emotion 2006, 6, 511–516. [Google Scholar] [CrossRef]
- Savaskan, E.; Müller, S.E.; Böhringer, A.; Philippsen, C.; Müller-Spahn, F.; Schächinger, H. Age Determines Memory for Face Identity and Expression. Psychogeriatrics 2007, 7, 49–57. [Google Scholar] [CrossRef]
- Werheid, K.; Gruno, M.; Kathmann, N.; Fischer, H.; Almkvist, O.; Winblad, B. Biased Recognition of Positive Faces in Aging and Amnestic Mild Cognitive Impairment. Psychol. Aging 2010, 25, 1–15. [Google Scholar] [CrossRef]
- Kensinger, E.A.; Brierley, B.; Medford, N.; Growdon, J.H.; Corkin, S. Effects of Normal Aging and Alzheimer’s Disease on Emotional Memory. Emotion 2002, 2, 118–134. [Google Scholar] [CrossRef]


| Young Adults (N = 20) | Older Adults (N = 21) | p | |
|---|---|---|---|
| Sex (♂/♀) | 7/13 | 9/12 | 0.606 |
| Age | 21.6 (2.37) | 69.3 (7.61) | <0.001 * |
| Age education | 21.4 (2.46) | 17.0 (3.06) | <0.001 * |
| ACE-III 1 (/100) | 92.8 (4.67) | 88.5 (6.66) | 0.024 * |
| MMSE (/30) * | 29.7 (0.67) | 29.1 (1.07) | 0.060 |
| Young Adults (N = 20) | Older Adults (N = 21) | ||
|---|---|---|---|
| d’ Angry face | R2 p | 0.669 0.001 * | 0.481 0.032 * |
| d’ Neutral face | R2 p | 0.295 0.206 | 0.024 0.920 |
| d’ Face | R2 p | 0.502 0.024 * | 0.213 0.366 |
| d’ House face | R2 p | 0.736 <0.001 * | 0.694 <0.001 * |
Publisher’s Note: MDPI stays neutral with regard to jurisdictional claims in published maps and institutional affiliations. |
© 2022 by the authors. Licensee MDPI, Basel, Switzerland. This article is an open access article distributed under the terms and conditions of the Creative Commons Attribution (CC BY) license (https://creativecommons.org/licenses/by/4.0/).
Share and Cite
Stam, D.; Colman, L.; Vansteelandt, K.; Vandenbulcke, M.; Van den Stock, J. Age Effects in Emotional Memory and Associated Eye Movements. Brain Sci. 2022, 12, 1719. https://doi.org/10.3390/brainsci12121719
Stam D, Colman L, Vansteelandt K, Vandenbulcke M, Van den Stock J. Age Effects in Emotional Memory and Associated Eye Movements. Brain Sciences. 2022; 12(12):1719. https://doi.org/10.3390/brainsci12121719
Chicago/Turabian StyleStam, Daphne, Laura Colman, Kristof Vansteelandt, Mathieu Vandenbulcke, and Jan Van den Stock. 2022. "Age Effects in Emotional Memory and Associated Eye Movements" Brain Sciences 12, no. 12: 1719. https://doi.org/10.3390/brainsci12121719
APA StyleStam, D., Colman, L., Vansteelandt, K., Vandenbulcke, M., & Van den Stock, J. (2022). Age Effects in Emotional Memory and Associated Eye Movements. Brain Sciences, 12(12), 1719. https://doi.org/10.3390/brainsci12121719