
Availability of Central α4β2* Nicotinic Acetylcholine Receptors in Human Obesity

 , ,
, , 
 , ,
, ,
Abstract
:1. Introduction
2. Materials and Methods
2.1. Study Participants
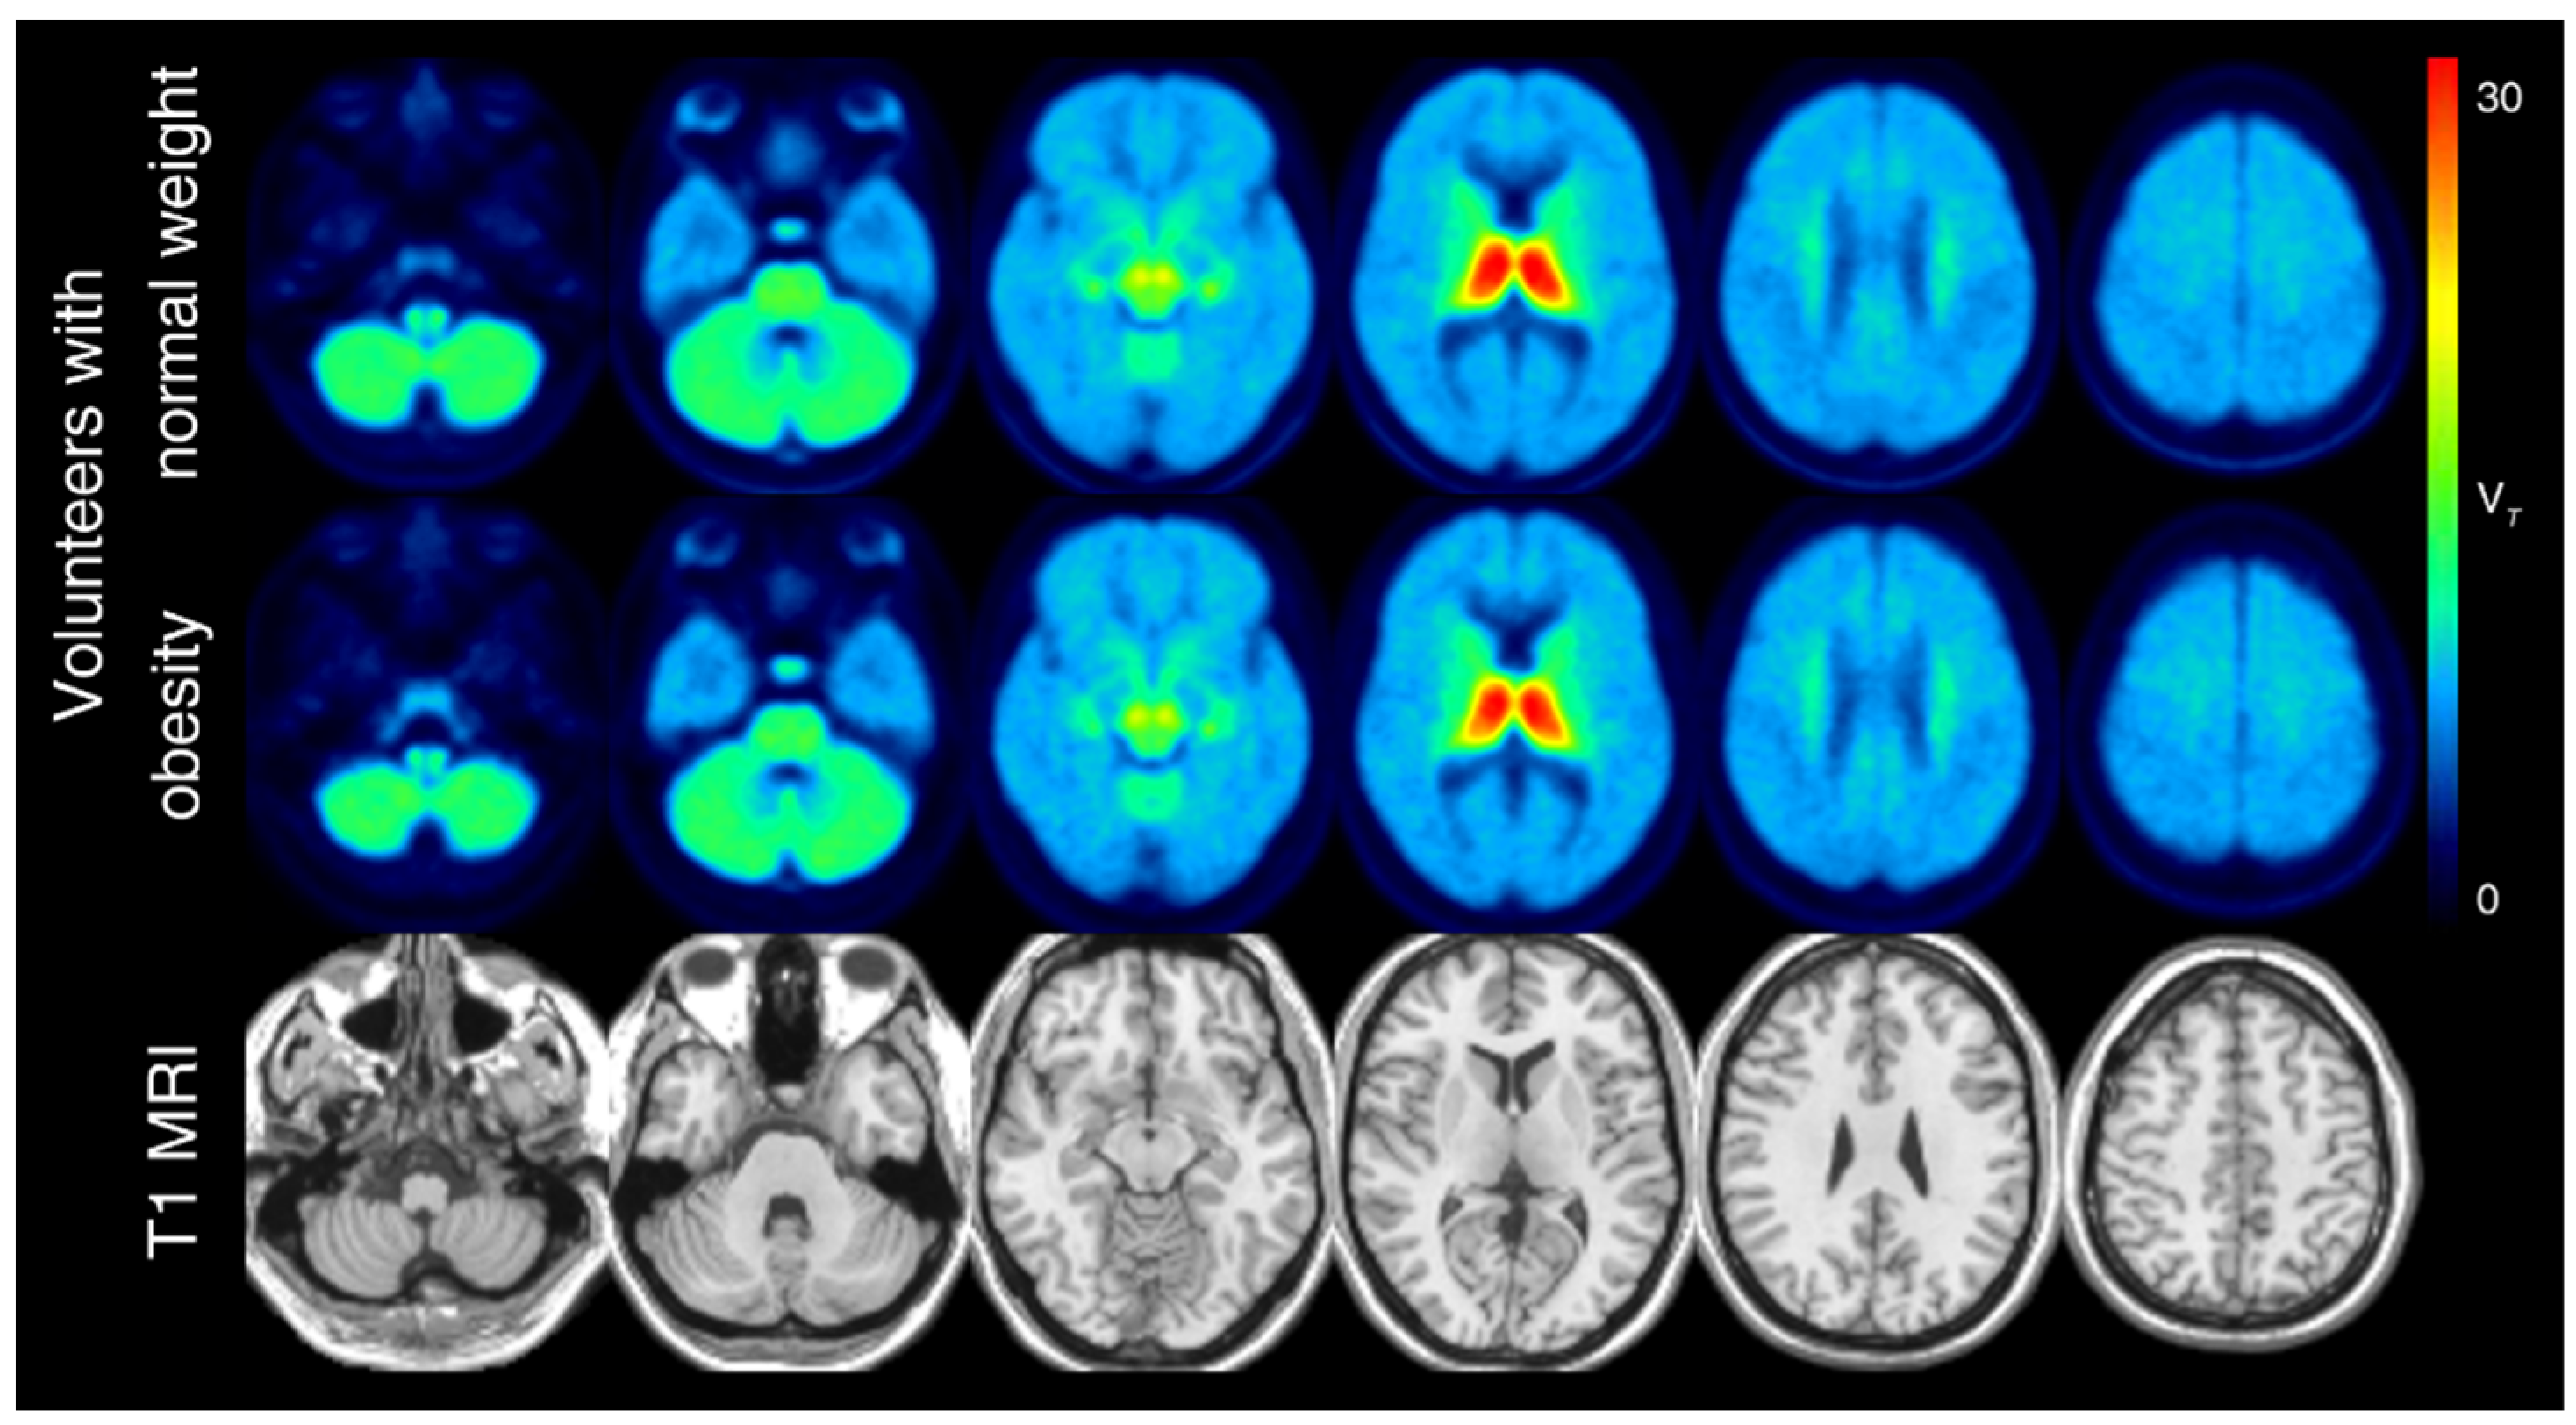
2.2. PET/MRI Acquisition Protocol and Processing
2.3. Statistical Analyses
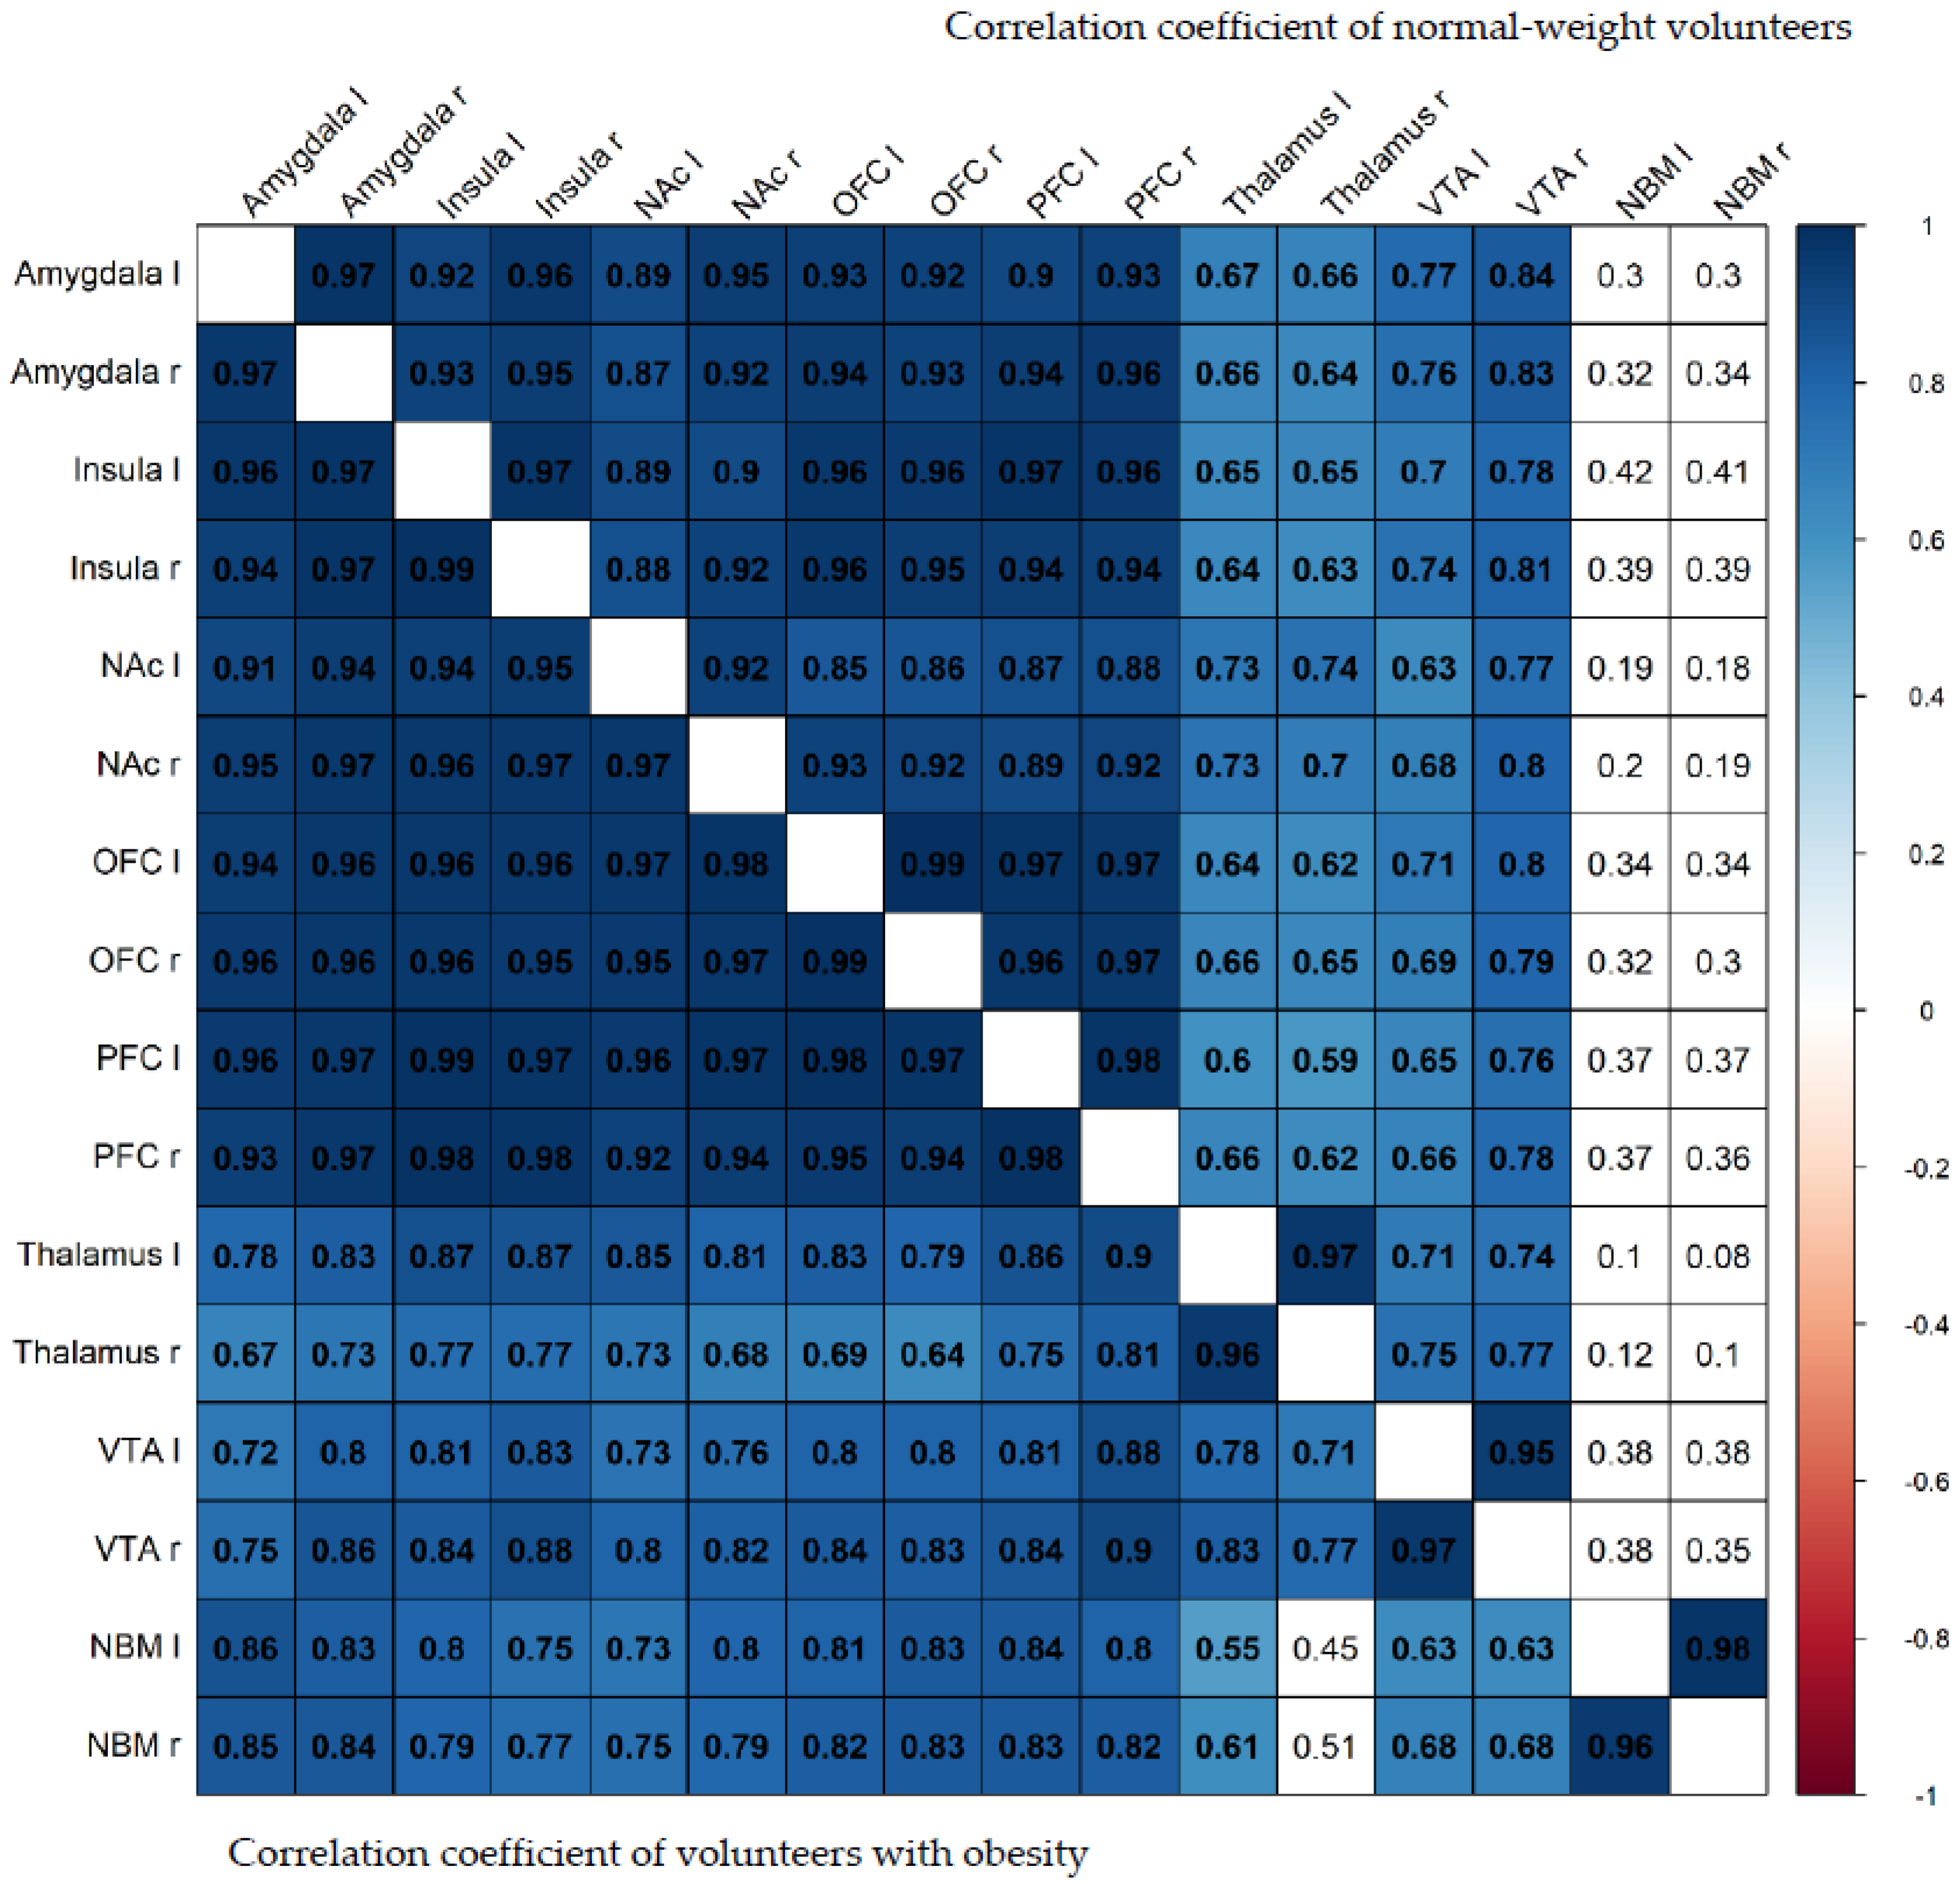
3. Results
4. Discussion
5. Limitations
6. Conclusions
Author Contributions
Funding
Institutional Review Board Statement
Informed Consent Statement
Data Availability Statement
Acknowledgments
Conflicts of Interest
References
- Bessesen, D.H. Update on Obesity. J. Clin. Endocrinol. Metab. 2008, 93, 2027–2034. [Google Scholar] [CrossRef] [Green Version]
- Stojakovic, A.; Espinosa, E.P.; Farhad, O.T.; Lutfy, K. Effects of nicotine on homeostatic and hedonic components of food intake. J. Endocrinol. 2017, 235, R13–R31. [Google Scholar] [CrossRef]
- Zoli, M.; Picciotto, M. Nicotinic Regulation of Energy Homeostasis. Nicotine Tob. Res. 2012, 14, 1270–1290. [Google Scholar] [CrossRef] [PubMed]
- Fallon, S.; Shearman, E.; Sershen, H.; Lajtha, A. Food Reward-Induced Neurotransmitter Changes in Cognitive Brain Regions. Neurochem. Res. 2007, 32, 1772–1782. [Google Scholar] [CrossRef] [PubMed]
- Janssen, L.K.; Horstmann, A. Molecular Imaging of Central Dopamine in Obesity: A Qualitative Review across Substrates and Radiotracers. Brain Sci. 2022, 12, 486. [Google Scholar] [CrossRef]
- Collins, A.L.; Aitken, T.J.; Greenfield, V.Y.; Ostlund, S.B.; Wassum, K.M. Nucleus Accumbens Acetylcholine Receptors Modulate Dopamine and Motivation. Neuropsychopharmacology 2016, 41, 2830–2838. [Google Scholar] [CrossRef] [PubMed] [Green Version]
- Dani, J.A.; Bertrand, D. Nicotinic Acetylcholine Receptors and Nicotinic Cholinergic Mechanisms of the Central Nervous System. Annu. Rev. Pharmacol. Toxicol. 2007, 47, 699–729. [Google Scholar] [CrossRef]
- Picard, F.; Sadaghiani, S.; Leroy, C.; Courvoisier, D.S.; Maroy, R.; Bottlaender, M. High density of nicotinic receptors in the cingulo-insular network. NeuroImage 2013, 79, 42–51. [Google Scholar] [CrossRef]
- Sabri, O.; Becker, G.-A.; Meyer, P.M.; Hesse, S.; Wilke, S.; Graef, S.; Patt, M.; Luthardt, J.; Wagenknecht, G.; Hoepping, A.; et al. First-in-human PET quantification study of cerebral α4β2* nicotinic acetylcholine receptors using the novel specific radioligand (−)-[18F]Flubatine. NeuroImage 2015, 118, 199–208. [Google Scholar] [CrossRef]
- Pistelli, F.; Aquilini, F.; Carrozzi, L. Weight gain after smoking cessation. Monaldi Arch. Chest Dis. 2009, 71, 81–87. [Google Scholar] [CrossRef]
- Kovacs, M.A.; Correa, J.B.; Brandon, T.H. Smoking as alternative to eating among restrained eaters: Effect of food prime on young adult female smokers. Heal. Psychol. 2014, 33, 1174–1184. [Google Scholar] [CrossRef] [PubMed] [Green Version]
- Pilhatsch, M.; Scheuing, H.; Kroemer, N.; Kobiella, A.; Bidlingmaier, M.; Farger, G.; Smolka, M.N.; Zimmermann, U.S. Nicotine administration in healthy non-smokers reduces appetite but does not alter plasma ghrelin. Hum. Psychopharmacol. Clin. Exp. 2014, 29, 384–387. [Google Scholar] [CrossRef] [PubMed]
- Mineur, Y.S.; Abizaid, A.; Rao, Y.; Salas, R.; DiLeone, R.J.; Gündisch, D.; Diano, S.; De Biasi, M.; Horvath, T.L.; Gao, X.-B.; et al. Nicotine Decreases Food Intake Through Activation of POMC Neurons. Science 2011, 332, 1330–1332. [Google Scholar] [CrossRef] [Green Version]
- Huang, H.; Xu, Y.; van den Pol, A.N. Nicotine excites hypothalamic arcuate anorexigenic proopiomelanocortin neurons and orexigenic neuropeptide Y neurons: Similarities and differences. J. Neurophysiol. 2011, 106, 1191–1202. [Google Scholar] [CrossRef] [PubMed]
- Picciotto, M.R.; Kenny, P.J. Molecular Mechanisms Underlying Behaviors Related to Nicotine Addiction. Cold Spring Harb. Perspect. Med. 2012, 3, a012112. [Google Scholar] [CrossRef]
- Ferreira, M.; Sahibzada, N.; Shi, M.; Panico, W.; Niedringhaus, M.; Wasserman, A.; Kellar, K.J.; Verbalis, J.; Gillis, R.A. CNS Site of Action and Brainstem Circuitry Responsible for the Intravenous Effects of Nicotine on Gastric Tone. J. Neurosci. 2002, 22, 2764–2779. [Google Scholar] [CrossRef] [PubMed] [Green Version]
- Seeley, R.J.; Sandoval, D.A. Neuroscience: Weight loss through smoking. Nature 2011, 475, 176–177. [Google Scholar] [CrossRef] [PubMed]
- Hillmer, A.; Esterlis, I.; Gallezot, J.; Bois, F.; Zheng, M.; Nabulsi, N.; Lin, S.; Papke, R.; Huang, Y.; Sabri, O.; et al. Imaging of cerebral α4β2* nicotinic acetylcholine receptors with (−)-[18F]Flubatine PET: Implementation of bolus plus constant infusion and sensitivity to acetylcholine in human brain. NeuroImage 2016, 141, 71–80. [Google Scholar] [CrossRef] [Green Version]
- Stunkard, A.J.; Messick, S. The three-factor eating questionnaire to measure dietary restraint, disinhibition and hunger. J. Psychosom. Res. 1985, 29, 71–83. [Google Scholar] [CrossRef]
- Patt, M.; Schildan, A.; Habermann, B.; Fischer, S.; Hiller, A.; Deuther-Conrad, W.; Wilke, S.; Smits, R.; Hoepping, A.; Wagenknecht, G.; et al. Fully automated radiosynthesis of both enantiomers of [18F]Flubatine under GMP conditions for human application. Appl. Radiat. Isot. 2013, 80, 7–11. [Google Scholar] [CrossRef]
- Catana, C.; van der Kouwe, A.; Benner, T.; Michel, C.J.; Hamm, M.; Fenchel, M.; Fischl, B.; Rosen, B.; Schmand, M.; Sorensen, A.G. Toward Implementing an MRI-Based PET Attenuation-Correction Method for Neurologic Studies on the MR-PET Brain Prototype. J. Nucl. Med. 2010, 51, 1431–1438. [Google Scholar] [CrossRef] [PubMed] [Green Version]
- Gielow, M.R.; Zaborszky, L. The Input-Output Relationship of the Cholinergic Basal Forebrain. Cell Rep. 2017, 18, 1817–1830. [Google Scholar] [CrossRef] [PubMed]
- Ding, J.B.; Guzman, J.N.; Peterson, J.D.; Goldberg, J.A.; Surmeier, D.J. Thalamic Gating of Corticostriatal Signaling by Cholinergic Interneurons. Neuron 2010, 67, 294–307. [Google Scholar] [CrossRef] [PubMed] [Green Version]
- Halassa, M.M.; Kastner, S. Thalamic functions in distributed cognitive control. Nat. Neurosci. 2017, 20, 1669–1679. [Google Scholar] [CrossRef] [PubMed]
- Schmitt, L.I.; Wimmer, R.D.; Nakajima, M.; Happ, M.; Mofakham, S.; Halassa, M.M. Thalamic amplification of cortical connectivity sustains attentional control. Nature 2017, 545, 219–223. [Google Scholar] [CrossRef] [PubMed] [Green Version]
- Hesse, S.; Rullmann, M.; Becker, G.A. Simultaneous assessment of α4β2 nicotinic acetylcholine receptor (nAChR) availability and neuronal response to rewarding food-cues in human obesity using PET-MRI. J. Cereb. Blood Flow Metab. 2021, 41 (Suppl. 1), 233–234. [Google Scholar] [CrossRef]
- Mesulam, M.-M. Cholinergic circuitry of the human nucleus basalis and its fate in Alzheimer’s disease. J. Comp. Neurol. 2013, 521, 4124–4144. [Google Scholar] [CrossRef] [Green Version]
- Croxson, P.; Kyriazis, D.A.; Baxter, M.G. Cholinergic modulation of a specific memory function of prefrontal cortex. Nat. Neurosci. 2011, 14, 1510–1512. [Google Scholar] [CrossRef] [Green Version]
- Herman, A.M.; Ortiz-Guzman, J.; Kochukov, M.; Herman, I.; Quast, K.B.; Patel, J.M.; Tepe, B.; Carlson, J.C.; Ung, K.; Selever, J.; et al. A cholinergic basal forebrain feeding circuit modulates appetite suppression. Nature 2016, 538, 253–256. [Google Scholar] [CrossRef] [Green Version]
- Paolone, G.; Angelakos, C.C.; Meyer, P.J.; Robinson, T.E.; Sarter, M. Cholinergic Control over Attention in Rats Prone to Attribute Incentive Salience to Reward Cues. J. Neurosci. 2013, 33, 8321–8335. [Google Scholar] [CrossRef]
- Ochoa, E.L.M.; Chattopadhyay, A.; McNamee, M.G. Desensitization of the nicotinic acetylcholine receptor: Molecular mechanisms and effect of modulators. Cell. Mol. Neurobiol. 1989, 9, 141–178. [Google Scholar] [CrossRef] [PubMed]
- Picciotto, M.R.; Addy, N.A.; Mineur, Y.S.; Brunzell, D.H. It is not “either/or”: Activation and desensitization of nicotinic acetylcholine receptors both contribute to behaviors related to nicotine addiction and mood. Prog. Neurobiol. 2008, 84, 329–342. [Google Scholar] [CrossRef] [PubMed] [Green Version]
- Bentley, P.; Driver, J.; Dolan, R. Cholinergic modulation of cognition: Insights from human pharmacological functional neuroimaging. Prog. Neurobiol. 2011, 94, 360–388. [Google Scholar] [CrossRef] [PubMed] [Green Version]
- Buisson, B.; Bertrand, D. Chronic Exposure to Nicotine Upregulates the Human α4β2 Nicotinic Acetylcholine Receptor Function. J. Neurosci. 2001, 21, 1819–1829. [Google Scholar] [CrossRef] [PubMed]
- Dupont, W.D.; Plummer, W.D. Power and sample size calculations: A review and computer program. Control. Clin. Trials 1990, 11, 116–128. [Google Scholar] [CrossRef]


| Variables | Individuals with Obesity (n = 15) | Normal-Weight Controls (n = 16) | p Value |
|---|---|---|---|
| Age (years) | 39.5 ± 14.0 (20 to 62) | 27.5 ± 7.3 (19–45) | 0.005 a |
| Sex (male/female) | 6/9 | 3/13 | 0.25 b |
| BMI (kg/m2) | 37.8 ± 3.1(32.5 to 42.8) | 21.9 ± 1.7 (19.4 to 24.9) | <0.001 a |
| Activity (MBq) | 291 ± 8.5 (270 to 300) | 295 ± 8.0 (273 to 307) | 0.15 a |
| TFEQ score | |||
| Cognitive control | 8.7 ± 5.5 (1 to 19) | 7.2 ± 3.9 (2 to 15) | 0.37 a |
| Disinhibition | 8.9 ± 3.6 (3 to 14) | 3.4 ± 2.1 (0 to 7) | <0.001 a |
| Hunger | 5.6 ± 2.6 (2 to 9) | 3.2 ± 2.8 (0 to 10) | 0.02 a |
| Individuals with Obesity (n = 15) | Normal-Weight Controls (n = 16) | |||||
|---|---|---|---|---|---|---|
| Region | Mean | SD | Mean | SD | p a | |
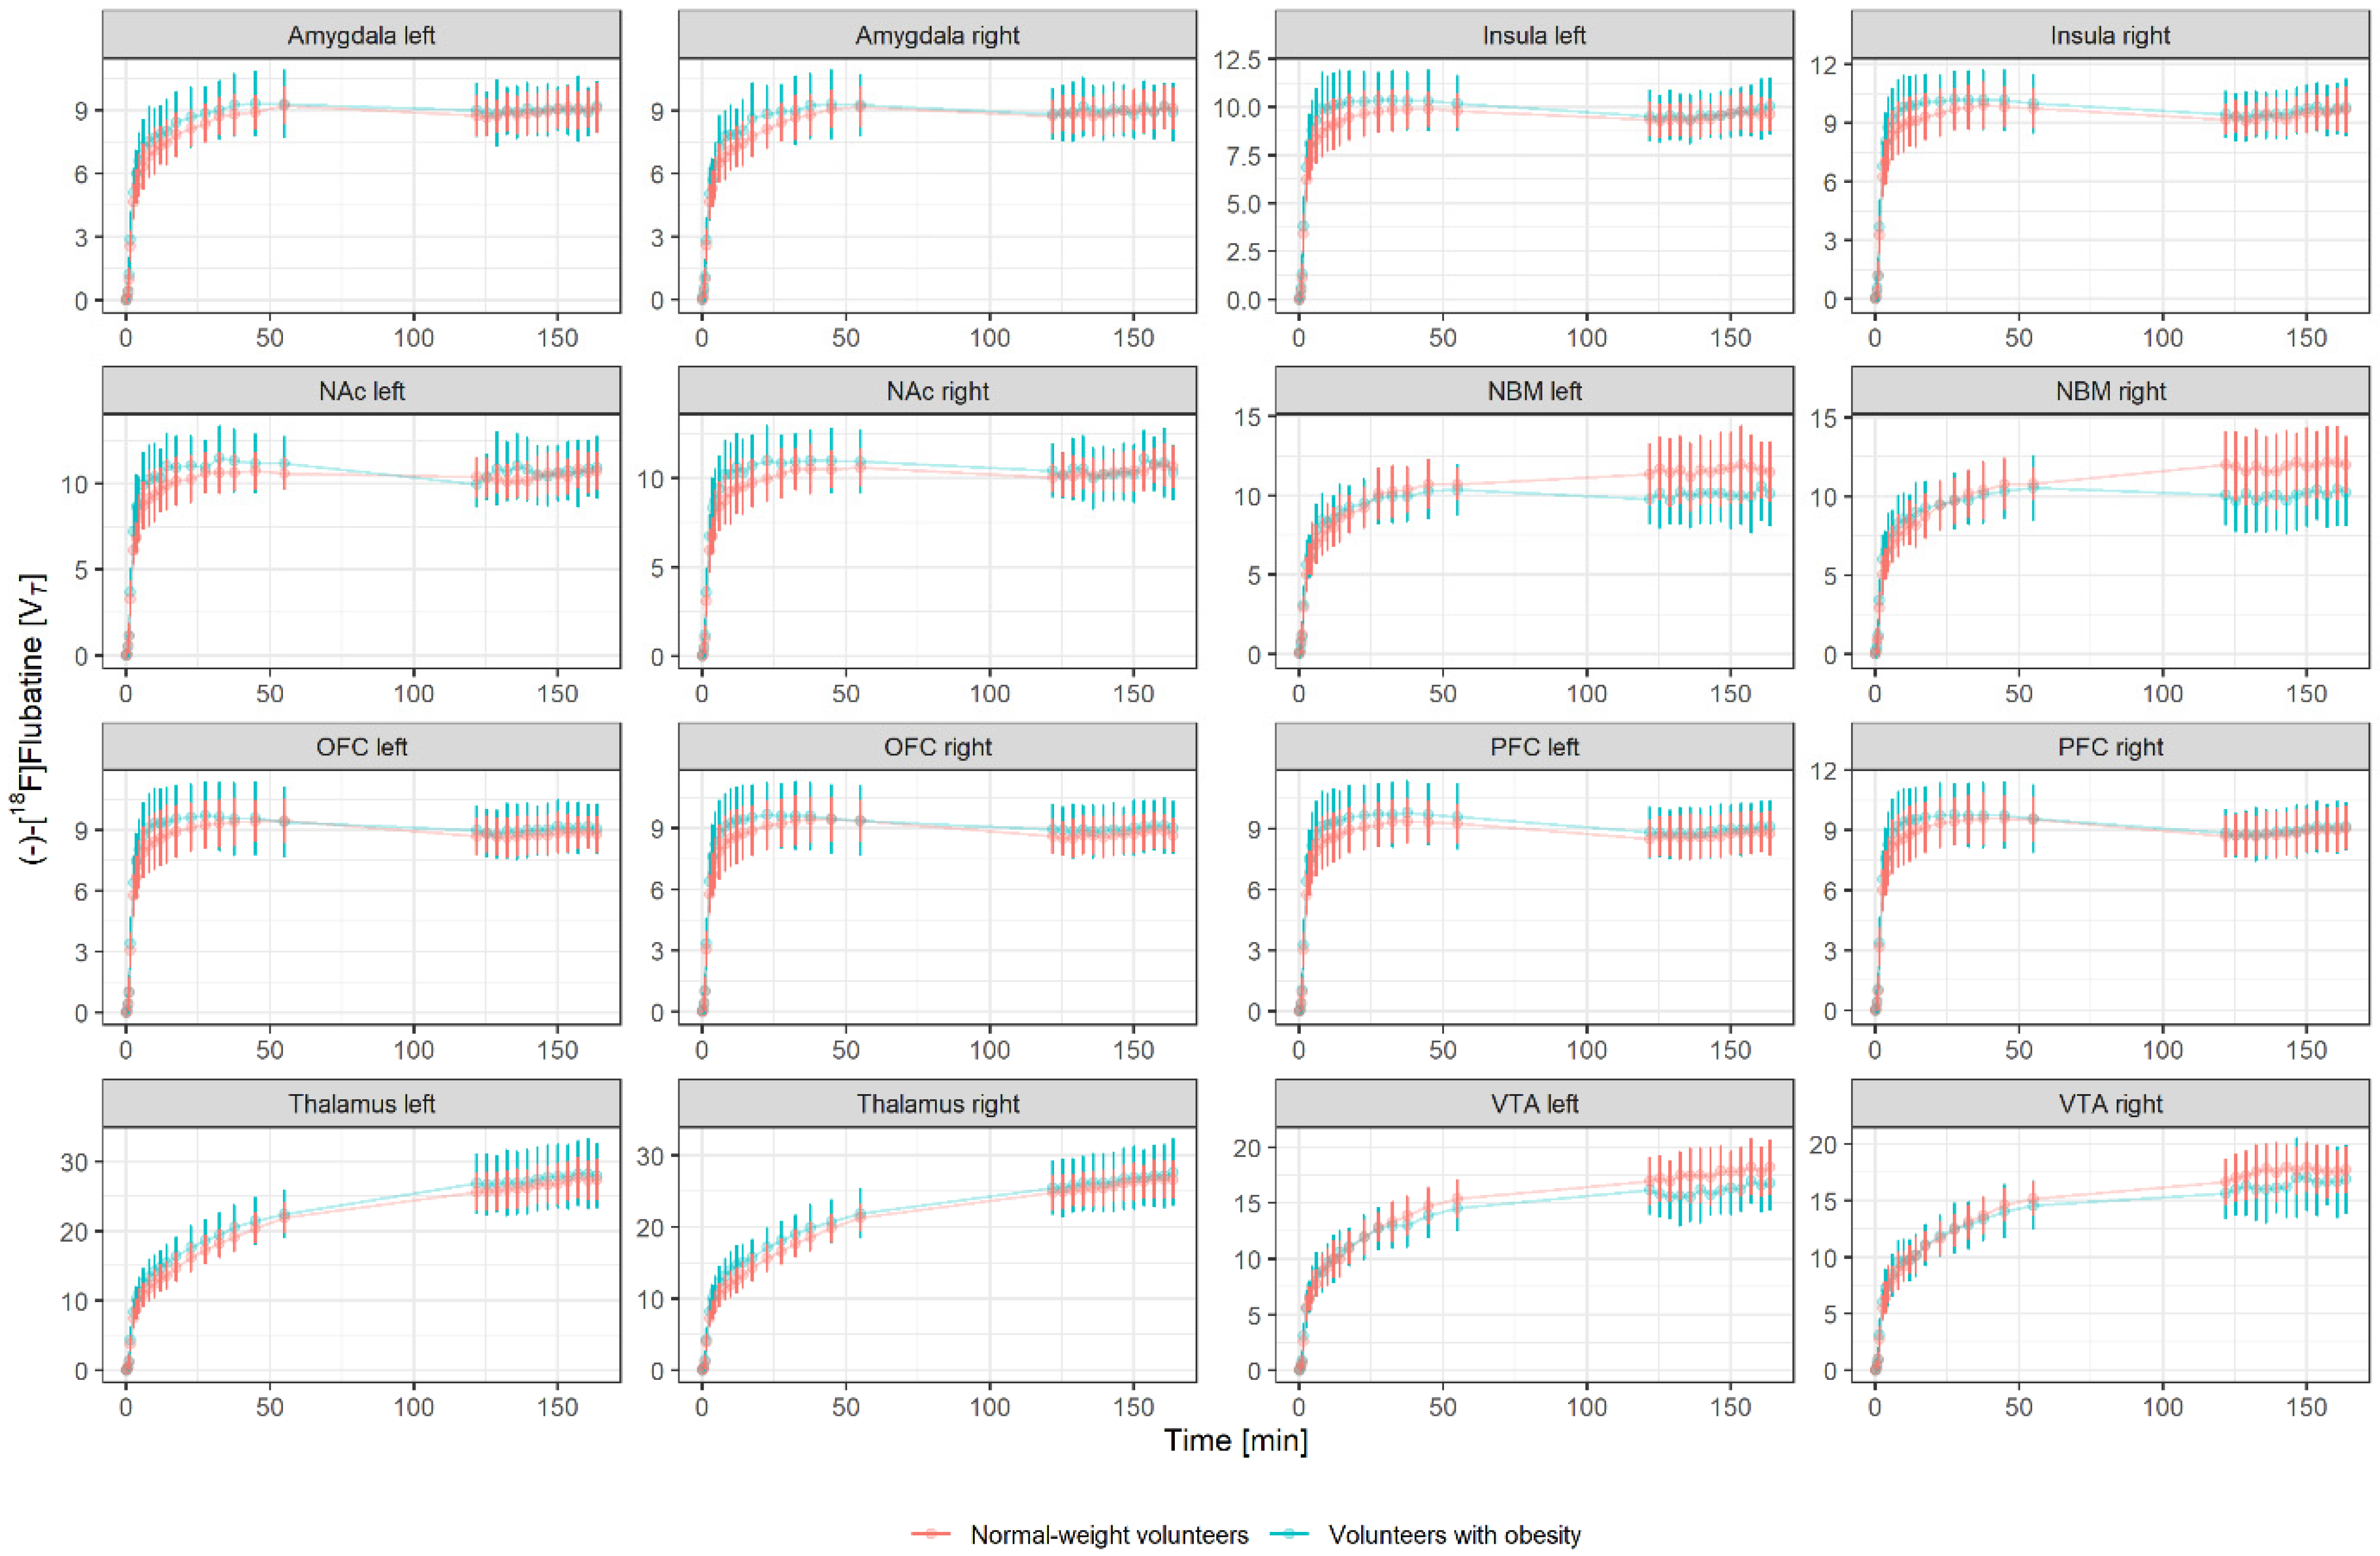
| Amygdala | Left | 9.00 | 1.2 | 8.91 | 0.9 | 0.55 |
| Right | 8.99 | 1.3 | 8.93 | 0.9 | 0.66 | |
| Insula | Left | 9.63 | 1.3 | 9.49 | 0.9 | 0.40 |
| Right | 9.55 | 1.3 | 9.40 | 0.9 | 0.44 | |
| Nucleus accumbens | Left | 10.60 | 1.7 | 10.40 | 1.0 | 0.62 |
| Right | 10.40 | 1.5 | 10.40 | 1.0 | 0.70 | |
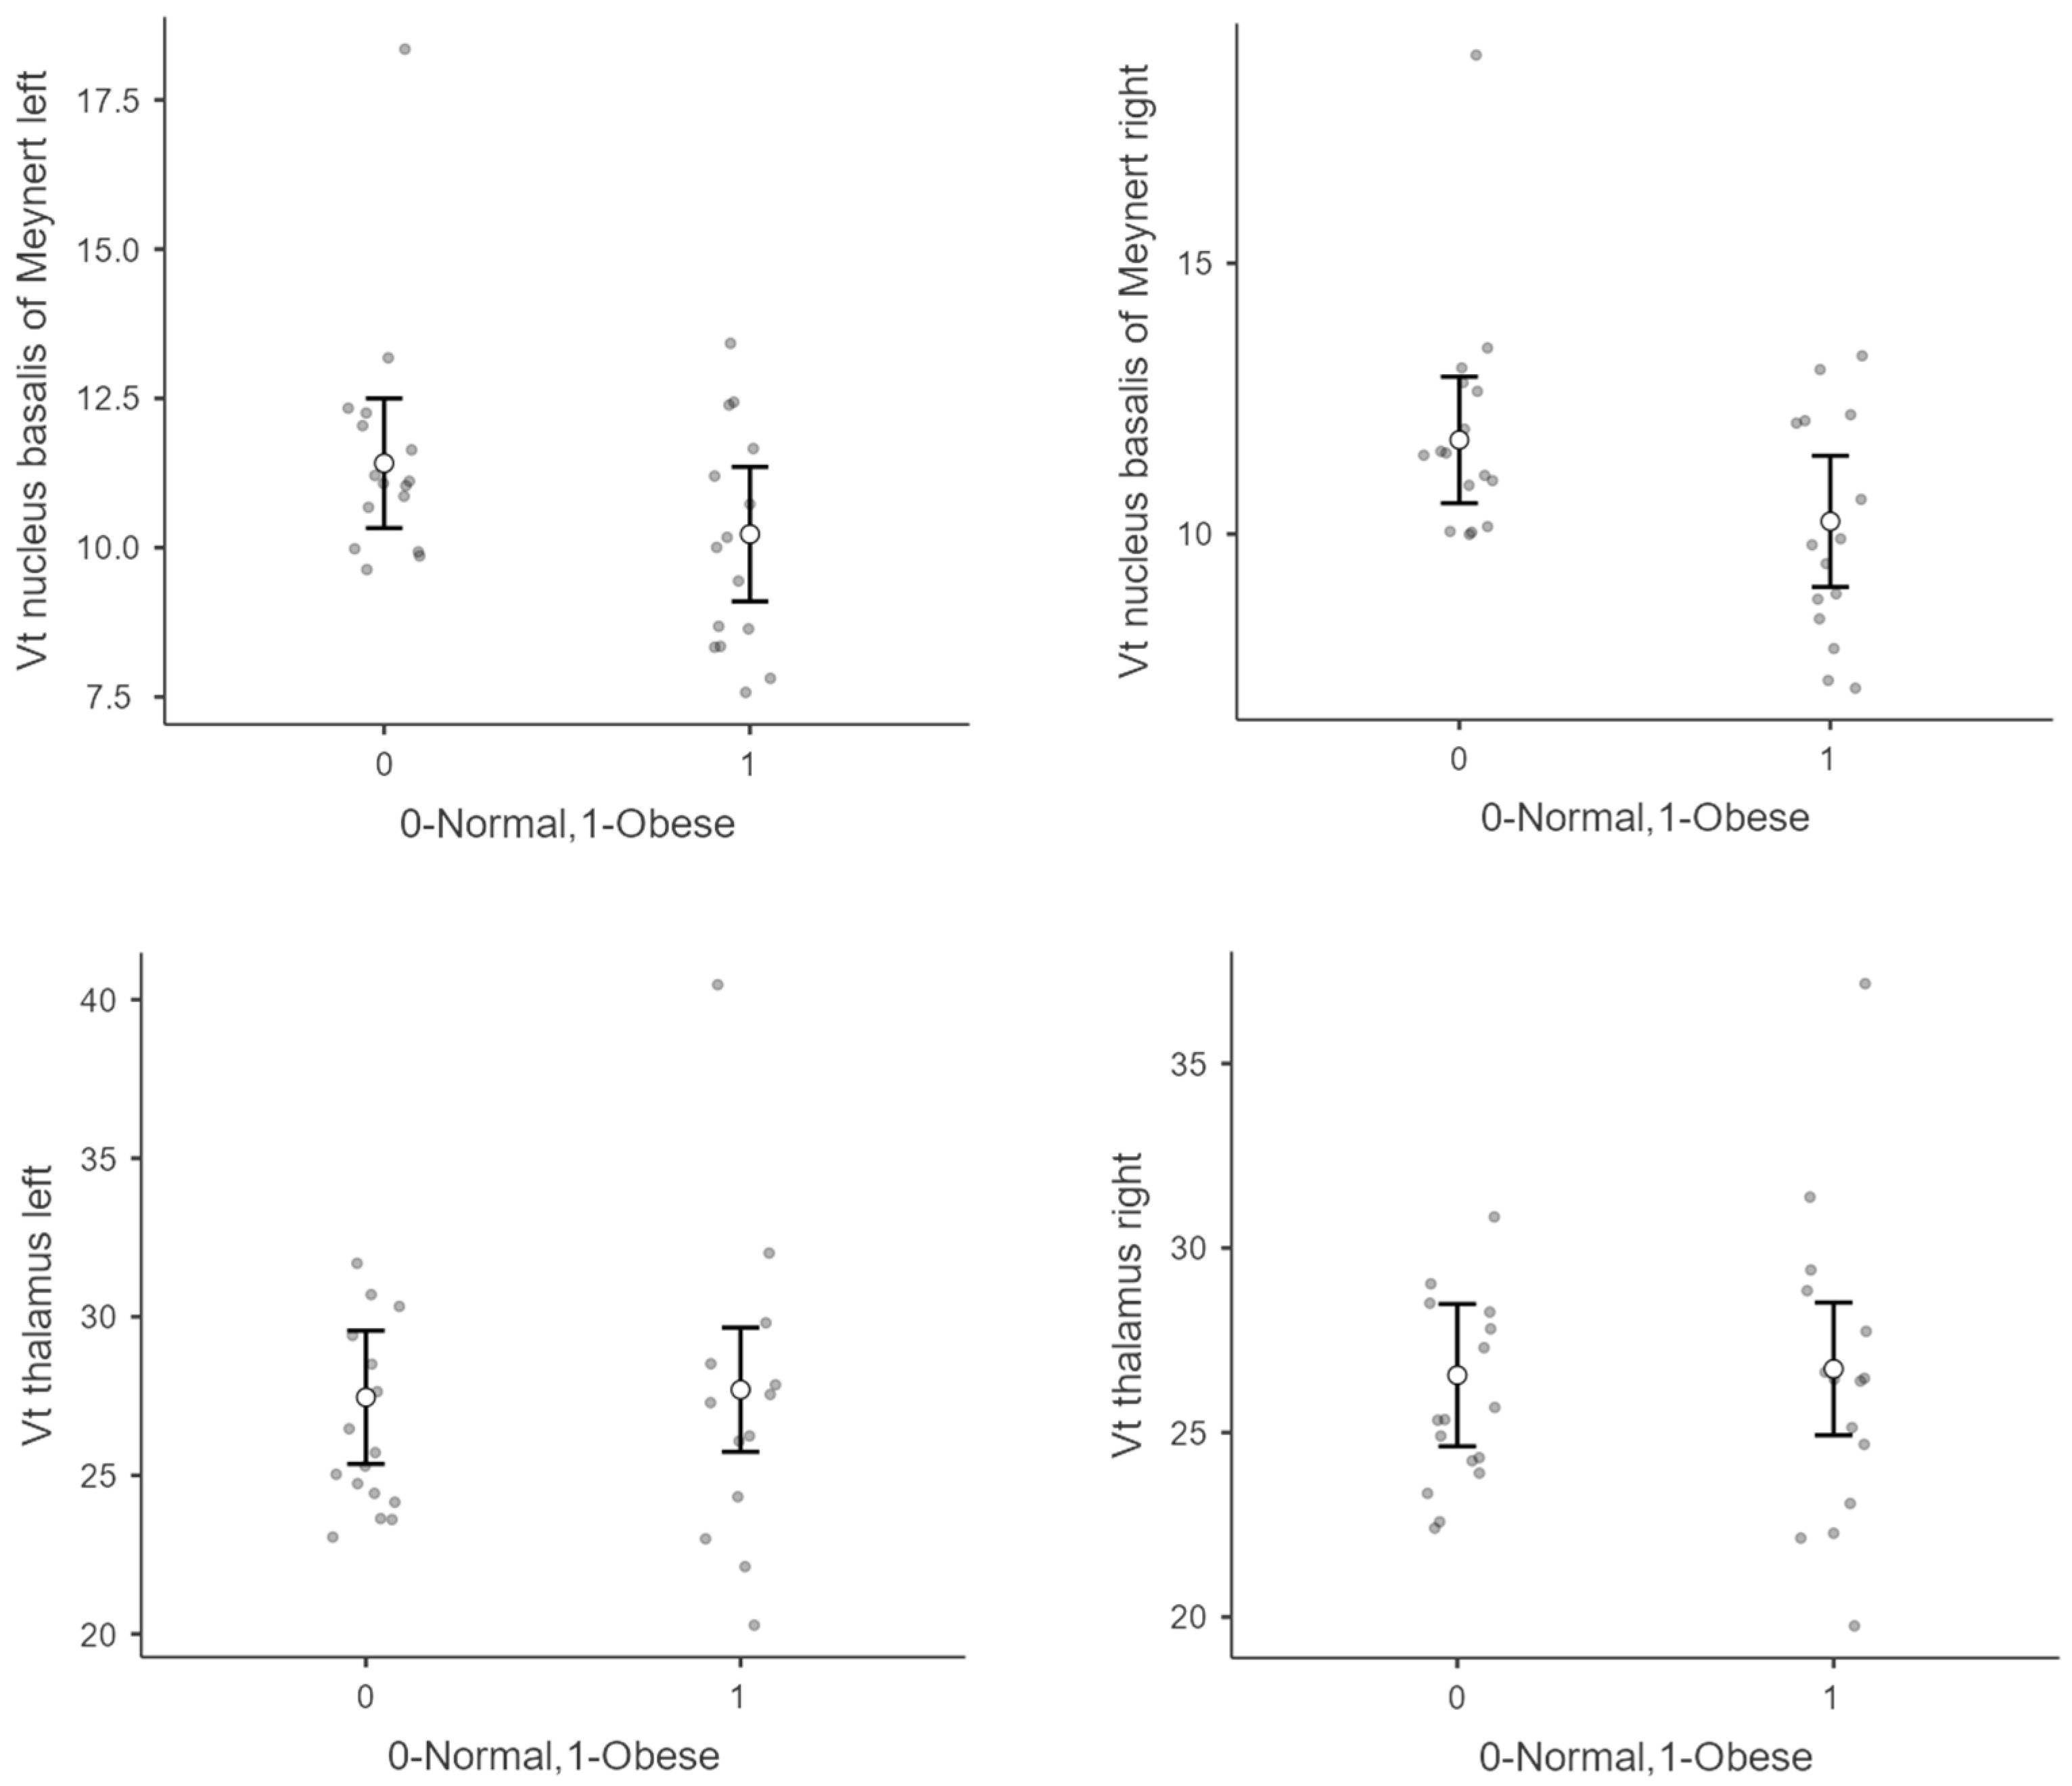
| Nucleus basalis of Meynert | Left | 10.10 | 1.9 | 11.60 | 2.1 | 0.16 |
| Right | 10.10 | 2.1 | 11.90 | 2.2 | 0.10 | |
| Orbitofrontal cortex | Left | 9.03 | 1.3 | 8.77 | 0.9 | 0.46 |
| Right | 8.97 | 1.3 | 8.68 | 0.9 | 0.42 | |
| Prefrontal cortex | Left | 8.88 | 1.3 | 8.67 | 1.1 | 0.35 |
| Right | 8.96 | 1.2 | 8.87 | 1.1 | 0.43 | |
| Thalamus | Left | 27.40 | 4.7 | 26.50 | 2.8 | 0.15 |
| Right | 26.50 | 4.2 | 25.90 | 2.5 | 0.09 | |
| Ventral tegmental area | Left | 16.10 | 2.2 | 17.60 | 2.2 | 0.38 |
| Right | 16.40 | 2.6 | 17.50 | 2.1 | 0.61 | |
| Individuals with Obesity (n = 15) | Normal-Weight Controls (n = 16) | |||||||
|---|---|---|---|---|---|---|---|---|
| Region | Control | Disinhibition | Hunger | Control | Disinhibition | Hunger | ||
| Amygdala | Left | r | −0.125 | −0.114 | 0.251 | 0.127 | 0.327 | 0.137 |
| p | 0.460 | 0.698 | 0.387 | 0.653 | 0.235 | 0.628 | ||
| Right | r | −0.261 | 0.007 | 0.333 | 0.186 | 0.292 | 0.191 | |
| p | 0.367 | 0.982 | 0.245 | 0.506 | 0.292 | 0.495 | ||
| Insula | Left | r | −0.241 | 0.087 | 0.432 | 0.124 | 0.194 | 0.160 |
| p | 0.406 | 0.767 | 0.123 | 0.660 | 0.488 | 0.569 | ||
| Right | r | −0.254 | −0.005 | 0.403 | 0.150 | 0.289 | 0.200 | |
| p | 0.381 | 0.987 | 0.153 | 0.594 | 0.297 | 0.475 | ||
| Nucleus accumbens | Left | r | −0.375 | −0.015 | 0.320 | −0.011 | 0.278 | 0.153 |
| p | 0.186 | 0.959 | 0.265 | 0.970 | 0.315 | 0.587 | ||
| Right | r | −0.319 | 0.077 | 0.382 | 0.183 | 0.483 | 0.362 | |
| p | 0.266 | 0.793 | 0.178 | 0.514 | 0.068 | 0.185 | ||
| Nucleus basalis of Meynert | Left | r | −0.274 | 0.047 | 0.219 | −0.150 | 0.276 | 0.117 |
| p | 0.344 | 0.873 | 0.452 | 0.595 | 0.320 | 0.679 | ||
| Right | r | −0.257 | 0.080 | 0.275 | −0.047 | 0.119 | 0.067 | |
| p | 0.374 | 0.785 | 0.342 | 0.868 | 0.673 | 0.811 | ||
| Orbitofrontal cortex | Left | r | −0.318 | −0.045 | 0.380 | 0.320 | 0.321 | 0.245 |
| p | 0.268 | 0.879 | 0.180 | 0.244 | 0.243 | 0.379 | ||
| Right | r | −0.307 | −0.065 | 0.408 | 0.310 | 0.310 | 0.272 | |
| p | 0.286 | 0.825 | 0.148 | 0.260 | 0.260 | 0.326 | ||
| Prefrontal cortex | Left | r | −0.347 | 0.142 | 0.467 | 0.225 | 0.263 | 0.205 |
| p | 0.225 | 0.628 | 0.092 | 0.350 | 0.344 | 0.464 | ||
| Right | r | −0.279 | 0.068 | 0.449 | 0.223 | 0.374 | 0.170 | |
| p | 0.334 | 0.819 | 0.108 | 0.424 | 0.170 | 0.545 | ||
| Thalamus | Left | r | −0.491 | −0.193 | 0.144 | 0.306 | 0.043 | 0.079 |
| p | 0.334 | 0.509 | 0.623 | 0.267 | 0.89 | 0.781 | ||
| Right | r | −0.356 | 0.007 | 0.153 | 0.236 | 0.020 | 0.048 | |
| p | 0.211 | 0.980 | 0.602 | 0.396 | 0.944 | 0.865 | ||
| Ventral tegmental area | Left | r | −0.291 | 0.061 | 0.523 | 0.210 | 0.038 | 0.183 |
| p | 0.313 | 0.836 | 0.055 | 0.452 | 0.892 | 0.515 | ||
| Right | r | −0.300 | 0.015 | 0.449 | 0.257 | 0.118 | 0.285 | |
| p | 0.298 | 0.960 | 0.107 | 0.356 | 0.675 | 0.302 | ||
Publisher’s Note: MDPI stays neutral with regard to jurisdictional claims in published maps and institutional affiliations. |
© 2022 by the authors. Licensee MDPI, Basel, Switzerland. This article is an open access article distributed under the terms and conditions of the Creative Commons Attribution (CC BY) license (https://creativecommons.org/licenses/by/4.0/).
Share and Cite
Schweickert de Palma, E.; Günnewig, T.; Rullmann, M.; Luthardt, J.; Hankir, M.K.; Meyer, P.M.; Becker, G.-A.; Patt, M.; Martin, S.; Hilbert, A.; et al. Availability of Central α4β2* Nicotinic Acetylcholine Receptors in Human Obesity. Brain Sci. 2022, 12, 1648. https://doi.org/10.3390/brainsci12121648
Schweickert de Palma E, Günnewig T, Rullmann M, Luthardt J, Hankir MK, Meyer PM, Becker G-A, Patt M, Martin S, Hilbert A, et al. Availability of Central α4β2* Nicotinic Acetylcholine Receptors in Human Obesity. Brain Sciences. 2022; 12(12):1648. https://doi.org/10.3390/brainsci12121648
Chicago/Turabian StyleSchweickert de Palma, Eva, Tilman Günnewig, Michael Rullmann, Julia Luthardt, Mohammed K. Hankir, Philipp M. Meyer, Georg-Alexander Becker, Marianne Patt, Sarah Martin, Anja Hilbert, and et al. 2022. "Availability of Central α4β2* Nicotinic Acetylcholine Receptors in Human Obesity" Brain Sciences 12, no. 12: 1648. https://doi.org/10.3390/brainsci12121648
APA StyleSchweickert de Palma, E., Günnewig, T., Rullmann, M., Luthardt, J., Hankir, M. K., Meyer, P. M., Becker, G.-A., Patt, M., Martin, S., Hilbert, A., Blüher, M., Sabri, O., & Hesse, S. (2022). Availability of Central α4β2* Nicotinic Acetylcholine Receptors in Human Obesity. Brain Sciences, 12(12), 1648. https://doi.org/10.3390/brainsci12121648