

In Vivo Tau Burden Is Associated with Abnormal Brain Functional Connectivity in Alzheimer’s Disease: A 18F-Florzolotau Study

 ,
,  and
and
Abstract
1. Introduction
2. Materials and Methods
2.1. Participants
2.2. Acquisition Protocol
2.3. Data Pre-Processing
2.4. Brain Network Analysis
2.4.1. Functional Connection Strength
2.4.2. Proportional Loss of Connectional Strength
2.5. Semi-Quantitative ROI-Based PET Analyses
2.6. Comparison of PLFCS along AD Spectrum
2.7. Correlation between Proportional Loss and Clinical Scales
2.8. Statistical Analysis
3. Results
3.1. Demographic
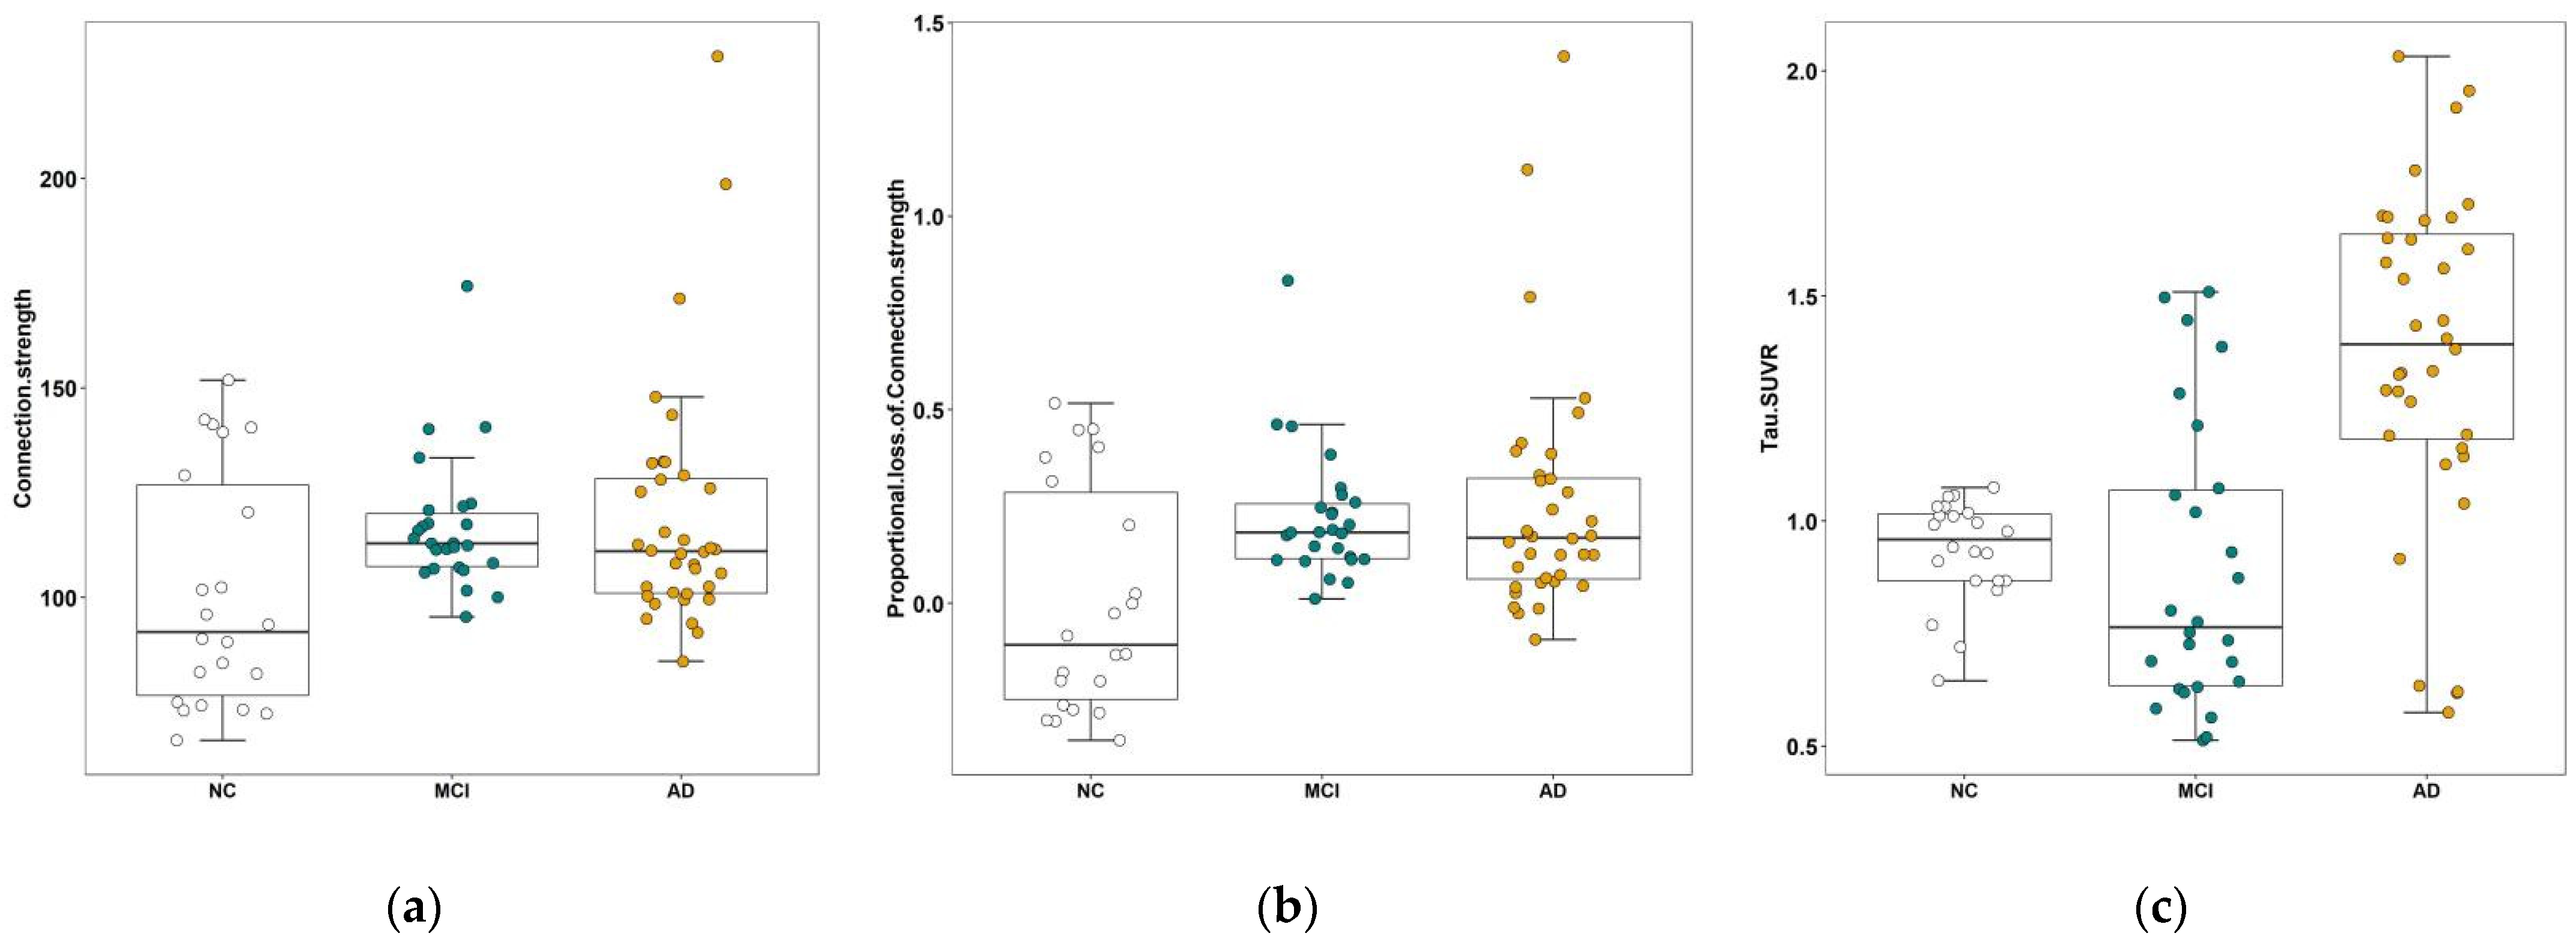
3.2. Results of PLFCS and Tau Level
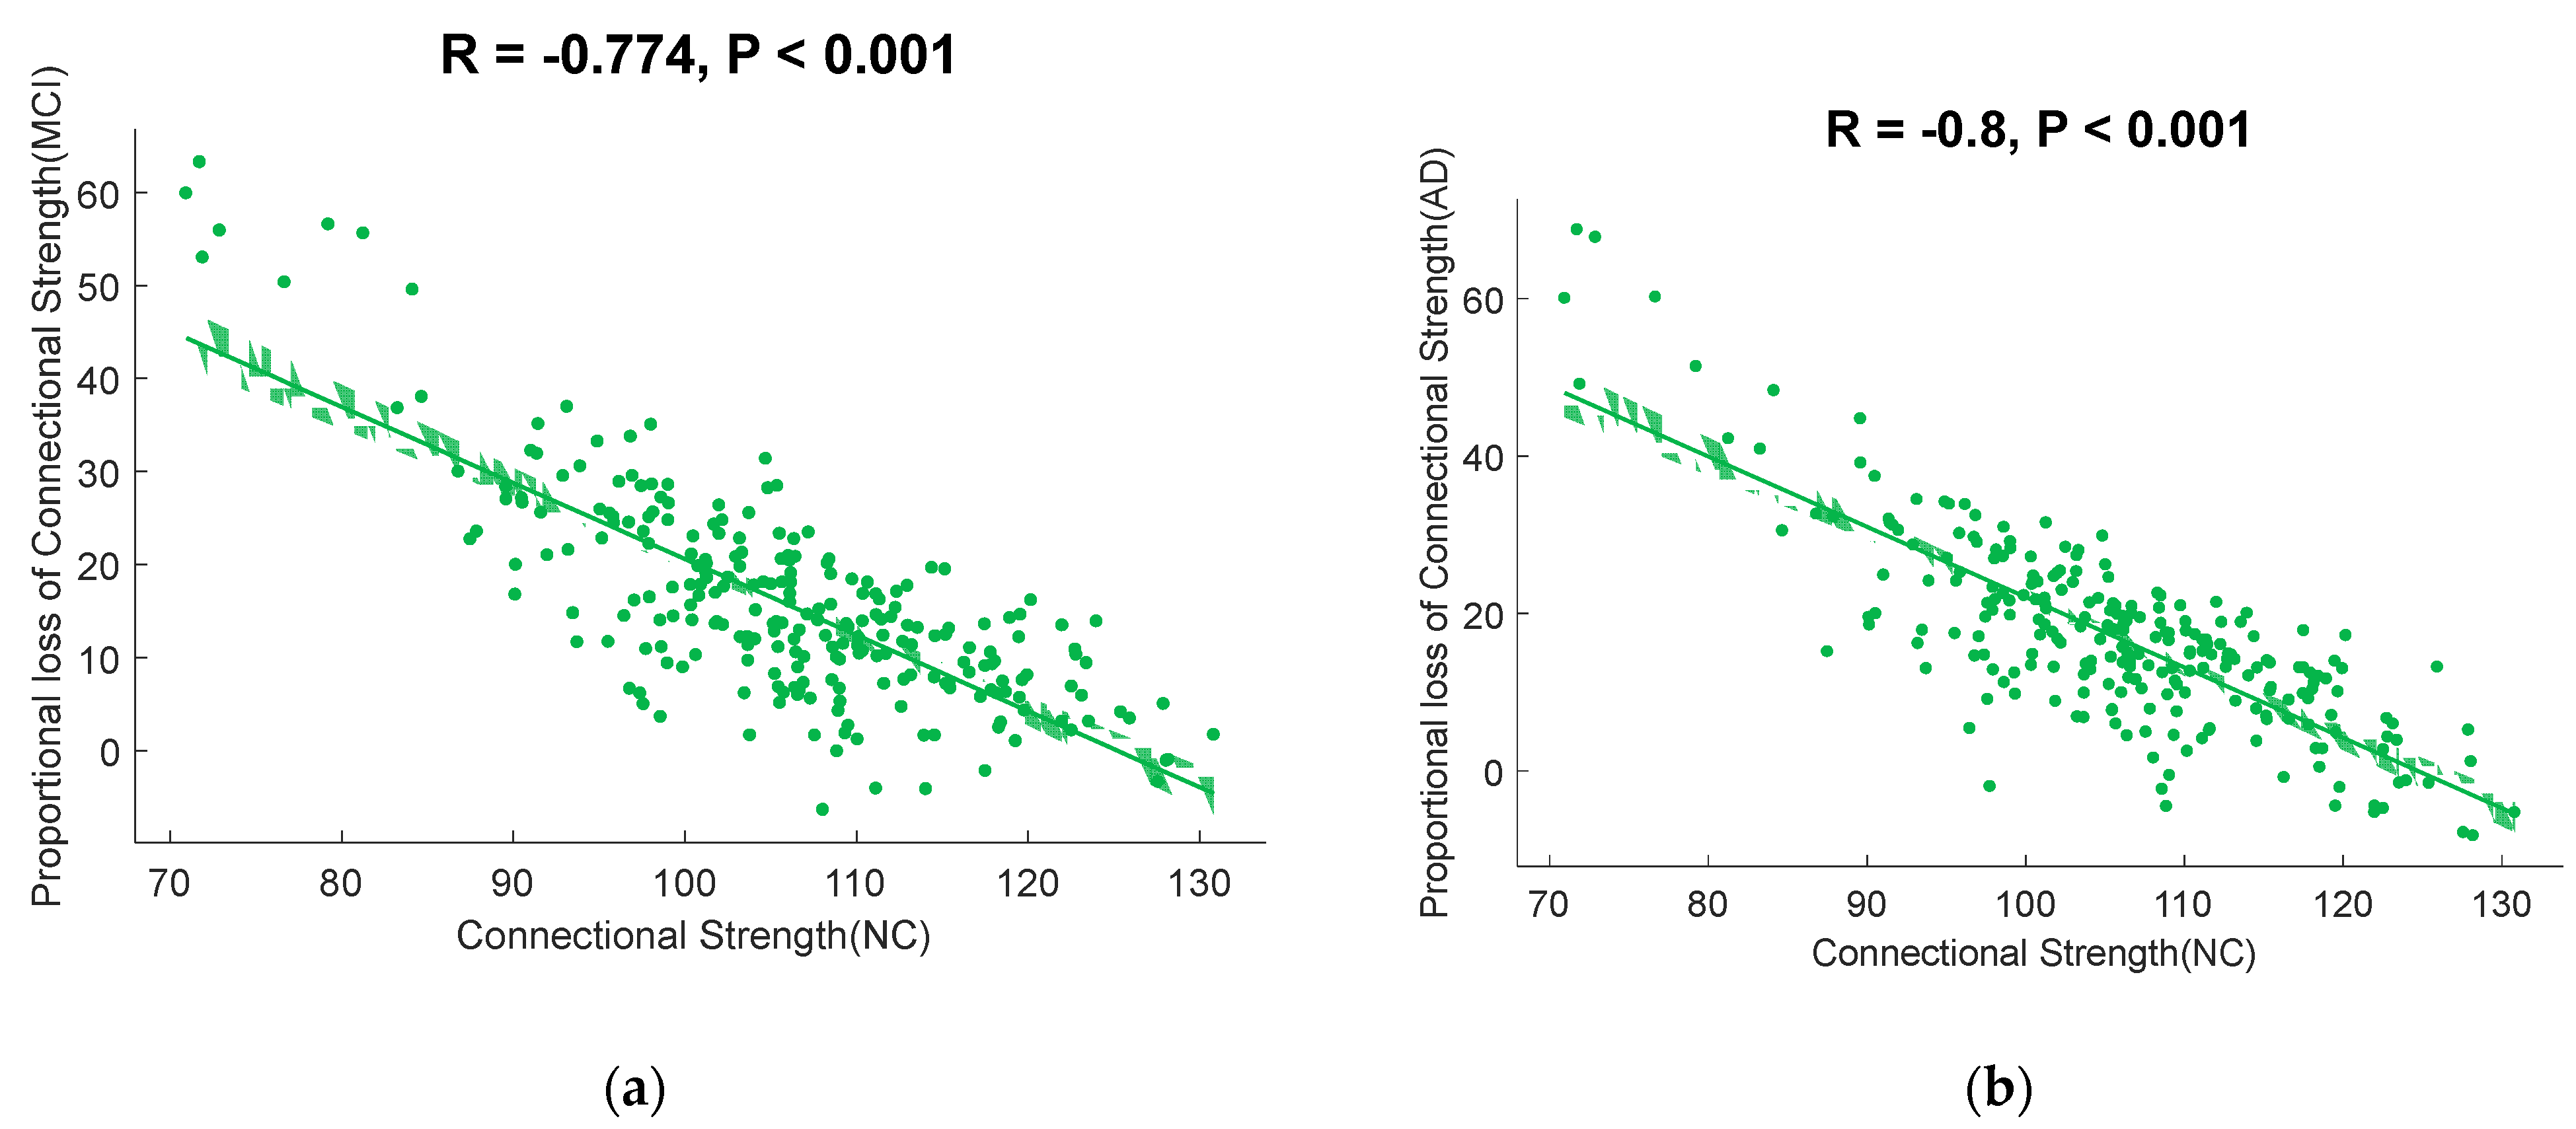
3.3. Correlation of FC and PLFCS
4. Discussion
5. Conclusions
Author Contributions
Funding
Institutional Review Board Statement
Informed Consent Statement
Data Availability Statement
Acknowledgments
Conflicts of Interest
References
- Zhang, Z.; Yang, X.; Song, Y.Q.; Tu, J. Autophagy in Alzheimer’s disease pathogenesis: Therapeutic potential and future perspectives. Ageing Res. Rev. 2021, 72, 101464. [Google Scholar] [CrossRef] [PubMed]
- Risacher, S.L.; Saykin, A.J. Neuroimaging in aging and neurologic diseases. Handb. Clin. Neurol. 2019, 167, 191–227. [Google Scholar]
- Jack, C.R., Jr.; Knopman, D.S.; Jagust, W.J.; Shaw, L.M.; Aisen, P.S.; Weiner, M.W.; Petersen, R.C.; Trojanowski, J.Q. Hypothetical model of dynamic biomarkers of the Alzheimer’s pathological cascade. Lancet Neurol. 2010, 9, 119–128. [Google Scholar] [CrossRef]
- Kang, J.M.; Lee, S.Y.; Seo, S.; Jeong, H.J.; Woo, S.H.; Lee, H.; Lee, Y.B.; Yeon, B.K.; Shin, D.H.; Park, K.H.; et al. Tau positron emission tomography using [18F]THK5351 and cerebral glucose hypometabolism in Alzheimer’s disease. Neurobiol. Aging 2017, 59, 210–219. [Google Scholar] [CrossRef] [PubMed]
- Kitamura, S.; Shimada, H.; Niwa, F.; Endo, H.; Shinotoh, H.; Takahata, K.; Kubota, M.; Takado, Y.; Hirano, S.; Kimura, Y.; et al. Tau-induced focal neurotoxicity and network disruption related to apathy in Alzheimer’s disease. J. Neurol. Neurosurg. Psychiatry 2018, 89, 1208–1214. [Google Scholar] [CrossRef] [PubMed]
- Landau, S.M.; Fero, A.; Baker, S.L.; Koeppe, R.; Mintun, M.; Chen, K.; Reiman, E.M.; Jagust, W.J. Measurement of longitudinal β-amyloid change with 18F-florbetapir PET and standardized uptake value ratios. J. Nucl. Med. 2015, 56, 567–574. [Google Scholar] [CrossRef] [PubMed]
- Leuzy, A.; Chiotis, K.; Lemoine, L.; Gillberg, P.G.; Almkvist, O.; Rodriguez-Vieitez, E.; Nordberg, A. Tau PET imaging in neurodegenerative tauopathies-still a challenge. Mol. Psychiatry 2019, 24, 1112–1134. [Google Scholar] [CrossRef] [PubMed]
- Lohith, T.G.; Bennacef, I.; Vandenberghe, R.; Vandenbulcke, M.; Salinas, C.A.; Declercq, R.; Reynders, T.; Telan-Choing, N.F.; Riffel, K.; Celen, S.; et al. Brain imaging of Alzheimer dementia patients and elderly controls with 18F-MK-6240, a PET tracer targeting neurofibrillary tangles. J. Nucl. Med. 2019, 60, 107–114. [Google Scholar] [CrossRef]
- Lu, J.; Bao, W.; Li, M.; Li, L.; Zhang, Z.; Alberts, I.; Brendel, M.; Cumming, P.; Lu, H.; Xiao, Z.; et al. Associations of [18F]-APN-1607 Tau PET Binding in the Brain of Alzheimer’s Disease Patients With Cognition and Glucose Metabolism. Front. Neurosci. 2020, 14, 604. [Google Scholar] [CrossRef] [PubMed]
- Smith, R.; Puschmann, A.; Schöll, M.; Ohlsson, T.; van Swieten, J.; Honer, M.; Englund, E.; Hansson, O. 18F-AV-1451 tau PET imaging correlates strongly with tau neuropathology in MAPT mutation carriers. Brain 2016, 139, 2372–2379. [Google Scholar] [CrossRef]
- Buckner, R.L.; Sepulcre, J.; Talukdar, T.; Krienen, F.M.; Liu, H.; Hedden, T.; Andrews-Hanna, J.R.; Sperling, R.A.; Johnson, K.A. Cortical hubs revealed by intrinsic functional connectivity: Mapping, assessment of stability, and relation to Alzheimer’s disease. J. Neurosci. 2009, 29, 1860–1873. [Google Scholar] [CrossRef]
- Crossley, N.A.; Mechelli, A.; Scott, J.; Carletti, F.; Fox, P.T.; McGuire, P.; Bullmore, E.T. The hubs of the human connectome are generally implicated in the anatomy of brain disorders. Brain 2014, 137 Pt 8, 2382–2395. [Google Scholar] [CrossRef] [PubMed]
- Dai, Z.; Yan, C.; Li, K.; Wang, Z.; Wang, J.; Cao, M.; Lin, Q.; Shu, N.; Xia, M.; Bi, Y.; et al. Identifying and mapping connectivity patterns of brain network hubs in Alzheimer’s disease. Cereb. Cortex 2015, 25, 3723–3742. [Google Scholar] [CrossRef]
- Li, H.; Gao, S.; Jia, X.; Jiang, T.; Li, K. Distinctive Alterations of Functional Connectivity Strength between Vascular and Amnestic Mild Cognitive Impairment. Neural Plast. 2021, 2021, 8812490. [Google Scholar] [CrossRef] [PubMed]
- Zhu, Q.; Wang, Y.; Zhuo, C.; Xu, Q.; Yao, Y.; Liu, Z.; Li, Y.; Sun, Z.; Wang, J.; Lv, M.; et al. Classification of Alzheimer’s Disease Based on Abnormal Hippocampal Functional Connectivity and Machine Learning. Front. Aging Neurosci. 2022, 14, 754334. [Google Scholar] [CrossRef] [PubMed]
- Fu, L.; Zhou, Z.; Liu, L.; Zhang, J.; Xie, H.; Zhang, X.; Zhu, M.; Wang, R. Functional Abnormality Associated with Tau Deposition in Alzheimer’s Disease—A Hybrid Positron Emission Tomography/MRI Study. Front. Aging Neurosci. 2021, 13, 758053. [Google Scholar] [CrossRef] [PubMed]
- Adams, J.N.; Maass, A.; Harrison, T.M.; Baker, S.L.; Jagust, W.J. Cortical tau deposition follows patterns of entorhinal functional connectivity in aging. eLife 2019, 8, e49132. [Google Scholar] [CrossRef] [PubMed]
- Hansson, O.; Grothe, M.J.; Strandberg, T.O.; Ohlsson, T.; Hägerström, D.; Jögi, J.; Smith, R.; Schöll, M. Tau Pathology Distribution in Alzheimer’s disease Corresponds Differentially to Cognition-Relevant Functional Brain Networks. Front. Neurosci. 2017, 11, 167. [Google Scholar] [CrossRef] [PubMed]
- Hoenig, M.C.; Bischof, G.N.; Seemiller, J.; Hammes, J.; Kukolja, J.; Onur, Ö.A.; Jessen, F.; Fliessbach, K.; Neumaier, B.; Fink, G.R.; et al. Networks of tau distribution in Alzheimer’s disease. Brain 2018, 141, 568–581. [Google Scholar] [CrossRef] [PubMed]
- Franzmeier, N.; Neitzel, J.; Rubinski, A.; Smith, R.; Strandberg, O.; Ossenkoppele, R.; Hansson, O.; Ewers, M.; Alzheimer’s Disease Neuroimaging Initiative (ADNI). Functional brain architecture is associated with the rate of tau accumulation in Alzheimer’s disease. Nat. Commun. 2020, 11, 347. [Google Scholar] [CrossRef] [PubMed]
- Franzmeier, N.; Rubinski, A.; Neitzel, J.; Kim, Y.; Damm, A.; Na, D.L.; Kim, H.J.; Lyoo, C.H.; Cho, H.; Finsterwalder, S.; et al. Functional connectivity associated with tau levels in ageing. Alzheimer’s, and small vessel disease. Brain 2019, 142, 1093–1107. [Google Scholar] [CrossRef]
- Cope, T.E.; Rittman, T.; Borchert, R.J.; Jones, P.S.; Vatansever, D.; Allinson, K.; Passamonti, L.; Rodriguez, P.V.; Bevan-Jones, W.R.; O’Brien, J.T.; et al. Tau burden and the functional connectome in Alzheimer’s disease and progressive supranuclear palsy. Brain 2018, 141, 550–567. [Google Scholar] [CrossRef] [PubMed]
- Achard, S.; Delon-Martin, C.; Vértes, P.E.; Renard, F.; Schenck, M.; Schneider, F.; Heinrich, C.; Kremer, S.; Bullmore, E.T. Hubs of brain functional networks are radically reorganized in comatose patients. Proc. Natl. Acad. Sci. USA 2012, 109, 20608–20613. [Google Scholar] [CrossRef] [PubMed]
- Petersen, R.C. Mild cognitive impairment as a diagnostic entity. J. Intern. Med. 2004, 256, 183–194. [Google Scholar] [CrossRef] [PubMed]
- McKhann, G.M.; Knopman, D.S.; Chertkow, H.; Hyman, B.T.; Jack, C.R., Jr.; Kawas, C.H.; Klunk, W.E.; Koroshetz, W.J.; Manly, J.J.; Mayeux, R.; et al. The diagnosis of dementia due to Alzheimer’sdisease: Recommendations from the National Institute on Aging-Alzheimer’s Association workgroups on diagnostic guidelines for Alzheimer’s disease. Alzheimer’s Dement. 2011, 7, 263–269. [Google Scholar] [CrossRef] [PubMed]
- Rittman, T.; Rubinov, M.; Vértes, P.E.; Patel, A.X.; Ginestet, C.E.; Ghosh, B.C.P.; Barker, R.A.; Spillantini, M.G.; Bullmore, E.T.; Rowe, J.B. Regional expression of the MAPT gene is associated with loss of hubs in brain networks and cognitive impairment in Parkinson disease and progressive supranuclear palsy. Neurobiol. Aging 2016, 48, 153–160. [Google Scholar] [CrossRef]
- Cho, H.; Choi, J.Y.; Lee, H.S.; Lee, J.H.; Ryu, Y.H.; Lee, M.S.; Jack, C.R., Jr.; Lyoo, C.H. Progressive Tau Accumulation in Alzheimer Disease: 2-Year Follow-up Study. J. Nucl. Med. 2019, 60, 1611–1621. [Google Scholar] [CrossRef] [PubMed]
- Bakkour, A.; Morris, J.C.; Dickerson, B.C. The cortical signature of prodromal AD: Regional thinning predicts mild AD dementia. Neurology 2009, 72, 1048–1055. [Google Scholar] [CrossRef] [PubMed]
- Tsvetanov, K.A.; Henson, R.N.; Tyler, L.K.; Razi, A.; Geerligs, L.; Ham, T.E.; Rowe, J.B.; Cambridge Centre for Ageing and Neuroscience. Extrinsic and Intrinsic Brain Network Connectivity Maintains Cognition across the Lifespan Despite Accelerated Decay of Regional Brain Activation. J. Neurosci. 2016, 36, 3115–3126. [Google Scholar] [CrossRef] [PubMed]
- Strogatz, S.H. Exploring complex networks. Nature 2001, 410, 268–276. [Google Scholar] [CrossRef]
- Markesbery, W.R. Neuropathologic alterations in mild cognitive impairment: A review. J. Alzheimer’s Dis. 2010, 19, 221–228. [Google Scholar] [CrossRef] [PubMed]
- Adriaanse, S.M.; Wink, A.M.; Tijms, B.M.; Ossenkoppele, R.; Verfaillie, S.C.; Lammertsma, A.A.; Boellaard, R.; Scheltens, P.; van Berckel, B.N.; Barkhof, F. The Association of Glucose Metabolism and Eigenvector Centrality in Alzheimer’s Disease. Brain Connect. 2016, 6, 1–8. [Google Scholar] [CrossRef] [PubMed]
- Luo, X.; Qiu, T.; Jia, Y.; Huang, P.; Xu, X.; Yu, X.; Shen, Z.; Jiaerken, Y.; Guan, X.; Zhou, J.; et al. ADNI Intrinsic functional connectivity alterations in cognitively intact elderly APOE ε4 carriers measured by eigenvector centrality mapping are related to cognition and CSF biomarkers: A preliminary study. Brain Imaging Behav. 2017, 11, 1290–1301. [Google Scholar] [CrossRef] [PubMed]
- Ossenkoppele, R.; van der Flier, W.M.; Zwan, M.D.; Adriaanse, S.F.; Boellaard, R.; Windhorst, A.D.; Barkhof, F.; Lammertsma, A.A.; Scheltens, P.; van Berckel, B.N. Differential effect of APOE genotype on amyloid load and glucose metabolism in AD dementia. Neurology 2013, 80, 359–365. [Google Scholar] [CrossRef]
- Binnewijzend, M.A.; Adriaanse, S.M.; Van der Flier, W.M.; Teunissen, C.E.; de Munck, J.C.; Stam, C.J.; Scheltens, P.; van Berckel, B.N.; Barkhof, F.; Wink, A.M. Brain network alterations in Alzheimer’s disease measured by eigenvector centrality in fMRI are related to cognition and CSF biomarkers. Hum. Brain Mapp. 2014, 35, 2383–2393. [Google Scholar] [CrossRef] [PubMed]
- Courtney, S.M.; Hinault, T. When the time is right: Temporal dynamics of brain activity in healthy aging and dementia. Prog. Neurobiol. 2021, 203, 102076. [Google Scholar] [CrossRef] [PubMed]
- Yang, Z.; Caldwell, J.Z.K.; Cummings, J.L.; Ritter, A.; Kinney, J.W.; Cordes, D. Alzheimer’s Disease Neuroimaging Initiative (ADNI). Sex Modulates the Pathological Aging Effect on Caudate Functional Connectivity in Mild Cognitive Impairment. Front. Psychiatry 2022, 13, 804168. [Google Scholar] [PubMed]
- Li, M.; Zheng, G.; Zheng, Y.; Xiong, Z.; Xia, R.; Zhou, W.; Wang, Q.; Liang, S.; Tao, J.; Chen, L. Alterations in resting-state functional connectivity of the default mode network in amnestic mild cognitive impairment: An fMRI study. BMC Med. Imaging 2017, 17, 48. [Google Scholar] [CrossRef]
- Stebbins, G.T.; Nyenhuis, D.L.; Wang, C.; Cox, J.L.; Freels, S.; Bangen, K.; deToledo-Morrell, L.; Sripathirathan, K.; Moseley, M.; Turner, D.A.; et al. Gray matter atrophy in patients with ischemic stroke with cognitive impairment. Stroke 2008, 39, 785–793. [Google Scholar] [CrossRef]
- Li, K.; Chan, W.; Doody, R.S.; Quinn, J.; Luo, S.; Alzheimer’s Disease Neuroimaging Initiative. Prediction of Conversion to Alzheimer’s Disease with Longitudinal Measures and Time-To-Event Data. J. Alzheimer’s Dis. 2017, 58, 361–371. [Google Scholar] [CrossRef]
- Xue, C.; Yuan, B.; Yue, Y.; Xu, J.; Wang, S.; Wu, M.; Ji, N.; Zhou, X.; Zhao, Y.; Rao, J.; et al. Distinct Disruptive Patterns of Default Mode Subnetwork Connectivity Across the Spectrum of Preclinical Alzheimer’s Disease. Front. Aging Neurosci. 2019, 11, 307. [Google Scholar] [CrossRef] [PubMed]
- Li, C.; Yang, J.; Yin, X.; Liu, C.; Zhang, L.; Zhang, X.; Gui, L.; Wang, J. Abnormal intrinsic brain activity patterns in leukoaraiosis with and without cognitive impairment. Behav. Brain Res. 2015, 292, 409–413. [Google Scholar] [CrossRef] [PubMed]
- Frontzkowski, L.; Ewers, M.; Brendel, M.; Biel, D.; Ossenkoppele, R.; Hager, P.; Steward, A.; Dewenter, A.; Römer, S.; Rubinski, A.; et al. Earlier Alzheimer’s disease onset is associated with tau pathology in brain hub regions and facilitated tau spreading. Nat. Commun. 2022, 13, 4899. [Google Scholar] [CrossRef] [PubMed]
- King-Robson, J.; Wilson, H.; Politis, M.; Alzheimer’s Disease Neuroimaging Initiative. Associations Between Amyloid and Tau Pathology, and Connectome Alterations, in Alzheimer’s Disease and Mild Cognitive Impairment. J. Alzheimer’s Dis. 2021, 82, 541–560. [Google Scholar] [CrossRef] [PubMed]


| Group | Number | Gender (Male/Female) | Age of Scanning | Education | MMSE | CDR-SB |
|---|---|---|---|---|---|---|
| NC | 22 | 8/14 | 56.95 ± 7.01 | 11.27 ± 3.92 | 28.23 ± 1.41 | 0.00 ± 0.00 |
| MCI | 26 | 6/20 | 70.38 ± 8.47 | 10.27 ± 3.29 | 25.53 ± 1.70 | 4.46 ± 1.46 |
| AD | 36 | 14/22 | 60.94 ± 10.13 | 9.86 ± 3.86 | 16.00 ± 6.29 | 8.68 ± 3.96 |
| p | - | 0.217 a | <0.001 b | 0.358 b | <0.001 c | <0.001 b |
| MCI | |||||||||||
|---|---|---|---|---|---|---|---|---|---|---|---|
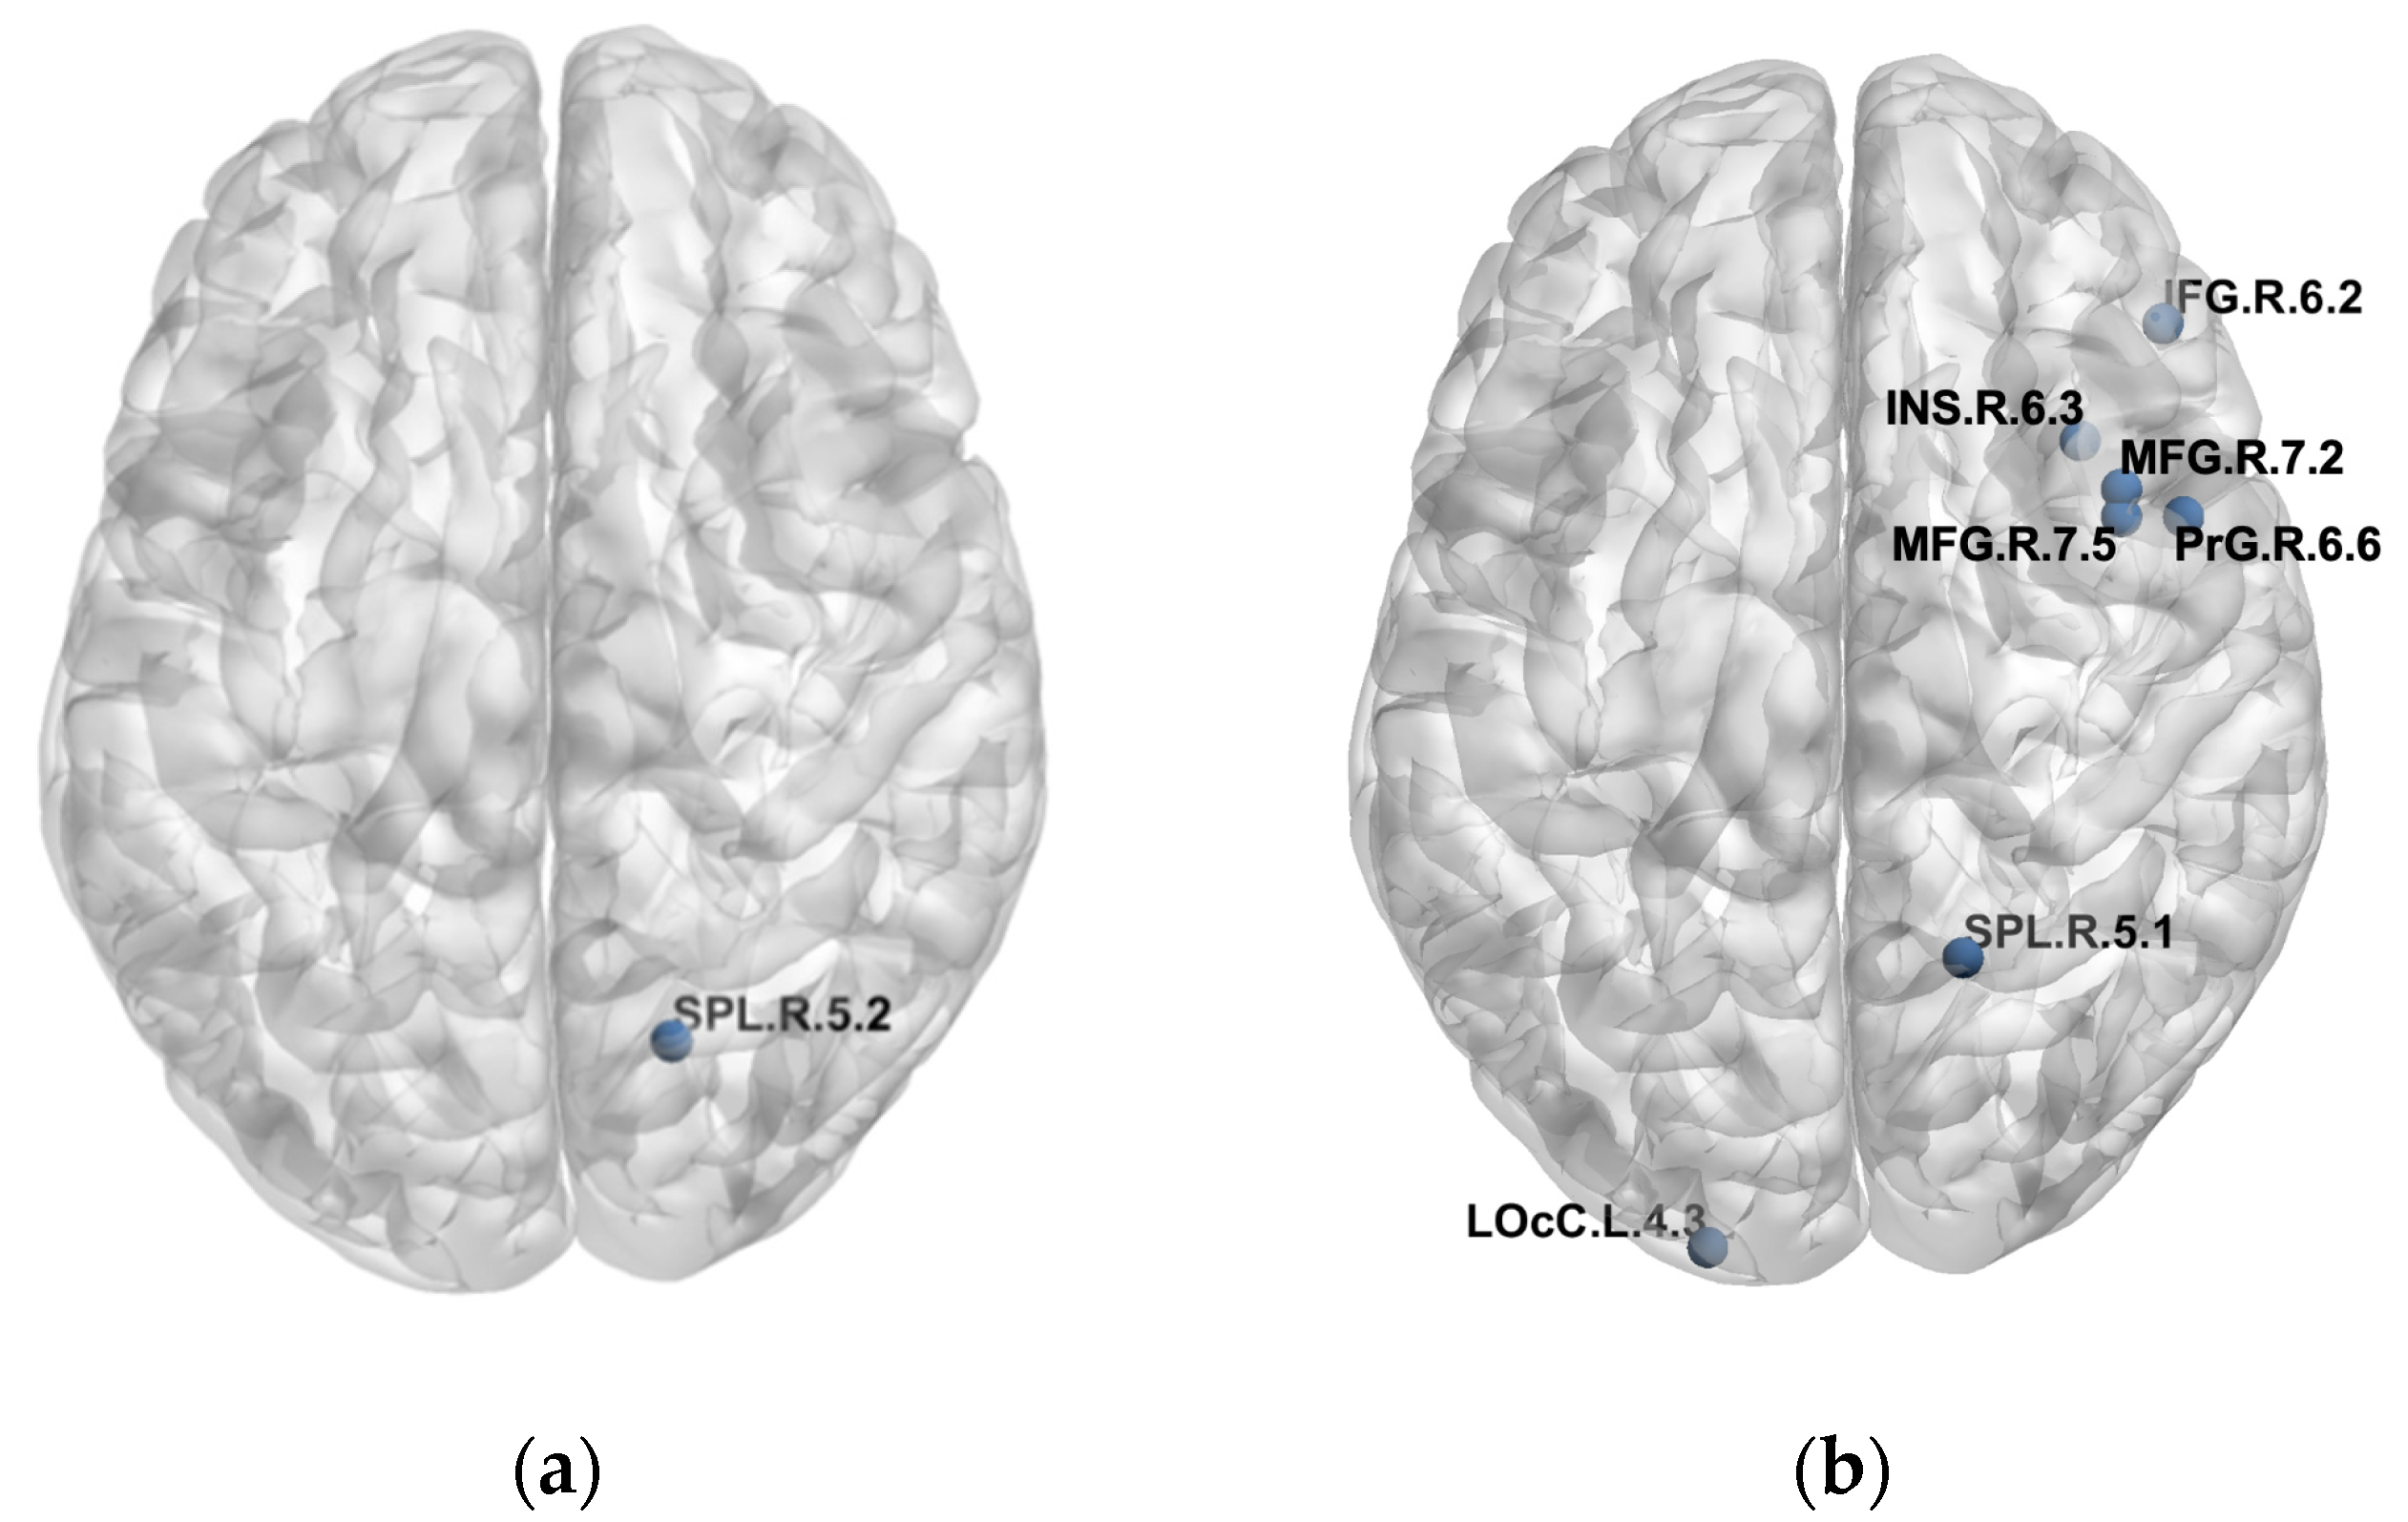
| Lobe | Gyrus | Left and Right Hemispheres | Label ID.L | Label ID.R | Modified Cyto-Architectonic | lh.MNI (X, Y, Z) | rh.MNI (X, Y, Z) | R(FCs and Tau SUVR) | P (FCs and tau SUVR) | R (PLFCS and Tau SUVR) | P (PLFCS and Tau SUVR) |
| Parietal lobe | SPL, superior parietal lobule | SPL_R_5_2 | 128 | A7c, caudal area 7 | −15, −71, 52 | 19, −69, 54 | 0.4332 | 0.0271 | 0.4360 | 0.0260 | |
| AD | |||||||||||
| Lobe | Gyrus | Left and Right Hemispheres | Label ID.L | Label ID.R | Modified Cyto-Architectonic | lh.MNI (X,Y,Z) | rh.MNI (X,Y,Z) | R (FCs and Tau SUVR) | P (FCs and Tau SUVR) | R (PLFCS and Tau SUVR) | P (PLFCS and Tau SUVR) |
| Frontal lobe | MFG, middle frontal gyrus | MFG_R_7_2 | 18 | IFJ, inferior frontal junction | −42, 13, 36 | 42, 11, 39 | 0.4159 | 0.0116 | 0.4106 | 0.0129 | |
| MFG, middle frontal gyrus | MFG_R_7_5 | 24 | A8vl, ventrolateral area 8 | −33, 23, 45 | 42, 27, 39 | 0.4214 | 0.0105 | 0.4239 | 0.0100 | ||
| IFG, inferior frontal gyrus | IFG_R_6_2 | 32 | IFS, inferior frontal sulcus | −47, 32, 14 | 48, 35, 13 | 0.3656 | 0.0283 | 0.3589 | 0.0316 | ||
| PrG, precentral gyrus | PrG_R_6_6 | 64 | A6cvl, caudal ventrolateral area 6 | −49, 5, 30 | 51, 7, 30 | 0.3420 | 0.0412 | 0.3493 | 0.0368 | ||
| Parietal lobe | SPL, superior parietal lobule | SPL_R_5_1 | 126 | A7r, rostral area 7 | −16, −60, 63 | 19, −57, 65 | −0.3624 | 0.0299 | −0.3663 | 0.0280 | |
| Insular lobe | INS, insular gyrus | INS_R_6_3 | 168 | dIa, dorsal agranular insula | −34, 18, 1 | 36, 18, 1 | 0.3321 | 0.0478 | 0.3496 | 0.0366 | |
| Occipital lobe | LOcC, lateral occipital cortex | LOcC_L_4_3 | 203 | OPC, occipital polar cortex | −18, −99, 2 | 22, −97, 4 | −0.3443 | 0.0397 | −0.3432 | 0.0404 | |
Publisher’s Note: MDPI stays neutral with regard to jurisdictional claims in published maps and institutional affiliations. |
© 2022 by the authors. Licensee MDPI, Basel, Switzerland. This article is an open access article distributed under the terms and conditions of the Creative Commons Attribution (CC BY) license (https://creativecommons.org/licenses/by/4.0/).
Share and Cite
Ju, Z.; Li, Z.; Lu, J.; Jiao, F.; Lin, H.; Bao, W.; Li, M.; Wu, P.; Guan, Y.; Zhao, Q.; et al. In Vivo Tau Burden Is Associated with Abnormal Brain Functional Connectivity in Alzheimer’s Disease: A 18F-Florzolotau Study. Brain Sci. 2022, 12, 1355. https://doi.org/10.3390/brainsci12101355
Ju Z, Li Z, Lu J, Jiao F, Lin H, Bao W, Li M, Wu P, Guan Y, Zhao Q, et al. In Vivo Tau Burden Is Associated with Abnormal Brain Functional Connectivity in Alzheimer’s Disease: A 18F-Florzolotau Study. Brain Sciences. 2022; 12(10):1355. https://doi.org/10.3390/brainsci12101355
Chicago/Turabian StyleJu, Zizhao, Zhuoyuan Li, Jiaying Lu, Fangyang Jiao, Huamei Lin, Weiqi Bao, Ming Li, Ping Wu, Yihui Guan, Qianhua Zhao, and et al. 2022. "In Vivo Tau Burden Is Associated with Abnormal Brain Functional Connectivity in Alzheimer’s Disease: A 18F-Florzolotau Study" Brain Sciences 12, no. 10: 1355. https://doi.org/10.3390/brainsci12101355
APA StyleJu, Z., Li, Z., Lu, J., Jiao, F., Lin, H., Bao, W., Li, M., Wu, P., Guan, Y., Zhao, Q., Zhang, H., Jiang, J., & Zuo, C. (2022). In Vivo Tau Burden Is Associated with Abnormal Brain Functional Connectivity in Alzheimer’s Disease: A 18F-Florzolotau Study. Brain Sciences, 12(10), 1355. https://doi.org/10.3390/brainsci12101355