
Evaluation of Participant Success in Gamified Drone Training Simulator Using Brain Signals and Key Logs


Abstract
:1. Introduction
- Is it possible to identify successful people in the educational environment by simultaneously recording and analyzing the number of keystrokes or brain signals?
- What effect does the number of training trials have on human performance?
- Is there a certain relationship in the performance and mental activities of the participants during the training repetitions in the simulator?
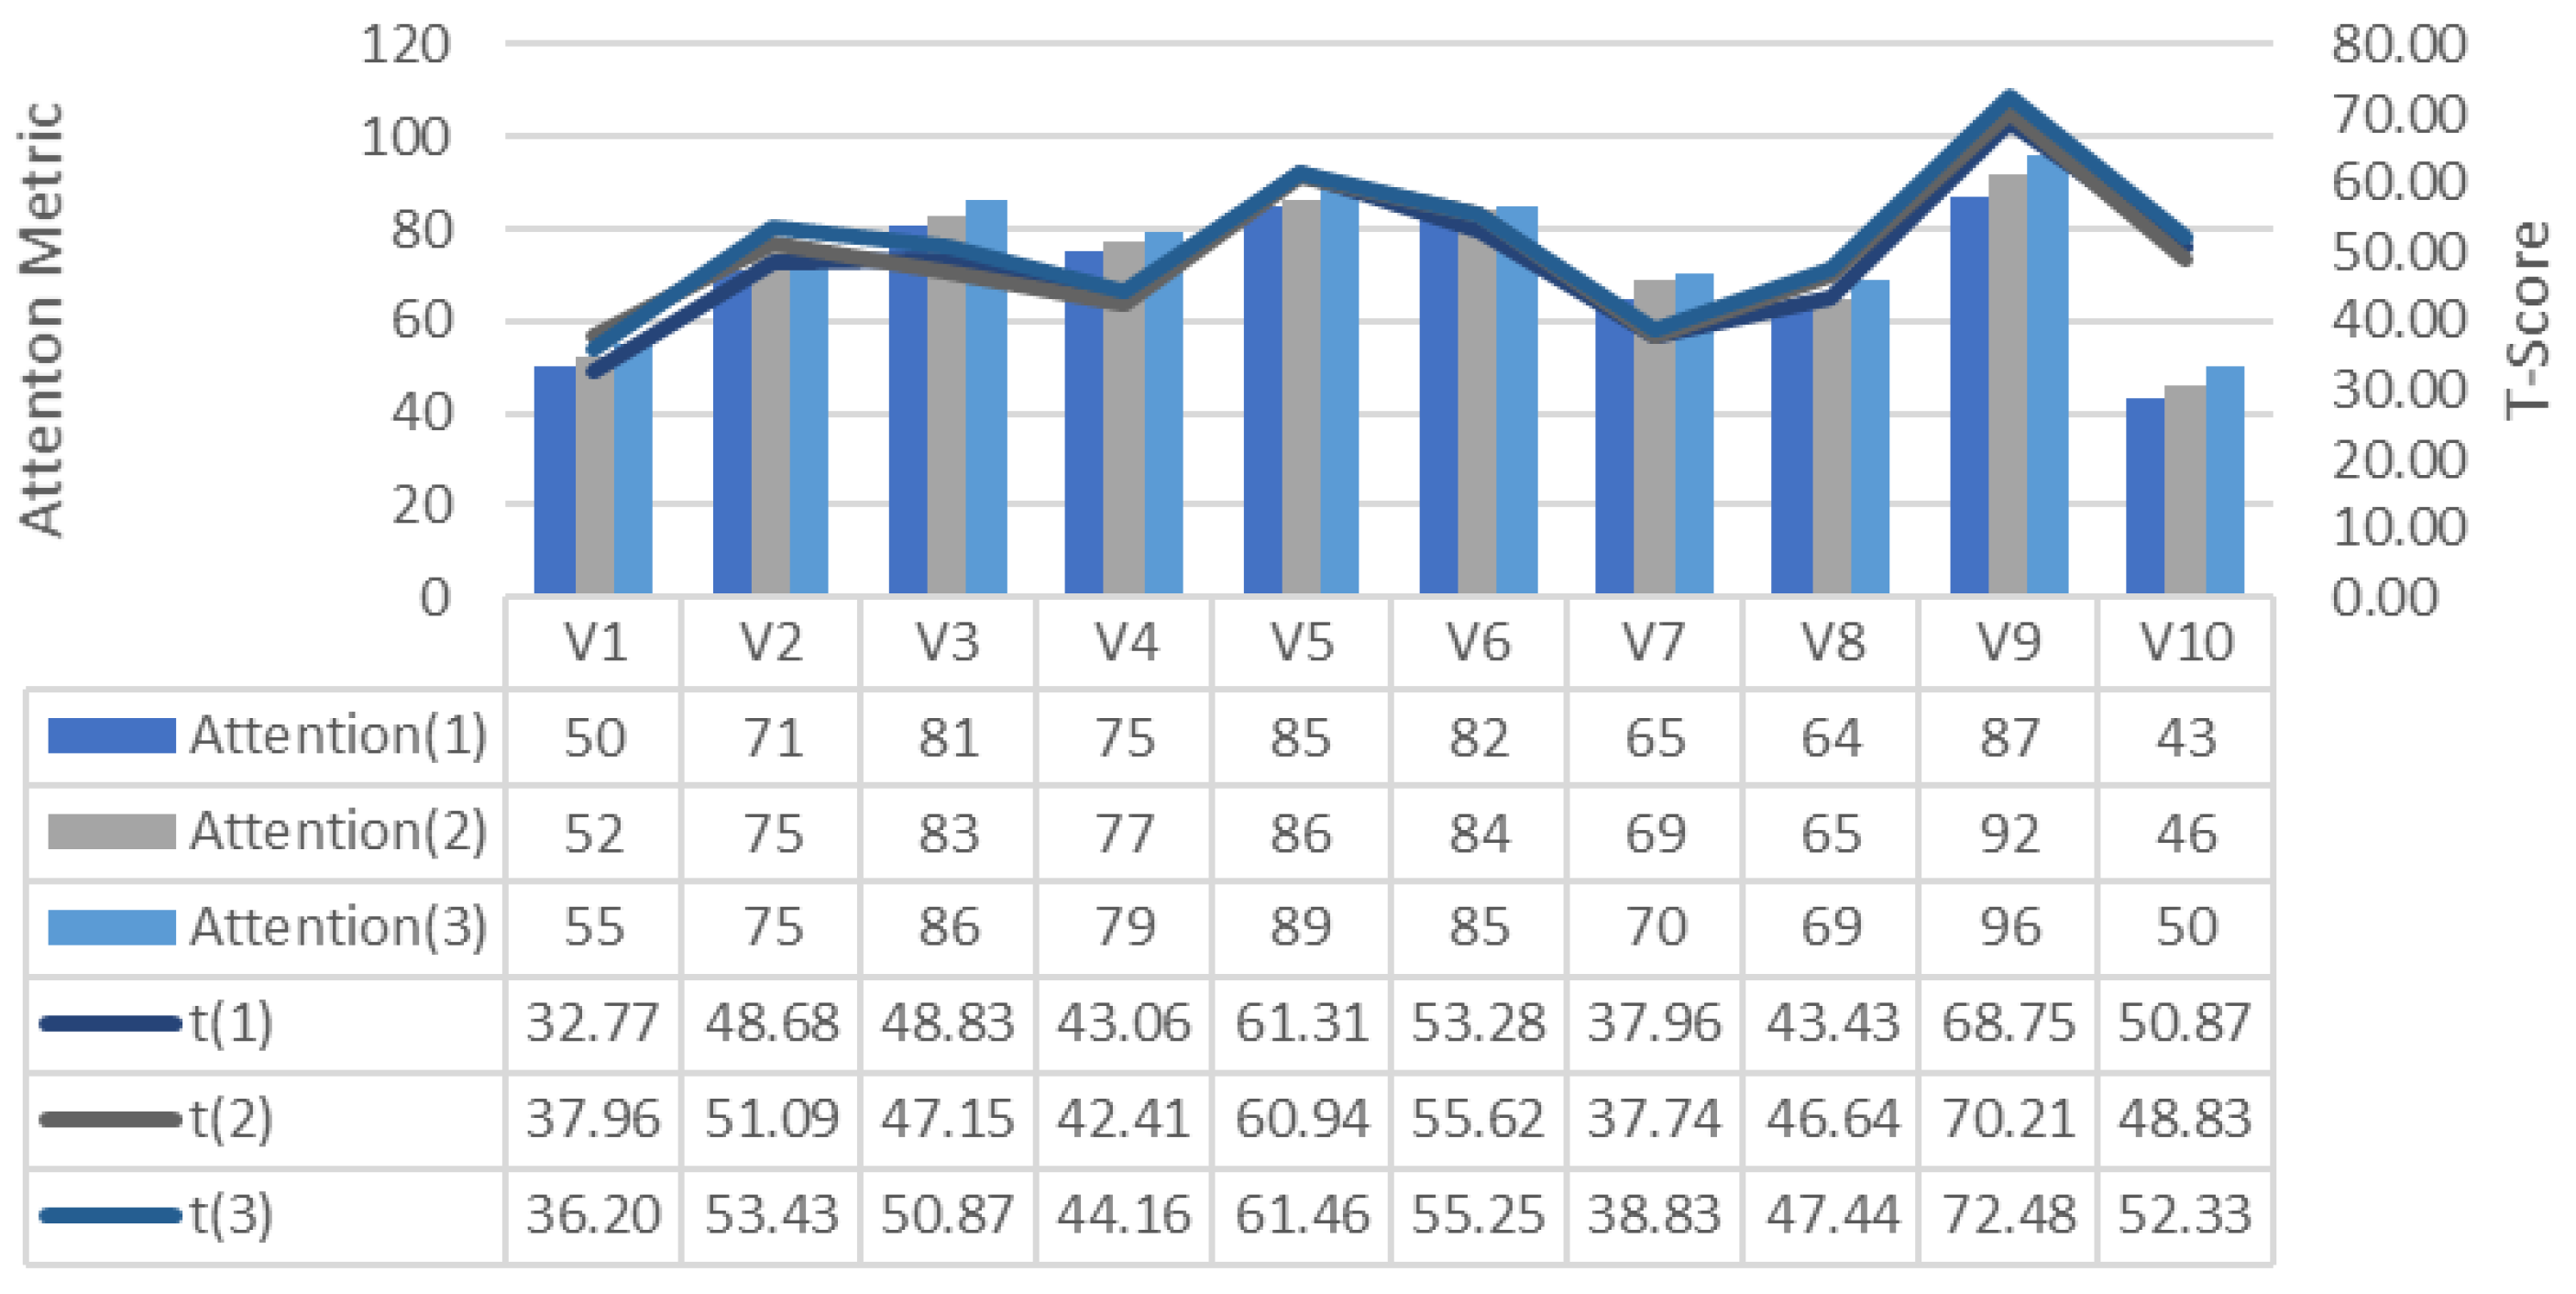
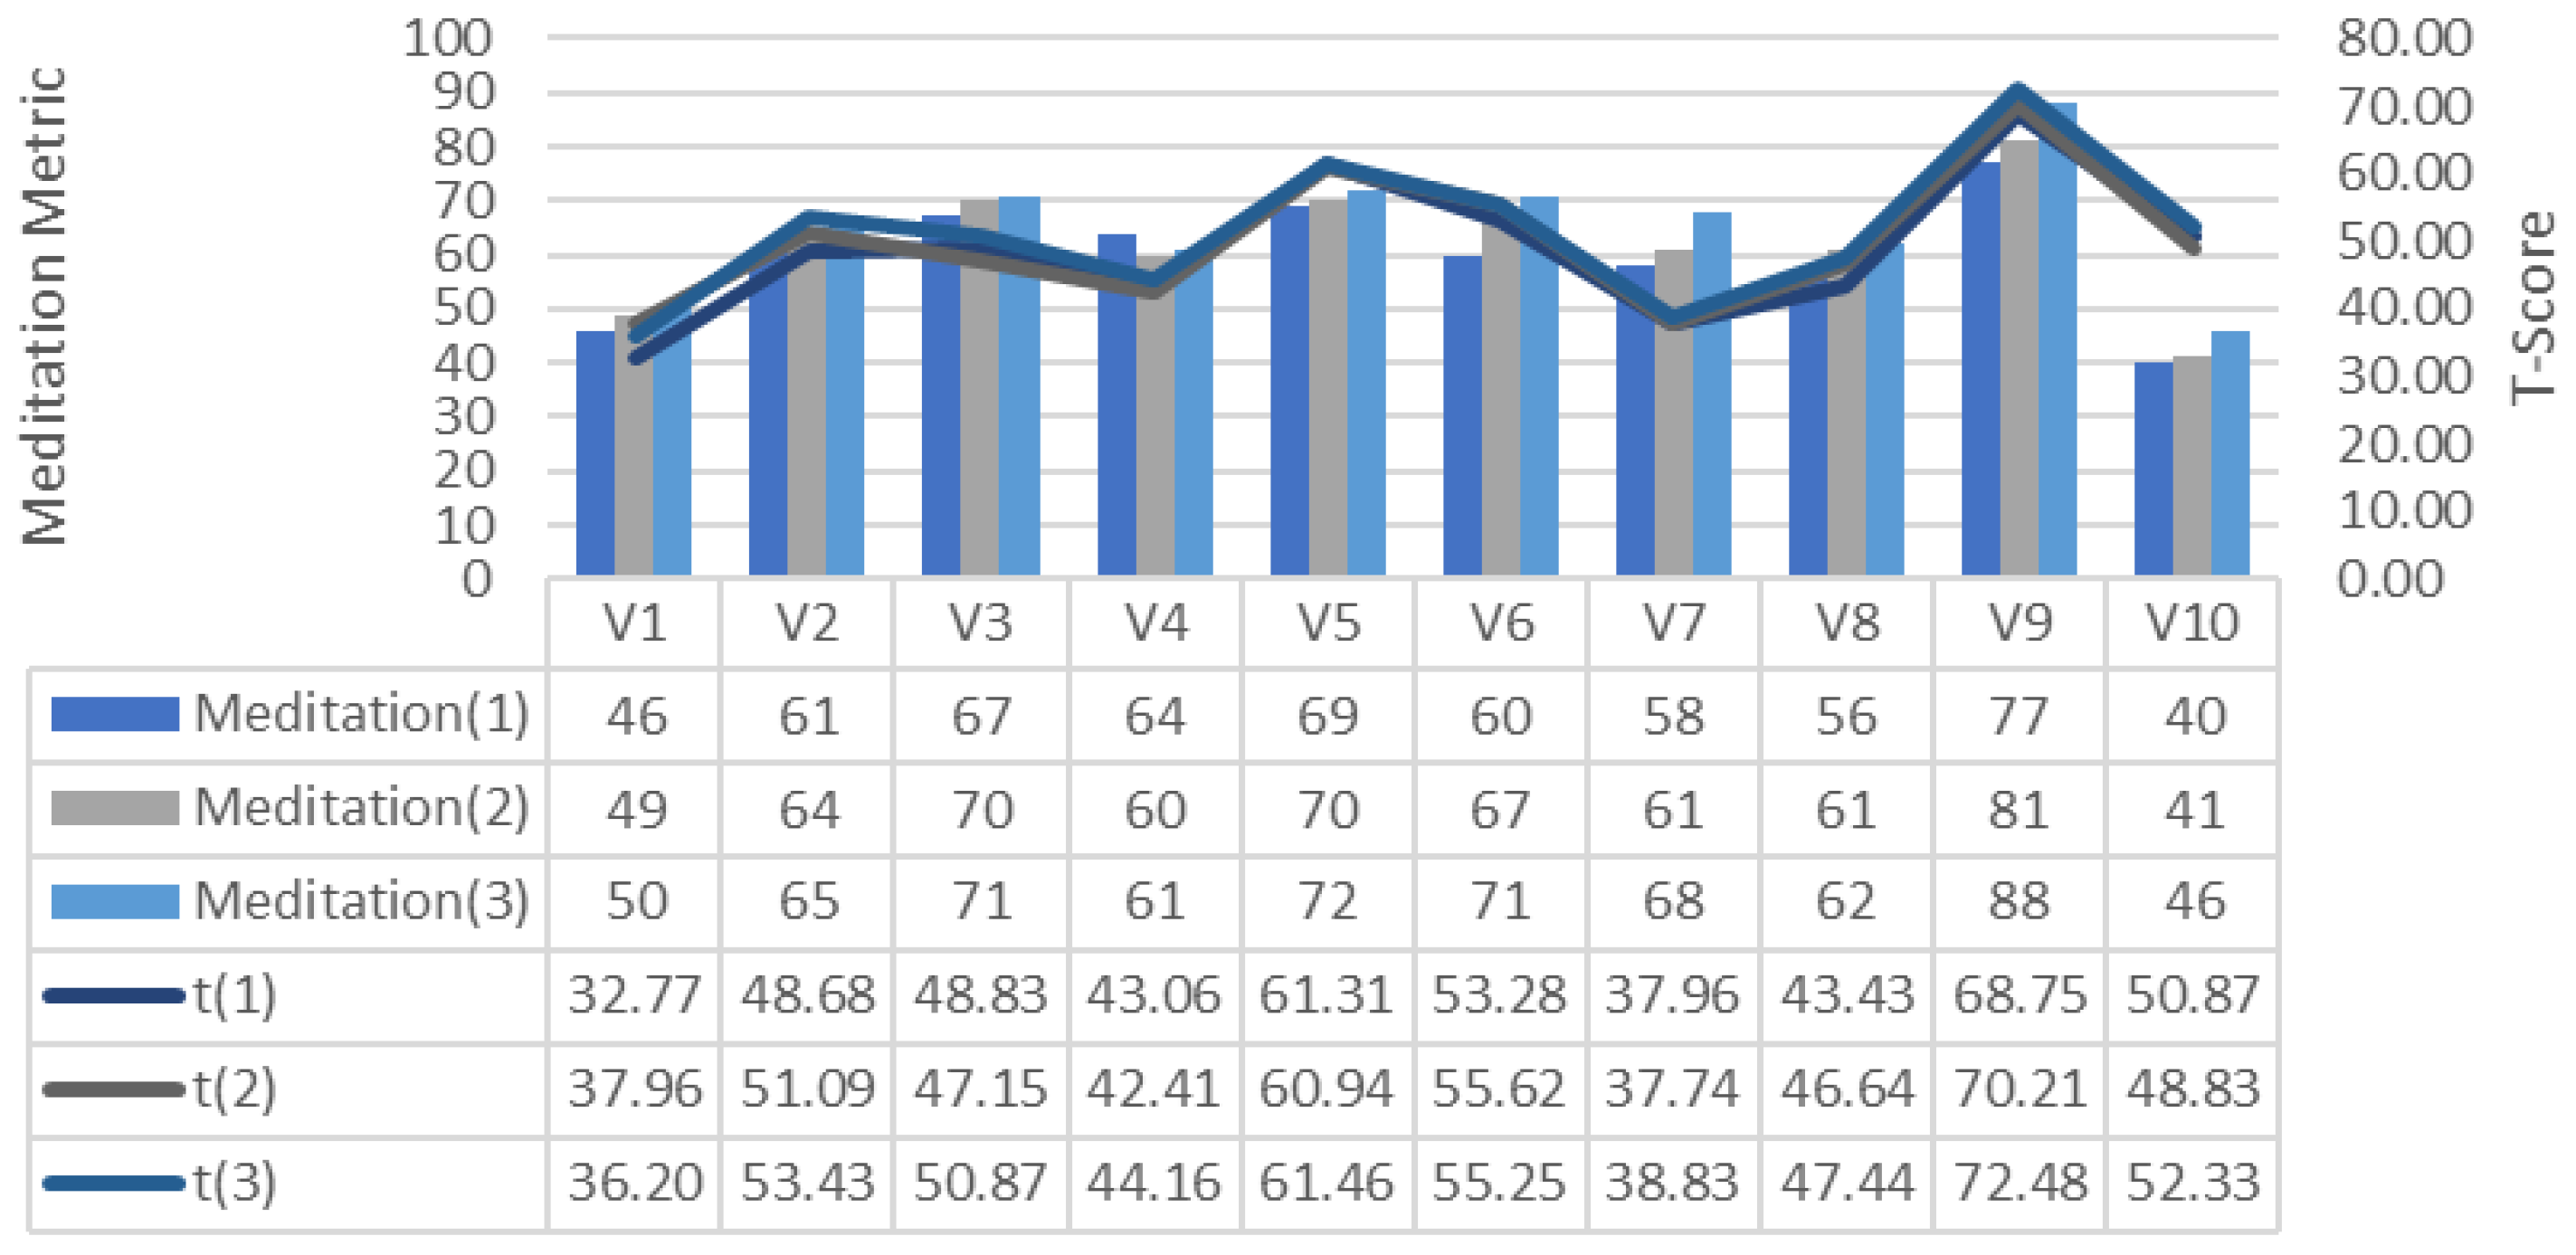
- Is there a relationship between performance in training trials and attention and meditation metrics?
2. Materials and Methods
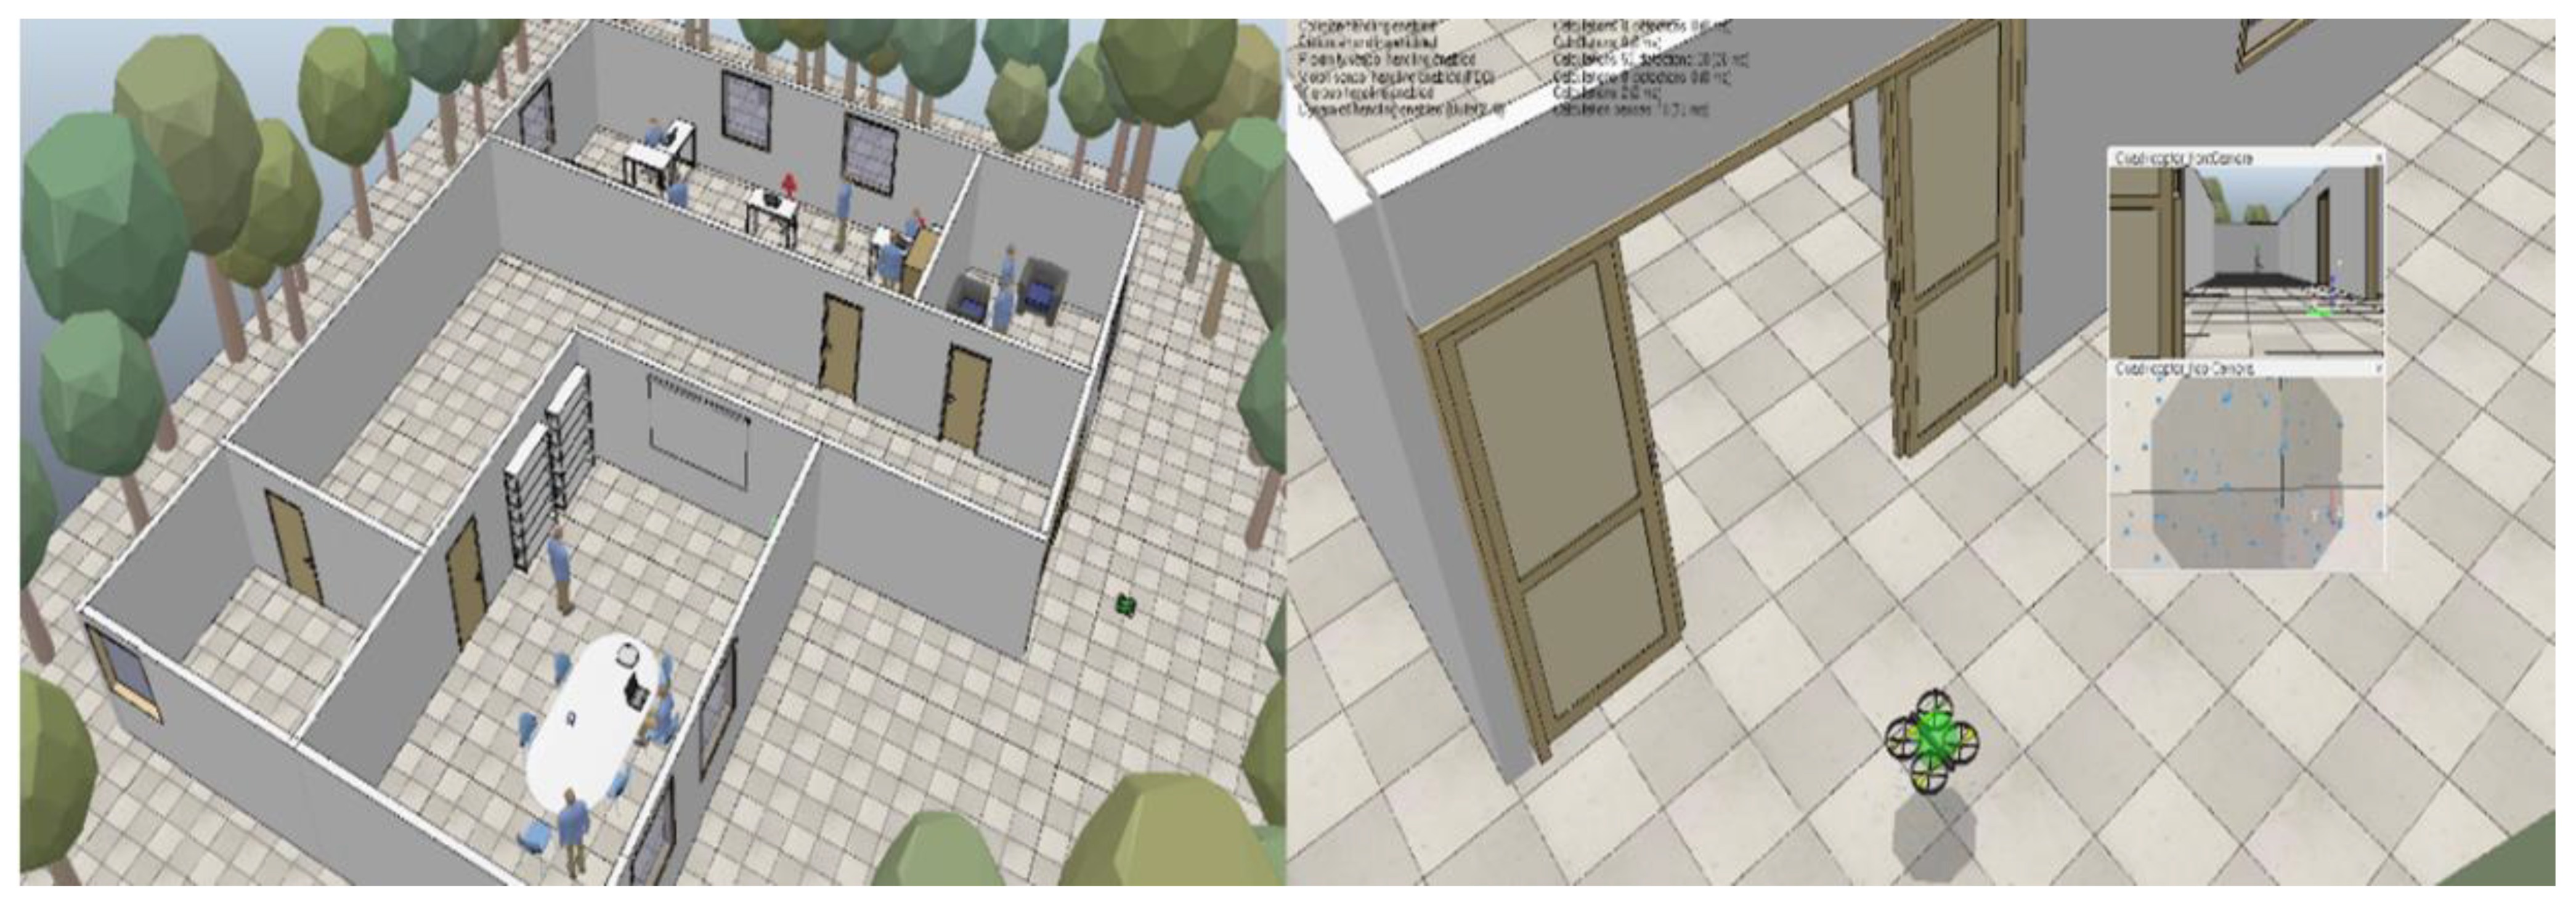
2.1. Drone Simulator
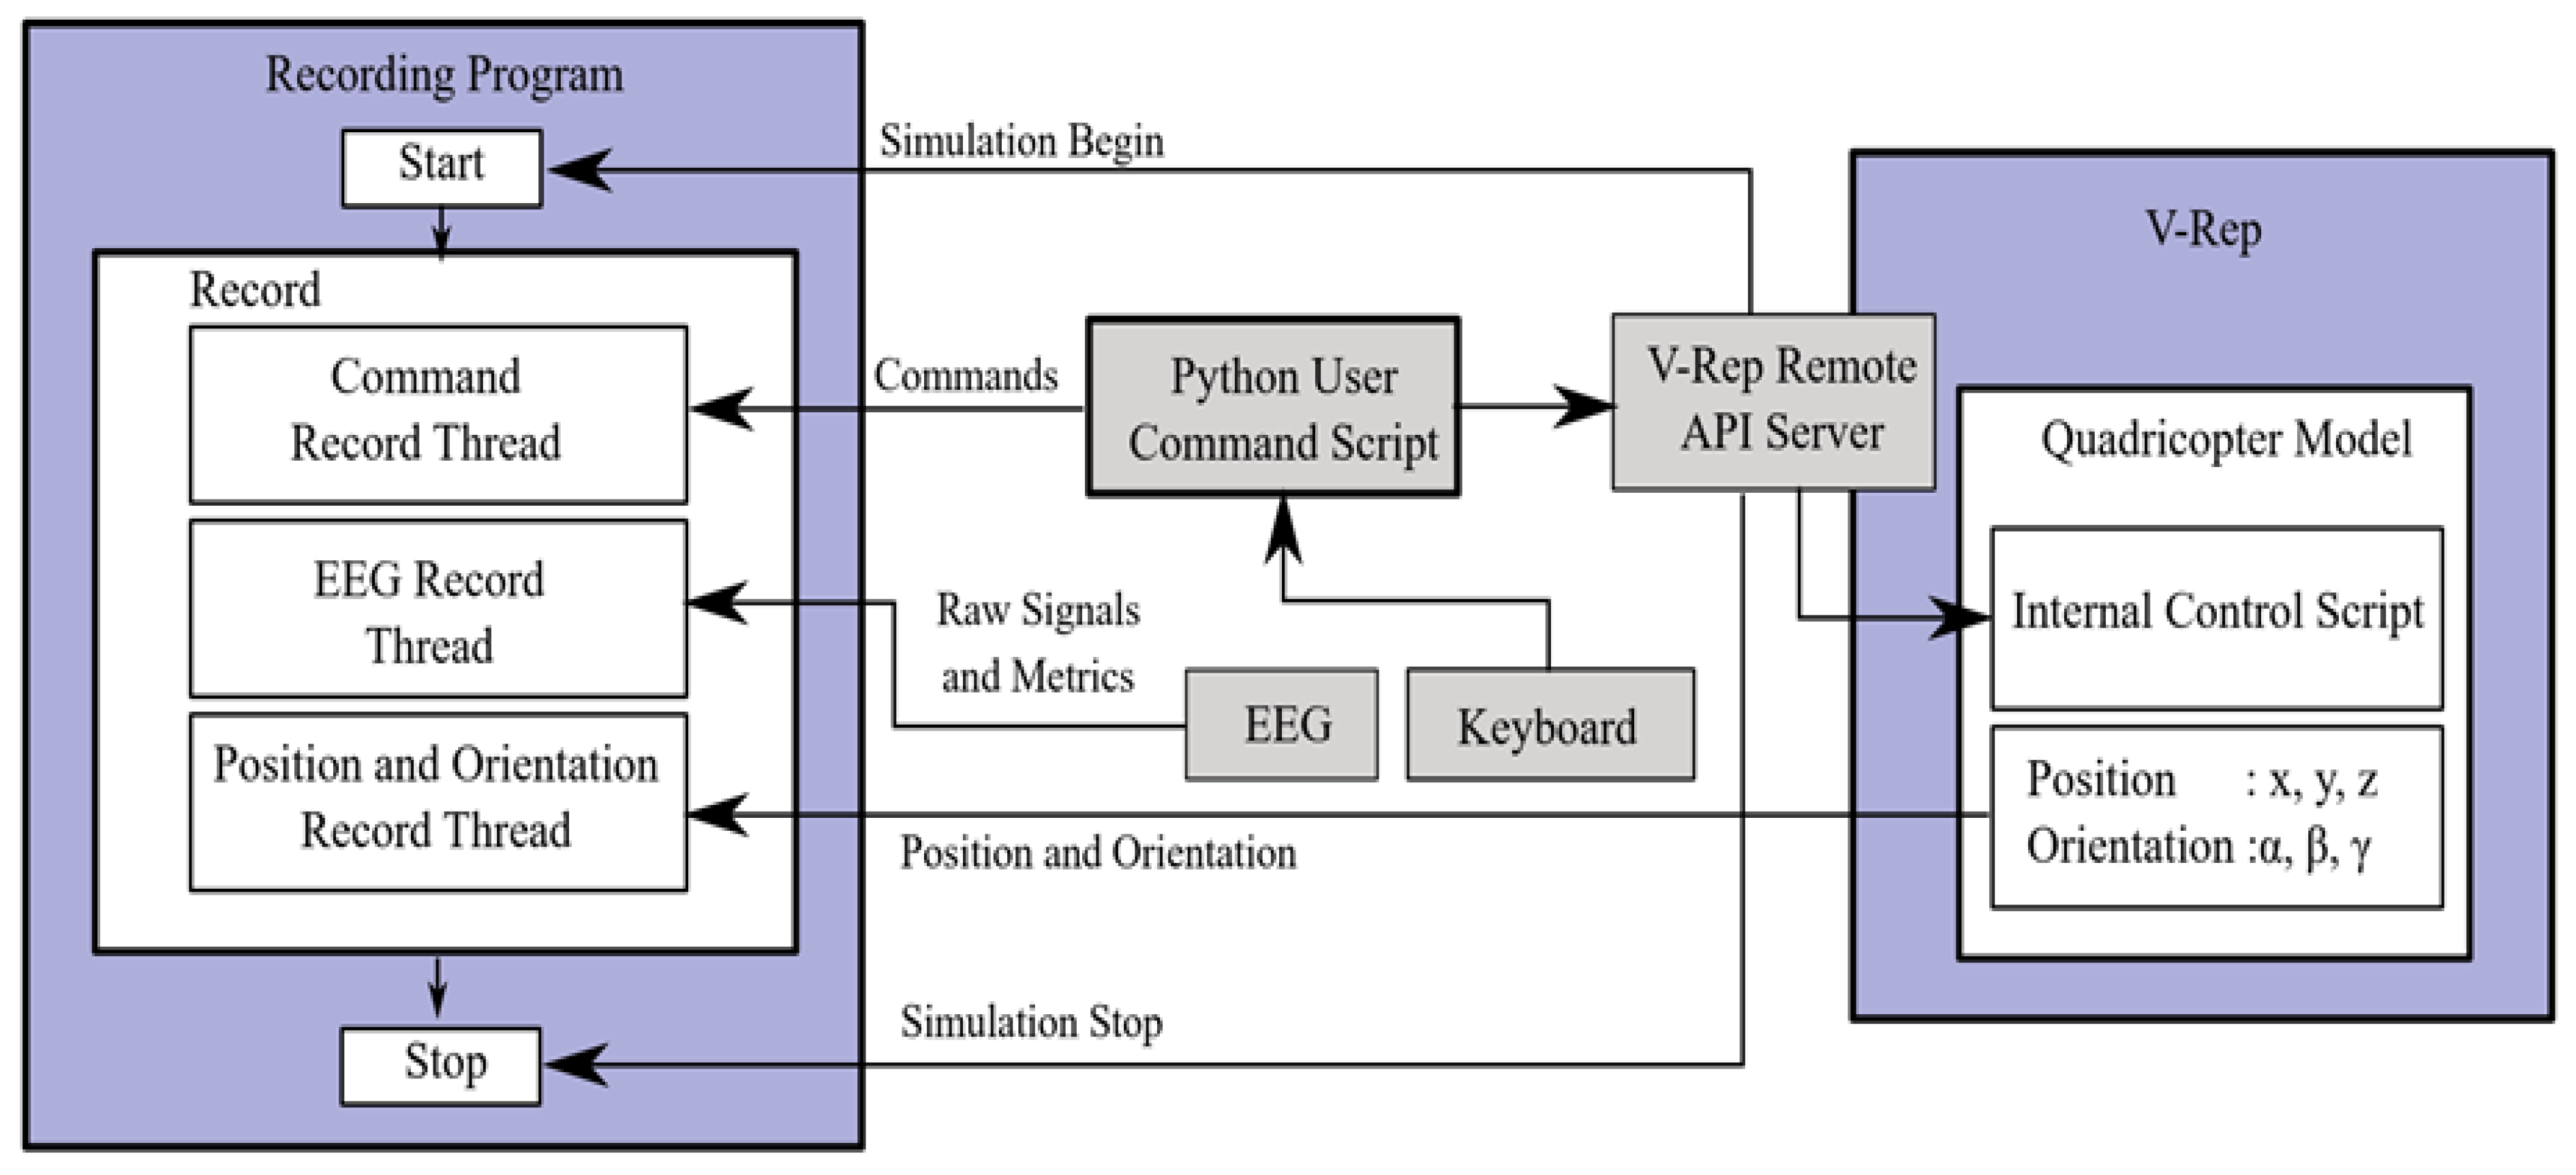
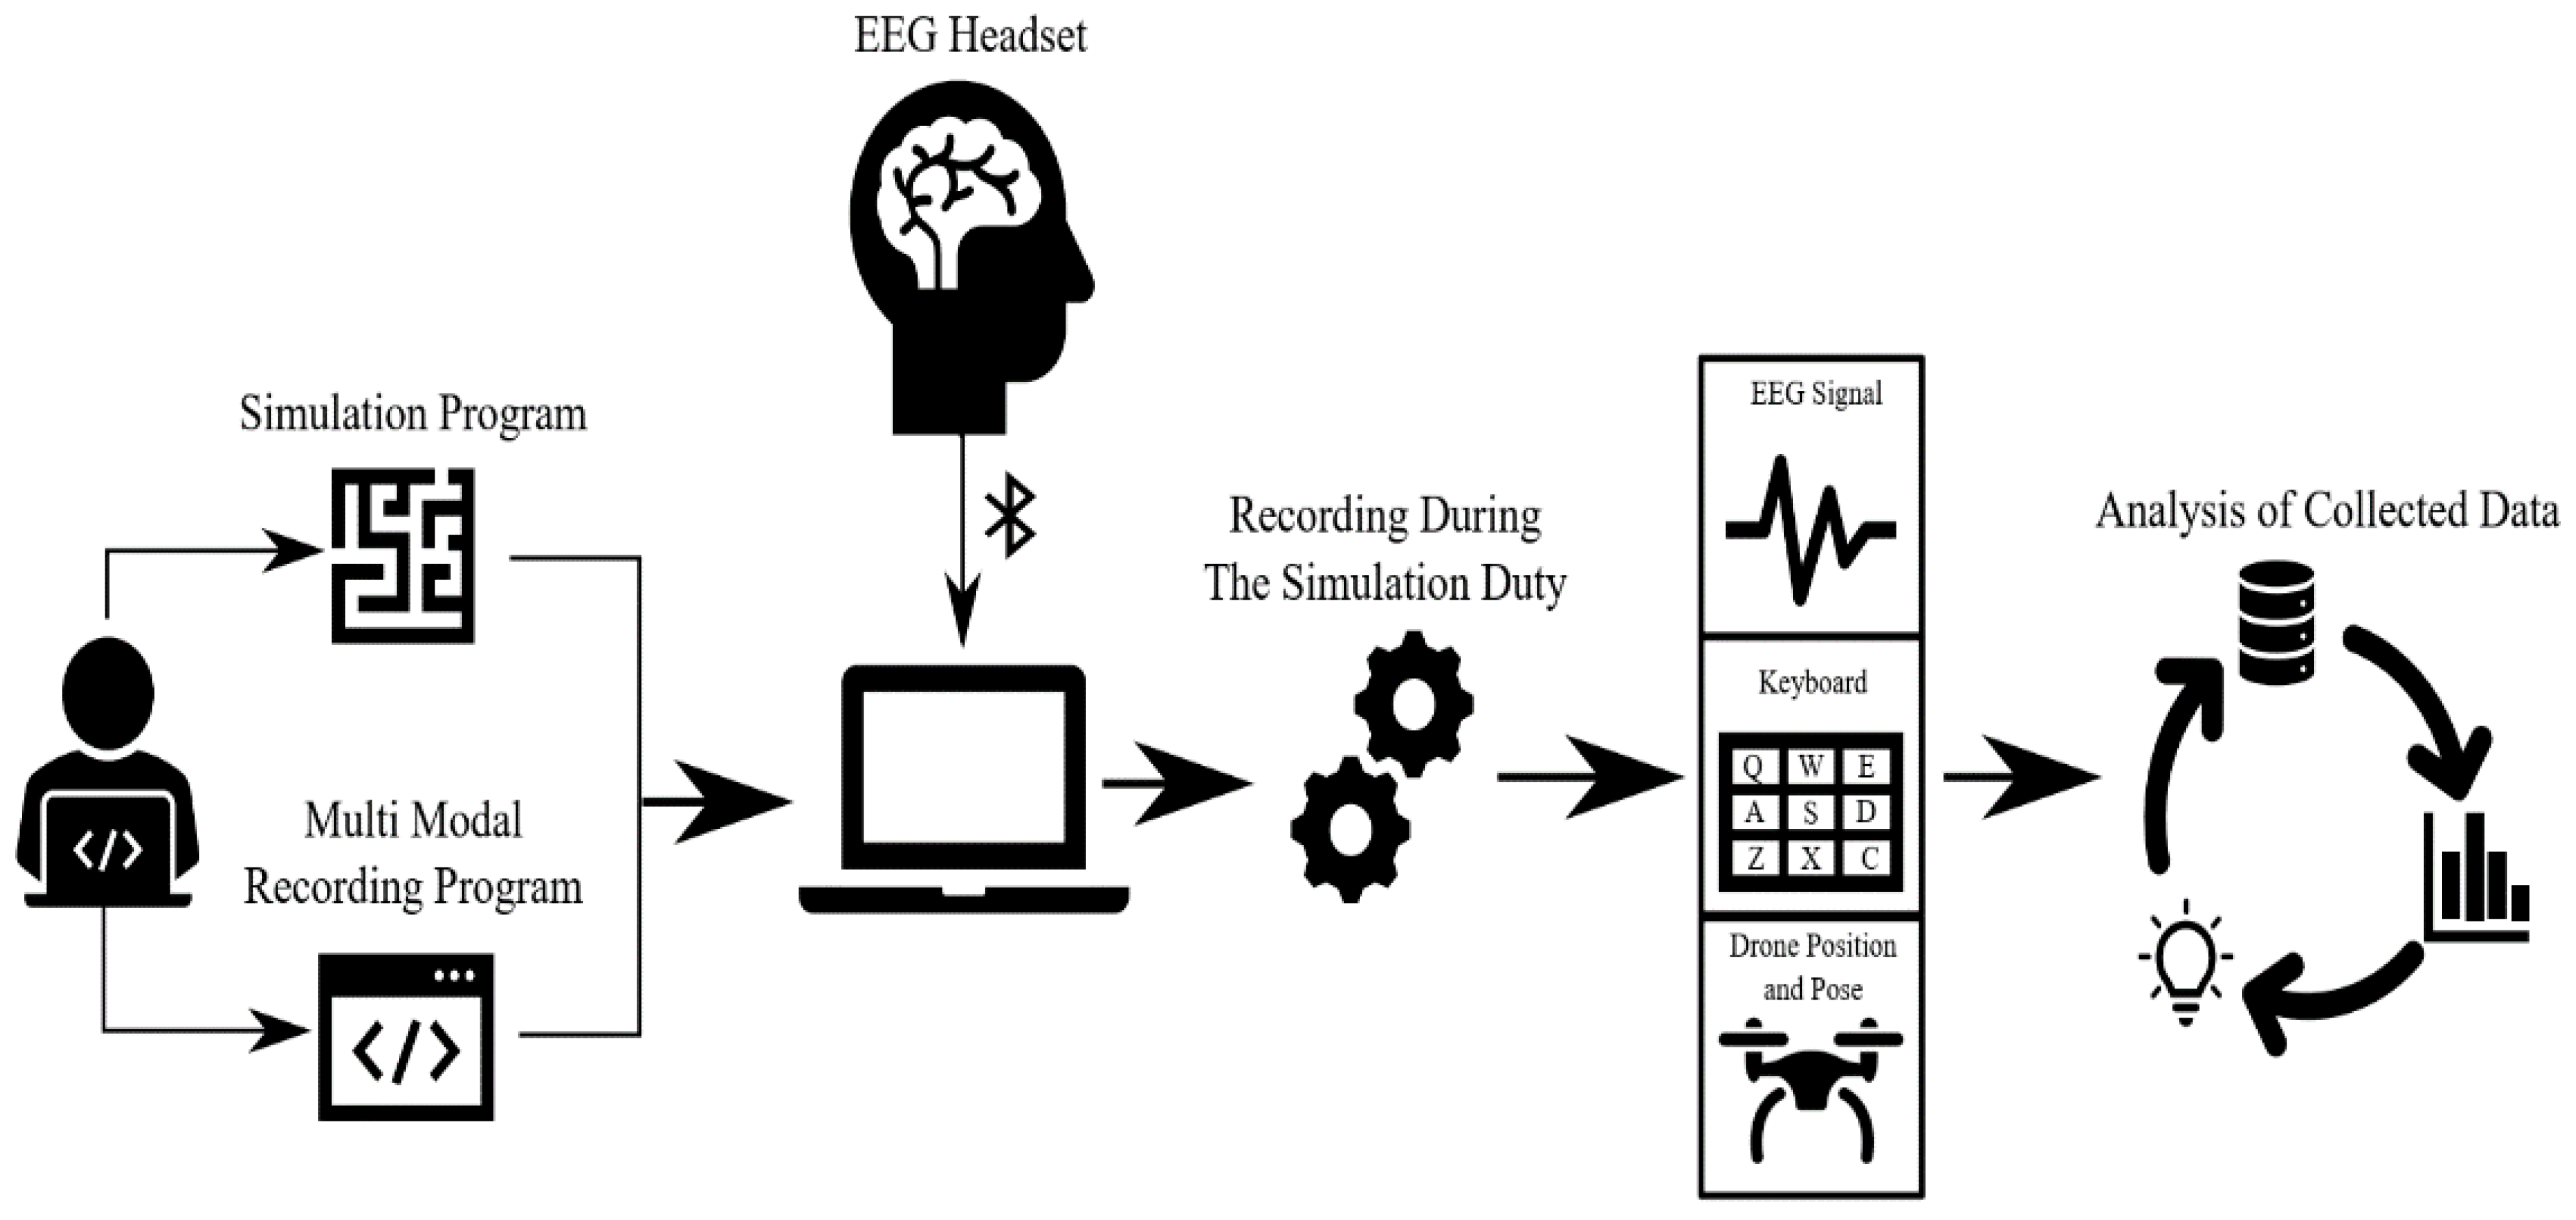
2.2. Recording Software
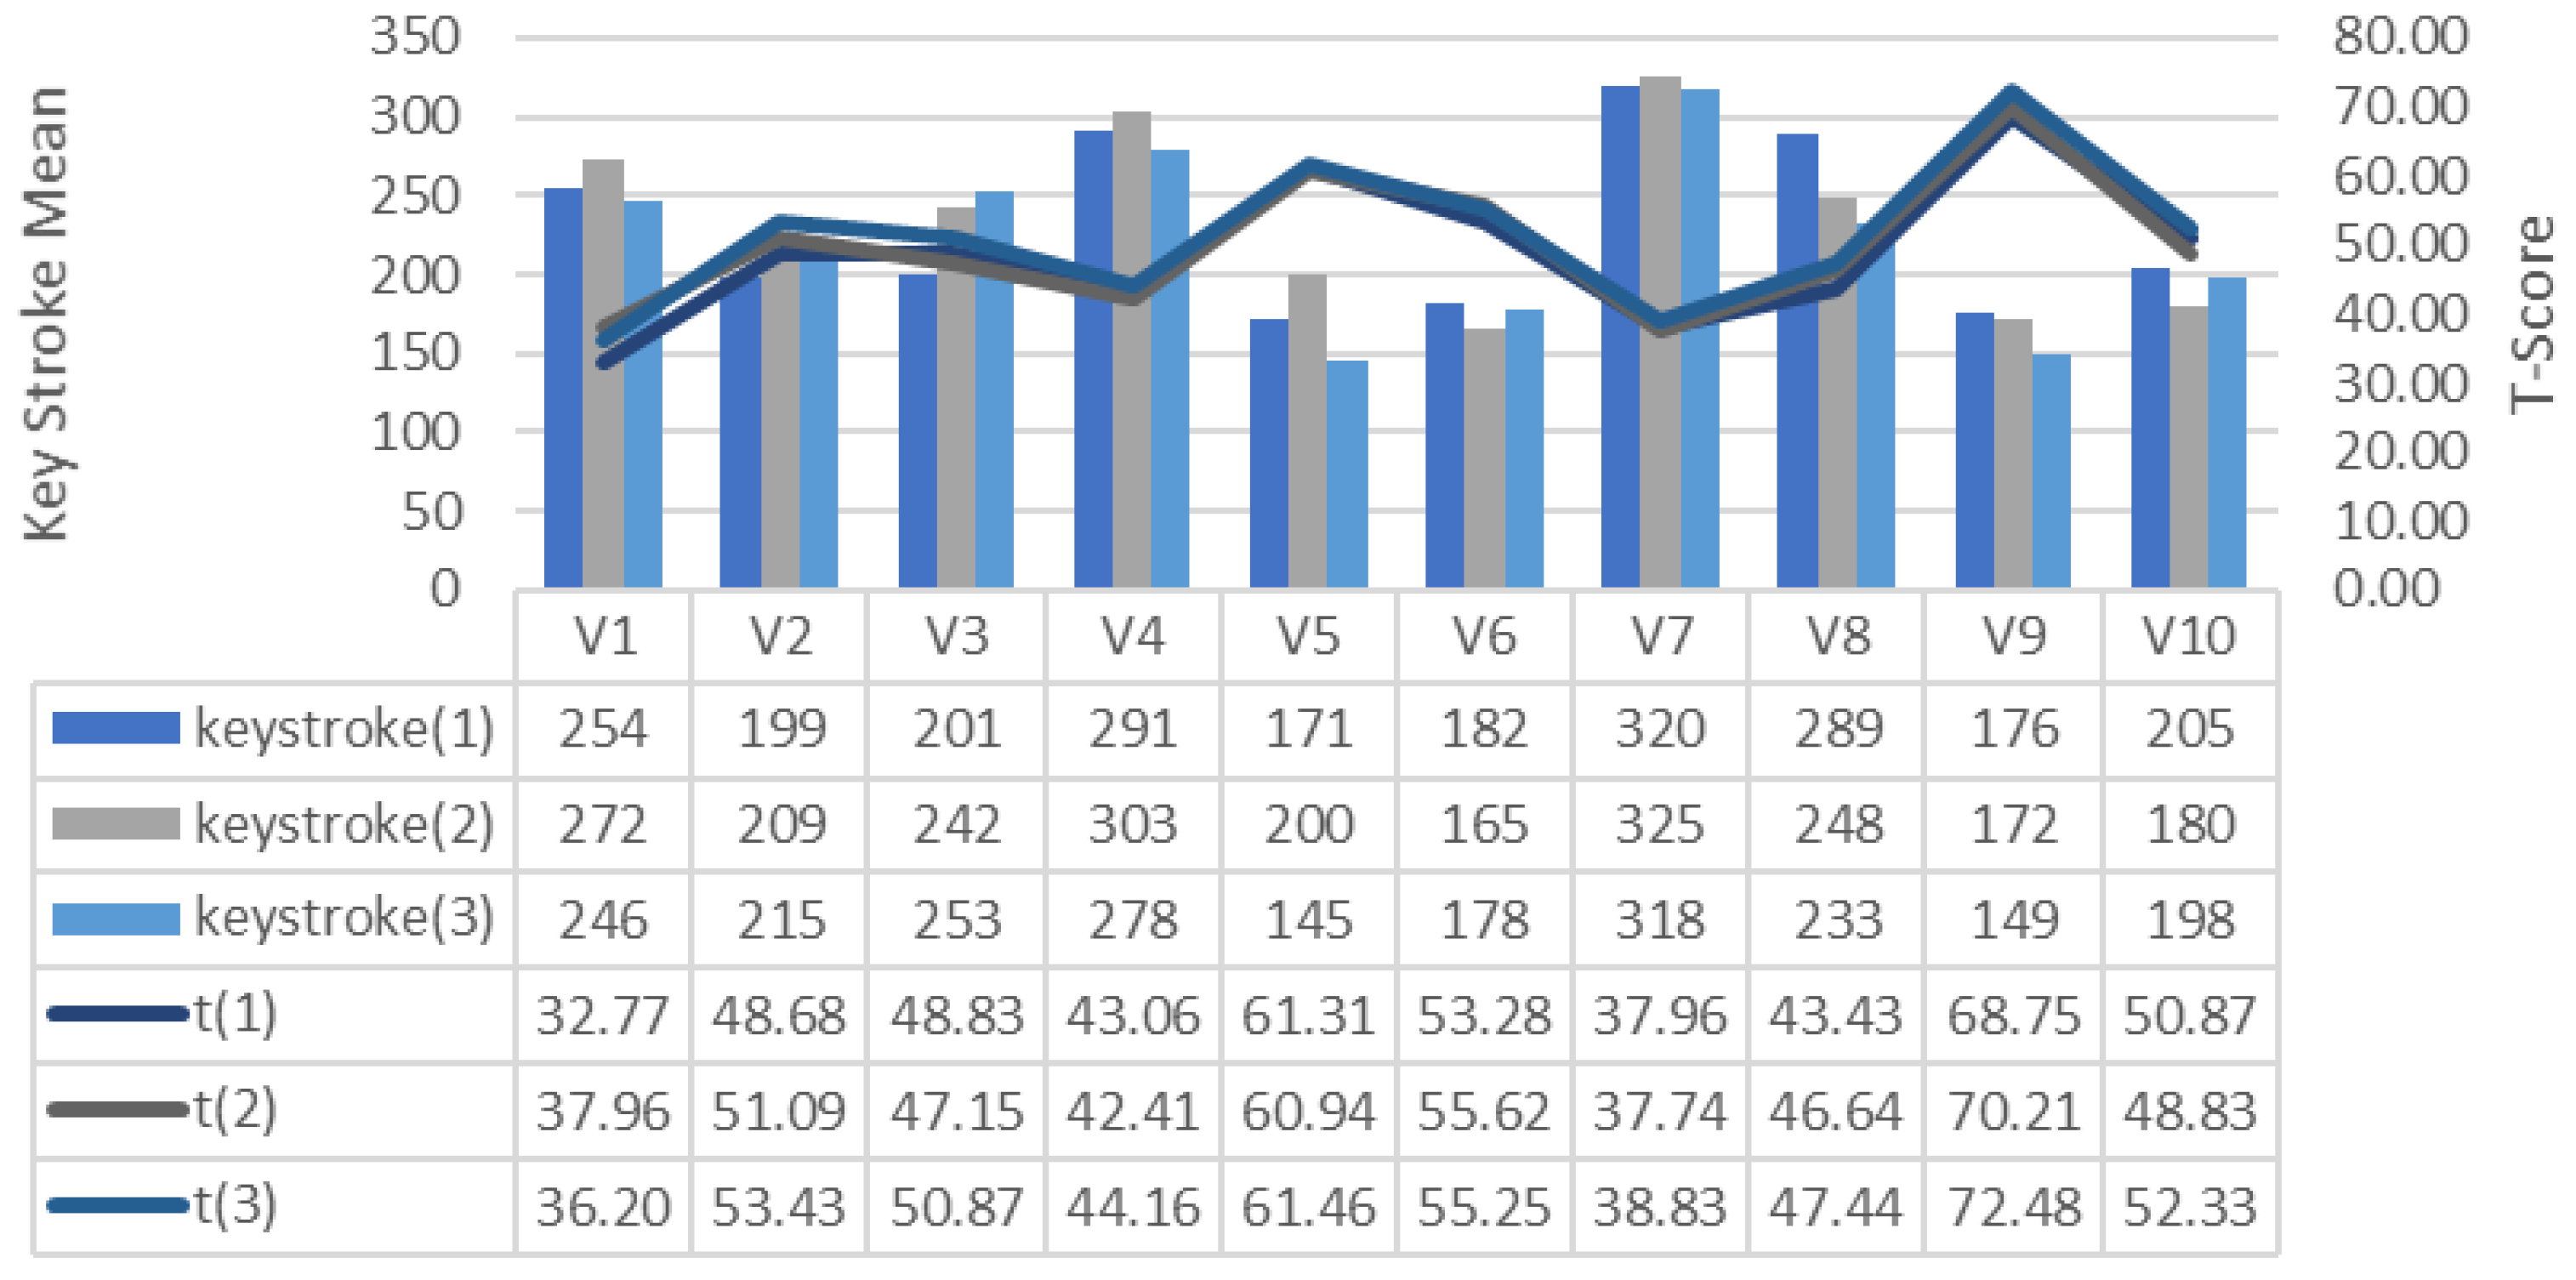
2.3. Analysis of Collected Data
3. Experiments and Discussion
4. Conclusions
Author Contributions
Funding
Institutional Review Board Statement
Informed Consent Statement
Data Availability Statement
Acknowledgments
Conflicts of Interest
References
- Davis, K.; Sridharan, H.; Koepke, L.; Singh, S.; Boiko, R. Learning and engagement in a gamified course: Investigating the effects of student characteristics. J. Comput. Assist. Learn. 2018, 34, 492–503. [Google Scholar] [CrossRef]
- Zou, J.T.; Pan, Z.Y.; Zhang, D.L.; Zheng, R.F. Integration of the Target Position Correction Software with the High Endurance Quadcopter for Search and Rescue Mission. Appl. Mech. Mater. 2015, 764–765, 713–717. [Google Scholar] [CrossRef]
- Bizin, I.; Vlasov, V.; Demidov, A.; Kanatnikov, N. The Use of Multicopters for Traffic Monitoring in Dense Urban Areas. In Proceedings of the 2014 Conference on Electronic Governance and Open Society: Challenges in Eurasia; Association for Computing Machinery: New York, NY, USA, 2014; pp. 42–44. [Google Scholar]
- Siebert, S.; Teizer, J. Mobile 3D mapping for surveying earthwork projects using an Unmanned Aerial Vehicle (UAV) system. Autom. Constr. 2014, 41, 1–14. [Google Scholar] [CrossRef]
- Puri, V.; Nayyar, A.; Raja, L. Agriculture drones: A modern breakthrough in precision agriculture. J. Stat. Manag. Syst. 2017, 20, 507–518. [Google Scholar] [CrossRef]
- Puri, A. A Survey of Unmanned Aerial Vehicles (UAV) for Traffic Surveillance; Technical Report; Department of Computer Science and Engineering, University of South Florida: Tampa, FL, USA, 2005. [Google Scholar]
- Nakajima, N. Radiation Distribution Measurements in Fukushima Prefecture. IEICE Trans. Commun. 2014, E97.B, 1752–1758. [Google Scholar] [CrossRef] [Green Version]
- Clarke, R. Understanding the drone epidemic. Comput. Law Secur. Rev. 2014, 30, 230–246. [Google Scholar] [CrossRef]
- Leopold, T.A.; Ratcheva, V.; Zahidi, S. The Future of Jobs Report 2018; World Economic Forum: Geneva, Switzerland, 2018. [Google Scholar]
- Finn, R.L.; Wright, D. Unmanned aircraft systems: Surveillance, ethics and privacy in civil applications. Comput. Law Secur. Rev. 2012, 28, 184–194. [Google Scholar] [CrossRef]
- Clarke, R. The regulation of civilian drones’ impacts on behavioural privacy. Comput. Law Secur. Rev. 2014, 30, 286–305. [Google Scholar] [CrossRef]
- Ke, F.; Carafano, P. Collaborative science learning in an immersive flight simulation. Comput. Educ. 2016, 103, 114–123. [Google Scholar] [CrossRef]
- Deshpande, A.A.; Huang, S.H. Simulation games in engineering education: A state-of-the-art review. Comput. Appl. Eng. Educ. 2011, 19, 399–410. [Google Scholar] [CrossRef]
- Reed, T.; Pirotte, M.; McHugh, M.; Oh, L.; Lovett, S.; Hoyt, A.E.; Quinones, D.; Adams, W.; Gruener, G.; McGaghie, W.C. Simulation-Based Mastery Learning Improves Medical Student Performance and Retention of Core Clinical Skills. Simul. Healthc. 2016, 11, 173–180. [Google Scholar] [CrossRef]
- Weinman, J. Digital Disciplines: Attaining Market Leadership via the Cloud, Big Data, Social, Mobile, and the Internet of Things, 1st ed.; John Wiley & Sons: Hoboken, NJ, USA, 2015; ISBN 978-1-118-99539-6. [Google Scholar]
- Cebulski, A.R. Utilizing Gamification to Foster Leadership Competency Development. New Dir. Stud. Leadersh. 2017, 2017, 73–85. [Google Scholar] [CrossRef]
- Carvalho-Filho, M.A.; Santos, T.M.; Ozahata, T.M.; Cecilio-Fernandes, D. Journal Club Challenge: Enhancing student participation through gamification. Med. Educ. 2018, 52, 551. [Google Scholar] [CrossRef]
- Van der Pal, J.; Roos, C.; Sewnath, G.; Rosheuvel, C. Adaptive Game Based Learning Using Brain Measures for Attention—Some Explorations. In Proceedings of the International Association for Development of the Information Society; IADIS Press: Mannheim, Germany, 2016; pp. 343–348. [Google Scholar]
- Palaus, M.; Marron, E.M.; Viejo-Sobera, R.; Redolar-Ripoll, D. Neural Basis of Video Gaming: A Systematic Review. Front. Hum. Neurosci. 2017, 11, 248. [Google Scholar] [CrossRef] [PubMed] [Green Version]
- Shin, S.; Park, J.-H.; Kim, J.-H. Effectiveness of patient simulation in nursing education: Meta-analysis. Nurse Educ. Today 2015, 35, 176–182. [Google Scholar] [CrossRef]
- Pedowitz, R.A.; Esch, J.; Snyder, S. Evaluation of a virtual reality simulator for arthroscopy skills development. Arthrosc. J. Arthrosc. Relat. Surg. 2002, 18, 1–6. [Google Scholar] [CrossRef] [PubMed] [Green Version]
- Baillie, L.; Curzio, J. Students’ and facilitators’ perceptions of simulation in practice learning. Nurse Educ. Pract. 2009, 9, 297–306. [Google Scholar] [CrossRef]
- Rosen, M.A.; Hunt, E.A.; Pronovost, P.J.; Federowicz, M.A.; Weaver, S.J. In situ simulation in continuing education for the health care professions: A systematic review. J. Contin. Educ. Health Prof. 2012, 32, 243–254. [Google Scholar] [CrossRef] [PubMed]
- Navarro, E.O.; van der Hoek, A. Comprehensive Evaluation of an Educational Software Engineering Simulation Environment. In Proceedings of the 20th Conference on Software Engineering Education Training (CSEET’07), Dublin, Ireland, 3–5 July 2007; pp. 195–202. [Google Scholar]
- Rosenthal, R.; DiMatteo, M.R. Meta-Analysis. In Stevens’ Handbook of Experimental Psychology; Pashler, H., Ed.; John Wiley & Sons, Inc.: New York, NY, USA, 2002; Volume 4, pp. 391–428. ISBN 0-471-37888-7. [Google Scholar]
- Dincer, S. Eğitim Bilimlerinde Uygulamalı Meta-Analiz; Pegem Akademi Yayıncılık: Ankara, Turkey, 2014; ISBN 978-605-364-844-4. [Google Scholar]
- Roberts, E.S. In defence of the survey method: An illustration from a study of user information satisfaction. Account. Financ. 1999, 39, 53–77. [Google Scholar] [CrossRef]
- Neuendorf, K.A.; Kumar, A. Content Analysis. In The International Encyclopedia of Political Communication; Mazzoleni, G., Ed.; American Cancer Society: Atlanta, GA, USA, 2015; Volume 8, pp. 1–10. ISBN 978-1-118-54155-5. [Google Scholar]
- Şimşek, H.; Yıldırım, A. Sosyal Bilimlerde Nitel Araştırma Yöntemleri; Seçkin Yayıncılık: Ankara, Turkey, 2008. [Google Scholar]
- Büyüköztürk, Ş.; Kılıç Çakmak, E.; Erkan Akgün, Ö.; Karadeniz, Ş.; Demirel, F. Bilimsel Araştırma Yöntemleri, 28th ed.; Pegem Akademi Yayıncılık: Ankara, Turkey, 2017; ISBN 978-9944-919-28-9. [Google Scholar]
- Sezer, A.; İnel, Y.; Seçkin, A.Ç.; Uluçınar, U. An Investigation of University Students’ Attention Levels in Real Classroom Settings with NeuroSky’s MindWave Mobile (EEG) Device. In Proceedings of the International Educational Technology Conference–IETC, İstanbul, Turkey, 27–29 May 2015; Volume 2015, pp. 27–29. [Google Scholar]
- Sezer, A.; Inel, Y.; Seçkin, A.Ç.; Uluçinar, U. The Relationship between Attention Levels and Class Participation of First-Year Students in Classroom Teaching Departments. Int. J. Instr. 2017, 10, 55–68. [Google Scholar] [CrossRef]
- AL-Ayash, A.; Kane, R.T.; Smith, D.; Green-Armytage, P. The influence of color on student emotion, heart rate, and performance in learning environments. Color Res. Appl. 2016, 41, 196–205. [Google Scholar] [CrossRef]
- Greipl, S.; Klein, E.; Lindstedt, A.; Kiili, K.; Moeller, K.; Karnath, H.-O.; Bahnmueller, J.; Bloechle, J.; Ninaus, M. When the brain comes into play: Neurofunctional correlates of emotions and reward in game-based learning. Comput. Hum. Behav. 2021, 125, 106946. [Google Scholar] [CrossRef]
- Chandra, S.; Sharma, G.; Salam, A.A.; Jha, D.; Mittal, A.P. Playing Action Video Games a Key to Cognitive Enhancement. Procedia Comput. Sci. 2016, 84, 115–122. [Google Scholar] [CrossRef] [Green Version]
- Du, G.; Long, S.; Yuan, H. Non-Contact Emotion Recognition Combining Heart Rate and Facial Expression for Interactive Gaming Environments. IEEE Access 2020, 8, 11896–11906. [Google Scholar] [CrossRef]
- Moghimi, M.; Stone, R.; Rotshtein, P. Affective Recognition in Dynamic and Interactive Virtual Environments. IEEE Trans. Affect. Comput. 2020, 11, 45–62. [Google Scholar] [CrossRef] [Green Version]
- Magosso, E.; De Crescenzio, F.; Ricci, G.; Piastra, S.; Ursino, M. EEG Alpha Power Is Modulated by Attentional Changes during Cognitive Tasks and Virtual Reality Immersion. Comput. Intell. Neurosci. 2019, 2019, e7051079. [Google Scholar] [CrossRef] [Green Version]
- Larsen, E.A. Classification of EEG Signals in a Brain-Computer Interface System. Master’s Thesis, Department of Computer and Information Science, Norwegian University of Science and Technology, Trondheim, Norway, 2011. [Google Scholar]
- Liu, C. Why Repetitive Tasks Are Stress Relievers. Available online: https://www.themuse.com/advice/science-says-you-should-do-this-the-next-time-youre-stressed-out-so-now (accessed on 4 April 2021).
- Roy, A.; Ferguson, C.J. Competitively versus cooperatively? An analysis of the effect of game play on levels of stress. Comput. Hum. Behav. 2016, 56, 14–20. [Google Scholar] [CrossRef]
- Souchet, A.D.; Philippe, S.; Lévêque, A.; Ober, F.; Leroy, L. Short- and long-term learning of job interview with a serious game in virtual reality: Influence of eyestrain, stereoscopy, and apparatus. Virtual Real. 2021. [Google Scholar] [CrossRef]
- Kristoffersen, M.B.; Franzke, A.W.; van der Sluis, C.K.; Murgia, A.; Bongers, R.M. Serious gaming to generate separated and consistent EMG patterns in pattern-recognition prosthesis control. Biomed. Signal Process. Control 2020, 62, 102140. [Google Scholar] [CrossRef]
- Fathima, F.N.; Johnson, A.R.; Kiran, P.R.; Ratnakumari, S.; Joseph, B. Impact of a residential rural community-based training program for medical students on cognitive and affective domains of learning in community medicine: A mixed methods study. Indian J. Community Med. 2021, 46, 247. [Google Scholar] [PubMed]
- Shadiev, R.; Wu, T.-T.; Huang, Y.-M. Enhancing learning performance, attention, and meditation using a speech-to-text recognition application: Evidence from multiple data sources. Interact. Learn. Environ. 2017, 25, 249–261. [Google Scholar] [CrossRef]
- Maskeliunas, R.; Damasevicius, R.; Martisius, I.; Vasiljevas, M. Consumer-grade EEG devices: Are they usable for control tasks? PeerJ 2016, 4, e1746. [Google Scholar] [CrossRef] [PubMed]
- Quigg, M. EEG Pearls; Mosby Elsevier: Amsterdam, The Netherlands, 2006. [Google Scholar]
- Napoli, M. Mindfulness Training for Teachers: A Pilot Program. Complement. Health Pract. Rev. 2004, 9, 31–42. [Google Scholar] [CrossRef]


| Ref. | Subject of Research | The Number of Participants | Research Measurement Method | Data Analysis Method |
|---|---|---|---|---|
| [32] | Determination of correlation between students’ attention levels and participation to lesson | 21 | Neurosky MindWave EEG | EEG signals were processed with the Fourier Transform method. The processed data were analyzed through Python and Matlab programs. In additon, the Pearson correlation coefficient was used to find the relationship between students’ attention levels and their participation in the lesson. |
| [34] | Determining the effect of game-based learning on the learning process | 42 | MRI and fMRI | T-tests were used in behavioral analysis, and multiple voxel model analysis (MVPA) was used in imaging analysis. |
| [35] | Determining the effects of action video games on players’ processing speed, hand-eye coordination, reaction time | 5 | EEG | Empirical mode decomposition was used for feature extraction from EEG data. K-Nearest Neighbor and Linear Discriminant Analysis were used to classify the data. |
| [36] | Estimation of emotion intensity in different games | 12 | Heart rate signals (HR), Facial Expressions (FE) | Bidirectional long and short term memory (Bi-LSTM) Network was used for teaching heart rate (HR) properties, Convolutional Neural Networks (CNN) for teaching facial expressions (FE), SOM-BP Network was used to combine HR and FE features. |
| [37] | Detection of emotions from multiple biosignals in virtual reality game | 30 | Electroencephalography (EEG), Galvanic skin response (GSR), Heart rate (HR) | Raw signals were standardized by the score normalization technique. Fast Fourier Transform technique was used to perform spectral analysis on the signals. |
| Command | Key |
|---|---|
| Forward | W |
| Backward | S |
| Left | A |
| Right | D |
| Up | Up Arrow |
| Down | Down Arrow |
| Rotate Left | Q |
| Rotate Right | E |
| Down Camera Photo | Y |
| Forward Camera Photo | H |
| Type | Frequency (Hz) | Mental State and Conditions |
|---|---|---|
| Delta | 0.1–3 | Deep, dreamless sleep, non-REM sleep or unconscious |
| Theta | 4–7 | Intuitive, creative, recall, fantasy, imaginary, dream |
| Alpha | 8–12 | Relaxed (but not drowsy) tranquil, conscious |
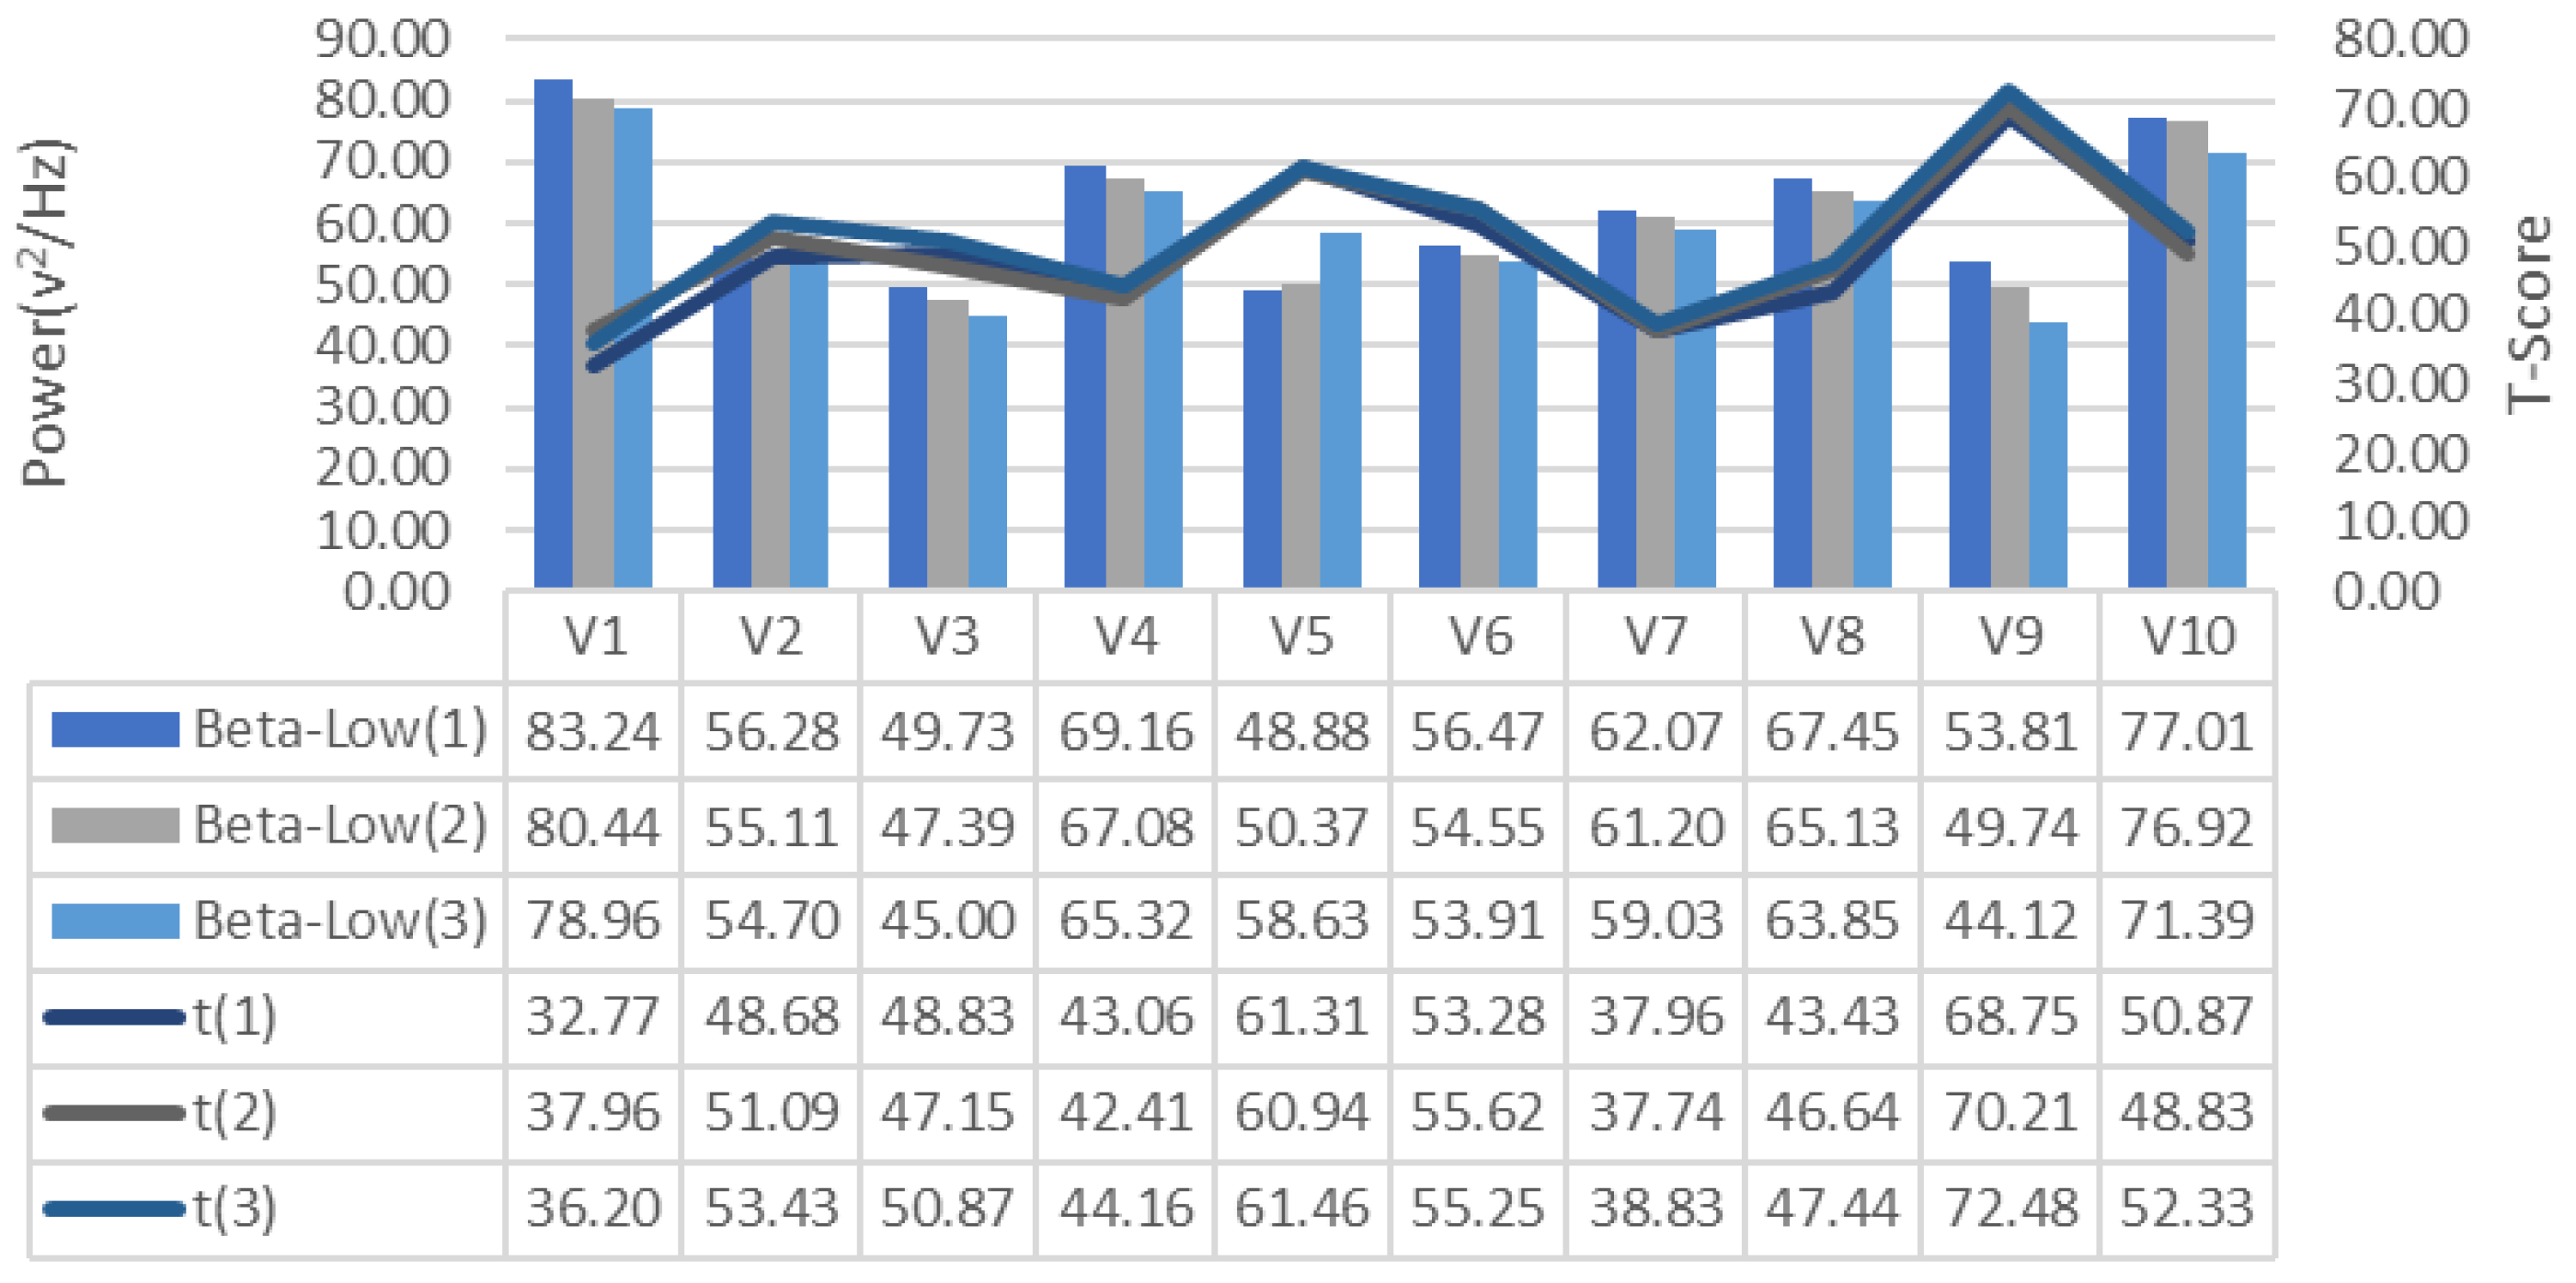
| Beta-Low | 12–15 | Formerly SMR, relaxed yet focused, integrated |
| Beta-Middle | 16–20 | Thinking, aware of self and surroundings |
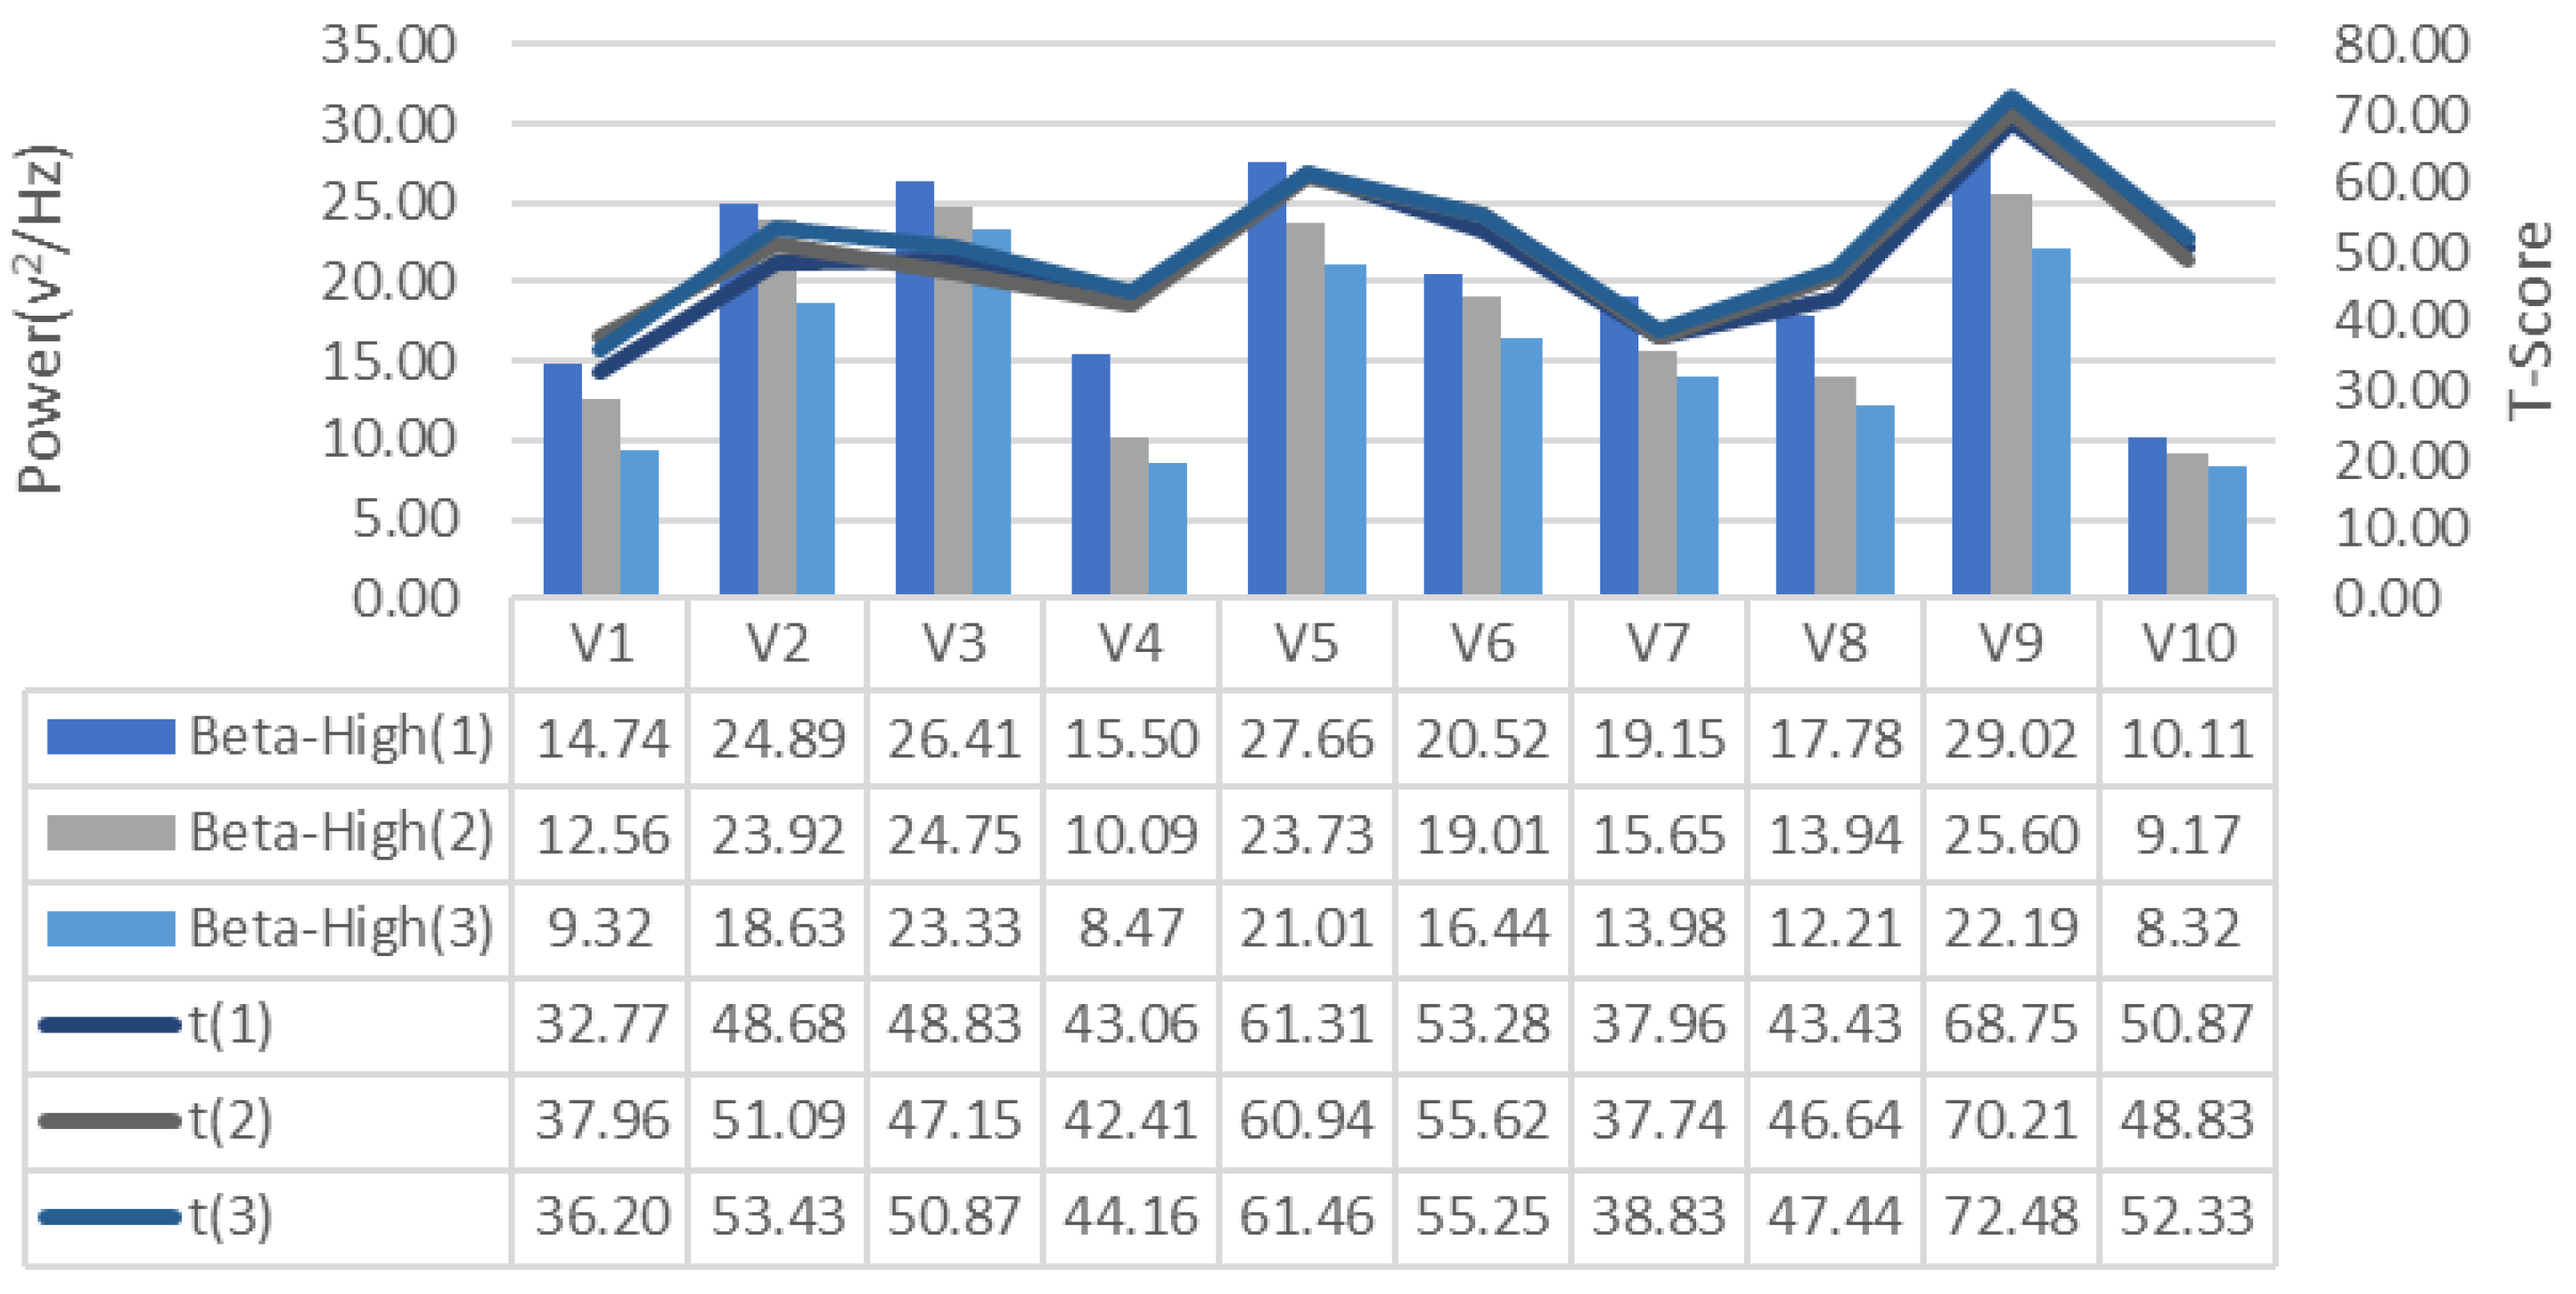
| Beta-High | 21–30 | Alertness, agitation |
| Gamma | >31 | Motor functions |
| Id | Age | Education | Game Experience |
|---|---|---|---|
| V1 | 25 | Bachelor Degree | No |
| V2 | 32 | Doctoral Degree | No |
| V3 | 18 | Bachelor Degree | No |
| V4 | 21 | Bachelor Degree | Yes |
| V5 | 34 | Doctoral Degree | No |
| V6 | 23 | Bachelor Degree | Yes |
| V7 | 21 | Bachelor Degree | Yes |
| V8 | 34 | Doctoral Degree | Yes |
| V9 | 28 | Bachelor Degree | No |
| V10 | 30 | Master Degree | Yes |
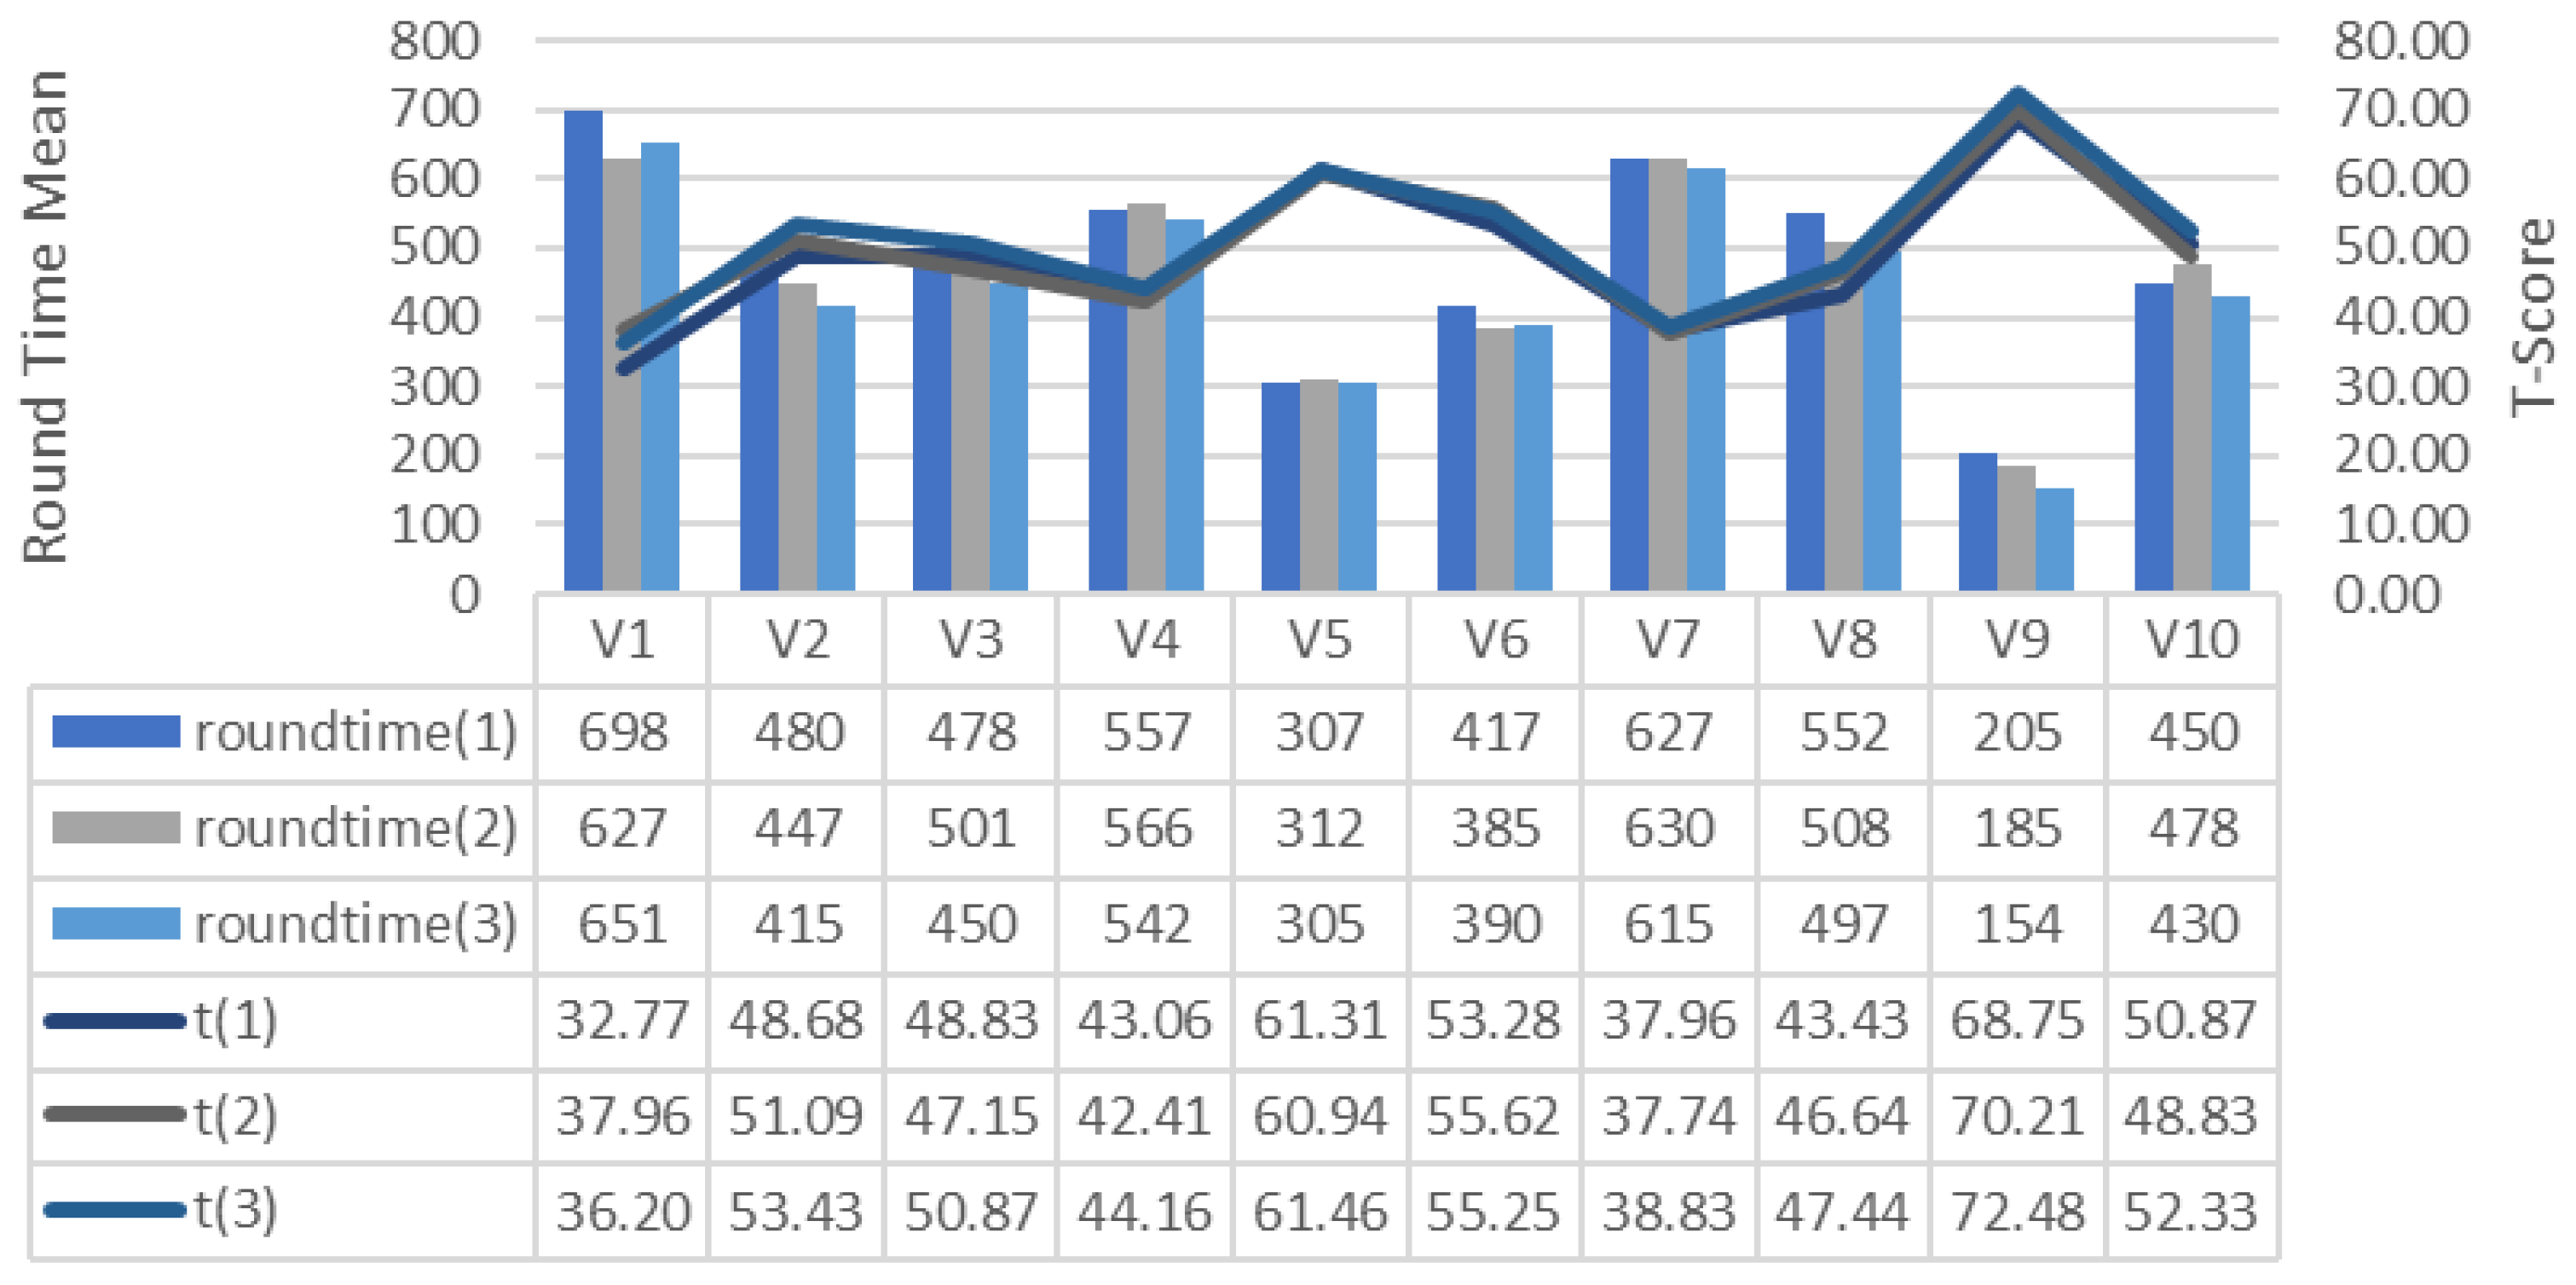
| V1 | V2 | V3 | V4 | V5 | V6 | V7 | V8 | V9 | V10 | |
|---|---|---|---|---|---|---|---|---|---|---|
| Repetition-I | 100 | 400 | 400 | 300 | 800 | 500 | 200 | 300 | 900 | 500 |
| Repetition-II | 200 | 500 | 400 | 300 | 700 | 600 | 200 | 400 | 1000 | 400 |
| Repetition-III | 100 | 500 | 500 | 300 | 800 | 600 | 200 | 400 | 1000 | 500 |
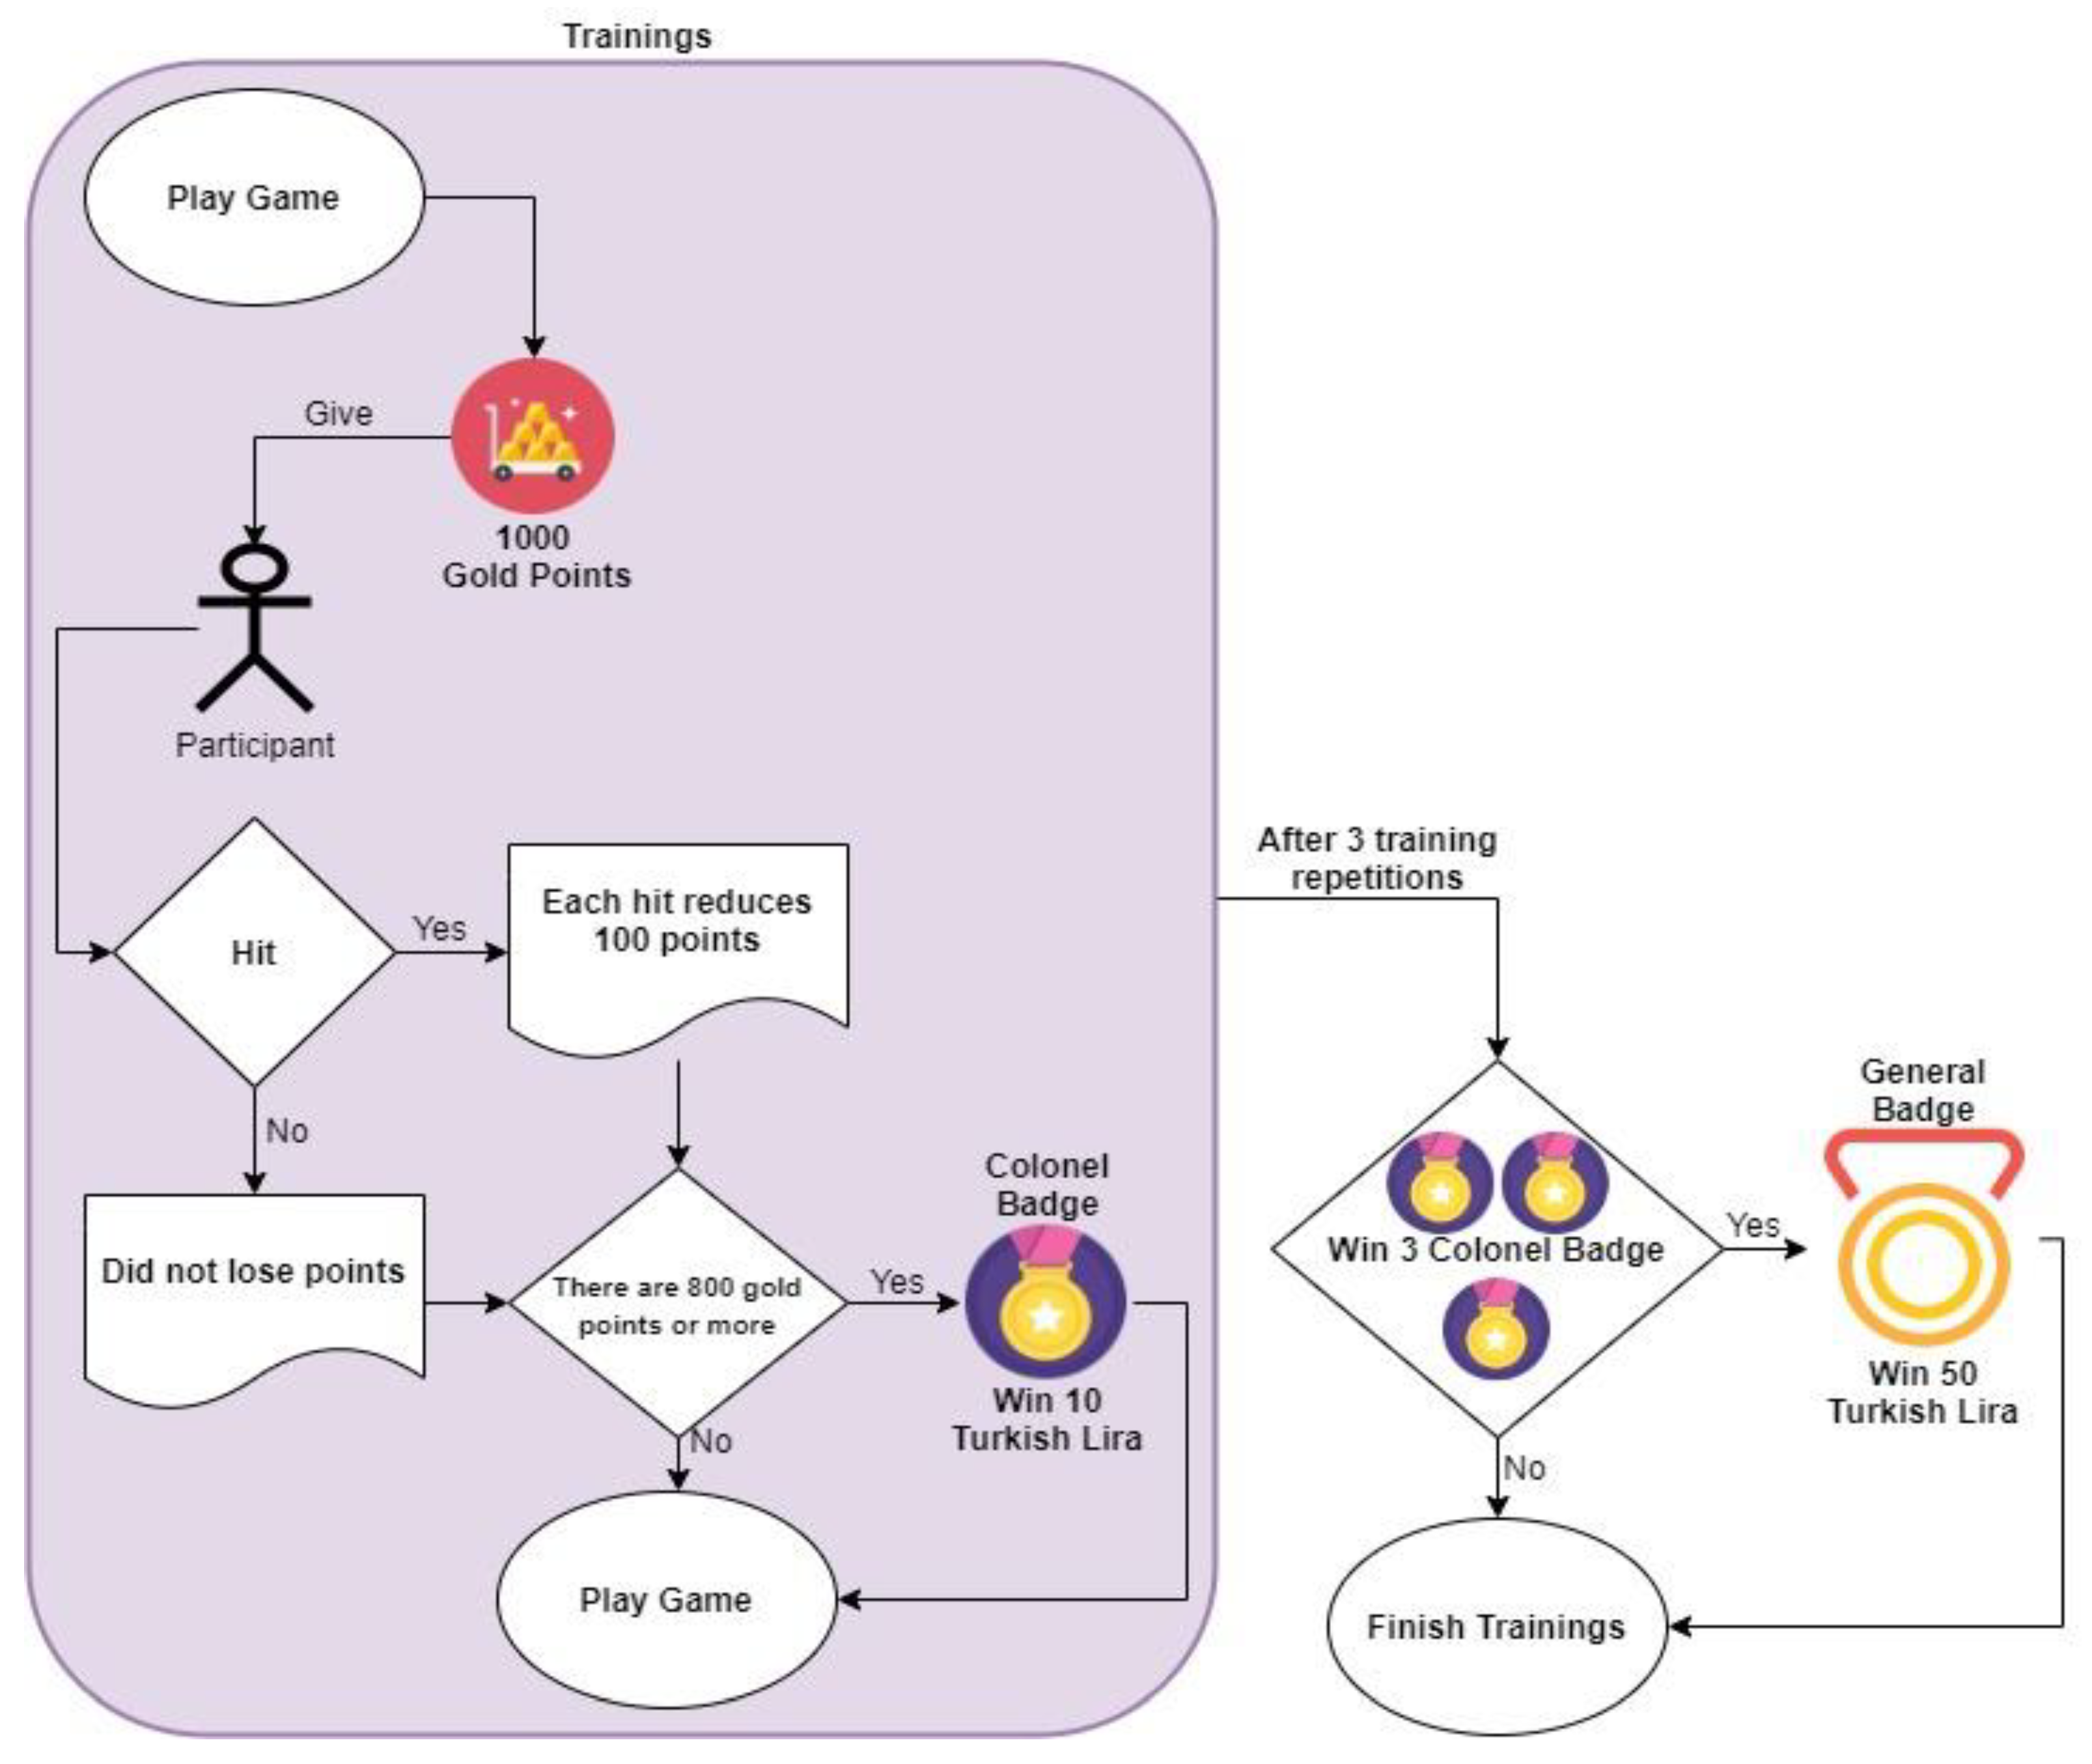
| Track Award | - | - | - | - | 2 Colonel badges | - | - | - | 3 Colonel badges | - |
| Provisions for Awards | - | - | - | - | 20 TL | - | - | - | 1 General badge = 50 TL | - |
| Ksmean | Rtmean | Tsmean | |
|---|---|---|---|
| ksmean | 1.00 | ||
| rtmean | 1.00 | 1.00 | |
| tsmean | −0.99 | −1.00 | 1.00 |
Publisher’s Note: MDPI stays neutral with regard to jurisdictional claims in published maps and institutional affiliations. |
© 2021 by the authors. Licensee MDPI, Basel, Switzerland. This article is an open access article distributed under the terms and conditions of the Creative Commons Attribution (CC BY) license (https://creativecommons.org/licenses/by/4.0/).
Share and Cite
Koç, D.; Seçkin, A.Ç.; Satı, Z.E. Evaluation of Participant Success in Gamified Drone Training Simulator Using Brain Signals and Key Logs. Brain Sci. 2021, 11, 1024. https://doi.org/10.3390/brainsci11081024
Koç D, Seçkin AÇ, Satı ZE. Evaluation of Participant Success in Gamified Drone Training Simulator Using Brain Signals and Key Logs. Brain Sciences. 2021; 11(8):1024. https://doi.org/10.3390/brainsci11081024
Chicago/Turabian StyleKoç, Durmuş, Ahmet Çağdaş Seçkin, and Zümrüt Ecevit Satı. 2021. "Evaluation of Participant Success in Gamified Drone Training Simulator Using Brain Signals and Key Logs" Brain Sciences 11, no. 8: 1024. https://doi.org/10.3390/brainsci11081024
APA StyleKoç, D., Seçkin, A. Ç., & Satı, Z. E. (2021). Evaluation of Participant Success in Gamified Drone Training Simulator Using Brain Signals and Key Logs. Brain Sciences, 11(8), 1024. https://doi.org/10.3390/brainsci11081024