
Studying Brain Activation during Skill Acquisition via Robot-Assisted Surgery Training

 ,
,  ,
,
Abstract
:1. Introduction
2. Materials and Methods
2.1. Participants
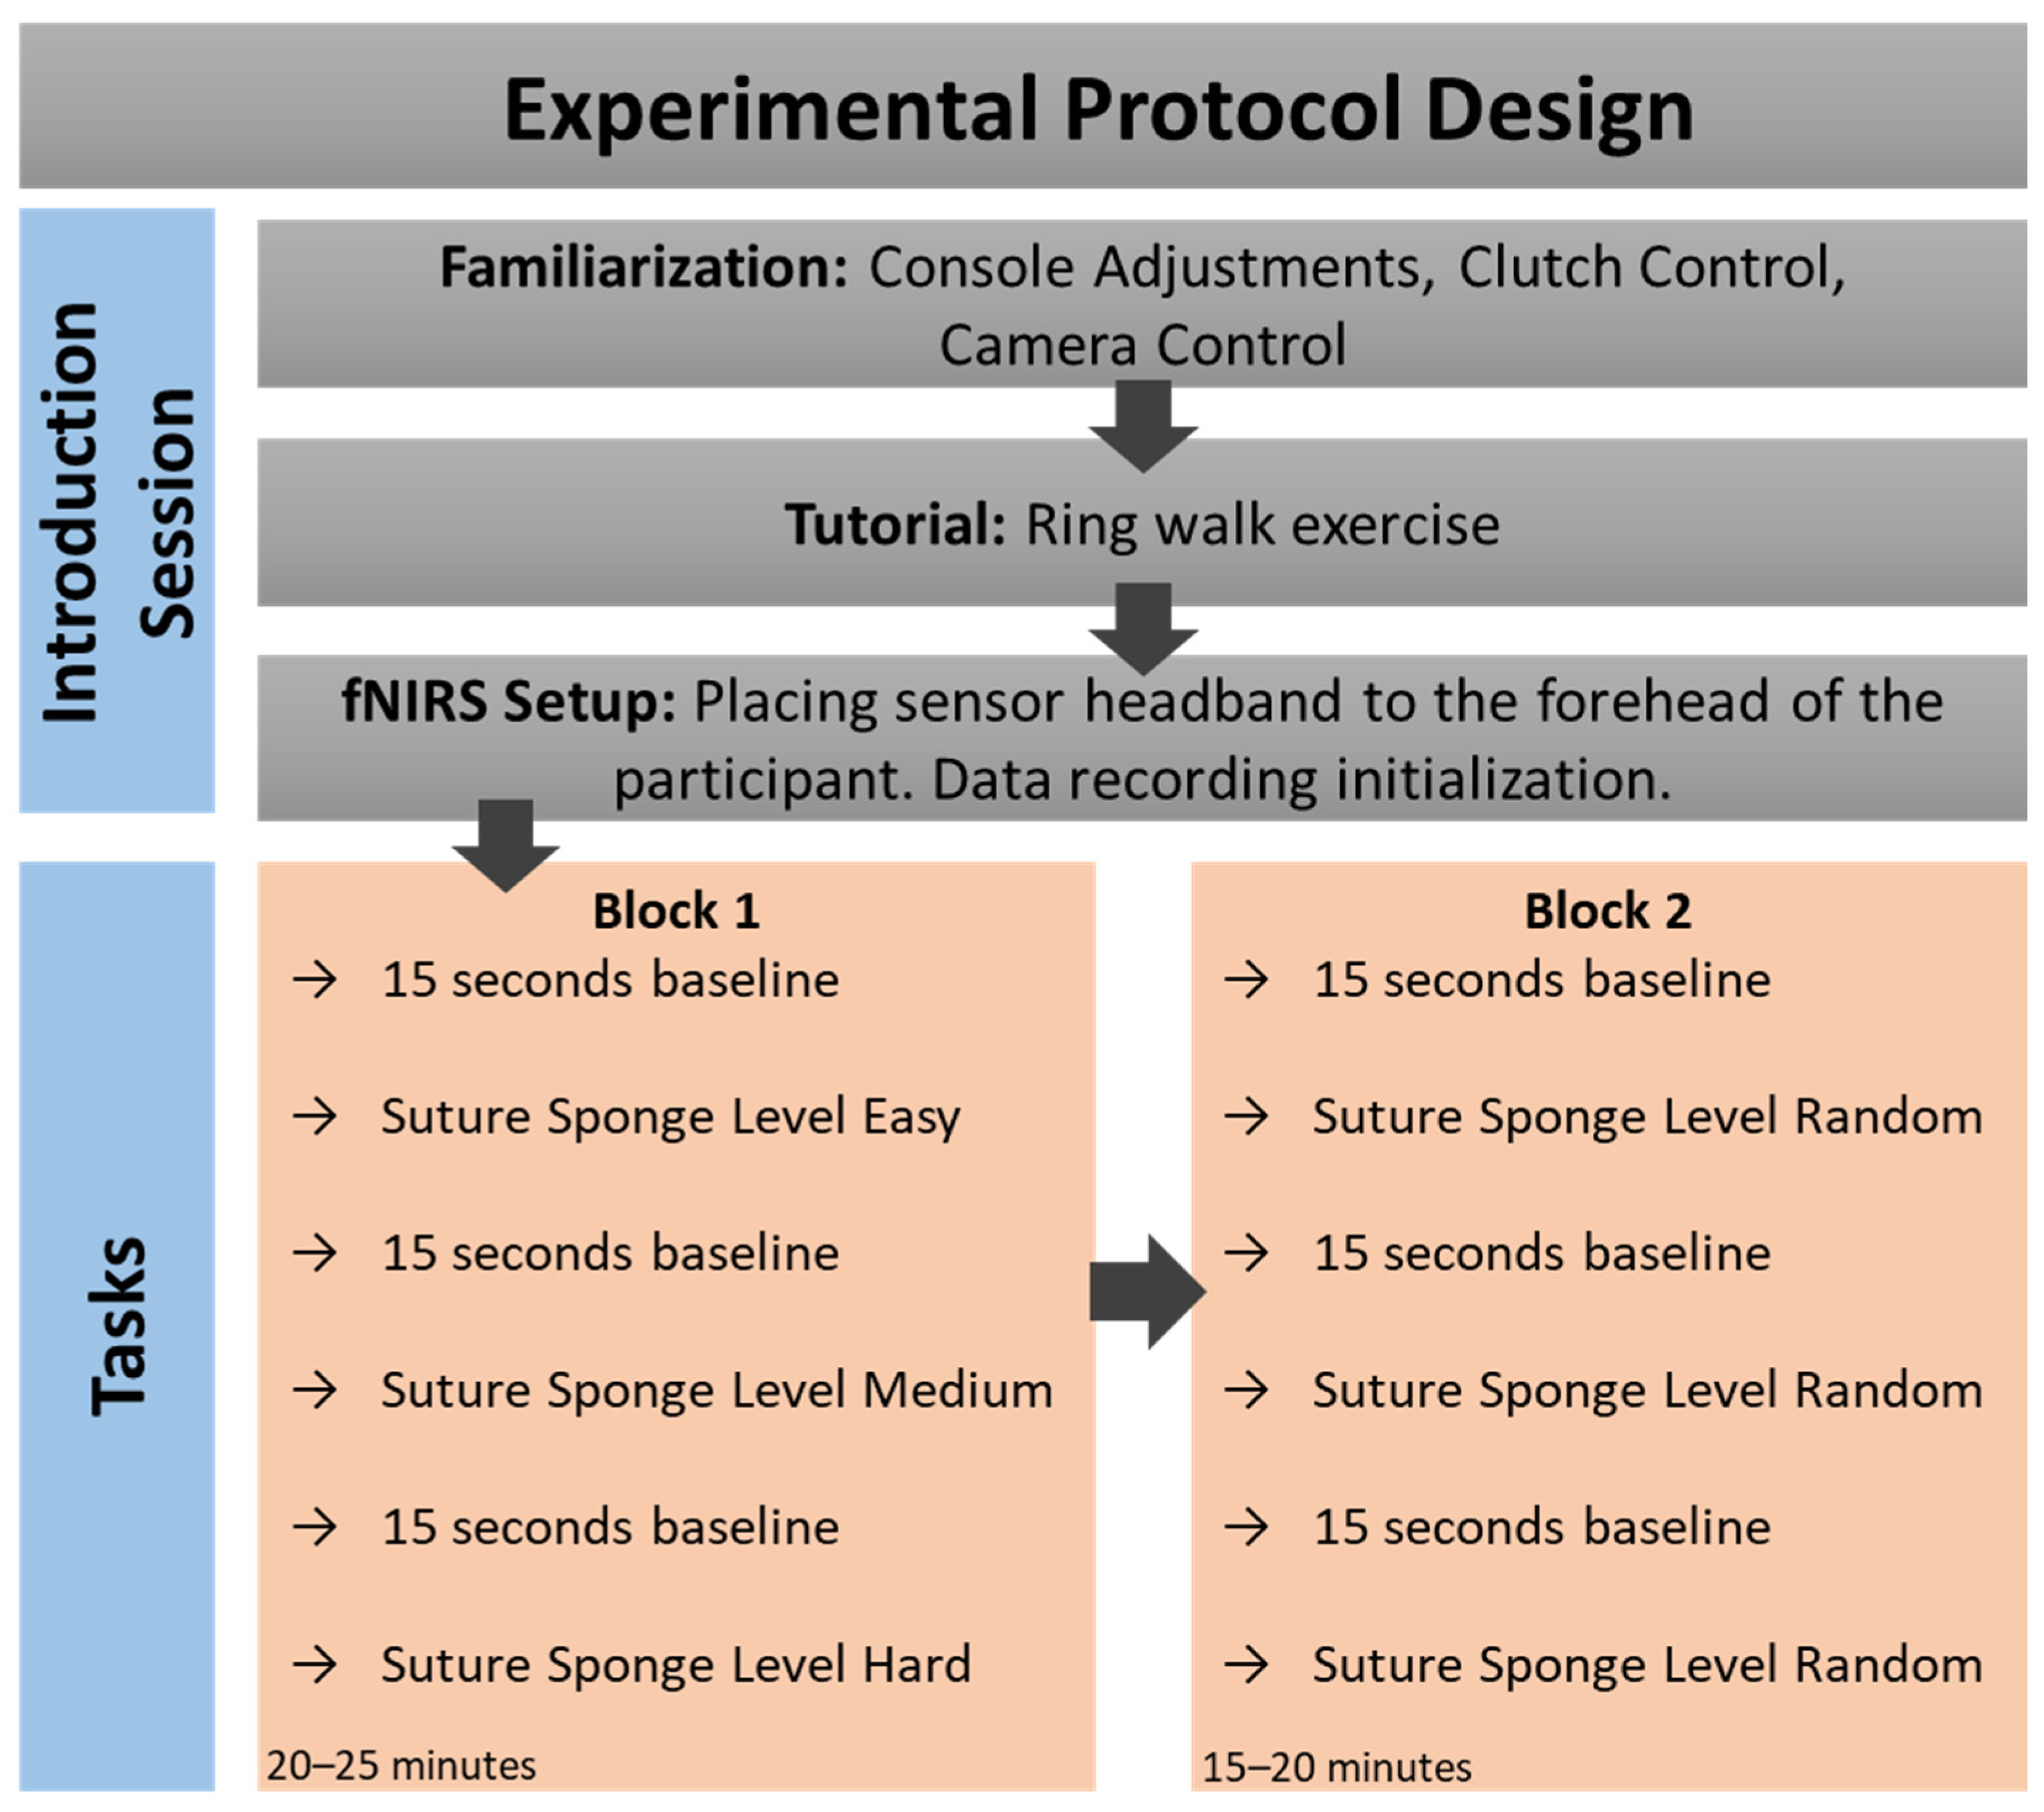
2.2. Experimental Protocol
2.3. Data Processing and Analysis
3. Results
4. Discussion
5. Conclusions
Author Contributions
Funding
Institutional Review Board Statement
Informed Consent Statement
Data Availability Statement
Acknowledgments
Conflicts of Interest
Appendix A

| Task Difficulty | Block 1 | Block 2 | ||
|---|---|---|---|---|
| Mean ± SD | Mean ± SD | p-Value | ||
| Med. (Min–Max) | Med. (Min–Max) | |||
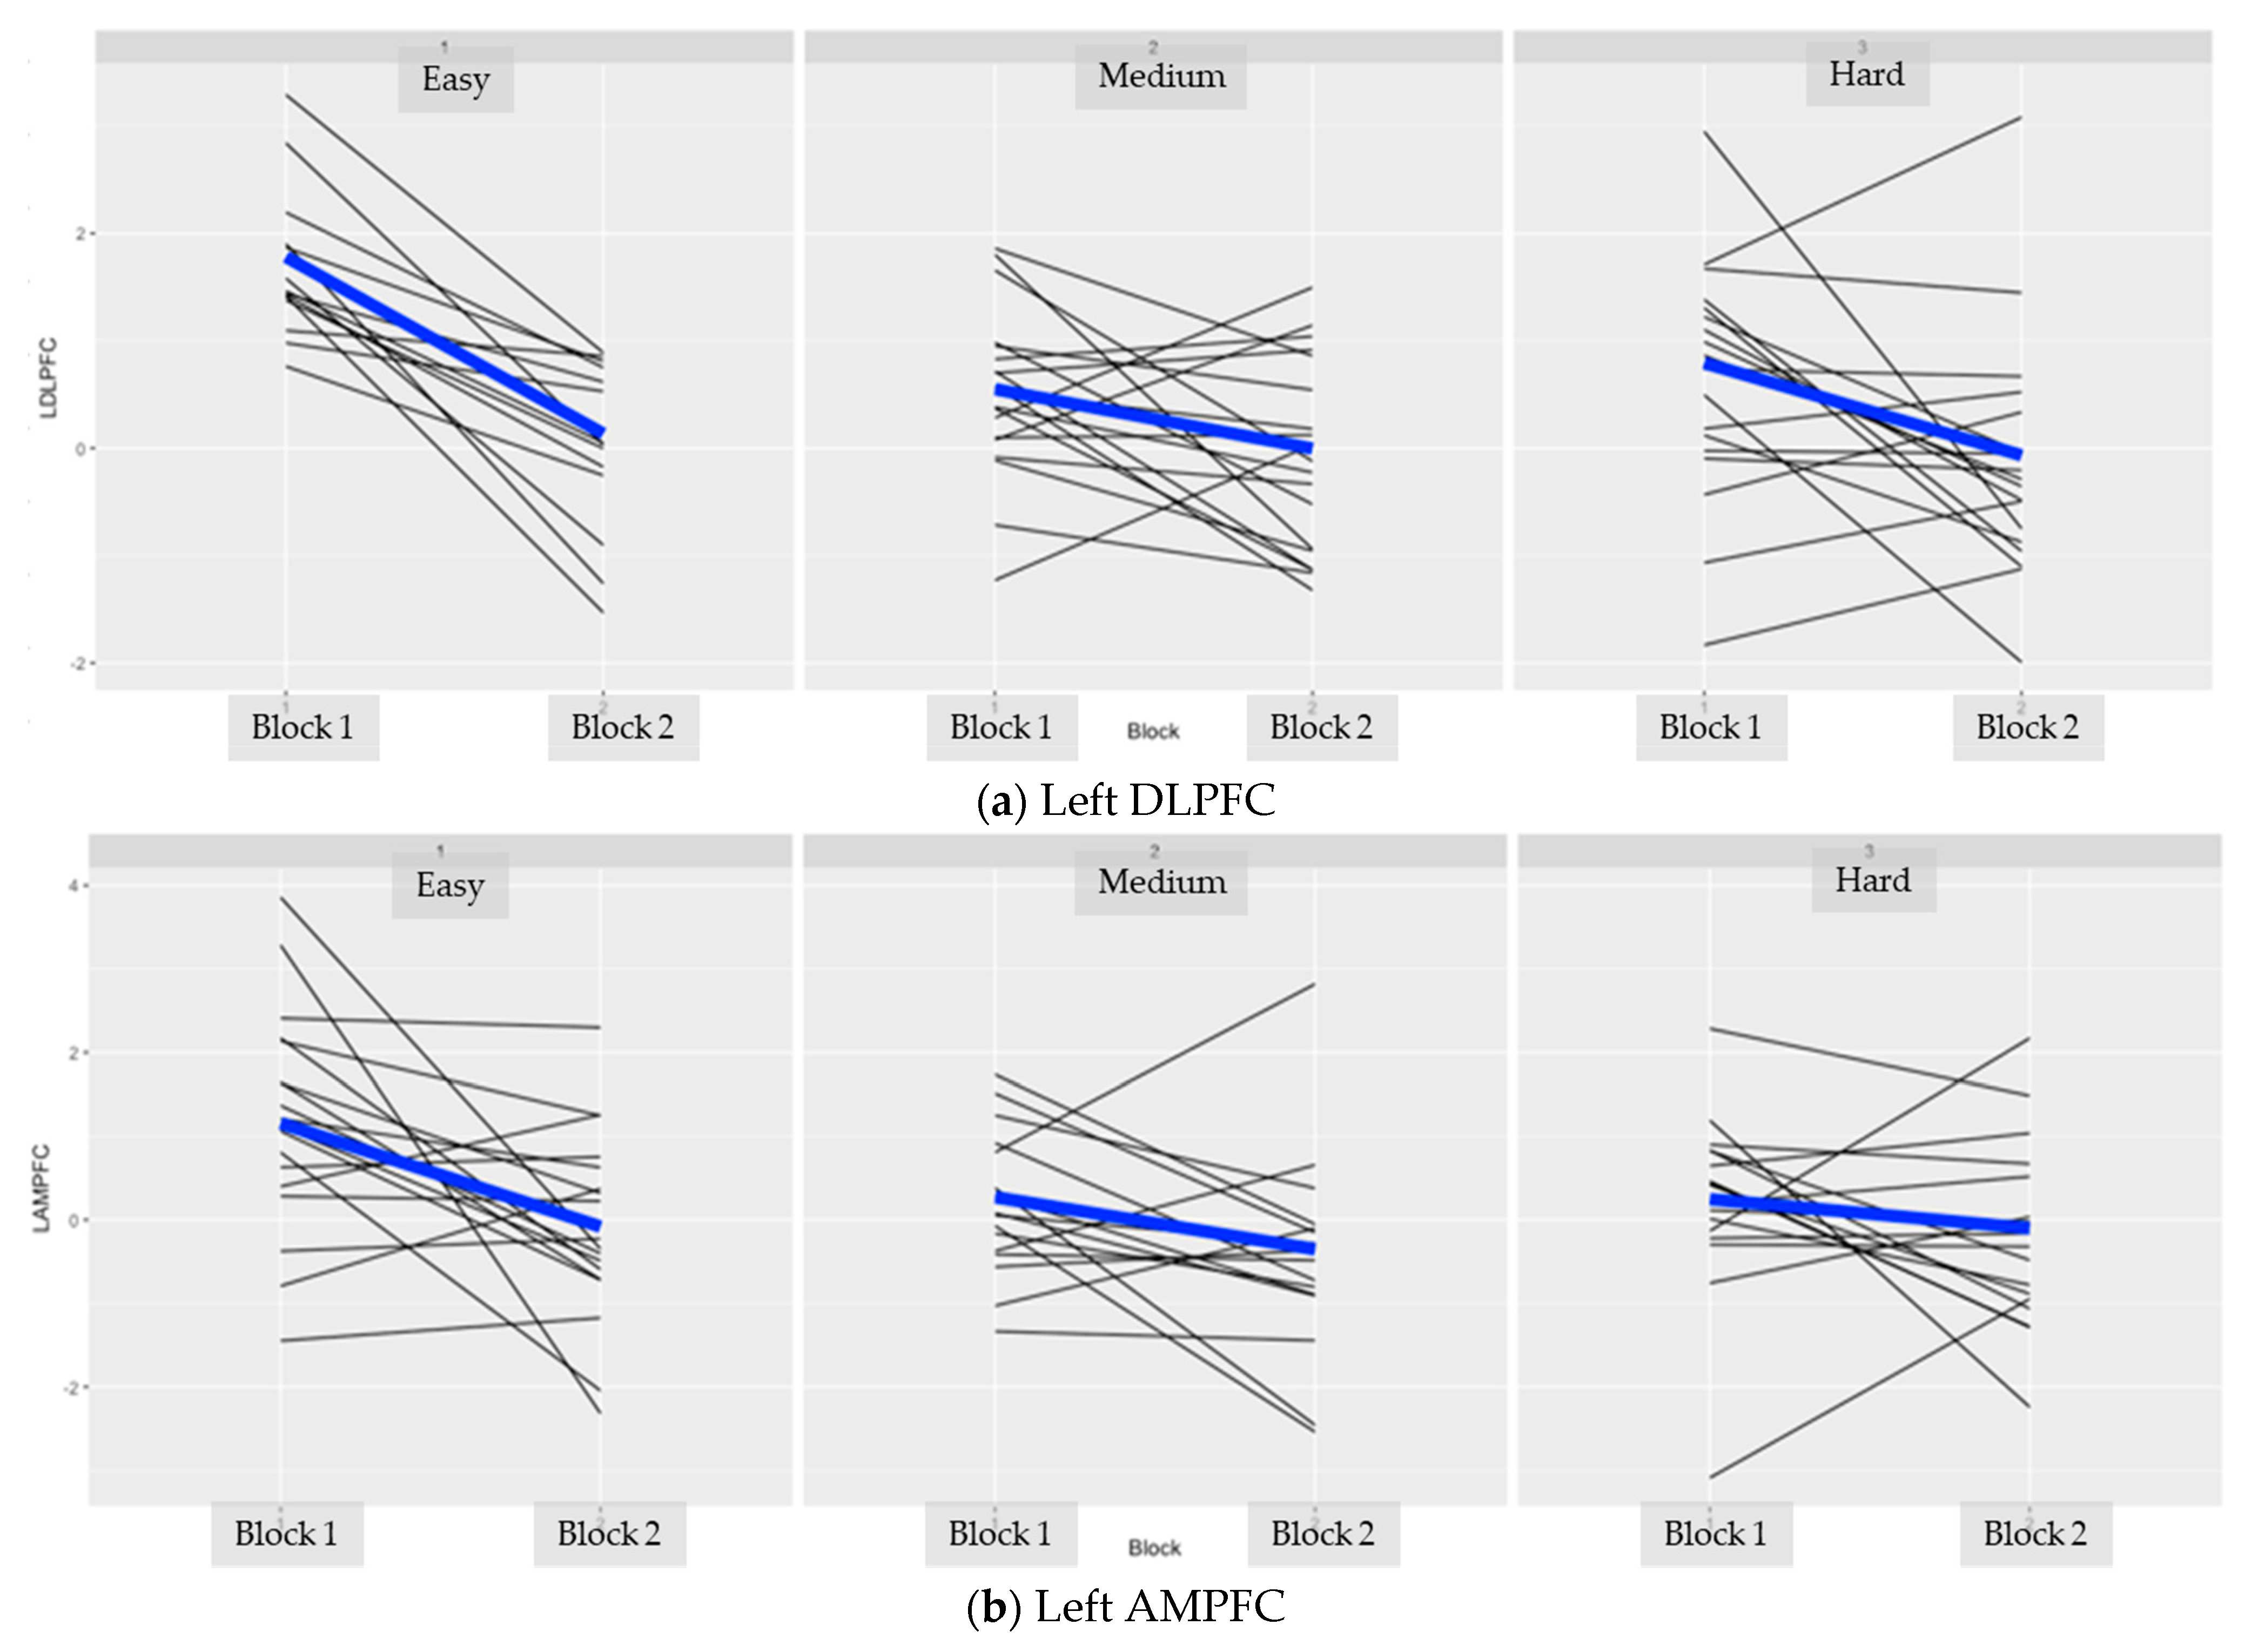
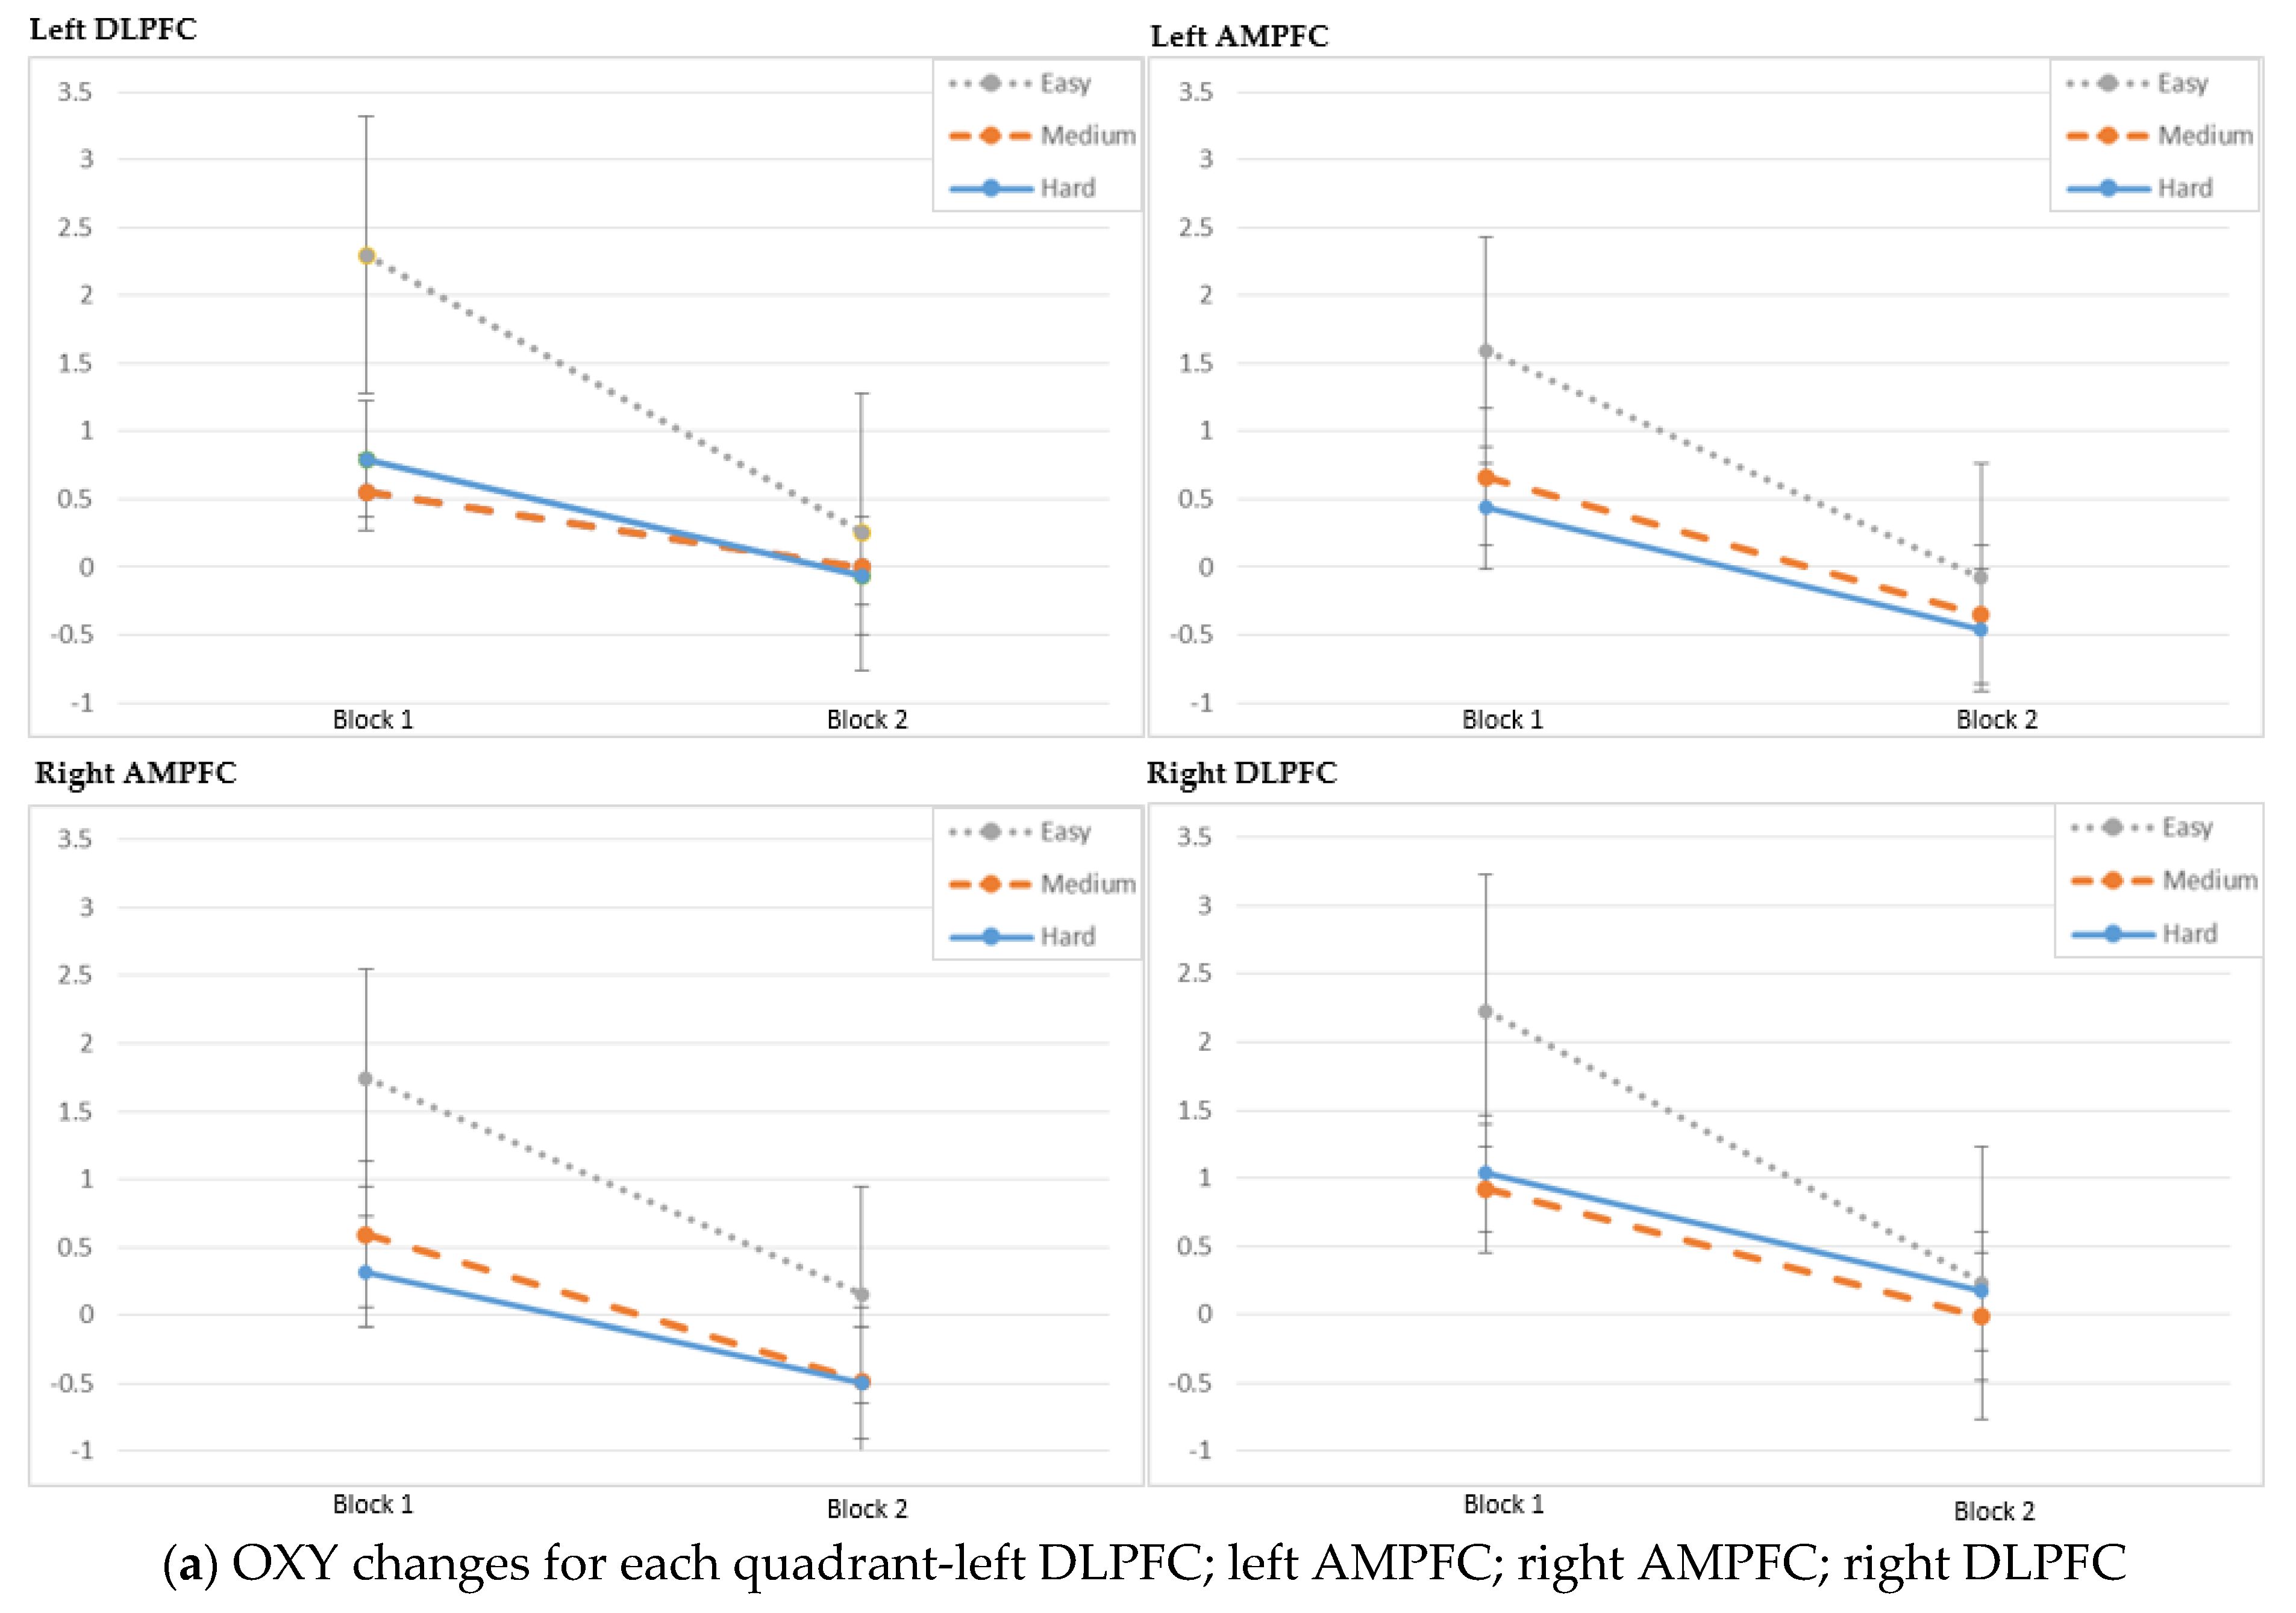
| Easy | 1.78 ± 0.76 | 0.13 ± 0.69 | ||
| 1.46 (0.76–3.29) | 0.32 (−1.53–0.89) | <0.001 2 | ||
| Left DLPFC (Optodes 1–4) | Medium | 0.55 ± 0.79 | 0 ± 0.93 | 0.034 1 |
| 0.55 (−1.23–1.86) | −0.04 (−1.32–1.5) | |||
| Hard | 0.79 ± 1.24 | −0.07 ± 1.15 | 0.029 1 | |
| 0.8 (−1.83–3.31) | −0.29 (−1.99–3.08) | |||
| Easy | 1.16 ± 1.31 | −0.08 ± 1.1 | ||
| 1.12 (−1.45–3.86) | −0.29 (−2.32–2.3) | 0.007 1 | ||
| Left AMPFC (Optodes 5–8) | Medium | 0.27 ± 1.1 | −0.35 ± 1.25 | 0.064 1 |
| 0.08 (−1.5–2.86) | −0.39 (−2.54–2.82) | |||
| Hard | 0.25 ± 1.02 | −0.1 ± 1.18 | 0.246 2 | |
| 0.4 (−3.09–2.28) | −0.24 (−2.24–2.17) | |||
| Easy | 1.52 ± 1.31 | 0.15 ± 1.11 | ||
| 1.19 (−0.45–4.73) | 0.08 (−1.73–2.29) | <0.001 1 | ||
| Right AMPFC (Optodes 9–12) | Medium | 0.33 ± 1.22 | −0.48 ± 1.37 | 0.031 2 |
| 0.51 (−3.28–2.08) | −0.49 (−3.49–1.83) | |||
| Hard | 0.32 ± 1.09 | −0.5 ± 1.44 | 0.102 1 | |
| −0.01 (−0.93–3.18) | −0.63 (−3.61–2.84) | |||
| Easy | 1.85 ± 1.09 | 0.23 ± 0.67 | ||
| 2.03 (−0.35–4.2) | 0.28 (−1.46–1.52) | <0.001 1 | ||
| Right DLPFC (Optodes 13–16) | Medium | 0.83 ± 0.87 | −0.02 ± 0.71 | 0.002 1 |
| 0.82 (−0.7–2.68) | −0.05 (−1.18–1.27) | |||
| Hard | 0.93 ± 0.99 | 0.17 ± 0.98 | 0.013 2 | |
| 0.52 (−0.83–2.83) | 0.34 (−2.14–1.97) |
| Task Difficulty | Block 1 | Block 2 | ||
|---|---|---|---|---|
| Mean ± SD | Mean ± SD | p-Value | ||
| Med. (Min–Max) | Med. (Min–Max) | |||
| Easy | 487.73 ± 179.46 | 774.47 ± 250.83 | <0.001 2 | |
| 508.12 (114.72–892.8) | 681.37 (314.4–1396.8) | |||
| Score (points) | Medium | 537.79 ± 206.69 | 656.17 ± 353.94 | 0.056 1 |
| 544.2 (214.89–1050.13) | 644.43 (0–1229.59) | |||
| Hard | 415 ± 238.64 | 481.24 ± 191.3 | 0.081 1 | |
| 404.35 (31.66–1065.6) | 477.25 (165.9–964.8) |
| Task Difficulty | Block 1 | Block 2 | ||
|---|---|---|---|---|
| Mean± SD | Mean± SD | p-Value | ||
| Med. (Min–Max) | Med. (Min–Max) | |||
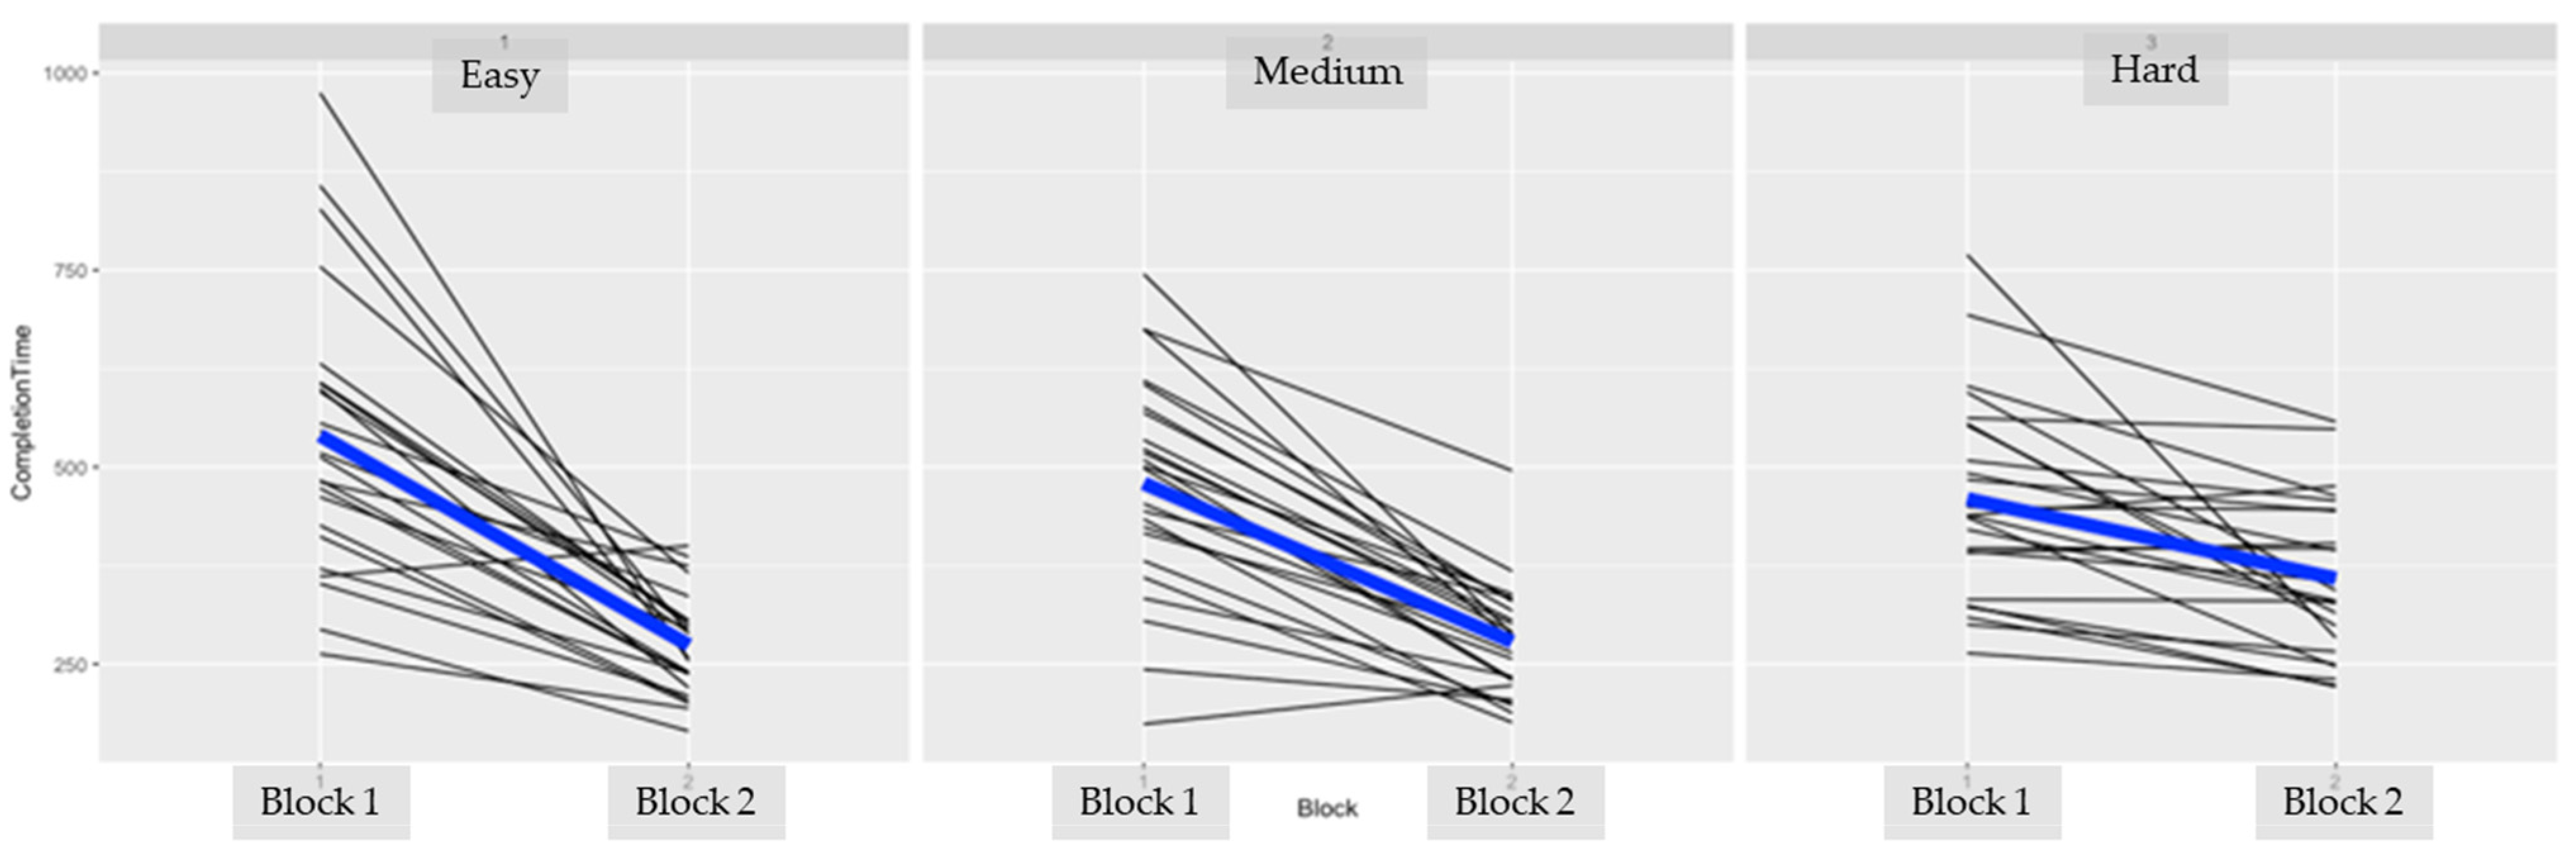
| Task Completion Time (seconds) | Easy | 540.21 ± 177.3 | 274.17 ± 64.52 | |
| 515.38 (263–974.83) | 265.34 (165–400.04) | <0.001 1 | ||
| Medium | 479.5 ± 138.47 | 278.34 ± 71.44 | <0.001 1 | |
| 499.79 (174–745.07) | 283.86 (176–495.55) | |||
| Hard | 459.69 ± 128.09 | 358.74 ± 99.99 | <0.001 1 | |
| 438.9 (264–769.4) | 336.94 (221.47–557.64) |
Appendix B. Individual Subject Data


References
- Valero, R.; Ko, Y.; Chauhan, S.; Schatloff, O.; Sivaraman, A.; Coelho, R.; Ortega, F.; Palmer, K.; Sanchez-Salas, R.; Davilà, H.; et al. Robotic surgery: History and teaching impact. Actas Urológicas Esp. 2011, 35, 540–545. [Google Scholar] [CrossRef]
- Jung, M.; Morel, P.; Buehler, L.H.; Buchs, N.; Hagen, M. Robotic general surgery: Current practice, evidence, and perspective. Langenbeck’s Arch. Surg. 2015, 400, 283–292. [Google Scholar] [CrossRef]
- Nunes, F.F.; Kappaz, G.T.; Franciss, M.Y.; Barchi, L.C.; Zilberstein, B. Applications and Economics Aspects of Robotic Surgery. Int. J. Adv. Robot. Autom. 2016, 1, 1–6. [Google Scholar]
- Leddy, L.; Lendvay, T.; Satava, R. Robotic surgery: Applications and cost effectiveness. Open Access Surg. 2010, 99. [Google Scholar] [CrossRef] [Green Version]
- Sridhar, A.N.; Briggs, T.P.; Kelly, J.D.; Nathan, S. Training in Robotic Surgery—An Overview. Curr. Urol. Rep. 2017, 18, 58. [Google Scholar] [CrossRef] [Green Version]
- Buffi, N.; Van Der Poel, H.; Guazzoni, G.F.; Mottrie, A. Methods and Priorities of Robotic Surgery Training Program. Eur. Urol. 2014, 65, 1–2. [Google Scholar] [CrossRef]
- Schreuder, H.W.R.; Verheijen, R.H.M. Validated Simulation Training for Robotic Surgery. In Proceedings of the 15th Biennial Meeting of the International Gynecologic Cancer Society, Melbourne, Australia, 8–11 November 2014. [Google Scholar]
- Andolfi, C.; Umanskiy, K. Mastering Robotic Surgery: Where Does the Learning Curve Lead Us? J. Laparoendosc. Adv. Surg. Tech. 2017, 27, 470–474. [Google Scholar] [CrossRef]
- Mizota, T.; Dodge, V.G.; Stefanidis, D. Fundamentals of Robotic Surgery. In Fundamentals of General Surgery; Palazzo, F., Ed.; Springer: Cham, Switzerland, 2018; pp. 215–225. [Google Scholar]
- Guru, K.A.; Shafiei, S.B.; Khan, A.; Hussein, A.A.; Sharif, M.; Esfahani, E.T. Understanding Cognitive Performance during Robot-Assisted Surgery. Urology 2015, 86, 751–757. [Google Scholar] [CrossRef] [PubMed]
- Jöbsis, F.F. Noninvasive, infrared monitoring of cerebral and myocardial oxygen sufficiency and circulatory parameters. Science 1977, 198, 1264–1267. [Google Scholar] [CrossRef]
- Rolfe, P. In Vivo Near-Infrared Spectroscopy. Annu. Rev. Biomed. Eng. 2000, 2, 715–754. [Google Scholar] [CrossRef]
- Cope, M.; Delpy, D.T. System for long-term measurement of cerebral blood and tissue oxygenation on newborn infants by near infra-red transillumination. Med. Biol. Eng. Comput. 1988, 26, 289–294. [Google Scholar] [CrossRef]
- Izzetoglu, K.; Bunce, S.; Onaral, B.; Pourrezaei, K.; Chance, B. Functional Optical Brain Imaging Using Near-Infrared during Cognitive Tasks. Int. J. Hum. Comput. Interact. 2004, 17, 211–227. [Google Scholar] [CrossRef]
- Ayaz, H.; Shewokis, P.A.; Bunce, S.; Izzetoglu, K.; Willems, B.; Onaral, B. Optical brain monitoring for operator training and mental workload assessment. NeuroImage 2012, 59, 36–47. [Google Scholar] [CrossRef] [PubMed]
- Izzetoglu, K.; Ayaz, H.; Merzagora, A.; Izzetoglu, M.; Shewokis, P.A.; Bunce, S.C.; Pourrezaei, K.; Rosen, A.; Onaral, B. The evolution of field deployable fnir spectroscopy from bench to clinical settings. J. Innov. Opt. Health Sci. 2011, 4, 239–250. [Google Scholar] [CrossRef]
- Izzetoglu, K.; Yurtsever, G.; Bozkurt, A.; Bunce, S. Functional brain monitoring via NIR based optical spectroscopy. In Proceedings of the 2003 IEEE 29th Annual Proceedings of Bioengineering Conference, Newark, NJ, USA, 22–23 March 2003; pp. 335–336. [Google Scholar]
- Aksoy, E.; Izzetoglu, K.; Baysoy, E.; Agrali, A.; Kitapcioglu, D.; Onaral, B. Performance Monitoring via Functional Near Infrared Spectroscopy for Virtual Reality Based Basic Life Support Training. Front. Neurosci. 2019, 13, 1336. [Google Scholar] [CrossRef] [PubMed] [Green Version]
- Singh, H.; Modi, H.N.; Ranjan, S.; Dilley, J.W.R.; Airantzis, D.; Yang, G.-Z.; Darzi, A.; Leff, D. Robotic Surgery Improves Technical Performance and Enhances Prefrontal Activation during High Temporal Demand. Ann. Biomed. Eng. 2018, 46, 1621–1636. [Google Scholar] [CrossRef] [Green Version]
- Ayaz, H.; Izzetoglu, M.; Platek, S.M.; Bunce, S.; Izzetoglu, K.; Pourrezaei, K.; Onaral, B. Registering fNIR data to brain surface image using MRI templates. In Proceedings of the 2006 International Conference of the IEEE Engineering in Medicine and Biology Society, New York, NY, USA, 30 August–3 September 2006; pp. 2671–2674. [Google Scholar]
- Brysbaert, M.; Stevens, M. Power Analysis and Effect Size in Mixed Effects Models: A Tutorial. J. Cogn. 2018, 1, 9. [Google Scholar] [CrossRef] [Green Version]
- Westfall, J.; Kenny, D.A.; Judd, C.M. Statistical power and optimal design in experiments in which samples of participants respond to samples of stimuli. J. Exp. Psychol. Gen. 2014, 143, 2020–2045. [Google Scholar] [CrossRef] [Green Version]
- Bates, D.; Mächler, M.; Bolker, B.; Walker, S. lme4: Linear mixed-effects models using Eigen and S4. R package version 1.1-8. J. Stat. Softw. 2015, 67, 1–48. [Google Scholar] [CrossRef]
- Kuznetsova, A.; Brockhoff, P.B.; Christensen, R.H.B. lmerTest Package: Tests in Linear Mixed Effects Models. J. Stat. Softw. 2017, 82, 1–26. [Google Scholar] [CrossRef] [Green Version]
- Izzetoglu, K.; Richards, D. Human Performance Assessment: Evaluation of Wearable Sensors for Monitoring Brain Activity. In Improving Aviation Performance through Applying Engineering Psychology: Advances in Aviation Psychology, 1st ed.; Vidulich, M., Tsang, P., Eds.; CRC Press: Boca Raton, FL, USA, 2019; pp. 163–180. [Google Scholar]
- James, D.R.C.; Orihuela-Espina, F.; Leff, D.R.; Mylonas, G.P.; Kwok, K.-W.; Darzi, A.W.; Yang, G.-Z. Cognitive Burden Estimation for Visuomotor Learning with fNIRS. Comput. Vis. 2010, 13, 319–326. [Google Scholar] [CrossRef] [Green Version]
- Kelly, A.M.C.; Garavan, H. Human Functional Neuroimaging of Brain Changes Associated with Practice. Cereb. Cortex 2005, 15, 1089–1102. [Google Scholar] [CrossRef] [PubMed] [Green Version]
- Milton, J.G.; Small, S.; Solodkin, A. On the Road to Automatic: Dynamic Aspects in the Development of Expertise. J. Clin. Neurophysiol. 2004, 21, 134–143. [Google Scholar] [CrossRef]
- Shmuel, A.; Yacoub, E.; Pfeuffer, J.; Van de Moortele, P.-F.; Adriany, G.; Hu, X.; Ugurbil, K. Sustained Negative BOLD, Blood Flow and Oxygen Consumption Response and Its Coupling to the Positive Response in the Human Brain. Neuron 2002, 36, 1195–1210. [Google Scholar] [CrossRef] [Green Version]
- Galoyan, T.; Betts, K.; Abramian, H.; Reddy, P.; Izzetoglu, K.; Shewokis, P.A. Examining Mental Workload in a Spatial Navigation Transfer Game via Functional near Infrared Spectroscopy. Brain Sci. 2021, 11, 45. [Google Scholar] [CrossRef] [PubMed]
- Shewokis, P.A.; Shariff, F.U.; Liu, Y.; Ayaz, H.; Castellanos, A.; Lind, D.S. Acquisition, retention and transfer of simulated laparoscopic tasks using fNIR and a contextual interference paradigm. Am. J. Surg. 2017, 213, 336–345. [Google Scholar] [CrossRef] [Green Version]
- Shetty, K.; Leff, D.R.; Orihuela-Espina, F.; Yang, G.-Z.; Darzi, A. Persistent Prefrontal Engagement Despite Improvements in Laparoscopic Technical Skill. JAMA Surg. 2016, 151, 682–684. [Google Scholar] [CrossRef] [Green Version]
- Logothetis, N.K.; Wandell, B.A. Interpreting the BOLD Signal. Annu. Rev. Physiol. 2004, 66, 735–769. [Google Scholar] [CrossRef]
- Berka, C.; Levendowski, D.J.; Cvetinovic, M.M.; Petrovic, M.M.; Davis, G.; Lumicao, M.N.; Zivkovic, V.T.; Popovic, M.V.; Olmstead, R. Real-Time Analysis of EEG Indexes of Alertness, Cognition, and Memory Acquired with a Wireless EEG Headset. Int. J. Hum. Comput. Interact. 2004, 17, 151–170. [Google Scholar] [CrossRef]
- Ohuchida, K.; Kenmotsu, H.; Yamamoto, A.; Sawada, K.; Hayami, T.; Morooka, K.; Takasugi, S.; Konishi, K.; Ieiri, S.; Tanoue, K.; et al. The frontal cortex is activated during learning of endoscopic procedures. Surg. Endosc. 2009, 23, 2296–2301. [Google Scholar] [CrossRef]
- Nemani, A.; Yucel, M.; Kruger, U.; Gee, D.W.; Cooper, C.; Schwaitzberg, S.D.; De, S.; Intes, X. Assessing bimanual motor skills with optical neuroimaging. Sci. Adv. 2018, 4, eaat3807. [Google Scholar] [CrossRef] [Green Version]
- Modi, H.N.; Singh, H.; Yang, G.-Z.; Darzi, A.; Leff, D.R. A decade of imaging surgeons’ brain function (part I): Terminology, techniques, and clinical translation. Surgery 2017, 162, 1121–1130. [Google Scholar] [CrossRef] [PubMed]
- Nemani, A.; Kruger, U.; Cooper, C.A.; Schwaitzberg, S.D.; Intes, X.; De, S. Objective assessment of surgical skill transfer using non-invasive brain imaging. Surg. Endosc. 2018, 33, 2485–2494. [Google Scholar] [CrossRef] [PubMed]
- Tachtsidis, I.; Scholkmann, F. False positives and false negatives in functional near-infrared spectroscopy: Issues, challenges, and the way forward. Neurophotonics 2016, 3, 031405. [Google Scholar] [CrossRef] [PubMed] [Green Version]


| Dependent Variable | Term | logLik | Chisq (χ2) | df | p-Value |
|---|---|---|---|---|---|
| Score | Block | −982.33 | 21.92 | 1.00 | 0.000 |
| Score | Task Difficulty | −968.57 | 27.52 | 2.00 | 0.000 |
| Score | Block:Difficulty | −962.88 | 11.37 | 2.00 | 0.003 |
| Completion Time | Block | 119.03 | 114.37 | 1.00 | 0.000 |
| Completion Time | Task Difficulty | 122.38 | 6.70 | 2.00 | 0.035 |
| Completion Time | Block:Difficulty | 136.71 | 28.68 | 2.00 | 0.000 |
| Dependent Variable | Term | logLik | Chisq (χ2) | df | p-Value | |
|---|---|---|---|---|---|---|
| OXY | ||||||
| Left DLPFC | Block | −165.83 | 25.42 | 1.00 | 0.000 | |
| Left DLPFC | Task Difficulty | −160.50 | 10.66 | 2.00 | 0.005 | |
| Left DLPFC | Block:Difficulty | −156.39 | 8.21 | 2.00 | 0.016 | |
| Left AMPFC | Block | −177.53 | 12.82 | 1.00 | 0.000 | |
| Left AMPFC | Task Difficulty | −174.02 | 7.01 | 2.00 | 0.030 | |
| Left AMPFC | Block:Difficulty | −171.87 | 4.30 | 2.00 | 0.116 | |
| Right AMPFC | Block | −192.93 | 17.20 | 1.00 | 0.000 | |
| Right AMPFC | Task Difficulty | −183.12 | 19.63 | 2.00 | 0.000 | |
| Right AMPFC | Block:Difficulty | −181.97 | 2.31 | 2.00 | 0.316 | |
| Right DLPFC | Block | −180.78 | 42.53 | 1.00 | 0.000 | |
| Right DLPFC | Task Difficulty | −173.71 | 14.14 | 2.00 | 0.001 | |
| Right DLPFC | Block:Difficulty | −169.11 | 9.21 | 2.00 | 0.010 | |
| HbO | ||||||
| Left DLPFC | Block | −161.33 | 15.47 | 1.00 | 0.000 | |
| Left DLPFC | Task Difficulty | −153.56 | 15.54 | 2.00 | 0.000 | |
| Left DLPFC | Block:Difficulty | −149.21 | 8.71 | 2.00 | 0.013 | |
| Left AMPFC | Block | −197.71 | 6.34 | 1.00 | 0.012 | |
| Left AMPFC | Task Difficulty | −195.44 | 4.54 | 2.00 | 0.103 | |
| Left AMPFC | Block:Difficulty | −194.42 | 2.05 | 2.00 | 0.359 | |
| Right AMPFC | Block | −202.85 | 9.39 | 1.00 | 0.002 | |
| Right AMPFC | Task Difficulty | −202.20 | 1.29 | 2.00 | 0.526 | |
| Right AMPFC | Block:Difficulty | −200.13 | 4.16 | 2.00 | 0.125 | |
| Right DLPFC | Block | −173.56 | 31.21 | 1.00 | 0.000 | |
| Right DLPFC | Task Difficulty | −168.14 | 10.84 | 2.00 | 0.004 | |
| Right DLPFC | Block:Difficulty | −163.48 | 9.32 | 2.00 | 0.009 | |
| HbR | ||||||
| Left DLPFC | Block | −124.97 | 9.76 | 1.00 | 0.002 | |
| Left DLPFC | Task Difficulty | −121.88 | 6.19 | 2.00 | 0.045 | |
| Left DLPFC | Block:Difficulty | −118.57 | 6.61 | 2.00 | 0.037 | |
| Left AMPFC | Block | −144.26 | 8.13 | 1.00 | 0.004 | |
| Left AMPFC | Task Difficulty | −144.18 | 0.15 | 2.00 | 0.929 | |
| Left AMPFC | Block:Difficulty | −141.22 | 5.93 | 2.00 | 0.052 | |
| Right AMPFC | Block | −156.38 | 1.71 | 1.00 | 0.191 | |
| Right AMPFC | Task Difficulty | −153.64 | 5.47 | 2.00 | 0.065 | |
| Right AMPFC | Block:Difficulty | −150.83 | 5.62 | 2.00 | 0.060 | |
| Right DLPFC | Block | −142.37 | 16.07 | 1.00 | 0.000 | |
| Right DLPFC | Task Difficulty | −139.50 | 5.73 | 2.00 | 0.057 | |
| Right DLPFC | Block:Difficulty | −136.88 | 5.26 | 2.00 | 0.072 | |
Publisher’s Note: MDPI stays neutral with regard to jurisdictional claims in published maps and institutional affiliations. |
© 2021 by the authors. Licensee MDPI, Basel, Switzerland. This article is an open access article distributed under the terms and conditions of the Creative Commons Attribution (CC BY) license (https://creativecommons.org/licenses/by/4.0/).
Share and Cite
Izzetoglu, K.; Aksoy, M.E.; Agrali, A.; Kitapcioglu, D.; Gungor, M.; Simsek, A. Studying Brain Activation during Skill Acquisition via Robot-Assisted Surgery Training. Brain Sci. 2021, 11, 937. https://doi.org/10.3390/brainsci11070937
Izzetoglu K, Aksoy ME, Agrali A, Kitapcioglu D, Gungor M, Simsek A. Studying Brain Activation during Skill Acquisition via Robot-Assisted Surgery Training. Brain Sciences. 2021; 11(7):937. https://doi.org/10.3390/brainsci11070937
Chicago/Turabian StyleIzzetoglu, Kurtulus, Mehmet Emin Aksoy, Atahan Agrali, Dilek Kitapcioglu, Mete Gungor, and Aysun Simsek. 2021. "Studying Brain Activation during Skill Acquisition via Robot-Assisted Surgery Training" Brain Sciences 11, no. 7: 937. https://doi.org/10.3390/brainsci11070937
APA StyleIzzetoglu, K., Aksoy, M. E., Agrali, A., Kitapcioglu, D., Gungor, M., & Simsek, A. (2021). Studying Brain Activation during Skill Acquisition via Robot-Assisted Surgery Training. Brain Sciences, 11(7), 937. https://doi.org/10.3390/brainsci11070937