Article

Using System Identification to Construct an Inherent Model of Pupillary Light Reflex to Explore Diabetic Neuropathy

1
Institute of Electrical and Control Engineering, National Yang Ming Chiao Tung University, Hsinchu 300, Taiwan
2
Institute of Biomedical Engineering, National Yang Ming Chiao Tung University, Hsinchu 300, Taiwan
*
Author to whom correspondence should be addressed.
Brain Sci. 2021, 11(7), 852; https://doi.org/10.3390/brainsci11070852
Submission received: 2 June 2021 / Revised: 23 June 2021 / Accepted: 24 June 2021 / Published: 25 June 2021

Abstract

:
This study proposed a pupillary light reflex (PLR) inherent model based on the system identification method to demonstrate the dynamic physiological mechanism of the PLR, in which pupillary constriction and dilation are controlled by the sympathetic and parasympathetic nervous system. This model was constructed and verified by comparing the simulated and predicted PLR response with that of healthy participants. The least root-mean-square error (RMSE) of simulated PLR response was less than 0.7% when stimulus duration was under 3 ms. The RMSE of predicted PLR response increased by approximately 6.76%/s from the stimulus duration of 1 ms to 3 s, when the model directly used the parameters extracted from the PLR at the stimulus duration of 10 ms. When model parameters were derived from the regression by the measured PLR response, the RMSE kept under 8.5%. The model was applied to explore the PLR abnormalities of the people with Diabetic Mellitus (DM) by extracting the model parameters from 42 people with DM and comparing these parameters with those of 42 healthy participants. The parameter in the first-order term of the elastic force of the participants with DM was significantly lower than that of the healthy participants (p < 0.05). The sympathetic force and sympathetic action delay of the participants with DM were significantly larger (p < 0.05) and longer (p < 0.0001) than that of the healthy ones, respectively. The reason might be that the sympathetic nervous system, which controls the dilator muscle, degenerated in diabetic patients.

1. Introduction

The autonomic nervous system (ANS) is composed of sympathetic nervous systems (SNS) and parasympathetic nervous systems (PSNS) [1]. SNS and PSNS antagonize each other to maintain the balance of the human body. Once ANS is out of balance, it is called dysautonomia, which deeply affects many organizations and body function, including body temperature, blood pressure, heart rate, digestion, urination, bowel movement, and pupillary light reflex (PLR). ANS dysregulation directly affects the central nervous system and organs controlled by ANS, and has apparent symptoms in passive organs [2,3]. Pupillary control involves the different neuroanatomical pathways that are mainly controlled by ANS. Thus, the abnormalities of ANS may be directly observed from PLR.
In recent years, many studies [4,5,6,7,8,9,10,11,12,13,14,15,16,17,18,19,20,21,22,23,24,25] have tried to examine the abnormalities of ANS through PLR since PLR can be quickly measured in a non-invasive way and easily be quantized for analysis by recoding pupillary images. Surakka et al. [6] explored the PLR in people with multiple sclerosis (MS) and suggested that SNS and PSNS are disturbed in people with early MS. Chougule et al. [8] concluded that abnormal re-dilation velocity of people with Alzheimer’s Disease was the most consistent result in most studies. Narita et al. [12] found that the patients with neuronopathic Gaucher disease exhibited abnormal PLR under the red-light stimulus. Moreover, some studies explored the abnormalities of PLR in people with diabetic autonomic neuropathy by calculating the indices relating to the amplitude, duration, and velocity of pupillary constriction and dilation [13,14,15,16,17,18,19,20,21,22,23,24,25]; resting pupil diameter of people with diabetes mellitus (DM) was significantly smaller than that of healthy people [13,14,15,16,17,18,19,20,21,22,23,24]; minimum pupil diameter (MPD) of people with DM was smaller than that of healthy people [16,17,18,19,21,24]; and reflex amplitude significantly decreased in people with DM [13,16,17,18,19,20,25]. In a previous study [24], we used a self-designed pupilometer to collect the PLR of people with and without early DM under the condition of short-pulse light stimulus; a total of 16 indices, relating to the amplitude, duration, and velocity of pupillary constriction and dilation, were used to explore the PLR abnormalities in DM; and the duration that pupil restores from its minimum size to half of its resting size (DRP), maximum pupil restoration velocity (MRV), and average restoration velocity (ARV) were significantly decreased in people with DM. The amplitude, duration, and velocity of pupillary constriction and dilation in PLR may be used to explore the severity of diabetic autonomic neuropathy but may not directly offer the relation between ANS and PLR abnormalities. However, this relation may be explored through a physiologically-based PLR model.
The earlier works of the pupillary model were based on first-order linear or seconds order nonlinear transfer function [26,27,28,29,30,31]. Privitera et al. [31] created a binocular pupil model composed of two retinal afferent pathways, (1) the mesencephalic ocular motor complex, and (2) the two oculomotor 2I nerve efferent pathways. This model completely described the neural pathway and considered the direct current and alternating current effect of the input light. However, the model is challenging to present in closed-form equations and may be too complex to use for exploring the abnormalities of ANS. Pamplona et al. [32] proposed a pupillary model that integrated the model of Moon et al. [33] and Longtin et al. [34,35]. This model was a black-box model, which mainly described PLR based on experimental data and had inconsistent fitting results with short-flash light experimental data. Usui et al. [36] proposed an inverse dynamic PLR model based on the property of the pupillary muscle represented as an elastic element, a viscous element, and an active contractile element. The model can be used to estimate the input of ANS; however, this model is too complicated in 19 equations. Fan et al. proposed a PLR model that consisted of passive muscle elastic force, viscous resistance, and the active forces generated from the ANS modulation [37]. This model is a gray box model, which can observe the works of ANS. However, the fitting error of this model might increase as the stimulus duration increase.
In this study, we proposed a PLR inherent model modified by Fan’s model [37]. To enhance the model fitting accuracy, the first-order term with the elastic constant of muscle elastic force was added in the current model. The elastic force, the viscous force, and the ANS forces were assumed to be zero when the pupil was in a dark-adapted resting state, and the SNS force was assumed to join the pupillary constriction before the maximum pupil constriction and still active in pupillary dilation while the force of PSNS stopped. This model, which used the second-order differential equation, describes the pupillary constriction and dilation innervated by SNS and PSNS. Thus, the model can extract the relative input amplitude and timing of SNS and PSNS from the measured PLR response. The PLR difference would be examined between people without and with DM. The model parameters were extracted and compared from PLR data of 42 healthy participants and 42 ones with DM.

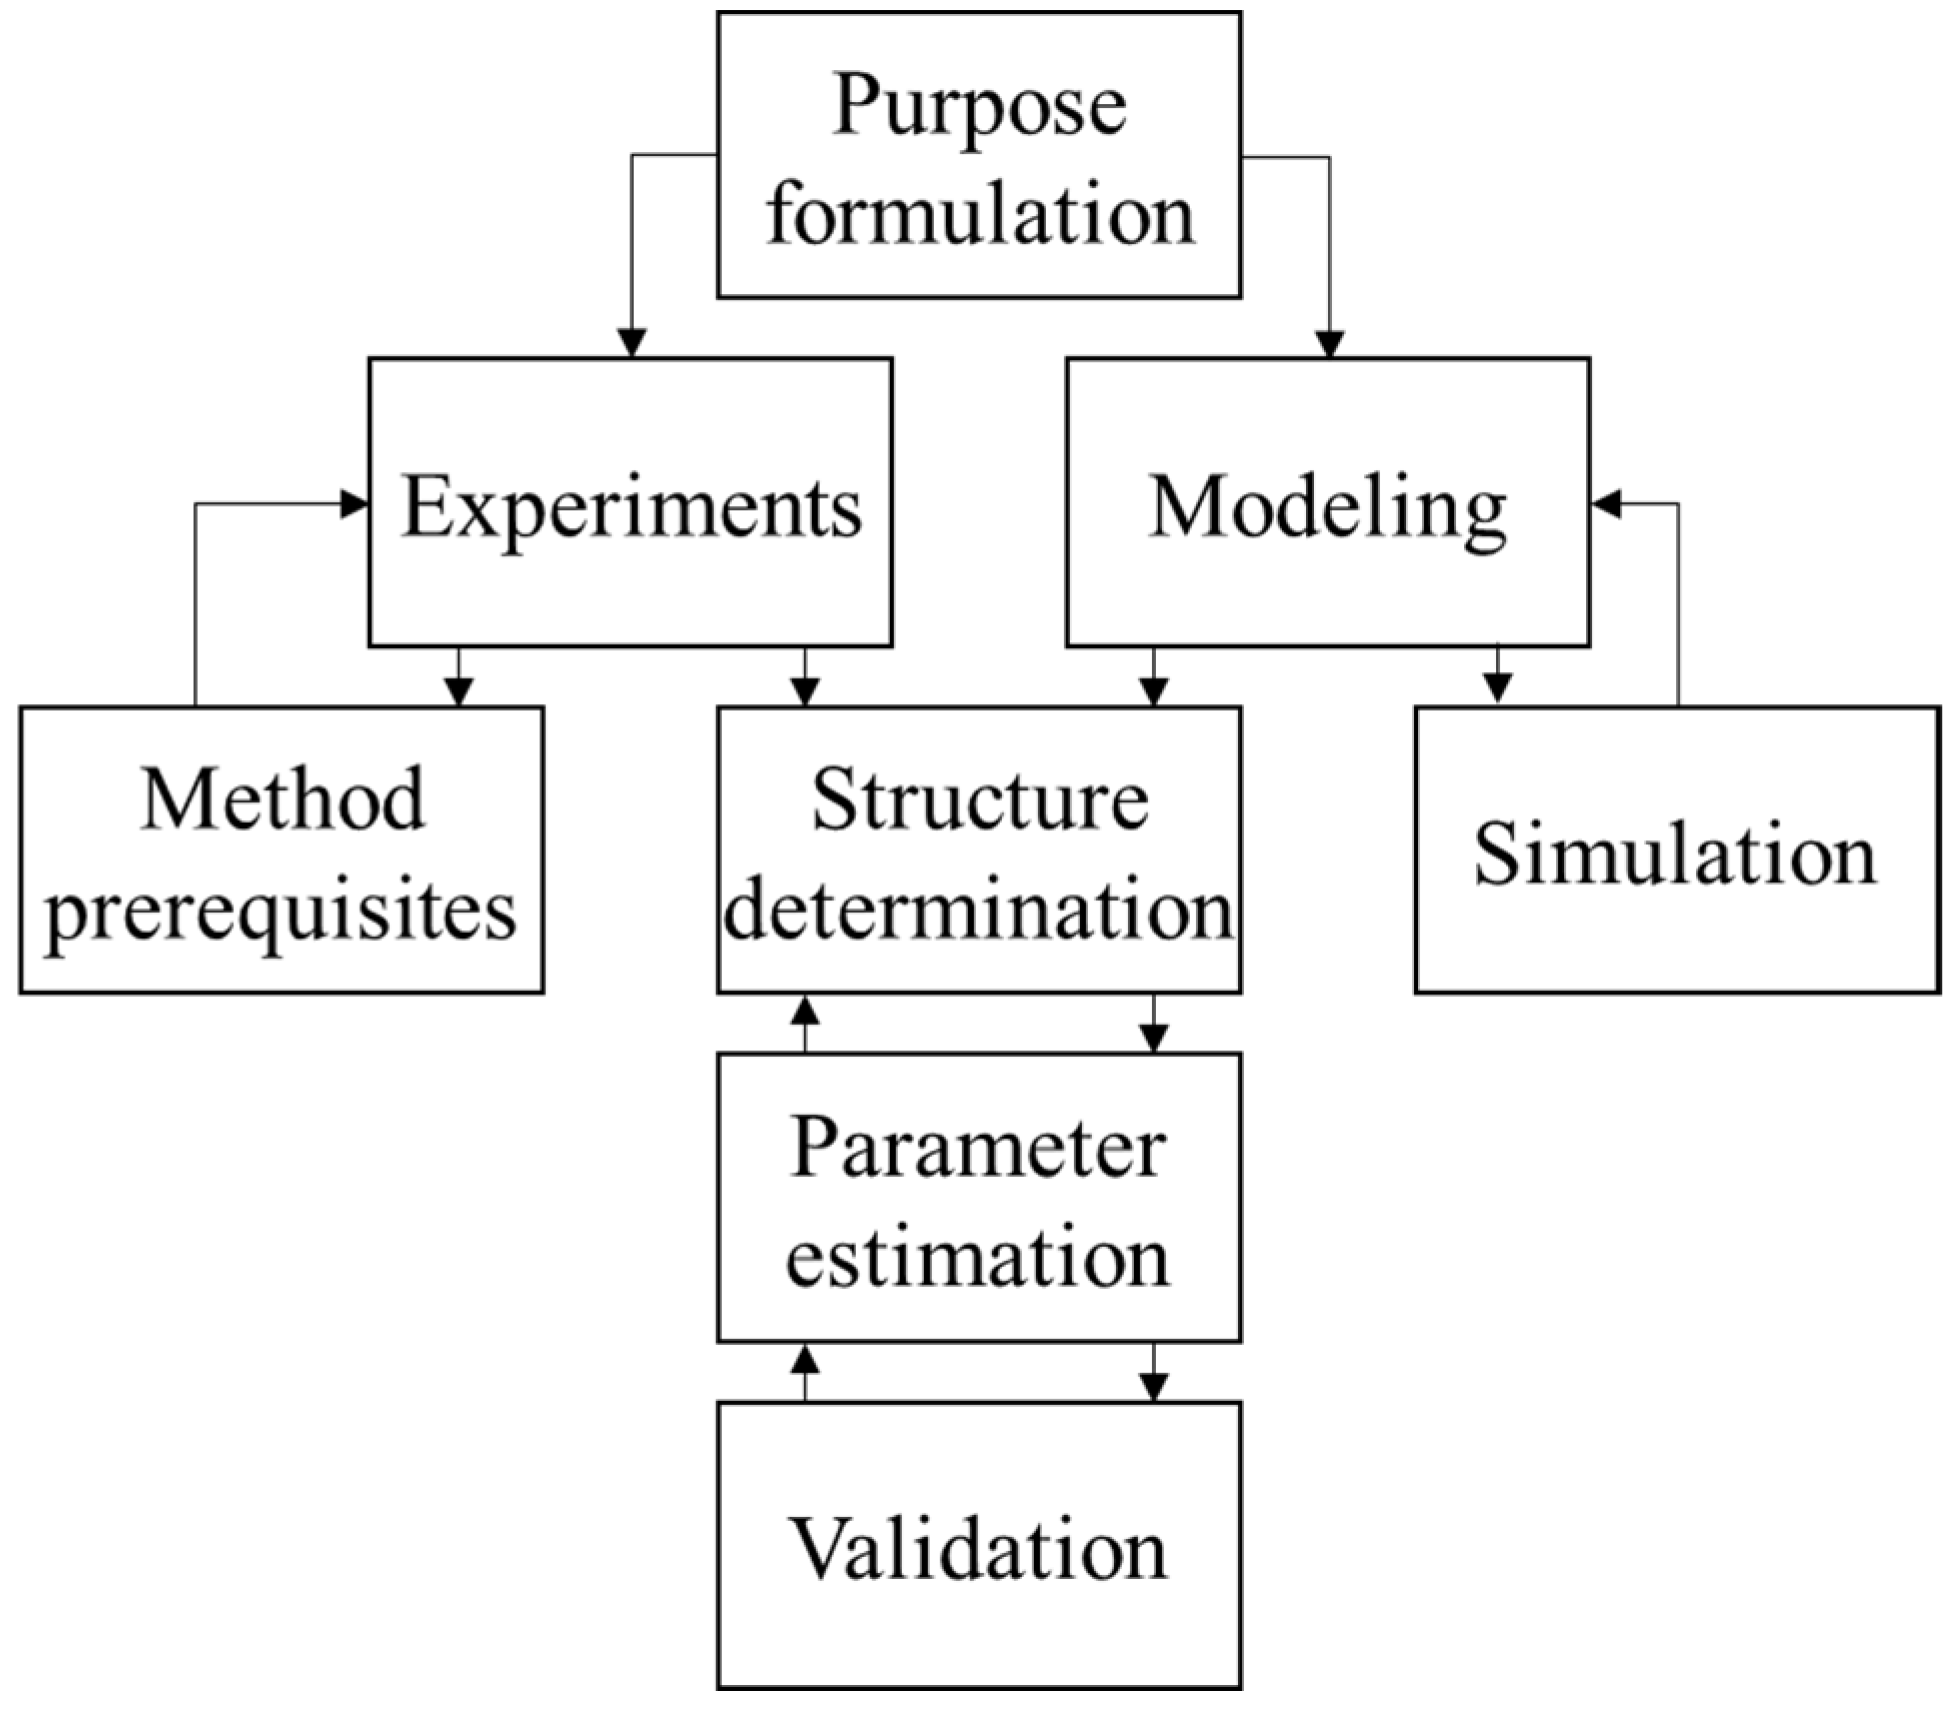
2. System Identification of Pupillary Light Reflex

System identification has been an active research field for more than fifty years. It is a method of exploring an unknown system. Furthermore, the model constructed from the system identification is used to predict the behavior of the system. System identification can be divided into three main parts: experiment, modeling, and structure determination. Figure 1 depicts the architecture of the system identification theory. The model can be divided into white-box models, black-box models, and gray-box models. White box models are derived by first principles such as physical, chemical, and biological laws. Black-box models are fully based on measurement data. Gray box models combine both white-box models and black-box models. Some parameters in this model are uncertain and can be estimated by system identification [38].

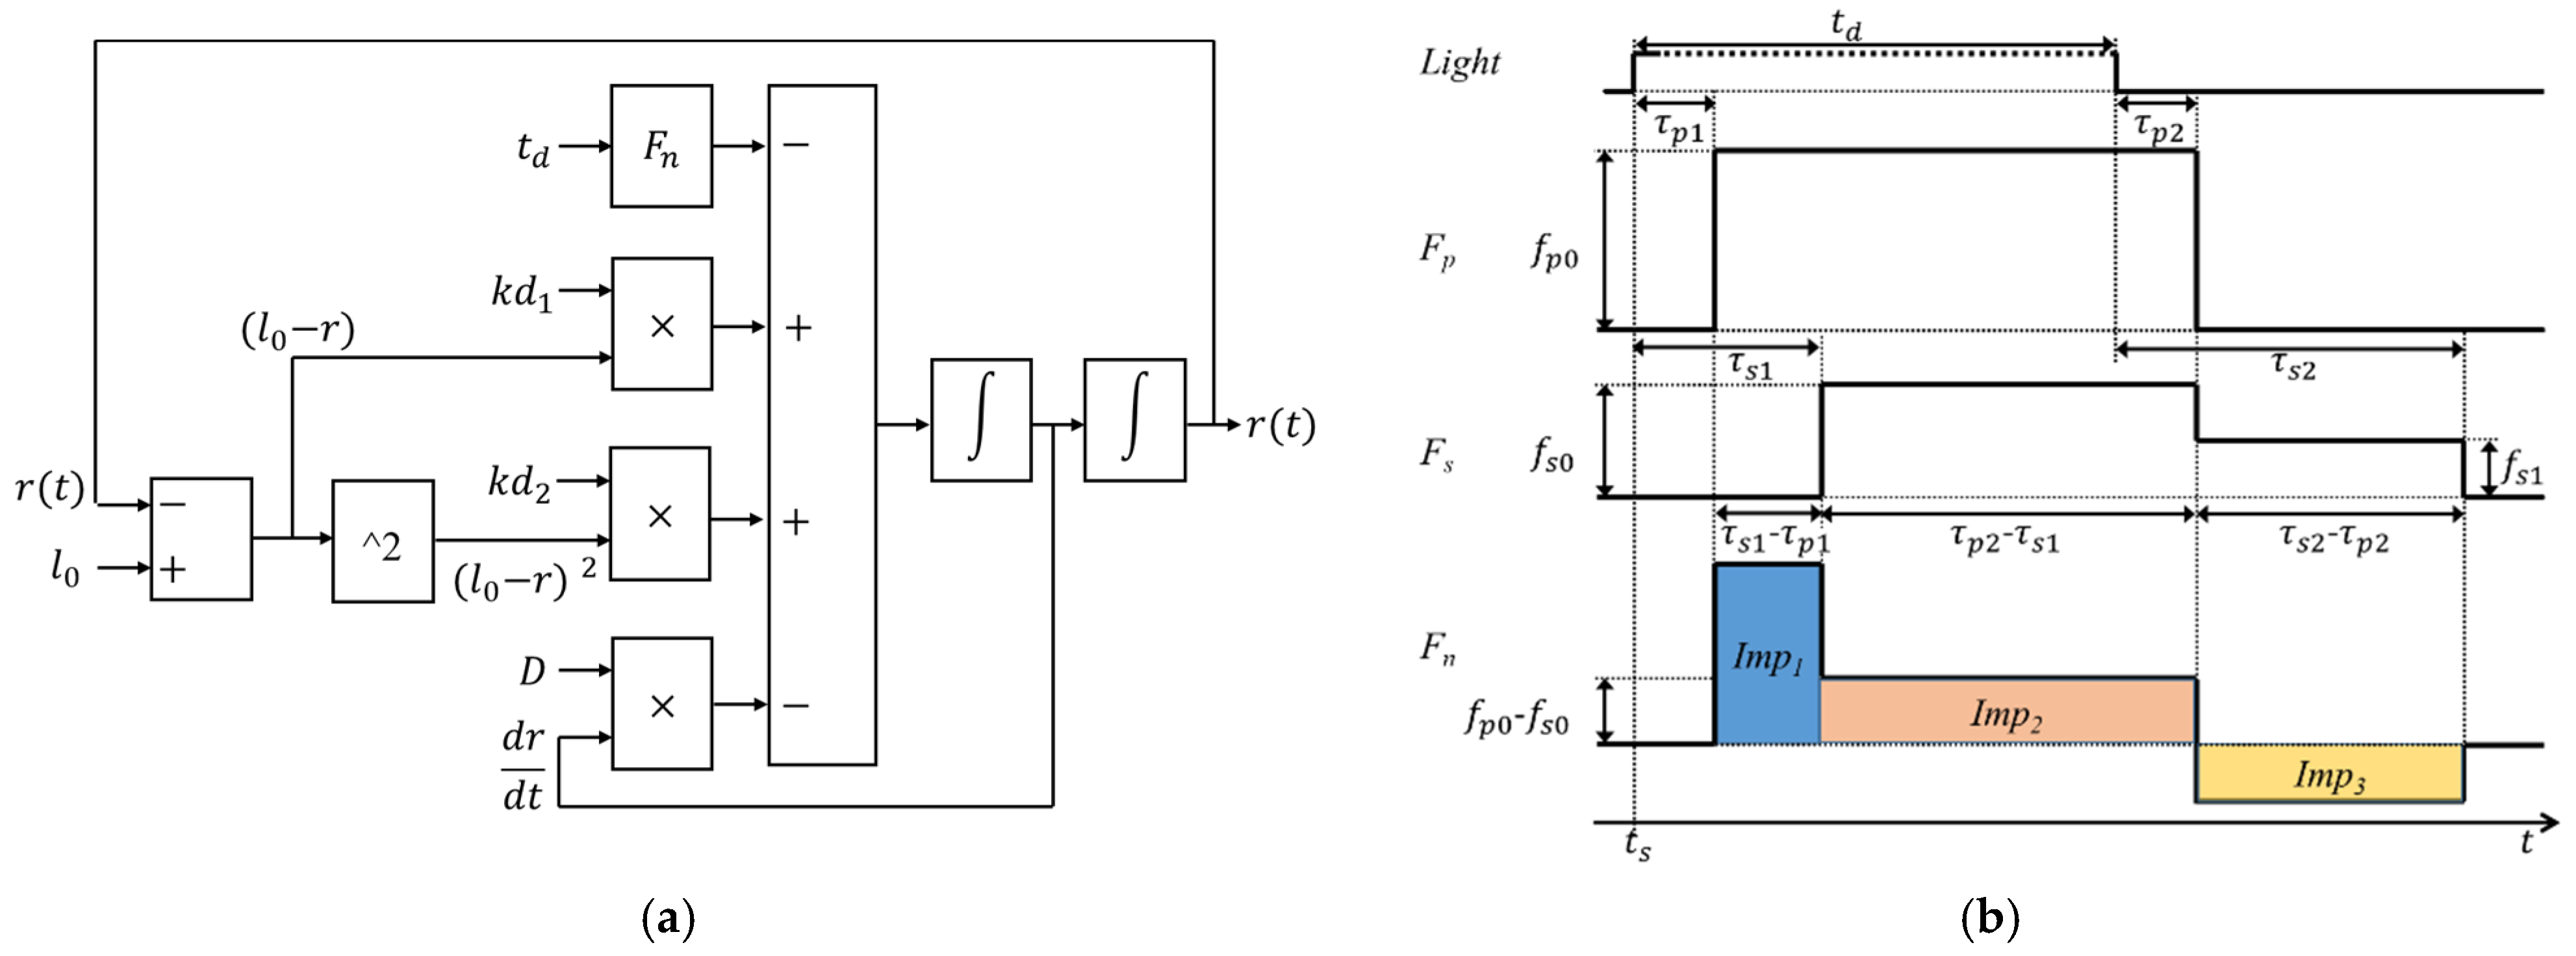
2.1. Pupillary Light Reflex Inherent Model Construction

In this study, a physiologically-based PLR inherent model was proposed to identify the viscoelastic properties of the iris muscle and ANS input induced by the pulse of light stimuli. Thus, the force that controls the movement of the iris is combined with passive muscle elastic force, viscous resistance, and the effective force originated from ANS [37]. The force equation is written as:
d 2 r d t 2 = k d 2 ( l 0 r ) 2 + k d 1 ( l 0 r ) D d r d t F n ( t ) .
Equation (1) has been divided by the iris muscle mass. r represents the pupil radius. The passive muscle elastic force was defined as a second-order equation that was based on experimental observation [35]. l o is the steady-state pupil diameter in dark adaption. k d 2 is second-order elastic constants. To enhance the model fitting accuracy, the first-order term with elastic constant k d 1 of muscle elastic force equation was added in current model. D is viscous constant.
F n ( t ) is the effective muscle force, which is combined with the force Fp(t) from PSNS and force Fs(t) from SNS and expressed as:
F n ( t ) = F p ( t ) F s ( t ) ,
where the muscle force Fp(t) and Fs(t) were assumed to be square-wave pulses because the muscle activation is triggered by the impulse signals from efferent nerves. Fp(t) and Fs(t) are written as (3) and (4), respectively.
F p ( t ) = f p 0 [ u ( t τ p 1 ) u ( t t d τ p 2 ) ] .
F s ( t ) = f s 0 [ u ( t τ s 1 ) u ( t t d τ p 2 ) ] + f s 1 [ u ( t t d τ p 2 ) u ( t t d τ s 2 ) ]
t d is the duration of the light stimulus. f p 0 is force intensity originated from PSNS. τ p 1 is the delay between the start of the light stimulus and the activation of the force F p , and τ p 2 is the delay between the end of the lights stimulus and the end of the force F p . Fn(t) was assumed to be 0 when the pupil is in a steady-state. Two square-waves ( f s 0 and f s 1 ) were used to describe the force F s , because this study assumed that the F s still act in lower force intensity f s 1 , compared to f s 0 , after the end of the force F p . τ s 1 is the delay between the start of the light stimulus and the activation of the force F s , and τ s 2 is the delay between the end of the light stimulus and the end of the force F s . Figure 2 depicts the control block diagram of the PLR inherent model and how the force Fn works before and after a light stimulus. Moreover, Imp1, Imp2, and Imp3 were signs that PSNS dominated the movement of iris; PSNS and SNS antagonized each other during the movement of the iris, and SNS dominated the movement of the iris, respectively. These parameters were mainly used to compare the difference between people with and without DM.

2.2. Pupillary Light Reflex Response Experiment

The PLR response was collected by the customized pupilometer [24]. The pupilometer stimulated the right eye of healthy participants and captured the images of both eyes for 5 s before the stimulation and 10 s afterward. The participants took a dark-adaption in a dark room for 2 min and had seven tests in a dark room afterward. The stimulus duration of seven tests was 1ms, 10 ms, 100 ms, 500 ms, 1 s, 2 s, and 3 s, and the stimulus lights of seven tests were all 0.12 cd white light. The participants rested for 15 min between the tests.
The PLR response was captured in sequential still images. The pupil radius was extracted from each image using MATLAB (The MathWorks, Portola Valley, CA, USA). The complete procedure of extracting pupil radius was illustrated in a previous study [24]. Briefly, the procedure was divided into several steps as follows: increasing contract of image, binarization, edge detection, bad data exclusion, and data interpolation.

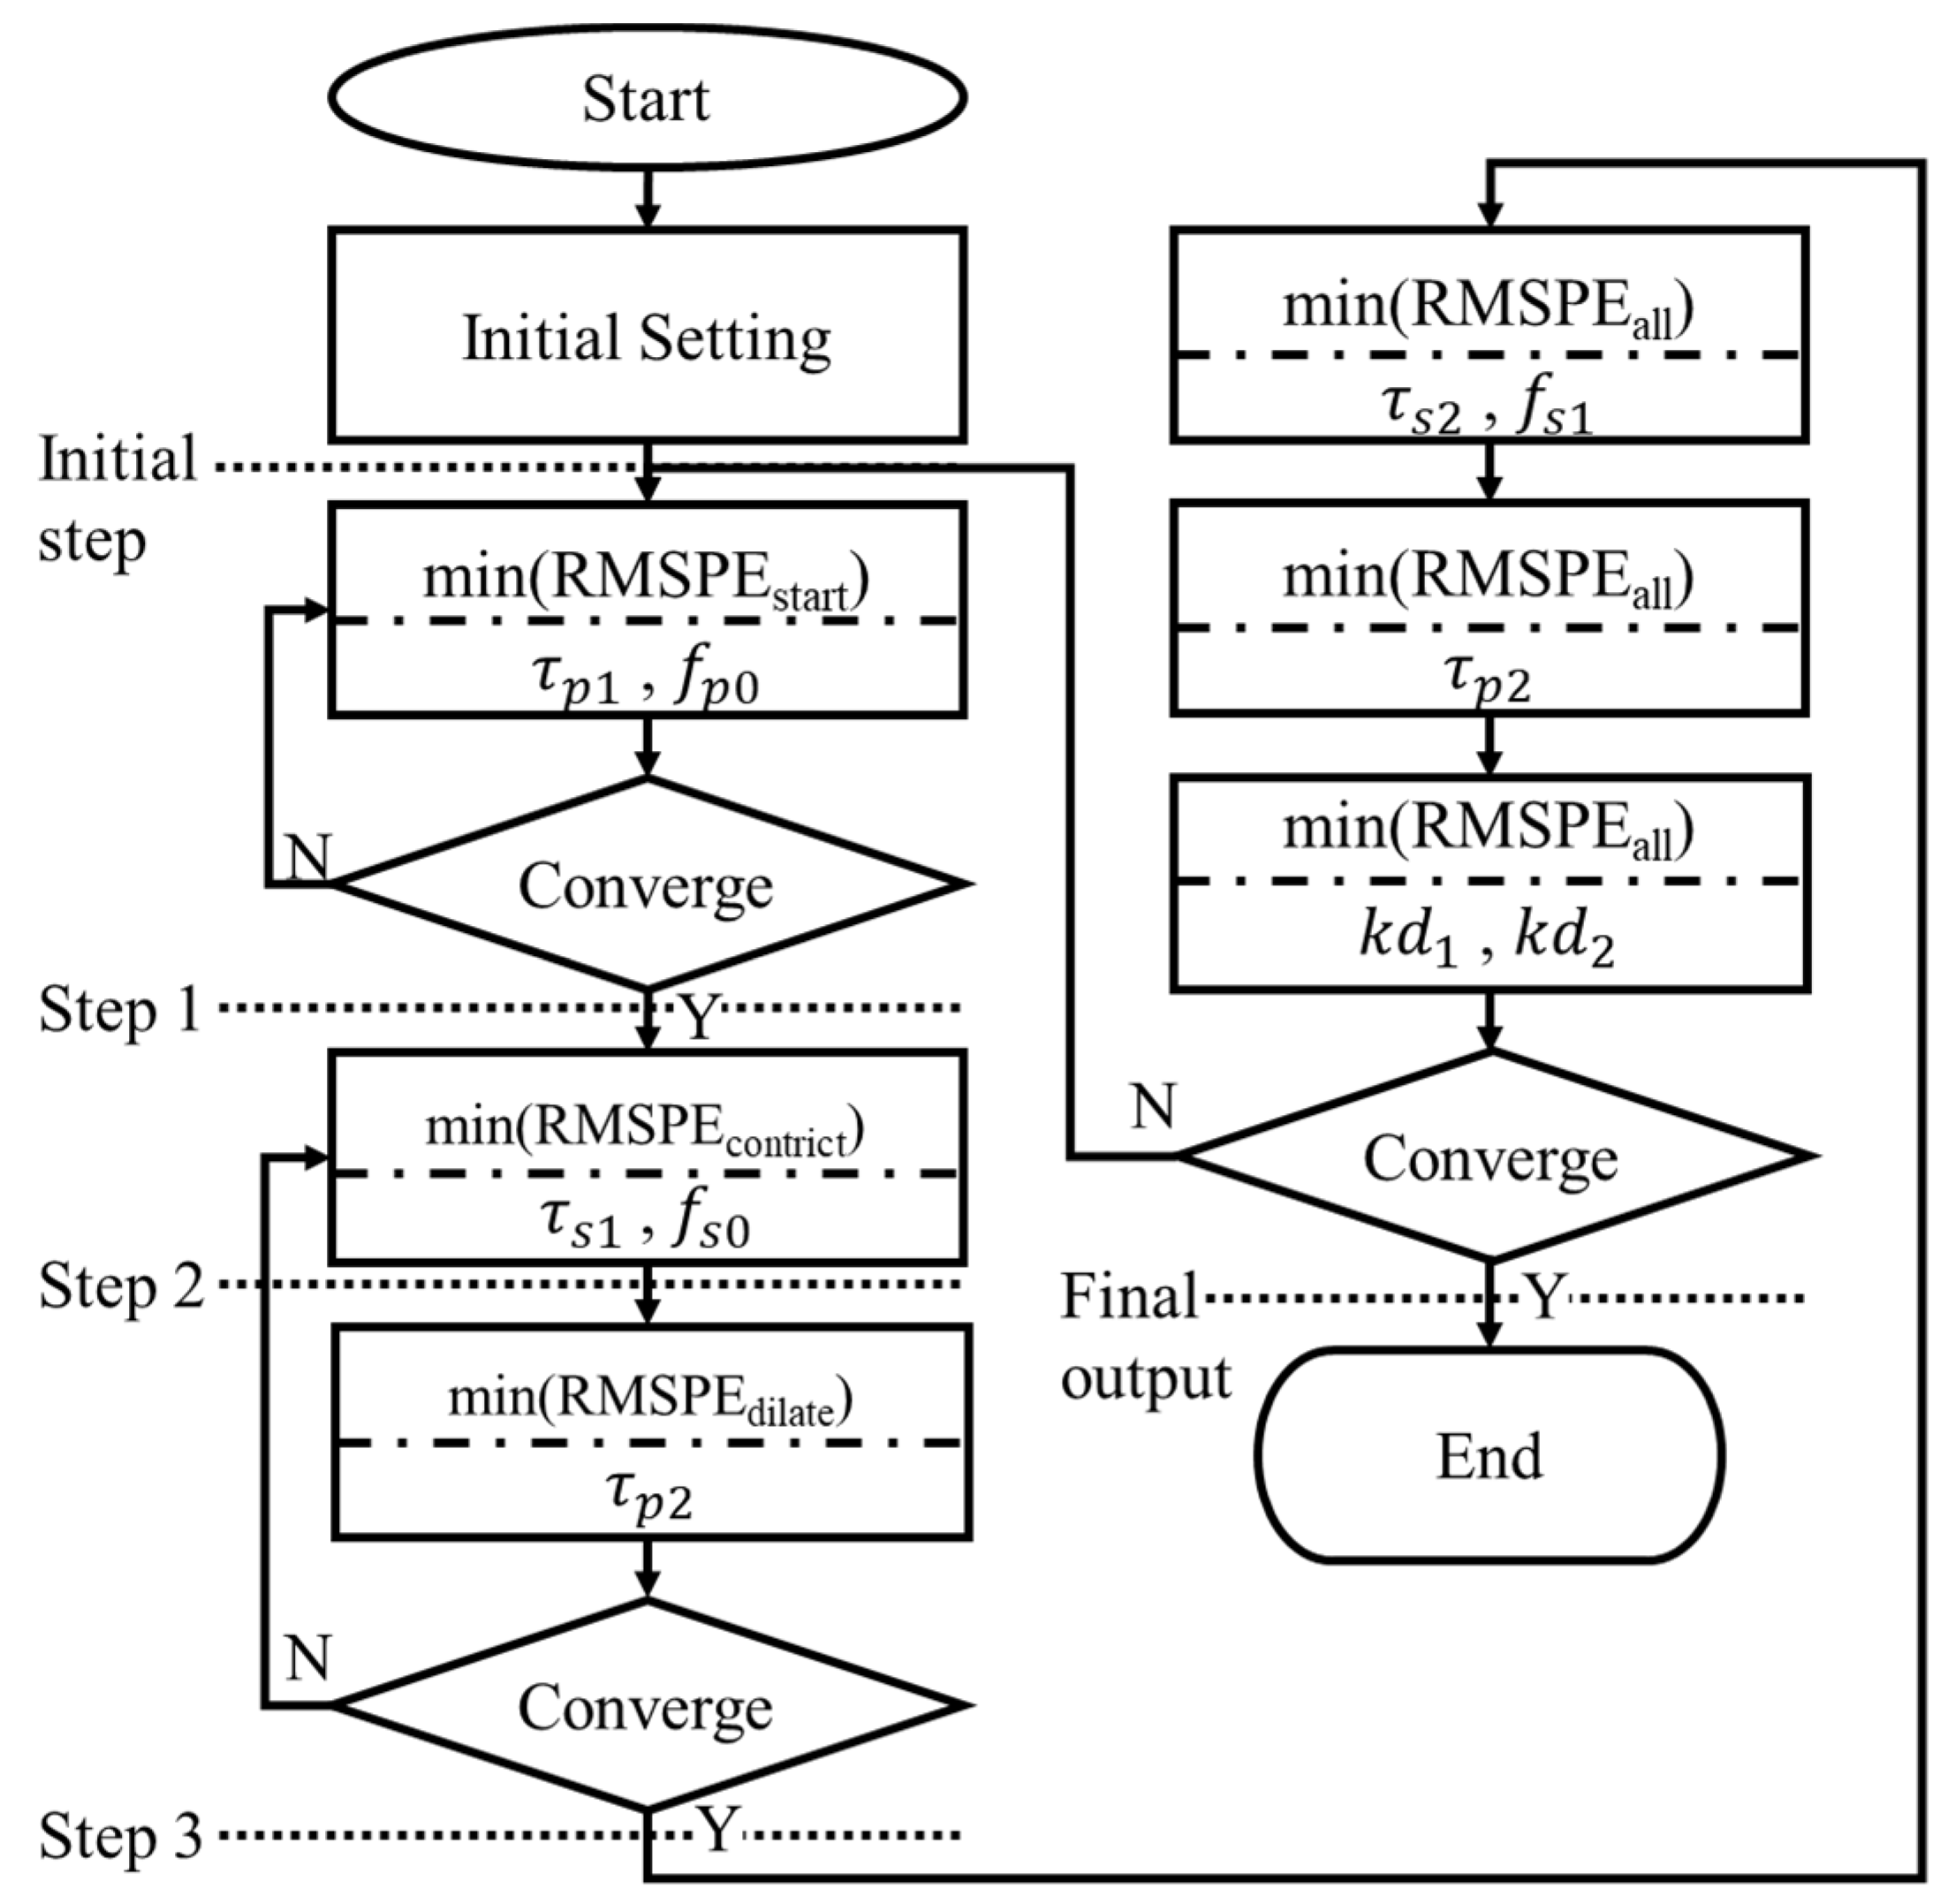
2.3. Structure Determination and Parameter Estimation of PLR Inherent Model

The root-mean-square percentage error (RMSPE) was adopted to evaluate the goodness of simulation results of the PLR inherent model (1) and defined as:
RMSPE = 1 N 1 i N ( X i Y i X i ) 2 ,
where X is the measured PLR response data and Y is the model simulated PLR response.
The simulation first decided the initial value and boundary condition of the parameters in the PLR inherent model for parameter searching. The initial value of the parameters was determined by applying a random search method. This method randomly generates sets of the parameters and finds a set of parameters that make the simulated PLR response have the lowest RMSPE at the stimulus duration of 500 ms. The reason for using the PLR response at this stimulus duration is that the parameters in the PLR of longer stimulus duration have lower variability. The boundary of the parameters was set to be approximately ±20% of its initial value. The RMSPEs between the model output and the measured PLR response in stimulus durations from 1 ms to 3 s were found to be approximately stable when the viscous constant D was approximately 4.3 g/s (Figure 3); therefore, the D was the constant of 4.3 g/s in all simulations and predictions. The initial value and the boundary value of the parameters are listed in Table 1.
The model simulation was based on a univariate search method that searches one parameter at a time. All parameters were searched within the interval specified in Table 1. The search of one parameter was stopped by finding the minimum RMSPE between model output and measured PLR response at a specified time interval. The convergence criterion in the simulation process was whether the searching values of the first parameter are equal before and after the second parameter is searched. The order of searching parameter, which was related to the activating and deactivating order of SNS and PSNS, is illustrated in Figure 4. The parameters related to PSNS were searched firstly; those related to SNS were searched afterward; and the parameters independent of stimulus input were searched lastly.
After a pupil starts to be stimulated by a light source for hundreds of milliseconds, it starts to constrict. It was assumed that this process is dominated by only PSNS and significantly related to τ p 1 and f p 0 ; thus, these two parameters were searched firstly, and the RMSPEstart presenting the RMSPE on the time interval from the start of stimulus ts to ts + 0.4 s was calculated. SNS starts to originate the force Fn with PSNS after PSNS starts to activate by hundreds of milliseconds; τs1 and fs0 were assumed to dominate this process and were searched secondly; the RMSPEconstrict presenting the RMSPE on the time interval from ts to the time tDCM when a pupil constricts to its minimum size was calculated. After the pupil constricts to its minimum diameter, the pupil starts to dilate; τ p 2 , which was assumed to decide the start of dilating, was searched thirdly, and the RMSPEdialate presenting the RMSPE on the time interval from ts to ts + 1.25 * (tDCMts) was calculated. τ f 2 and f s 1 were assumed to dominate the process during the pupil constriction and were searched fourthly; the RMSPEall presenting the RMSPE on the time interval from ts to ts + 3 * (tDCMts) was calculated. After that, τ p 2 was searched again and kd1 and kd2 searched afterward. Figure 5 shows the model output at the initial step, step 1, step 2, step 3, and final step. The model outputs gradually close to the beginning partition of the measured PLR response at step 1, the constricting partition of that at step 2, the dilating partition of that at step 3, and overall at the final step.
The model outputs with the stimulus durations from 1 millisecond to three seconds comparing to experimental PLR data are shown in Figure 6. These output curves were extremely close to those of measured PLR response. The RMSPEs between model outputs and measured PLR response in seven stimulus durations are depicted in Figure 7. Although the RMSPE with long stimulus duration was larger than the short stimulus duration, the RMSPEs were all under 0.7%. Consequently, the PLR inherent model can adequately express dark-adapted PLR under the stimulus durations from 1 ms to 3 s.

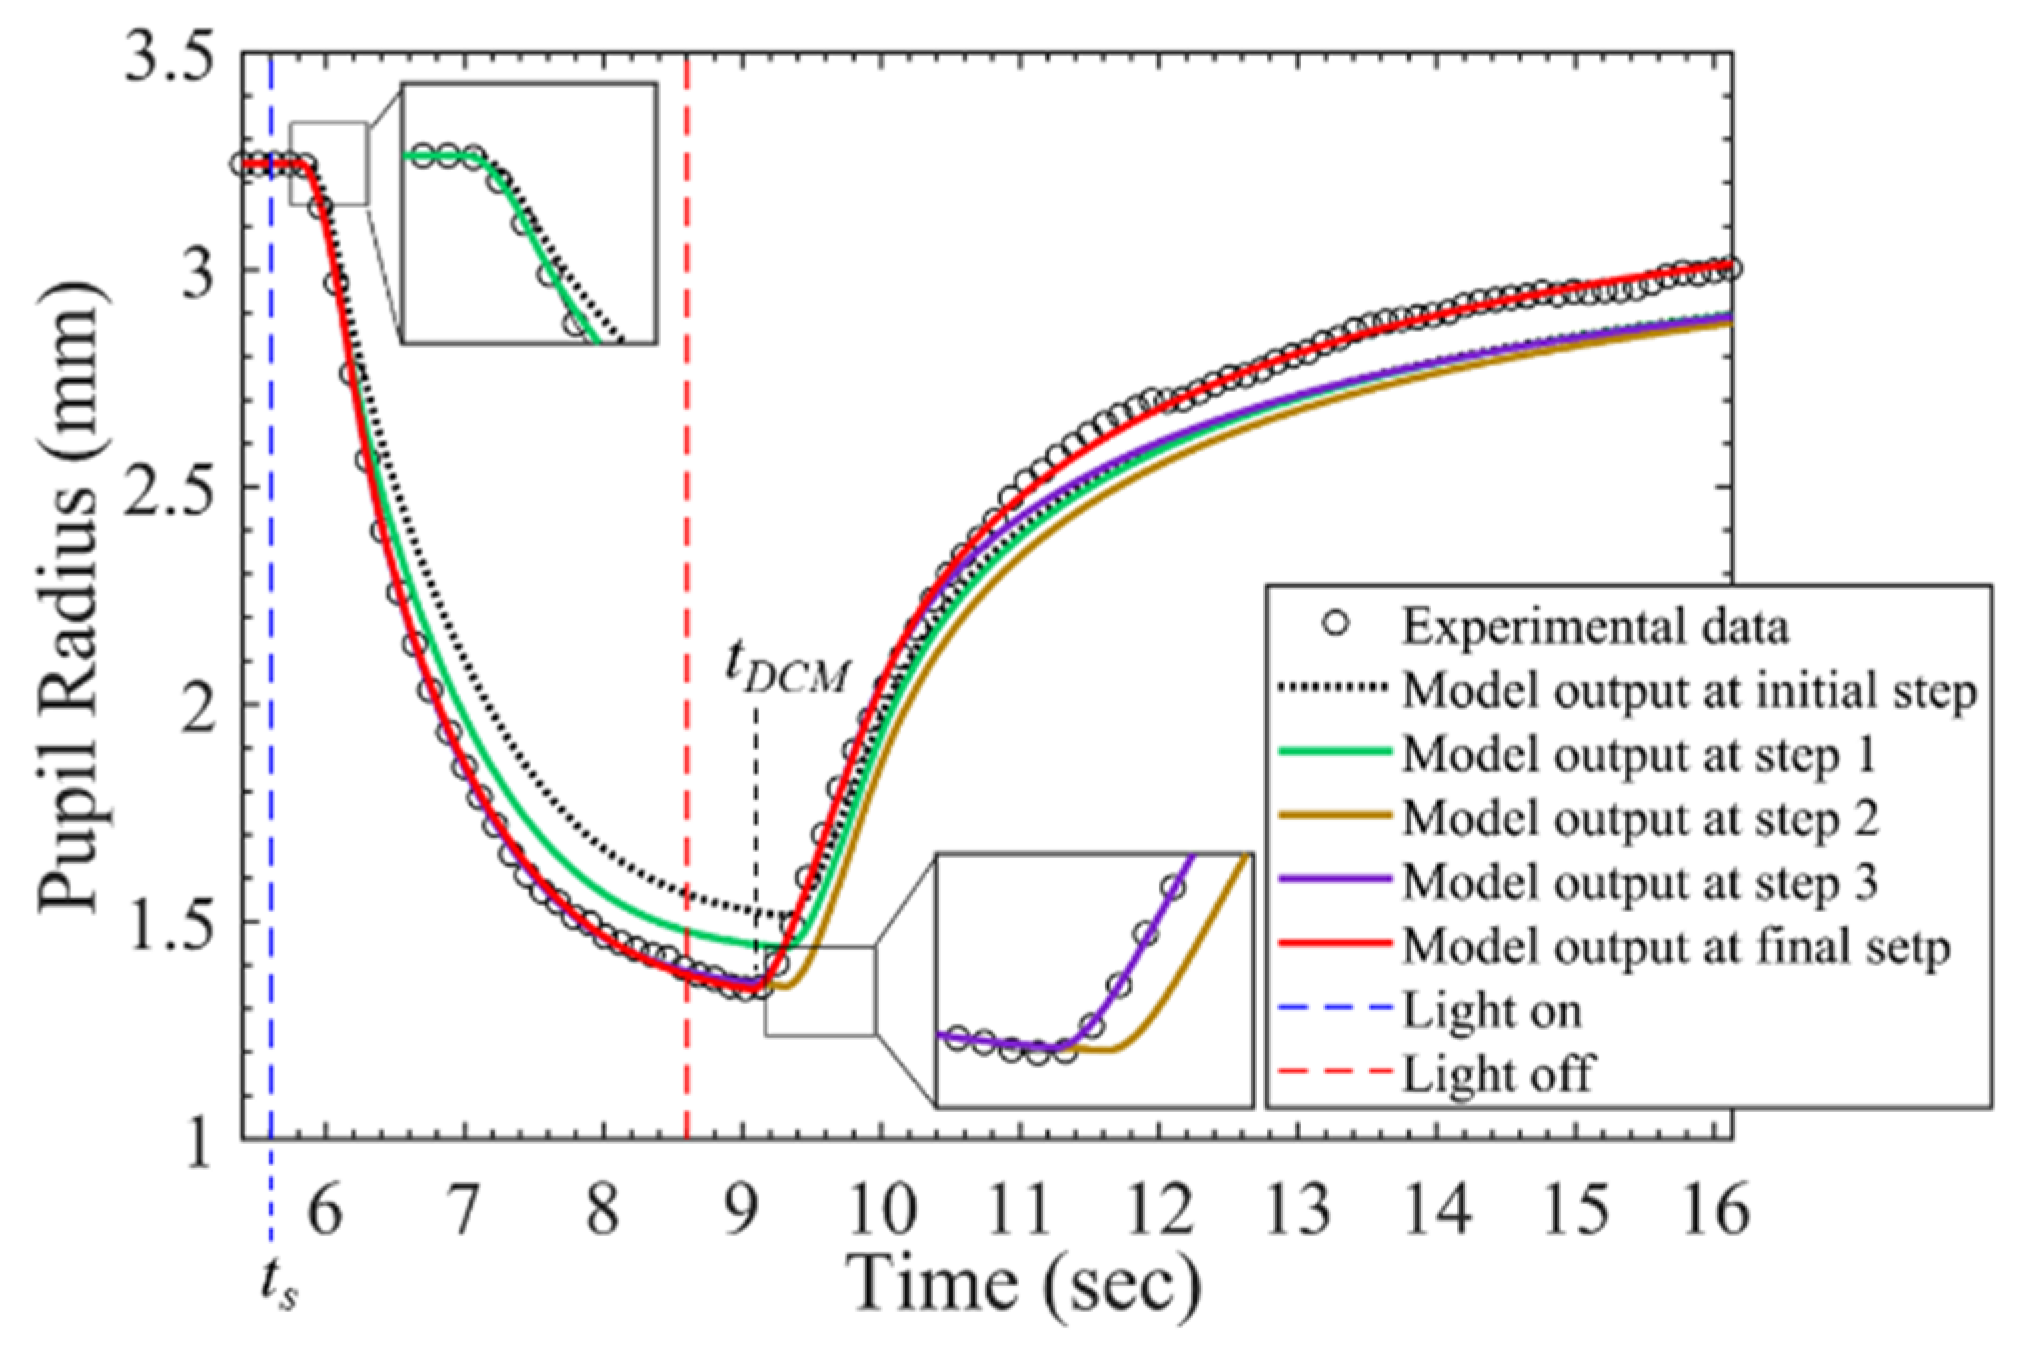
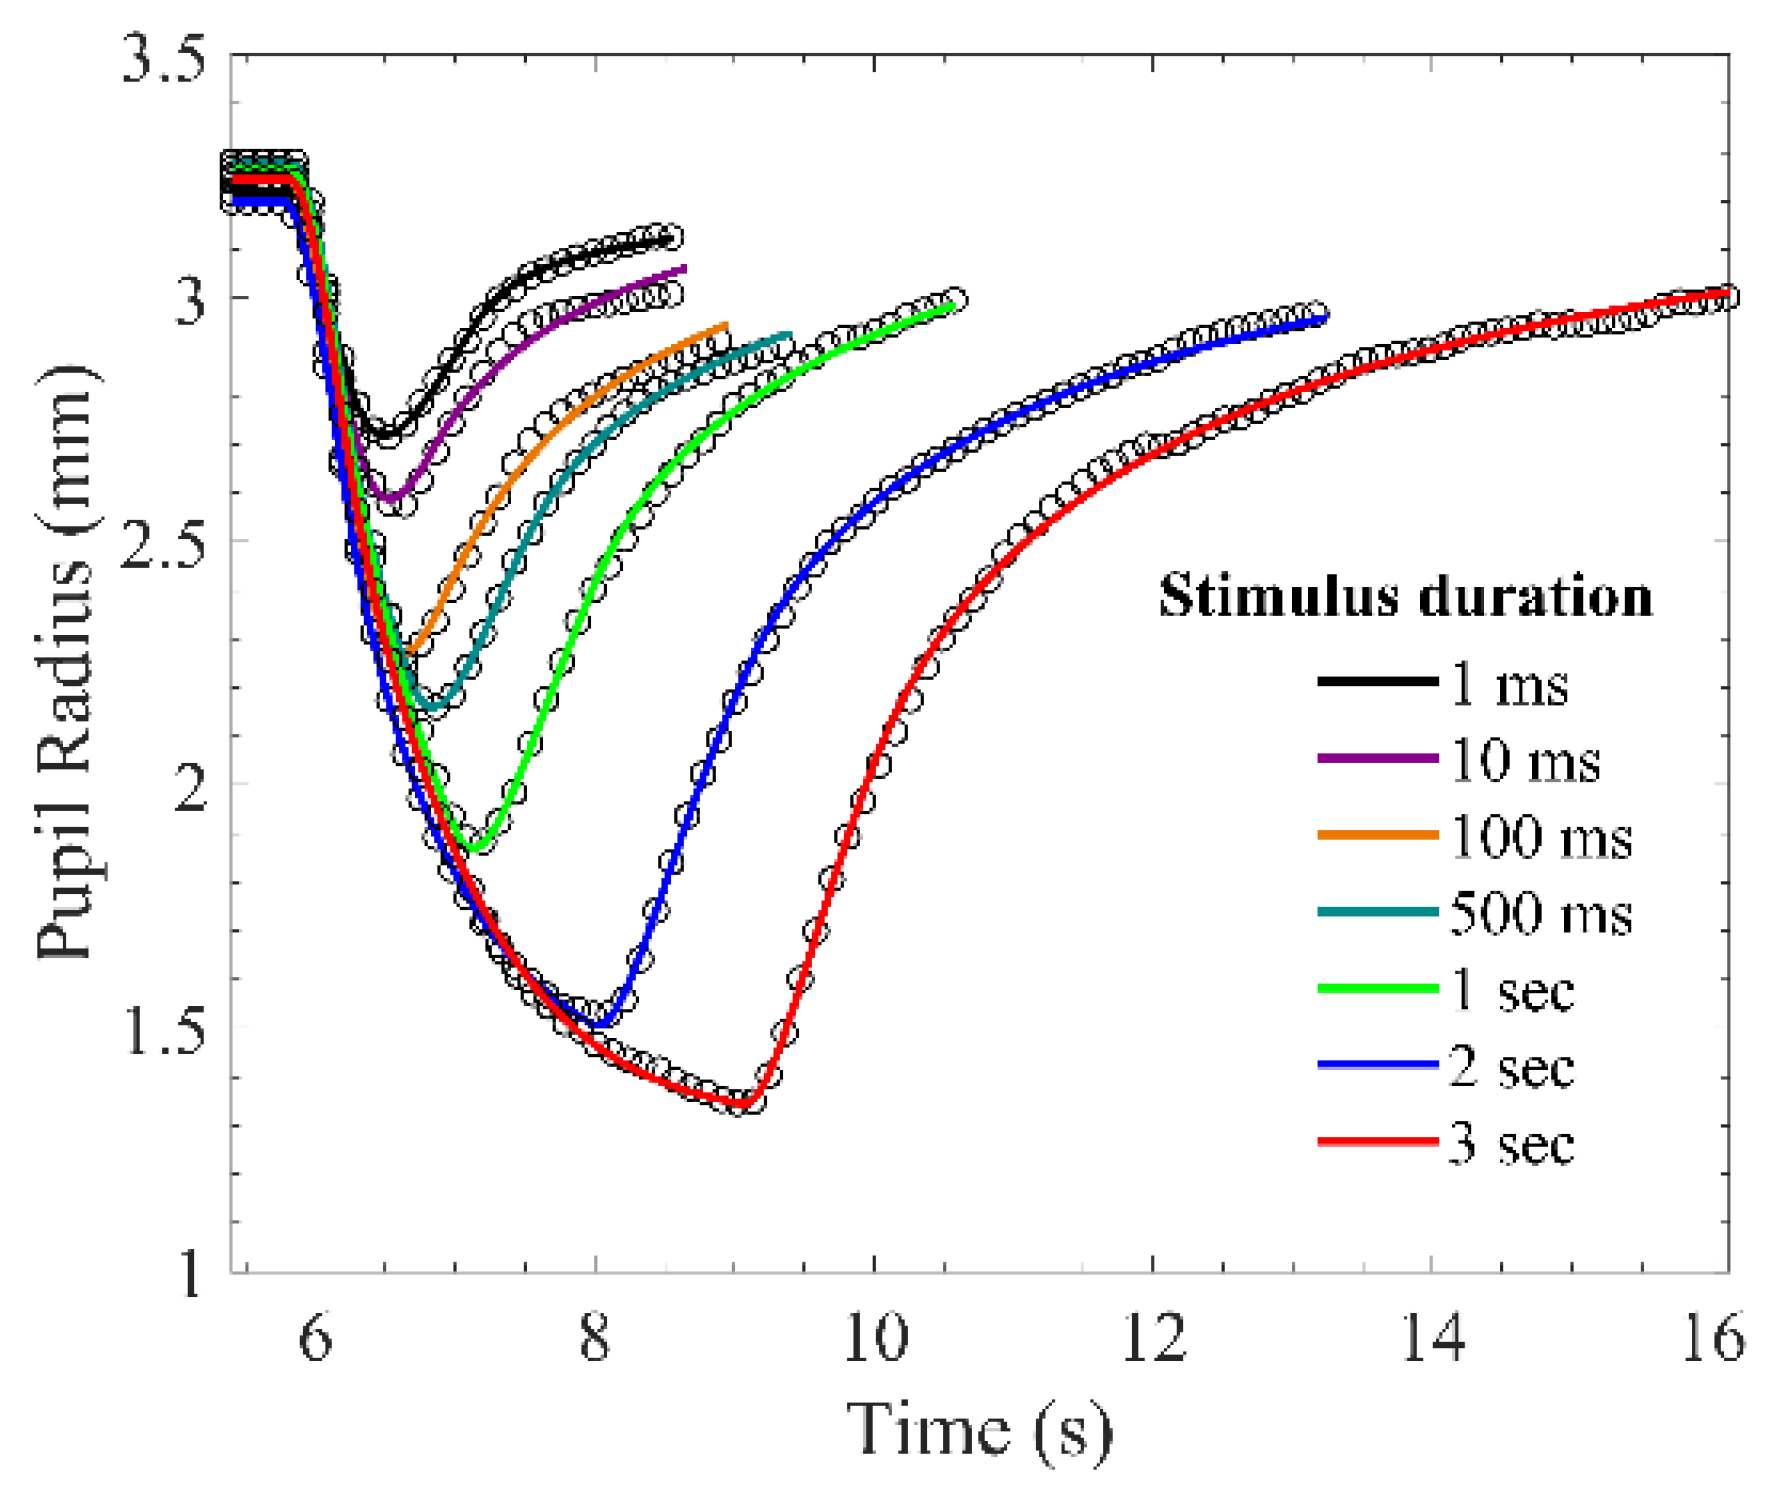
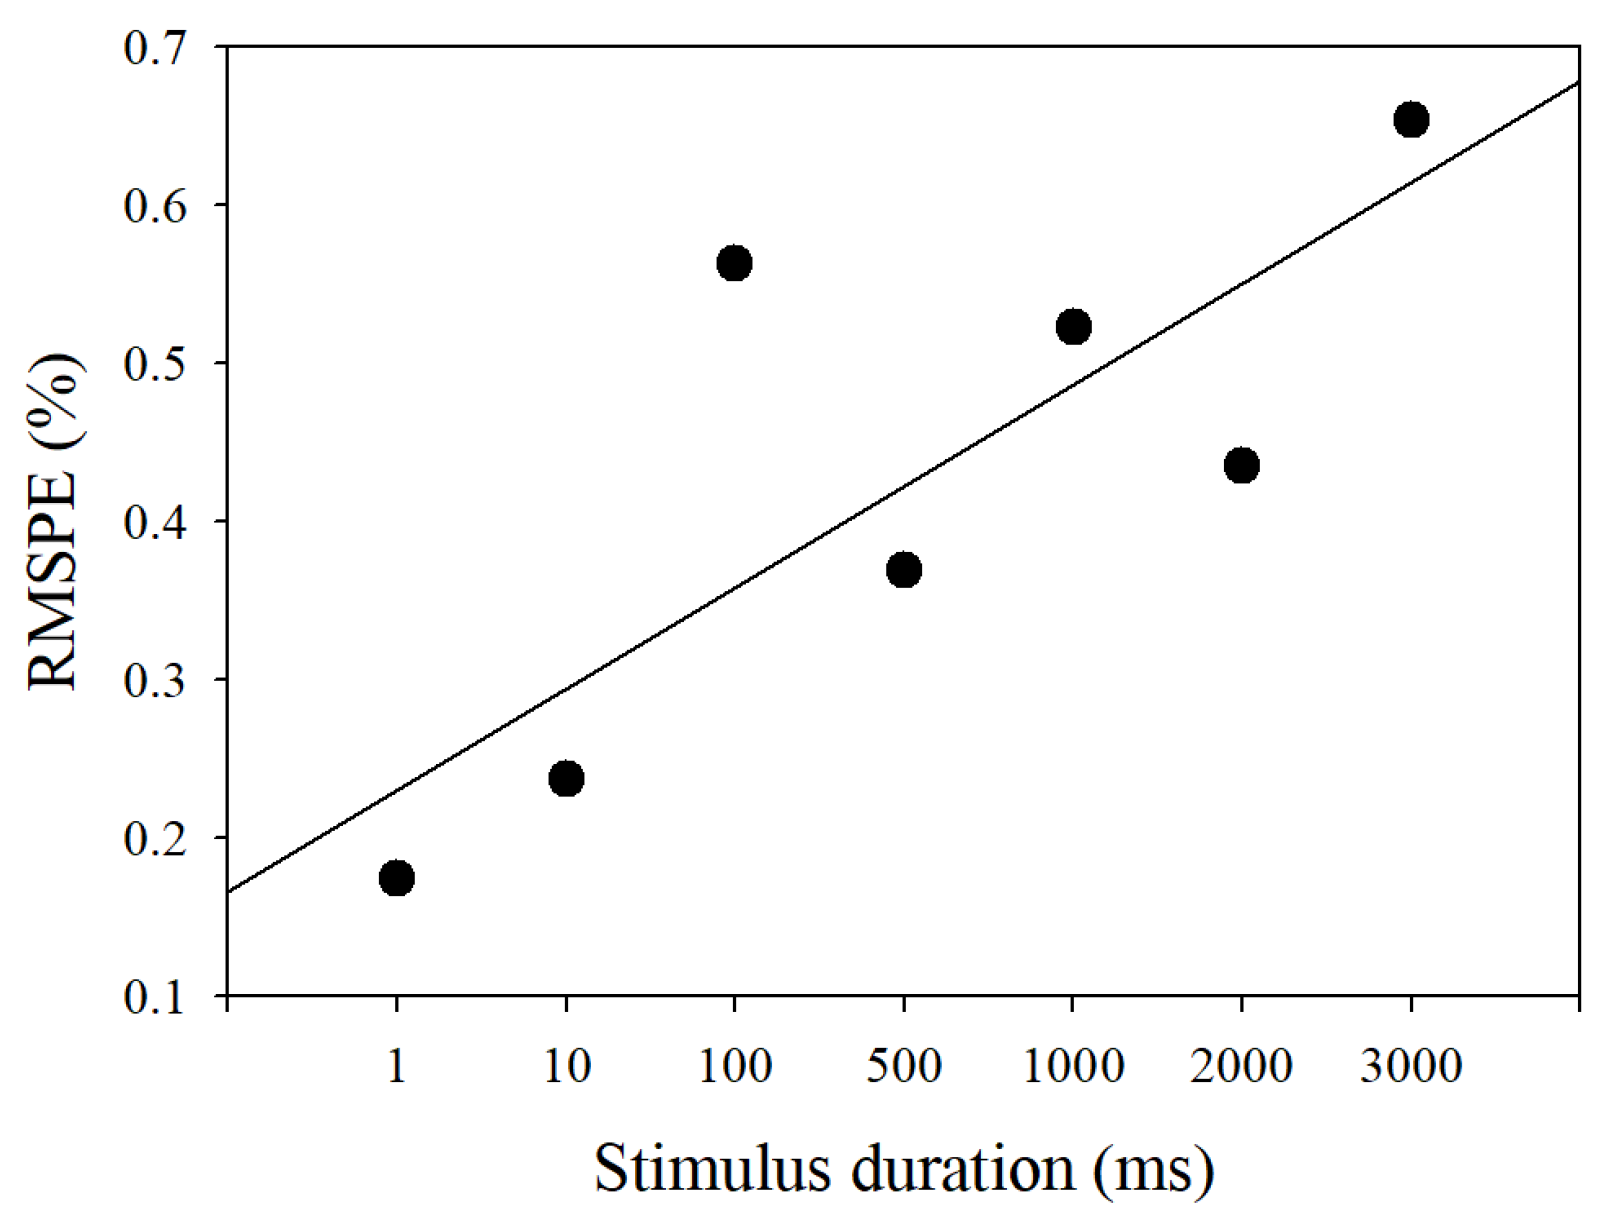
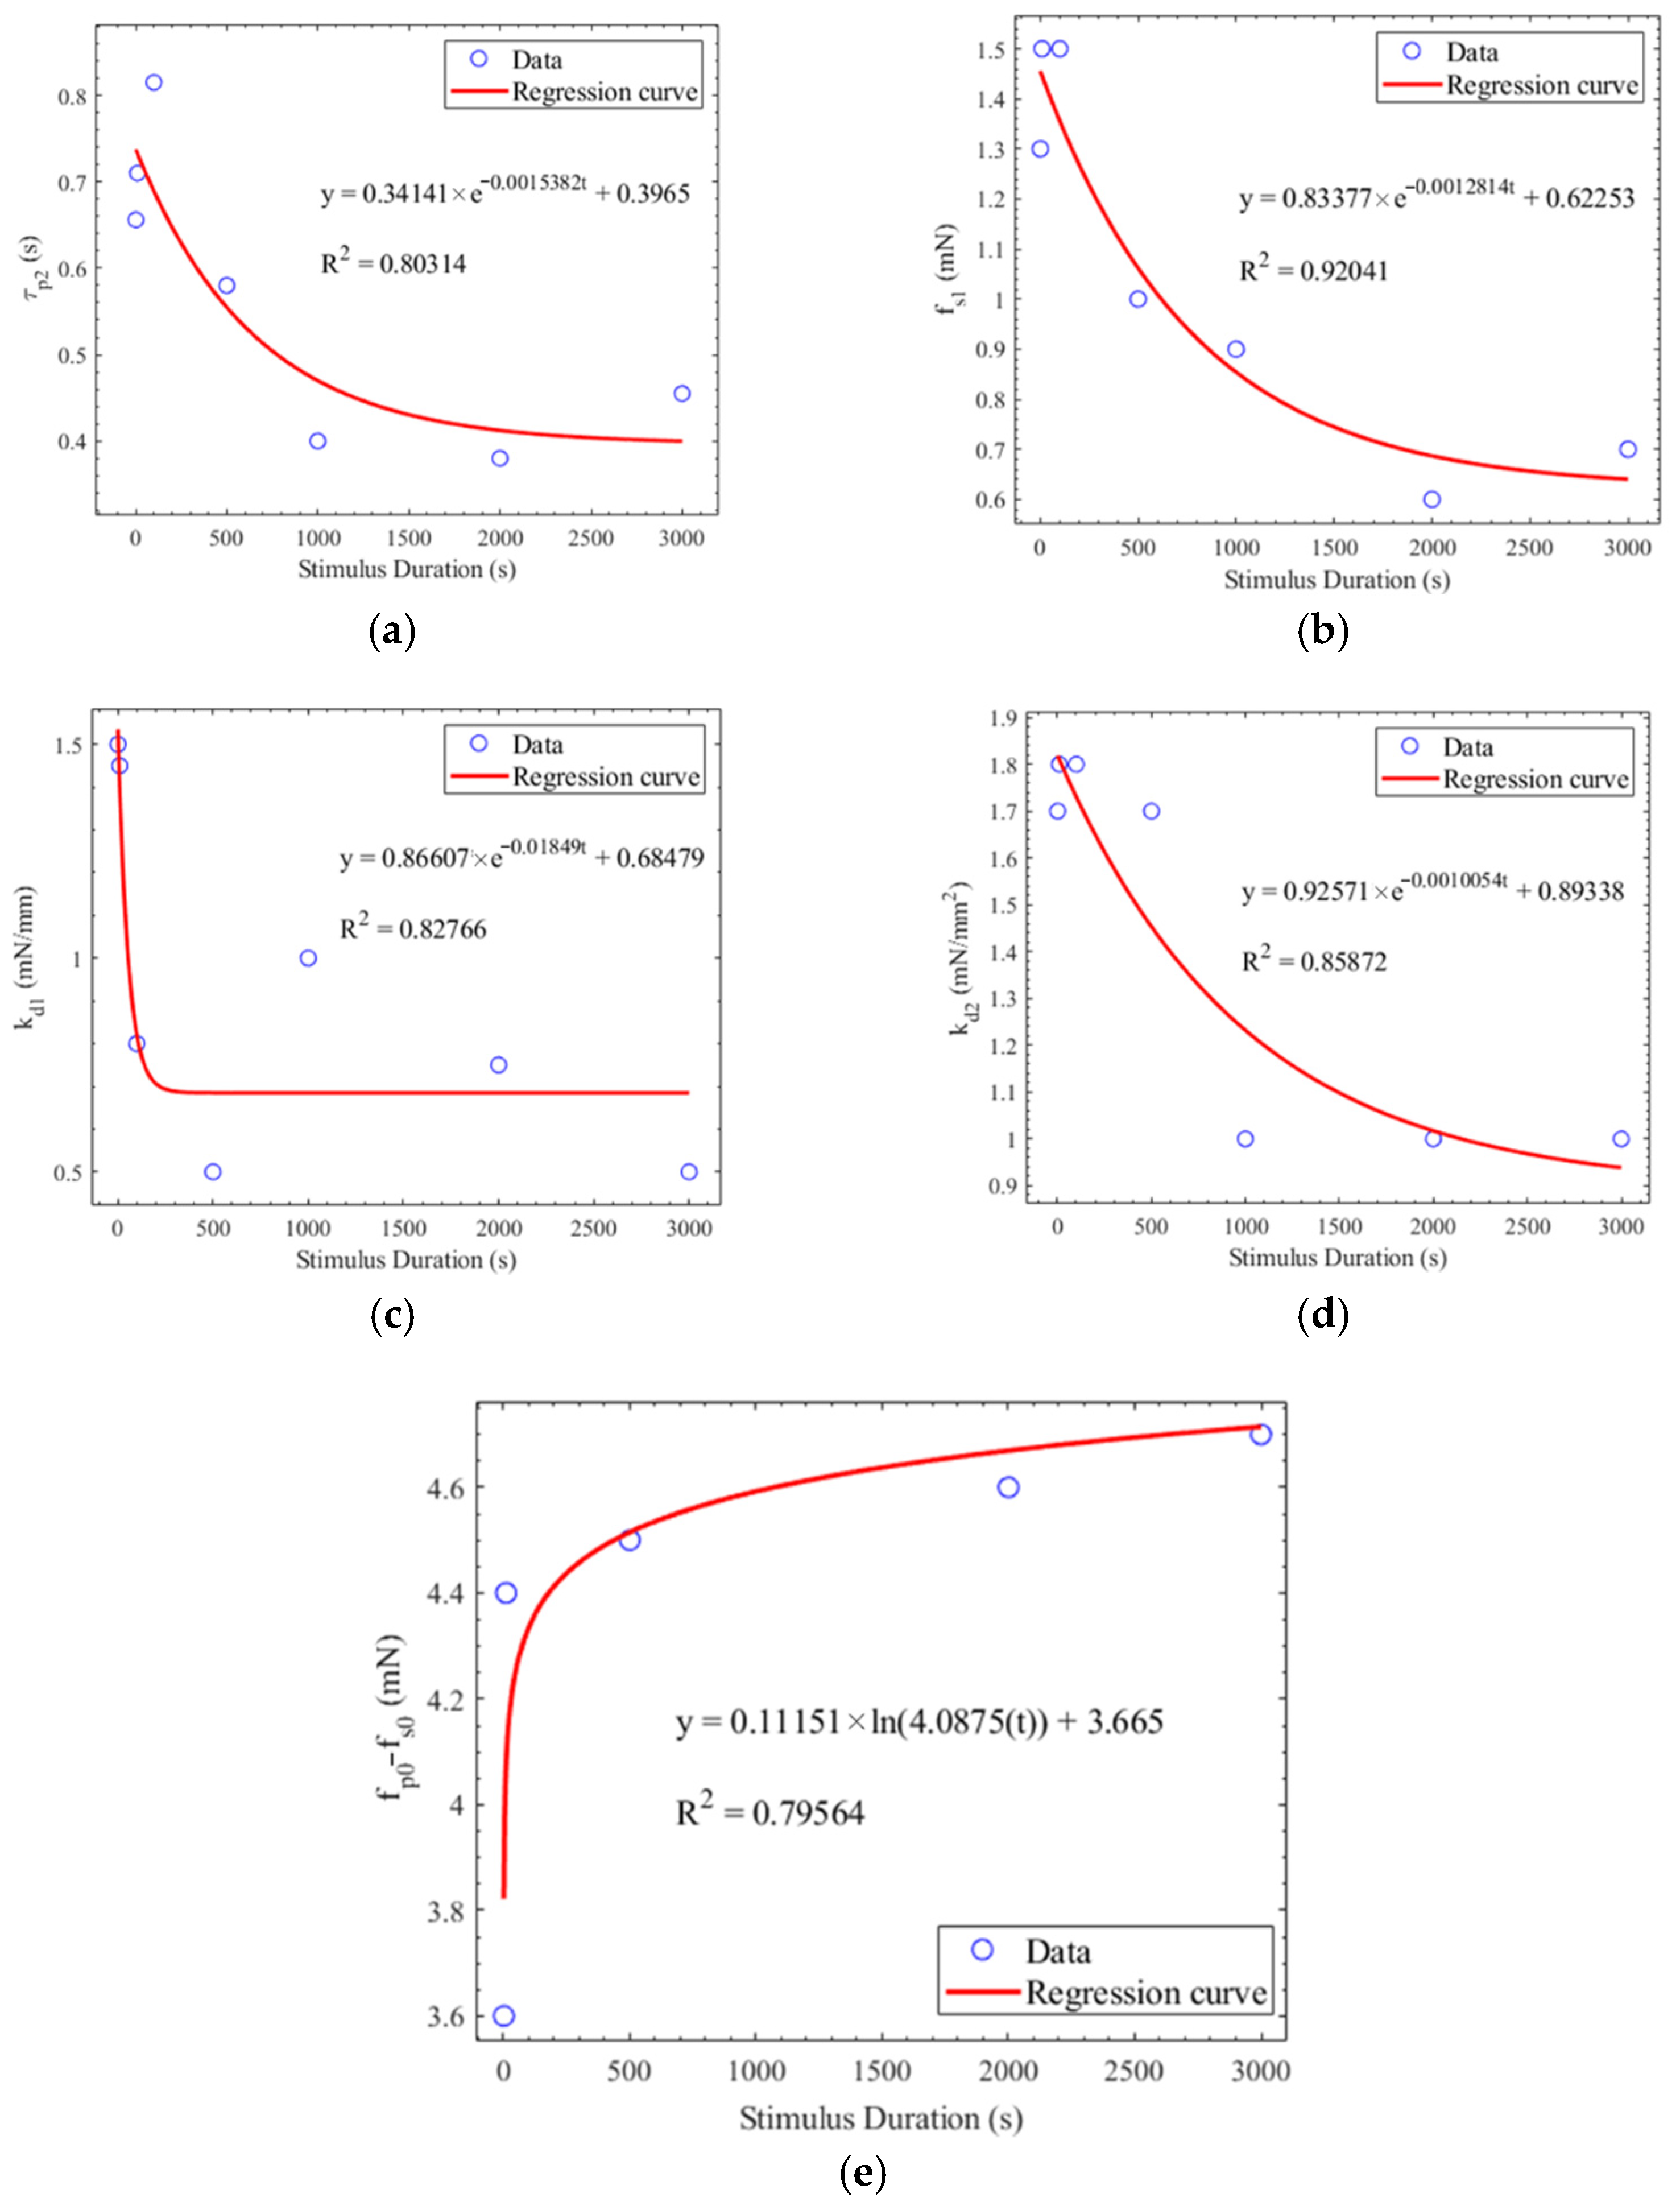
2.4. Validation of PLR Inherent Model

The PLR inherent model was verified by predicting the PLR response caused by different stimulus durations. The regression between the parameters and the stimulus durations in Table 2 was calculated. The coefficient of variation was applied to find which parameters were significantly affected by the stimulus duration. Coefficient of variation C v was written as
C v = σ μ ,
where Cv represents the coefficient of variation, σ represents standard deviation, and μ represents the average. Table 3 shows the average, standard deviation, and coefficient of variation of the parameters under different stimulus durations. C v equal to 0.15 was defined as the threshold for determining whether the parameters were susceptible to the stimulus duration. The stimulus duration of 10 ms was used to predict other PLRs under the stimulus durations of 1 ms, 100 ms, 500 ms, 1 s, 2 s, and 3 s. If the Cv of the parameter is less than 0.15, the parameters are unaffected by the stimulus durations. These parameters of τ p 1 , τ s 1 , τ s 2 , f p 0 , and l 0 , extracted from the PLR at the stimulus duration of 10 ms, were directly applied to predict the PLR under all the other stimulus durations. Figure 8 shows the regression curves of the parameters significantly affected by the stimulus durations. The value of these parameters used to predict the PLR response was decided by the regression function between these parameters and the stimulus durations.
Figure 9 shows the RMSPE between the predicted PLR response and the measured PLR response. The blue line is the predicted PLR response that the parameters extracted from the PLR under the stimulus duration of 10 ms were directly applied to predict the PLR response under other stimulus durations. The RMSPE between the measured and predicted PLR response increased as the stimulus duration increased. The red line is the predicted PLR with which the parameters were calculated by the regression equations of these parameters. Each prediction had a similarity of more than 90%. Although the predicted PLR responses generated by our model had a slight deviation, the similarity between the predicted PLR responses and the measured PLR responses was over 90%.

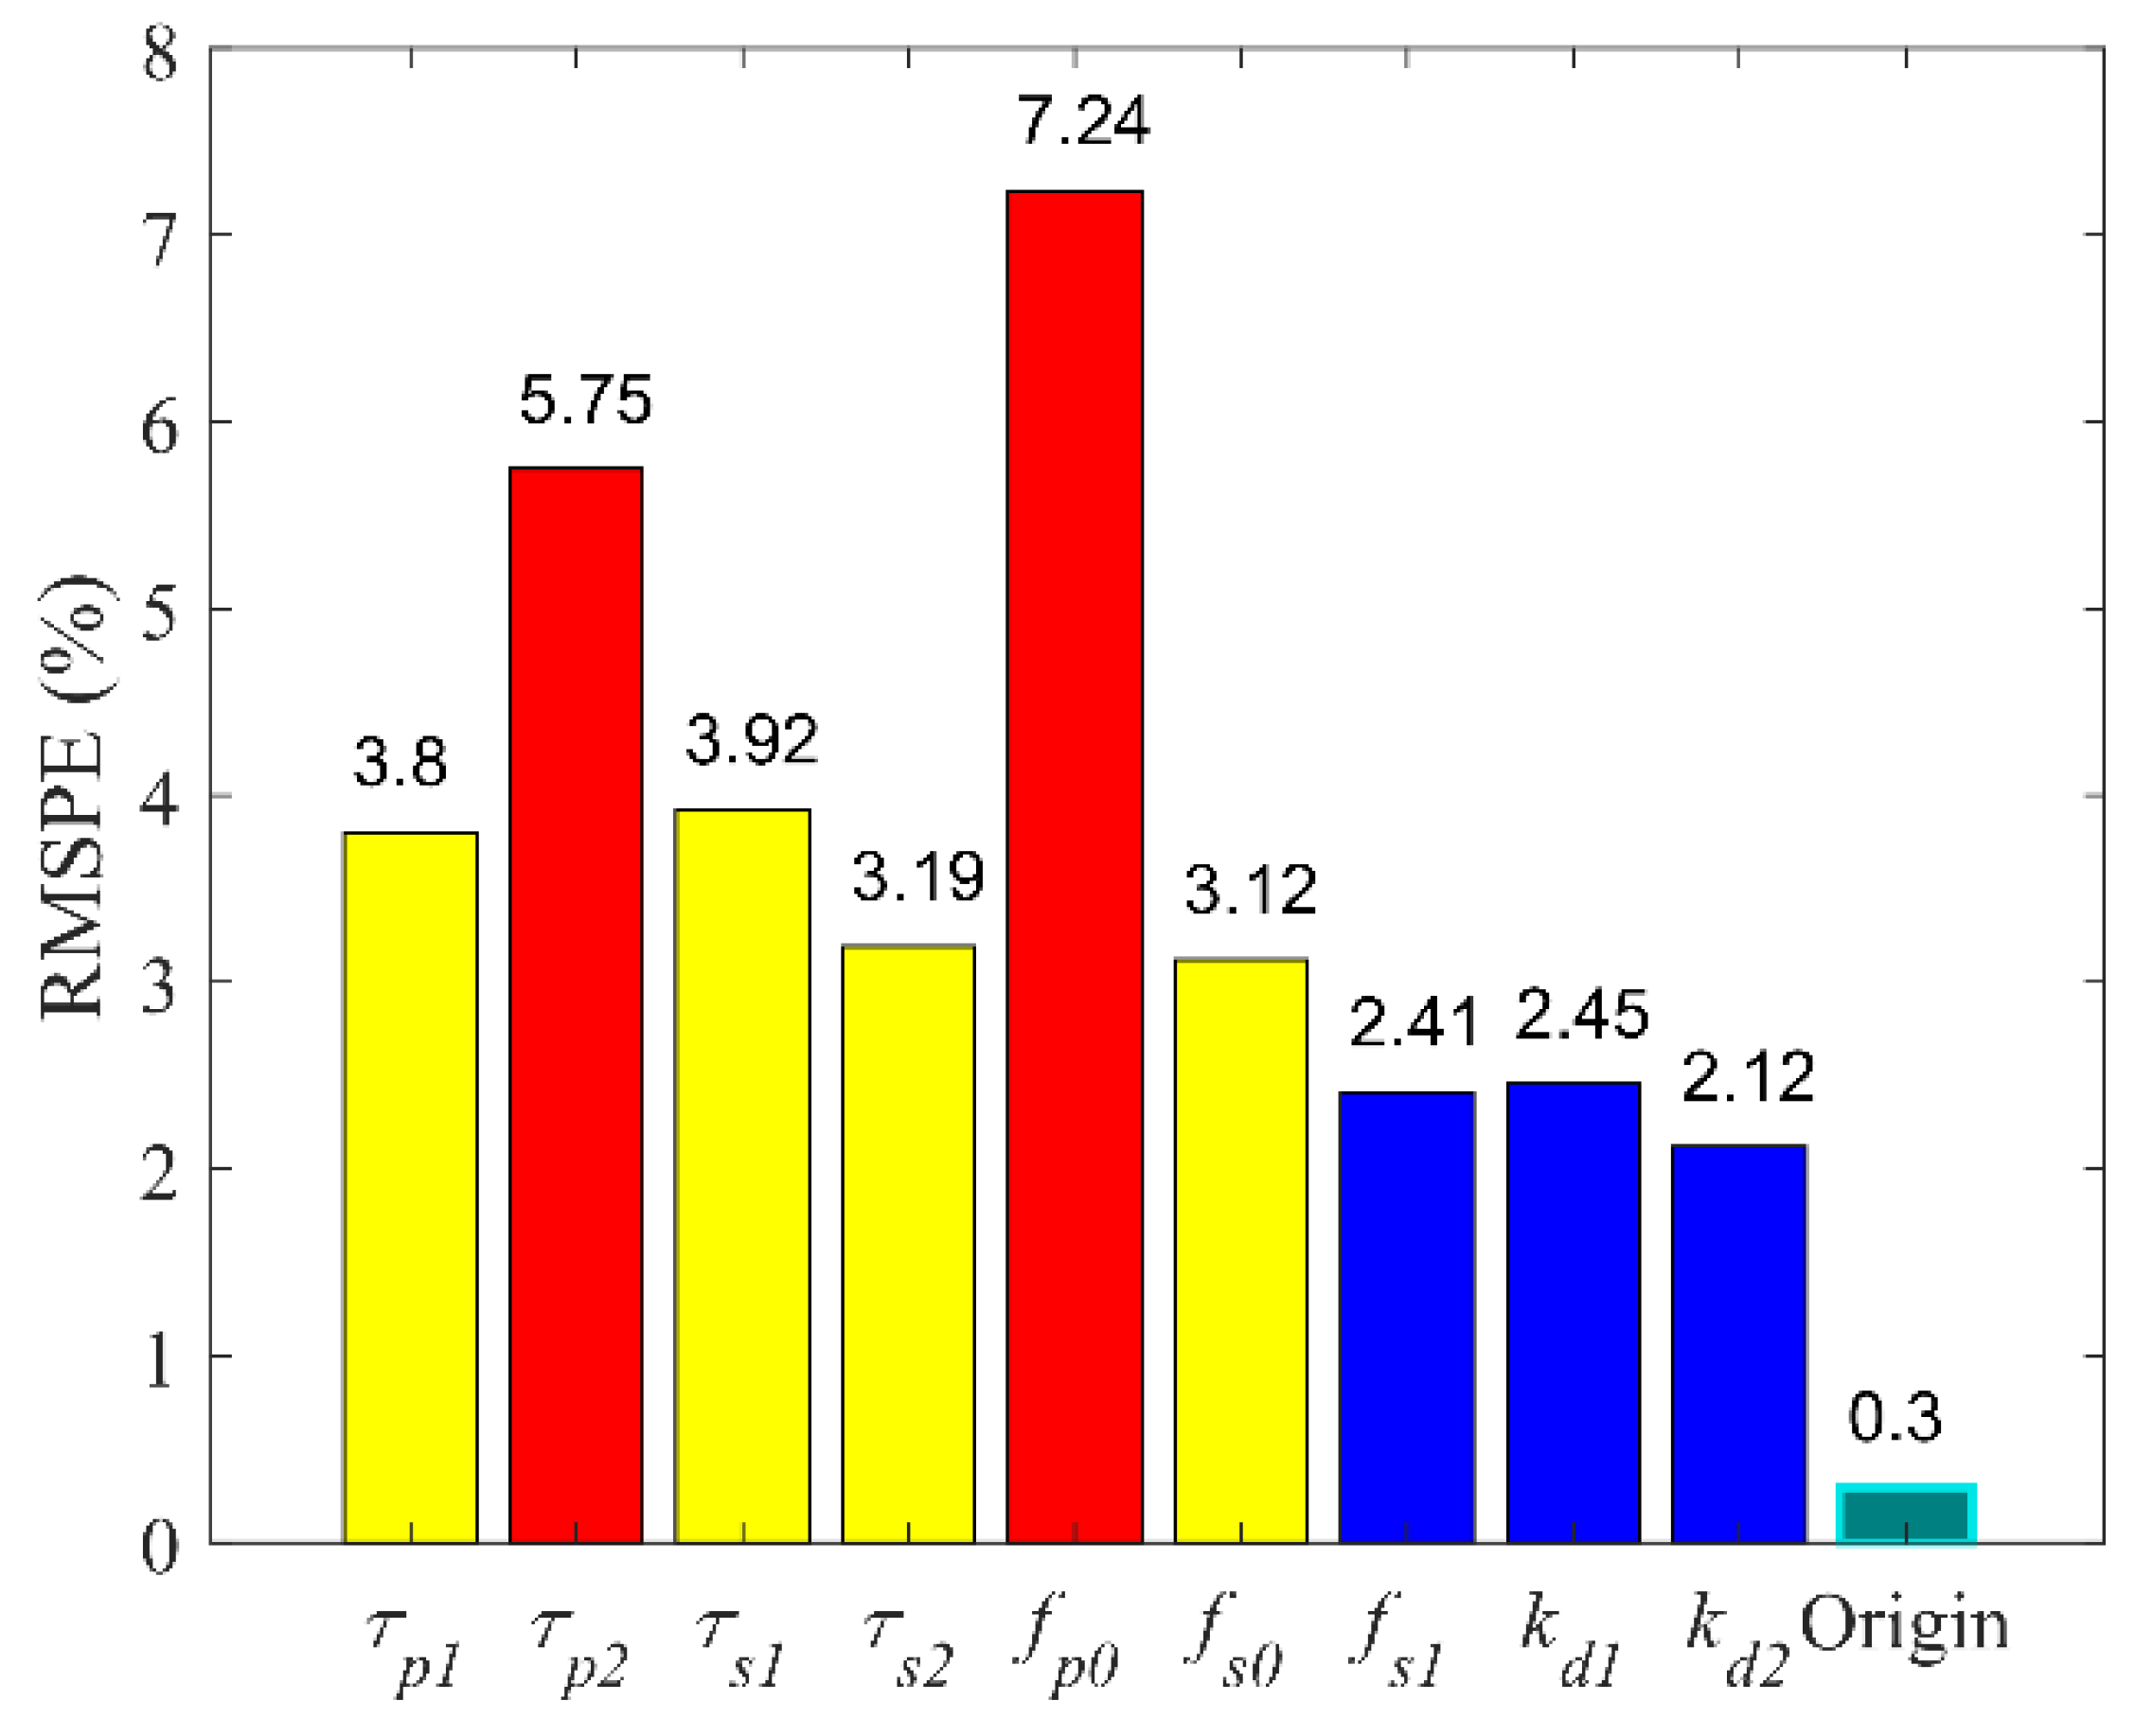
2.5. Sensitivity Analysis of PLR Inherent Model

Sensitivity analysis aims to study how much model output is affected by variation in model input or the model parameters. The sensitivity of the PLR inherent model complied with accuracy to the parameters listed in Table 2. One parameter was increased by 10% at a time, while the other parameter was constant, and the RMSPE between the model output and the experimental data was calculated. The RMSPE of each increasing parameter is depicted in Figure 10. The RMSPE increased by more than ten times in changing τp2, τs1, τs2, fp0 and increased by 15 times in changing fp0 and τp2. Compared to other parameters, fp0 and τp2 significantly affected the accuracy of model simulation.

3. Autonomic Neural Transmission Analysis

3.1. Material and Experiment

A total of 84 participants, including 42 healthy people and 42 people with DM, participated in the experiment at National Taiwan University Hospital. No participants had a history of eye trauma, history of an eye operation, keratopathy, cataracts, color blind, color weakness, epilepsy, systemic diseases, retinal diseases, or high myopia. Table 4 presents the basic statistical information of participants.
The experimental procedure was the same as the previous study [24]. All participants took dark adaption in a dark room for 2 min and then underwent two tests, each including four stimuli of white, red, green, and blue light. The stimulus intensity of one test was 0.2 cd, and the other one was 1.2 cd. In all stimuli, the right eyes of all participants were simulated for 10 ms, and both eyes of all participants were recorded for 25 s. The participants were provided with a rest for 25 s between each stimulus and rest for 5 min between two tests.

3.2. Coherence between Direct Response and the Consensual Response of Pupillary Light Reflex

This section took the pupillary response of healthy participants under white light stimulus as an example to discuss the coherence between direct response and consensual response. The direct response was the PLR response of the stimulated right eye and the consensual response was that of the non-stimulated left eye. A total of 10 parameters of the PLR inherent model were used to observe the difference of PLR response between stimulated eyes and consensual eyes. The percentage error (7) of all parameters between both eyes was calculated. Although the parameters, τp1, τp2, τs1, τs2, and l0, exhibited a slight difference between the two responses, the percentage errors were all below 10%. Table 5 shows the results of the experiment.
PE ( % ) = P a r a m e t e r R i g h t P a r a m e t e r L e f t P a r a m e t e r R i g h t × 100 % .

3.3. The Coherence of Pupillary Light Reflex between Four Light Stimuli

This section took the pupillary response of the right eye in healthy participants as an example to discuss the PLR difference between four light stimuli. The coefficient of variation was performed (6). Table 6 presents the statistical results of 10 parameters in white, red, green, and blue stimuli. Consequently, the total of nine parameters exhibited a slight difference between four stimuli; the C v of these parameters were all below 0.1.

3.4. PLR Comparison between Healthy People and Those with DM

In this section, we compared the difference in autonomic neurotransmission between healthy people and those with DM by applying the parameters in PLR inherent model. Because the parameters showed neither significant differences between direct PLR response and consensual response nor significant differences between four stimuli, all PLR data of both eyes were divided into those of healthy participants and those of participants with DM regardless of stimulus intensity and stimulus color; thus, a total of 336 healthy PLR samples and 336 PLR samples, which included the PLR of both eyes under two intensities and four stimuli, was recruited in tests. Two groups coming from the same population should be examined, so a two-sample t-test was used:
t = ( X 1 ¯ X 2 ¯ ) ( μ 1 μ 2 ) S 1 2 n 1 + S 2 2 n 2 ,
where X 1 ¯   and   X 2 ¯ represent the mean of two groups, S 1   and   S 2 represent the standard deviation of the two groups, and n 1   and   n 2 represent the sample number of two groups. Null hypothesis (H0) was applied in this test, assuming that μ 1   μ 2 = 0 . t can be converted to p by t-distribution. If p is less than 0.05, the null hypothesis is rejected, which represents the two groups are significantly different. Table 7 presents the results of the tests. A total of 10 parameters, comprising τs1, fs0, kd1, l0, τp2-τs1, fp0-fs0, τs1-τp1, Imp1, Imp2, and l0′ * kd1, exhibited significant differences between healthy participants and those with DM. l0 was l0 divided by the diameter of the iris.

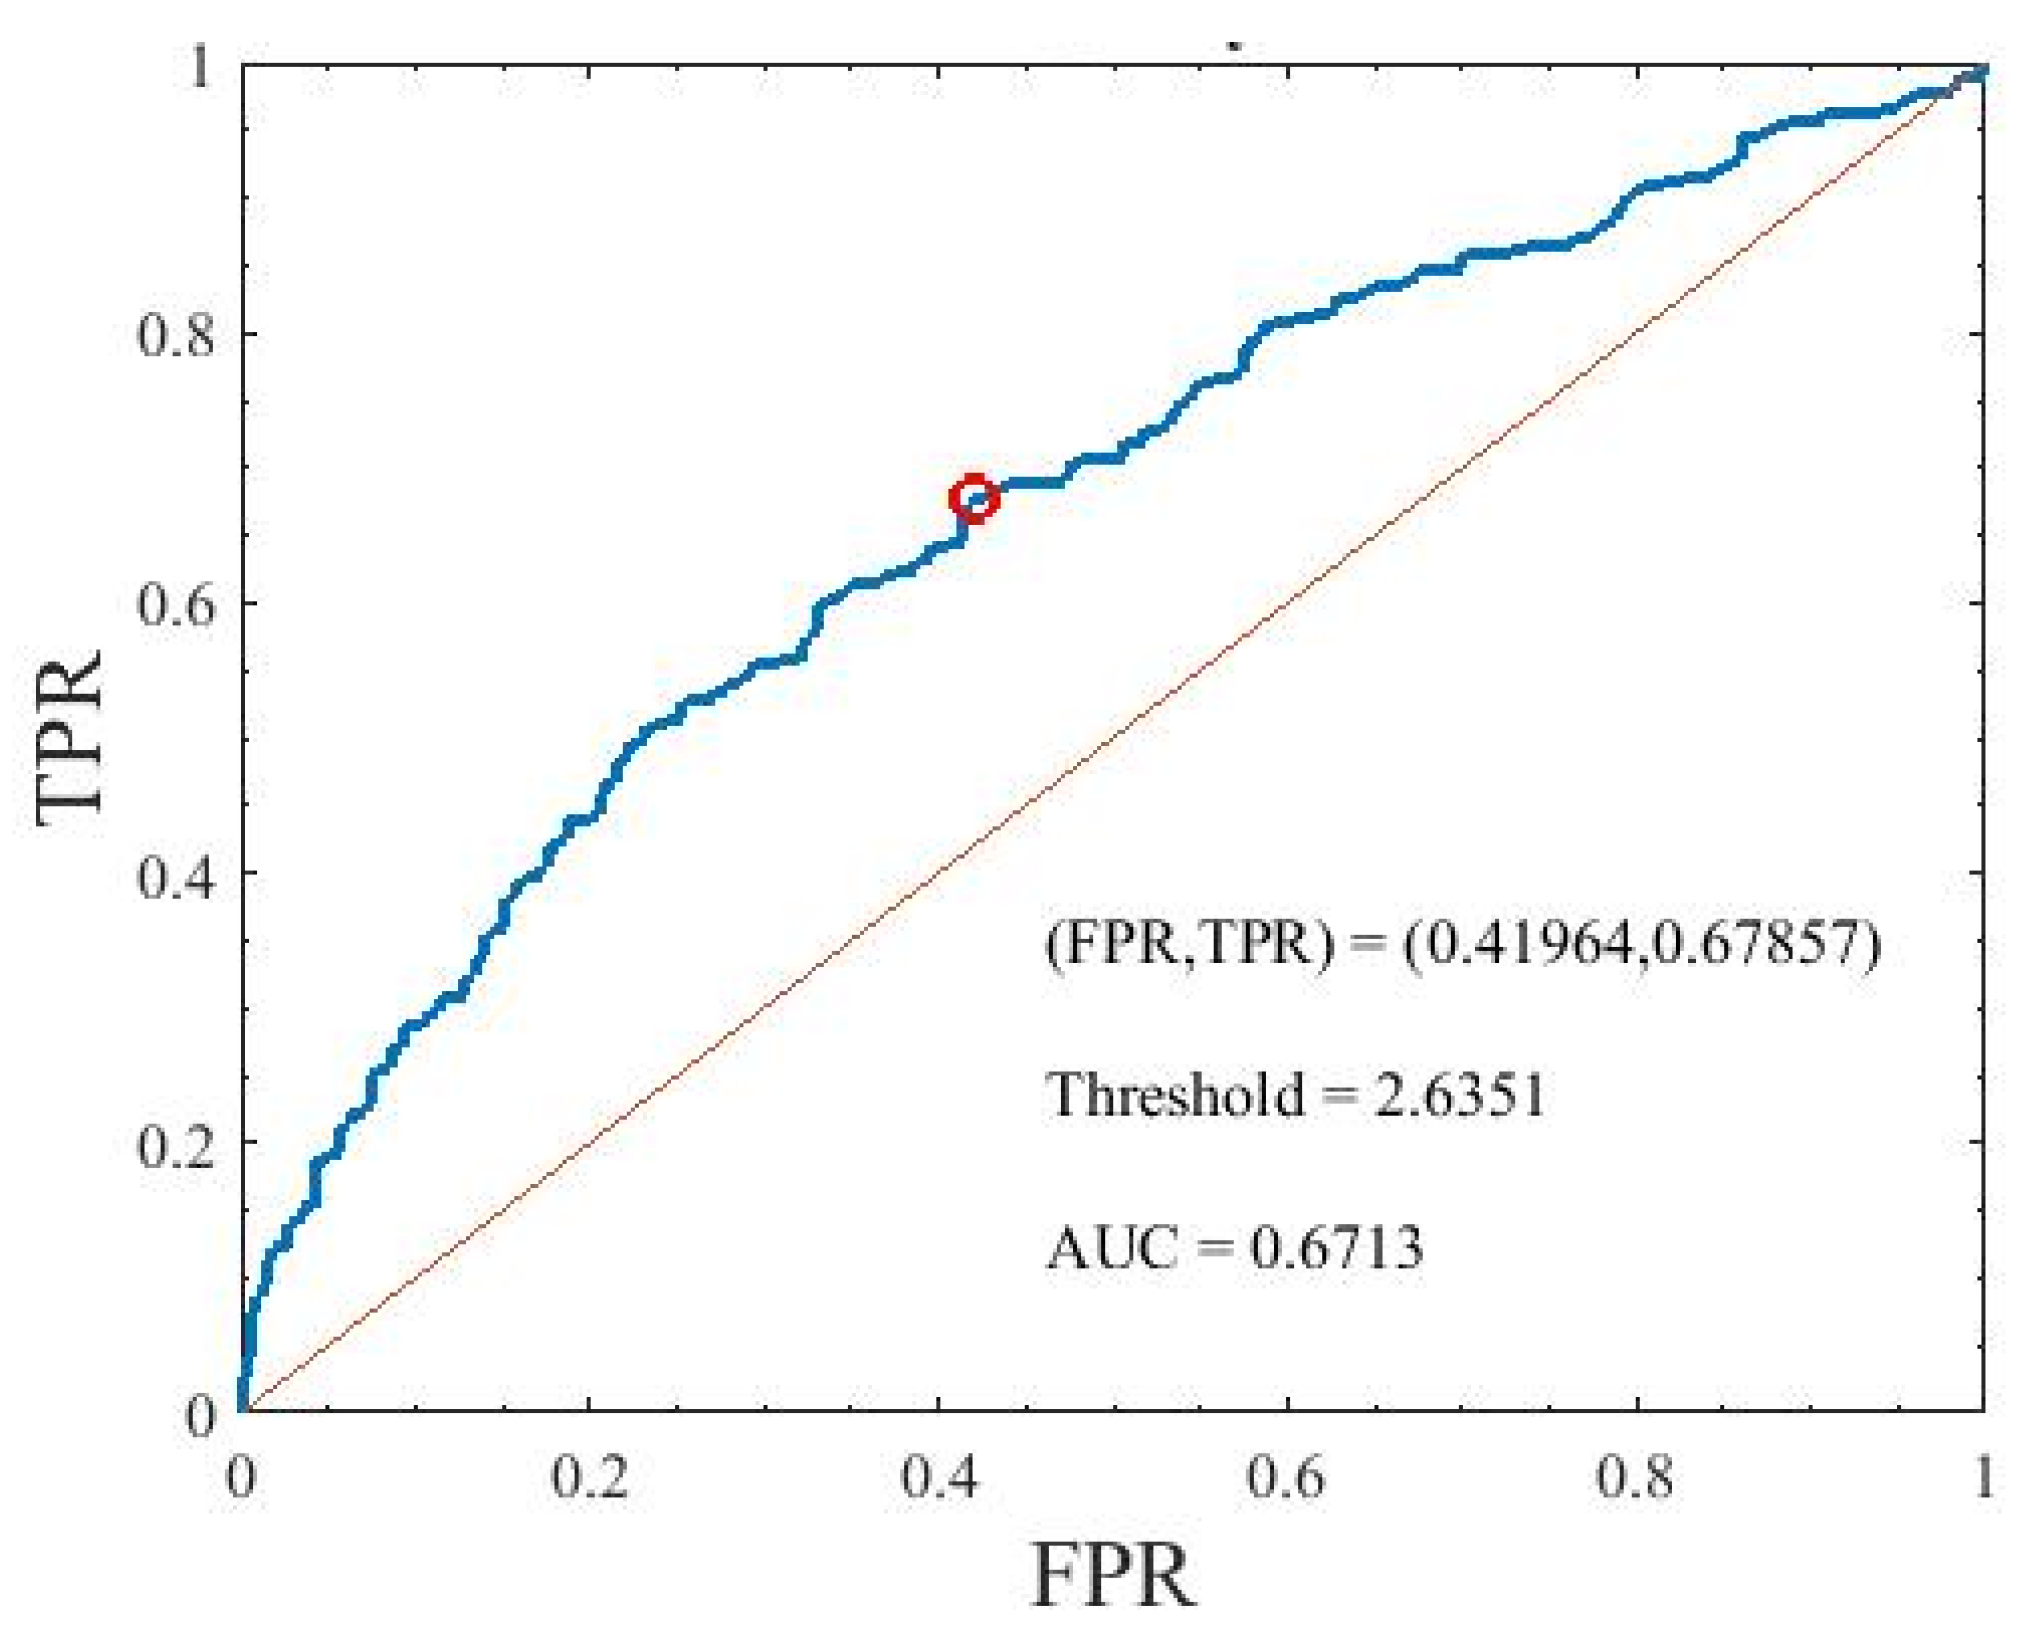
3.5. Receiver Operating Characteristic Analysis between Healthy People and Those with DM

This study also tried to assess the diabetic autonomic neuropathy by examining the PLR abnormalities in people with DM; thus, the ROC analysis was used to evaluate which parameters of the PLR inherent model were the best index to identify the abnormalities of the PLR between healthy people and those with DM. Consequently, the top 10 parameters listed in Table 7 did not exhibit good results, so the area under the curve (AUC) of these parameters was less than 0.6; however, we tried to create a factor from these parameters to achieve a better AUC. According to the statistical results in Table 7, Imp2 and l0 * kd1 achieved significant differences between healthy participants and those with DM, and correlated with the other parameters that also achieved significant differences; Thus, the DAN factor was defined as:
D A N = I m p 2 l 0 k d 1
Figure 11 shows the ROC curve of the DAN factor. The AUC of the factor was 0.6713. The sensitivity and specificity of that were 0.6786 and 0.5804, respectively.

4. Discussion

In the PLR inherent model, the first-order term of elastic force with kd1 was contained to improve the description of the elastic force in pupillary dilator and pupillary constrictor. The elastic force, the viscous force, and the ANS forces were assumed to be zero when the pupil was in a dark-adapted resting state; the SNS force was assumed to join the pupillary constriction before the maximum pupil constriction and still active in pupillary dilation while the force of PSNS stopped. According to the fitting result, τp1 was approximately 200 ms under all stimulus durations; this result is consistent with that of Fan’s model [37], whereas τs1 was not consistent with that of Fan’s because the assumption of SNS force was different. Compared to Fan’s model, our model precisely simulated the PLR response when the stimulus duration was less than 3 s (Figure 6). Moreover, the RMSEs of the predicted PLR response were less than 8.5% when the model parameters were derived from the regression by the measured PLR response.
A total of 18 parameters in the PLR inherent model were used to compare the PLR difference in people with and without DM. τs1 of the participants with DM was significantly longer than those of the healthy participants (p = 1.44E × 10−5). fs0 and fp0-fs0 of the participants with DM were larger and lower than those of the healthy participants (p = 0.384 and p = 0.004), respectively. τs1 and fs0 are mainly associated with the later stage of pupillary constriction and the early stage of pupillary dilation. The increase of τs1 and fs0 could increase the maximum pupil constriction velocities (MCV). The increased MCV of the people with DM compared to that of healthy people was also found in previous studies [24]. The kd1 and the Imp2 of the participants with DM were significantly smaller than those of the healthy participants (p = 0.081 and p = 4.55 × 10⁻⁷). The decrease in kd1 and Imp2 is related to the decrease in maximum pupillary restoration velocities (MRV) and average pupillary restoration velocities. The reduced MRV in people with autonomic dysfunction or DM was also reported by Muppidi et al. [25] and the study [24]. The reduced MRV in people with DM was also found by Jain et al. [20] and the study [24]. Ishikawa et al. [39] reported that the constrictor presented normal nerve endings, but the dilator had some degenerated nerve endings; this indicates sympathetic damage.
The altered function of efferent fibers from the ciliary ganglion to the iris might be the reason for the abnormal PLR. The afferent limb of PLR is exclusively mediated by melanopsin-expressing retinal ganglion cells (mRGCs) [40]. The mRGCs not only receive synaptic input from rod and cone cells but also directly respond to light. The mRGCs convey the synaptic signal into the olivary pretectal nucleus in turn to the edinger-westphal nucleus (EWN). Afterward, the EWN innervates the constrictor by means of the ciliary ganglion neurons [41]. Kumar et al. found that the diabetic mouse had faster pupillary constriction and slower dilation than the healthy mouse under a 488-nm high intensity blue laser light [42]. These symptoms were correlated to the extensive dendritic network of the mRGCs and increased melanopsin mRNA in the diabetic mouse. Kumar et al. concluded that the pathological changes of the mRPGs during early diabetic retinopathy might contribute to the changes in PLR. However, the PLR associated with mRPGs is induced by short-wavelength (blue) and high-intensity light in longer stimulus durations [43]; this stimulus condition is different from the current study.
The inherent PLR model in the current study could not directly explain the pathological changes in people with DM but could observe the changes in pupillary constriction and dilation controlled by the sympathetic and parasympathetic nervous system under a short-pulse white light stimulus. In summary, the parameters (e.g., τs1 and fs0) relative to SNS were all significantly different between healthy participants and those with DM. The reason could be that the sympathetic nervous system, which controls the dilator muscle, altered in diabetic patients.

5. Conclusions

In this study, we used the PLR inherent model to explore the PLR abnormalities in people with DM. By extracting the parameters from the participants with and without DM, the abnormalities relating to ANS could be observed; according to the statistical test results in Table 7, the dilator and the nerve endings of SNS might degenerate in people with DM whose diabetic duration is less than ten years. However, one of our limitations was that the results were not further verified by directly observing the ANS of people with and without DM. In the future, the number of samples of the experiments could be increased and to explore the abnormities of the ANS in people with DM by microscope or ultrasonic equipment to verify the testing results of the PLR.

Author Contributions

Conceptualization, Y.-J.Y. and M.O.-Y.; methodology, Y.-J.Y. and M.O.-Y.; software, C.-N.C.; data curation, C.-N.C.; writing—original draft preparation, C.-N.C. and Y.-J.Y.; writing—review and editing, Y.-J.Y. and M.O.-Y.; project administration, Y.-J.Y. and M.O.-Y.; funding acquisition, M.O.-Y. All authors have read and agreed to the published version of the manuscript.

Funding

This research was funded by the Ministry of Science and Technology of Taiwan (MOST 105-2221-E-009 -082, MOST 107-2221-E009-155, MOST 108-2221-E009-125, MOST 109-2321-B009-008-), National Taiwan University Hospital Hsin-Chu Branch (NTUHHCB 103-054-E).

Institutional Review Board Statement

The study was conducted according to the guidelines of the Declaration of Helsinki and approved by the Institutional Review Board of National Taiwan University Hospital Hsin-Chu Branch, Hsinchu City 300, Taiwan. (103-054-E).

Informed Consent Statement

All subjects gave their informed consent for inclusion before they participated in the study. The study was conducted in accordance with the Declaration of Helsinki, and the protocol was approved by the Institutional Review Board of National Taiwan University Hospital Hsin-Chu Branch, Hsinchu City 300, Taiwan. (103-054-E).

Data Availability Statement

The data presented in this study are available on request from the corresponding author. The data are not publicly available due to their containing information that could compromise the privacy of research participants and the IRB statement (103-054-E).

Acknowledgments

We would like to thank Yi-Chun Tsai for all works in this study and KO Mei-Lan for helping conduct the experiments in National Taiwan University Hospital Hsin-Chu Branch, Hsinchu City 300, Taiwan.

Conflicts of Interest

The authors declare no conflict of interest.

References

  1. Vander, A.J.; Sherman, J.H.; Luciano, D.S. Human Physiology: The Mechanisms of Body Function; (no. 612 V228h); McGraw-Hill: New York, NY, USA, 1998. [Google Scholar]
  2. Zygmunt, A.; Stanczyk, J. Methods of evaluation of autonomic nervous system function. AMS 2010, 6, 11. [Google Scholar] [CrossRef] [PubMed]
  3. Carnethon, M.R.; Prineas, R.J.; Temprosa, M.; Zhang, Z.-M.; Uwaifo, G.; Molitch, M.E. The association among autonomic nervous system function, incident diabetes, and intervention arm in the Diabetes Prevention Program. Diabetes Care 2006, 29, 914–919. [Google Scholar] [CrossRef] [Green Version]
  4. Leal, G.; Neves, C.; Vieira, P.M. Pupillometry: Development of equipment for studies of autonomic nervous system. In Technological Innovation for Value Creation, International Federation for Information Processing Advances in Information and Communication Technology 2012; Springer: Berlin/Heidelberg, Germany, 2006; Volume 372, pp. 553–562. [Google Scholar]
  5. Barbur, J.L. Learning from the Pupil: Studies of Basic Mechanisms and Clinical Application; The Visual Neurosciences; Chalupa, L.M., Werner, J.S., Eds.; MIT Press: Cambridge, MA, USA, 2004; pp. 641–656. [Google Scholar]
  6. Surakka, J.; Ruutiainen, J.; Romberg, A.; Puukka, P.; Kronholm, E.; Karanko, H. Pupillary function in early multiple sclerosis. Clin. Auton. Res. 2008, 18, 150–154. [Google Scholar] [CrossRef]
  7. Mahmoudian, M.; Ebrahimi, S.A.; Kiani, Z. An image processing technique for diagnosis of Alzheimer’s disease. J. Res. Med. Sci. 2009, 14, 205–209. [Google Scholar] [PubMed]
  8. Chougule, P.S.; Najjar, R.P.; Finkelstein, M.T.; Kandiah, N.; Milea, D. Light-induced pupillary responses in Alzheimer’s disease. Front. Neurol. 2019, 10, 360. [Google Scholar] [CrossRef] [PubMed] [Green Version]
  9. Tatham, A.J.; Meira-Freitas, D.; Weinreb, R.N.; Zangwill, L.M.; Medeiros, F.A. Detecting glaucoma using automated pupillography. Ophthalmology 2014, 121, 1185–1193. [Google Scholar] [CrossRef] [Green Version]
  10. Chaidaroon, W.; Juwattanasomran, W. Colvard pupillometer measurement of scotopic pupil diameter in emmetropes and myopes. Jpn. J. Ophthalmol. 2002, 46, 640–644. [Google Scholar] [CrossRef]
  11. Zeng, T.; Shi, Y.T.; Peng, Y.T.; Chen, N.H.; Ma, Y.Y. Feature extraction and pupil size detection of pupillary light reflex in opiate addicts. Zool. Res. 2010, 31, 415–420. [Google Scholar]
  12. Narita, A.; Shirai, K.; Kubota, N.; Takayama, R.; Takahashi, Y.; Onuki, T.; Numakura, C.; Kato, M.; Hamada, Y.; Sakai, N.; et al. Abnormal pupillary light reflex with chromatic pupillometry in Gaucher disease. Ann. Clin. Transl. Neurol. 2014, 1, 135–140. [Google Scholar] [CrossRef]
  13. Schwingshandl, J.; Simpson, J.M.; Donaghue, K.; Bonney, M.-A.; Howard, N.J.; Silink, M. Pupillary abnormalities in type I diabetes occurring during adolescence: Comparisons with cardiovascular reflexes. Diabetes Care 1993, 16, 630–633. [Google Scholar] [CrossRef]
  14. Pittasch, D.; Lobmann, R.; Behrens-Baumann, W.; Lehnert, H. Pupil signs of sympathetic autonomic neuropathy in patients with type 1 diabetes. Diabetes Care 2002, 25, 1545–1550. [Google Scholar] [CrossRef] [PubMed] [Green Version]
  15. Yang, Y.; Yu, Y.; Yao, K. Pupillary dysfunction in type 2 diabetes mellitus to refine the early diagnosis of diabetic autonomic neuropathy. Neuro Ophthalmol. 2009, 30, 17–21. [Google Scholar] [CrossRef]
  16. Ferrari, G.L.; Marques, J.L.; Gandhi, R.A.; Emery, C.J.; Tesfaye, S.; Heller, S.R.; Gamba, H.R. An approach to the assessment of diabetic neuropathy based on dynamic pupillometry. In Proceedings of the 2007 29th Annual International Conference of the IEEE Engineering in Medicine and Biology Society, Lyon, France, 23–26 August 2007; pp. 557–560. [Google Scholar]
  17. Ferrari, G.L.; Marques, J.L.; Gandhi, R.A.; Heller, S.R.; Schneider, F.K.; Tesfaye, S.; Gamba, H.R. Using dynamic pupilometry as a simple screening tool to detect autonomic neuropathy in patients with diabetes: A pilot study. Biomed. Eng. OnLine 2010, 9, 26. [Google Scholar] [CrossRef] [PubMed] [Green Version]
  18. Lerner, A.G.; Bernabé-Ortiz, A.; Ticse, R.; Hernandez, A.; Huaylinos, Y.; Pinto, M.E.; Málaga, G.; Checkley, W.; Gilman, R.H.; Miranda, J.J.; et al. Type 2 diabetes and cardiac autonomic neuropathy screening using dynamic pupillometry. Diabetic Med. 2015, 32, 1470–1478. [Google Scholar] [CrossRef]
  19. Park, J.C.; Chen, Y.F.; Blair, N.P.; Chau, F.Y.; Lim, J.I.; Leiderman, Y.I.; McAnany, J. Pupillary responses in non-proliferative diabetic retinopathy. Sci. Rep. 2017, 7, 1–10. [Google Scholar] [CrossRef] [PubMed]
  20. Jain, M.; Devan, S.; Jaisankar, D.; Swaminathan, G.; Pardhan, S.; Raman, R. Pupillary abnormalities with varying severity of diabetic retinopathy. Sci. Rep. 2018, 8, 1–6. [Google Scholar] [CrossRef] [PubMed] [Green Version]
  21. Ko, M.L.; Chen, Y.Y.; Ouyang, Y.; Huang, T.W.; Tsuen, B.S.; Jeng, W.D.; Ou-Yang, M. Design and analysis of wearable pupillometer for autonomic neuropathy of diabetic patients. Appl. Opt. 2014, 53, H27–H34. [Google Scholar] [CrossRef]
  22. Smith, S.A.; Dewhirst, R.R. A simple diagnostic test for pupillary abnormality in diabetic autonomic neuropathy. Diabetic Med. 1986, 3, 38–41. [Google Scholar] [CrossRef]
  23. Smith, S.A.; Smith, S.E. Reduced pupillary light reflexes in diabetic autonomic neuropathy. Diabetologia 1983, 24, 330–332. [Google Scholar] [CrossRef] [Green Version]
  24. Yan, Y.J.; Tsai, Y.C.; Ko, M.L.; Lee, N.C.; Chiou, J.C.; Ou-Yang, M. Quantitative examination of early diabetes by light-emitting diodes light-induced pupillary light reflex. Rev. Sci. Instrum. 2021, 92, 014101. [Google Scholar] [CrossRef] [PubMed]
  25. Muppidi, S.; Adams-Huet, B.; Tajzoy, E.; Scribner, M.; Blazek, P.; Spaeth, E.B.; Frohman, E.; Davis, S.; Vernino, S. Dynamic pupillometry as an autonomic testing tool. Clin. Auton. Res. 2013, 23, 297–303. [Google Scholar] [CrossRef] [PubMed]
  26. Stark, L.; Sherman, P.M. A servoanalytic study of consensual pupil reflex to light. J. Neurophysiol. 1957, 20, 17–26. [Google Scholar] [CrossRef] [PubMed] [Green Version]
  27. Stark, L.; Baker, F. Stability and oscillations in a neurological servomechanism. J. Neurophysiol. 1959, 22, 156–164. [Google Scholar] [CrossRef]
  28. Stark, L.; Campbell, F.W.; Atwood, J. Pupil unrest: An example of noise in a biological servomechanism. Nature 1958, 182, 857–858. [Google Scholar] [CrossRef]
  29. Sun, F.; Krenz, W.C.; Stark, L. A systems model for the pupil size effect: I. Transient data. Biol. Cybern. 1985, 48, 101–108. [Google Scholar] [CrossRef]
  30. Krenz, W.C.; Stark, L. Systems model for pupil size effect. II. Feedback model. Biol. Cybern. 1985, 51, 391–397. [Google Scholar] [CrossRef]
  31. Privitera, C.M.; Stark, L. A binocular pupil model for simulation of relative afferent pupil defects and the swinging flashlight test. Biol. Cybern. 2006, 94, 215–224. [Google Scholar] [CrossRef]
  32. Pamplona, V.F.; Oliveira, M.M.; Baranoski, G.V.G. Photorealistic models for pupil light reflex and iridal pattern deformation. ACM Trans. Graph. 2009, 28, 1–12. [Google Scholar] [CrossRef]
  33. Moon, P.; Spencer, D.E. On the stiles-crawford effect. JOSA 1944, 34, 319–329. [Google Scholar] [CrossRef]
  34. Longtin, A.; Milton, J.G. Insight into the transfer function, gain, and oscillation onset for the pupil light reflex using nonlinear delay-differential equations. Biol. Cybern. 1989, 61, 51–58. [Google Scholar] [CrossRef]
  35. Longtin, A.; Milton, J.G. Modelling autonomous oscillations in the human pupil light reflex using nonlinear delay-differential equations. Bull. Math. Biol. 1989, 51, 605–624. [Google Scholar] [CrossRef] [PubMed]
  36. Usui, S.; Hirata, Y. Estimation of autonomic nervous activity using the inverse dynamic model of the pupil muscle plant. Ann. Biomed. Eng. 1995, 23, 375–387. [Google Scholar] [CrossRef] [PubMed]
  37. Fan, X.; Yao, G. Modeling transient pupillary light reflex induced by a short light flash. IEEE Transact. Biomed. Eng. 2011, 58, 36–42. [Google Scholar]
  38. Ljung, L. System Identification; Signal analysis and prediction; Springer: Berlin/Heidelberg, Germany, 1999; pp. 163–173. [Google Scholar]
  39. Ishikawa, S.; Bensaoula, T.; Uga, S.; Mukuno, K. Electron-microscopic study of iris nerves and muscles in diabetes. Ophthalmologica 1985, 191, 172–183. [Google Scholar] [CrossRef] [PubMed]
  40. Güler, A.D.; Ecker, J.L.; Lall, G.S.; Haq, S.; Altimus, C.M.; Liao, H.W.; Barnard, A.R.; Cahill, H.; Badea, T.C.; Zhao, H.; et al. Melanopsin cells are the principal conduits for rod–cone input to non-image-forming vision. Nature 2008, 453, 102–105. [Google Scholar] [CrossRef] [Green Version]
  41. Berson, D.M. Strange vision: Ganglion cells as circadian photoreceptors. Trends Neurosci. 2003, 26, 314–320. [Google Scholar] [CrossRef]
  42. Kumar, S.; Zhuo, L. Quantitative analysis of pupillary light reflex by real-time autofluorescent imaging in a diabetic mouse model. Exp. Eye Res. 2011, 92, 164–172. [Google Scholar] [CrossRef]
  43. Adhikari, P.; Zele, A.J.; Feigl, B. The post-illumination pupil response (PIPR). Investig. Ophthalmol. Vis. Sci. 2015, 56, 3838–3849. [Google Scholar] [CrossRef] [Green Version]
Figure 1. Procedures of system identification.
Brainsci 11 00852 g001
Figure 2. (a) Control block diagram of the pupillary light reflex inherent model and (b) timing diagram of the force originated from autonomic nervous system before and after a light stimulus.
Brainsci 11 00852 g002
Figure 3. Relations between the root-mean-square percentage error (RMSPE) of model simulation results and the viscous constants when the stimulus durations were 1ms, 10 ms, 100 ms, 500 ms, 1 s, 2 s, and 3 s.
Brainsci 11 00852 g003
Figure 4. Flow chart of parameter estimation order in the model simulation.
Brainsci 11 00852 g004
Figure 5. PLR inherent model output at different stages during parameter searching process.
Brainsci 11 00852 g005
Figure 6. Measured pupillary light reflex (PLR) response and simulated PLR response. The circle markers are measured PLR response, and the solid lines are simulated PLR response.
Brainsci 11 00852 g006
Figure 7. RMSPE of the simulated pupillary light reflex response under seven stimulus durations.
Brainsci 11 00852 g007
Figure 8. (a) Regression between τp2 and the stimulus duration. (b) Regression between fs1 and the stimulus duration. (c) Regression between kd1 and the stimulus duration. (d) Regression between kd2 and the stimulus duration. (e) Regression between fp0-fs0 and the stimulus duration.
Brainsci 11 00852 g008
Figure 9. RMSPE between the measured pupillary light reflex (PLR) response and the predicted PLR response.
Brainsci 11 00852 g009
Figure 10. Sensitivity of nine parameters in pupillary light reflex inherent model.
Brainsci 11 00852 g010
Figure 11. Area under the curve of the DAN factor used to identify the participants with diabetes mellitus. TPR is true positive rate and FPR is false positive rate.
Brainsci 11 00852 g011
Table 1. Initial value and boundary value of the parameter for model simulation and prediction.
ParameterInitial
Value
UnitLower
Bound
Upper
Bound
Step
τ p 1 0.250s0.1500.3000.005
τ p 2 1.250s0.2001.2500.005
τ s 1 0.500s0.2700.6500.005
τ s 2 1.300s1.2002.0000.005
f p 0 11.00mN8.00014.0000.100
f s 0 7.000mN4.00015.0000.100
1.000mN0.1001.5000.100
D 4.300g/s
k d 1 1.000mN/mm0.5001.5000.050
k d 2 1.600mN/mm21.0001.8000.050
Table 2. Extracting parameters of the measured pupillary light reflex in seven stimulus durations.
Parameter1 ms10 ms100 ms500 ms1 s2 s3 s
τ p 1 (s)0.2350.2050.1750.2200.2150.1650.210
τ p 2 (s)0.6560.7100.8150.5800.4000.3800.455
τ s 1 (s)0.4150.4250.5450.5650.5550.5700.570
τ s 2 (s)1.5201.2051.2151.3651.3951.5451.370
f p 0   (mN)10.90011.100012.2011.30011.10010.80011.300
f s 0 (mN)7.3006.7009.7006.8005.8006.2006.600
f s 1 (mN)1.3001.5001.5001.0000.9000.6000.700
k d 1   ( m N m m )1.5001.4500.8000.5001.0000.7500.500
k d 2   ( m N m m 2 )1.7001.8001.8001.7001.0001.0001.000
D (g/s)4.3004.3004.3004.3004.3004.3004.300
Table 3. Coefficient of variation of parameters.
Parameter τ p 1 τ p 2 τ s 1 τ s 2 f p 0 f s 0 f s 1 k d 1 k d 2 l 0
σ 0.2040.5710.5211.37411.2437.0141.0710.9291.4293.245
μ 0.0250.1660.0690.1320.4611.2750.3680.4120.4030.029
C v 0.1230.2910.1330.0960.0410.1820.3440.4440.2820.009
Table 4. Basic characteristics of the participants.
Healthy ParticipantsParticipants with DM
Male: Female26/1629/13
Age (years old)37 ± 1747 ± 14
Original HbA1c (years old)<68.9 ± 2.9
Current HbA1c (years old)<67.6 ± 2.1
Duration (years old)7.1 ± 7
Diabetic typeType I and 2
Table 5. Percentage error of 10 parameters between stimulated eye (right eye) and non-stimulated eye (left eye) in two participants.
ParametersHealthy Participant 1Healthy Participant 2
RightLeftPE (%)RightLeftPE (%)
τp1 *0.190.2005.2630.2300.2456.522
τp2 *0.4750.5005.2630.5950.6305.882
τs1 *0.3600.3754.1670.3950.4206.329
τs21.2151.210−0.4121.1951.1950.000
fp011.40011.300−0.87710.80010.700−0.926
fs0 *5.0005.3006.0006.6007.1007.576
fs11.5001.5000.0001.5001.5000.000
kd11.5001.5000.0001.5001.5000.000
kd21.8001.8000.0001.8001.8000.000
l02.5342.6815.7732.7062.7842.89
* indicates that percentage error (PE) is larger than 2%.
Table 6. Model parameters of measured pupillary response in different stimulus durations.
ParameterWRGBMeanStdCv
τp10.2240.2010.1970.1900.2030.0150.0725
τp20.7160.7870.7950.8070.7760.0410.0528
τs10.4160.4180.4280.4230.4210.0050.0128
τs21.3751.4201.3581.4031.3890.0280.0200
fp010.03610.56410.67110.70710.4950.3120.0297
fs07.5367.8767.8317.5987.710.1680.0218
fs11.3191.2241.2811.2261.2630.0460.0364
kd11.2771.2921.2601.2241.2630.0290.0232
kd21.6571.6351.6901.6641.6620.0230.0136
l03.0983.0703.0382.9913.0490.0460.0151
Table 7. Statistical results of the parameters between participants with and without diabetes mellitus.
ParametersHealthy Participants
(336 Samples)
Participants with DM
(336 Samples)
p-Value
MeanSTDMeanSTD
τp10.2050.0350.2080.0380.2842
τp20.7790.1420.7720.140.5357
τs10.4230.0450.4390.05 1.44 × 10 5 **
τs21.3910.2281.3970.240.7035
fp010.5731.19310.5491.1890.7881
fs07.7451.5477.9911.5250.0384*
fs11.2640.3041.2790.2820.4946
kd11.2510.2571.1950.2860.0081*
kd21.6560.2171.6760.2080.2276
l03.0510.3922.7830.381 2.41 × 10 18 **
τp2-τs10.3560.1310.3330.1290.0240*
fp0-fs02.8281.212.5581.2580.0046*
τs1-τp10.2190.0530.2320.0660.0051*
τs2-τp20.6110.2310.6250.2290.4436
Imp12.3330.7232.4810.8440.0150*
Imp20.9640.4810.790.401 4.55 × 10 7 **
Imp30.7490.2660.7660.2470.3904
l0′ * kd13.7990.8463.3050.835 8.69 × 10 14 **
τp10.2050.0350.2080.0380.2842
* indicates that p < 0.05 and ** indicates that p < 0.001.
Publisher’s Note: MDPI stays neutral with regard to jurisdictional claims in published maps and institutional affiliations.

