
Impaired Audiovisual Representation of Phonemes in Children with Developmental Language Disorder


Abstract
1. Introduction
2. Materials and Methods
2.1. Participants
2.2. Screening Measures
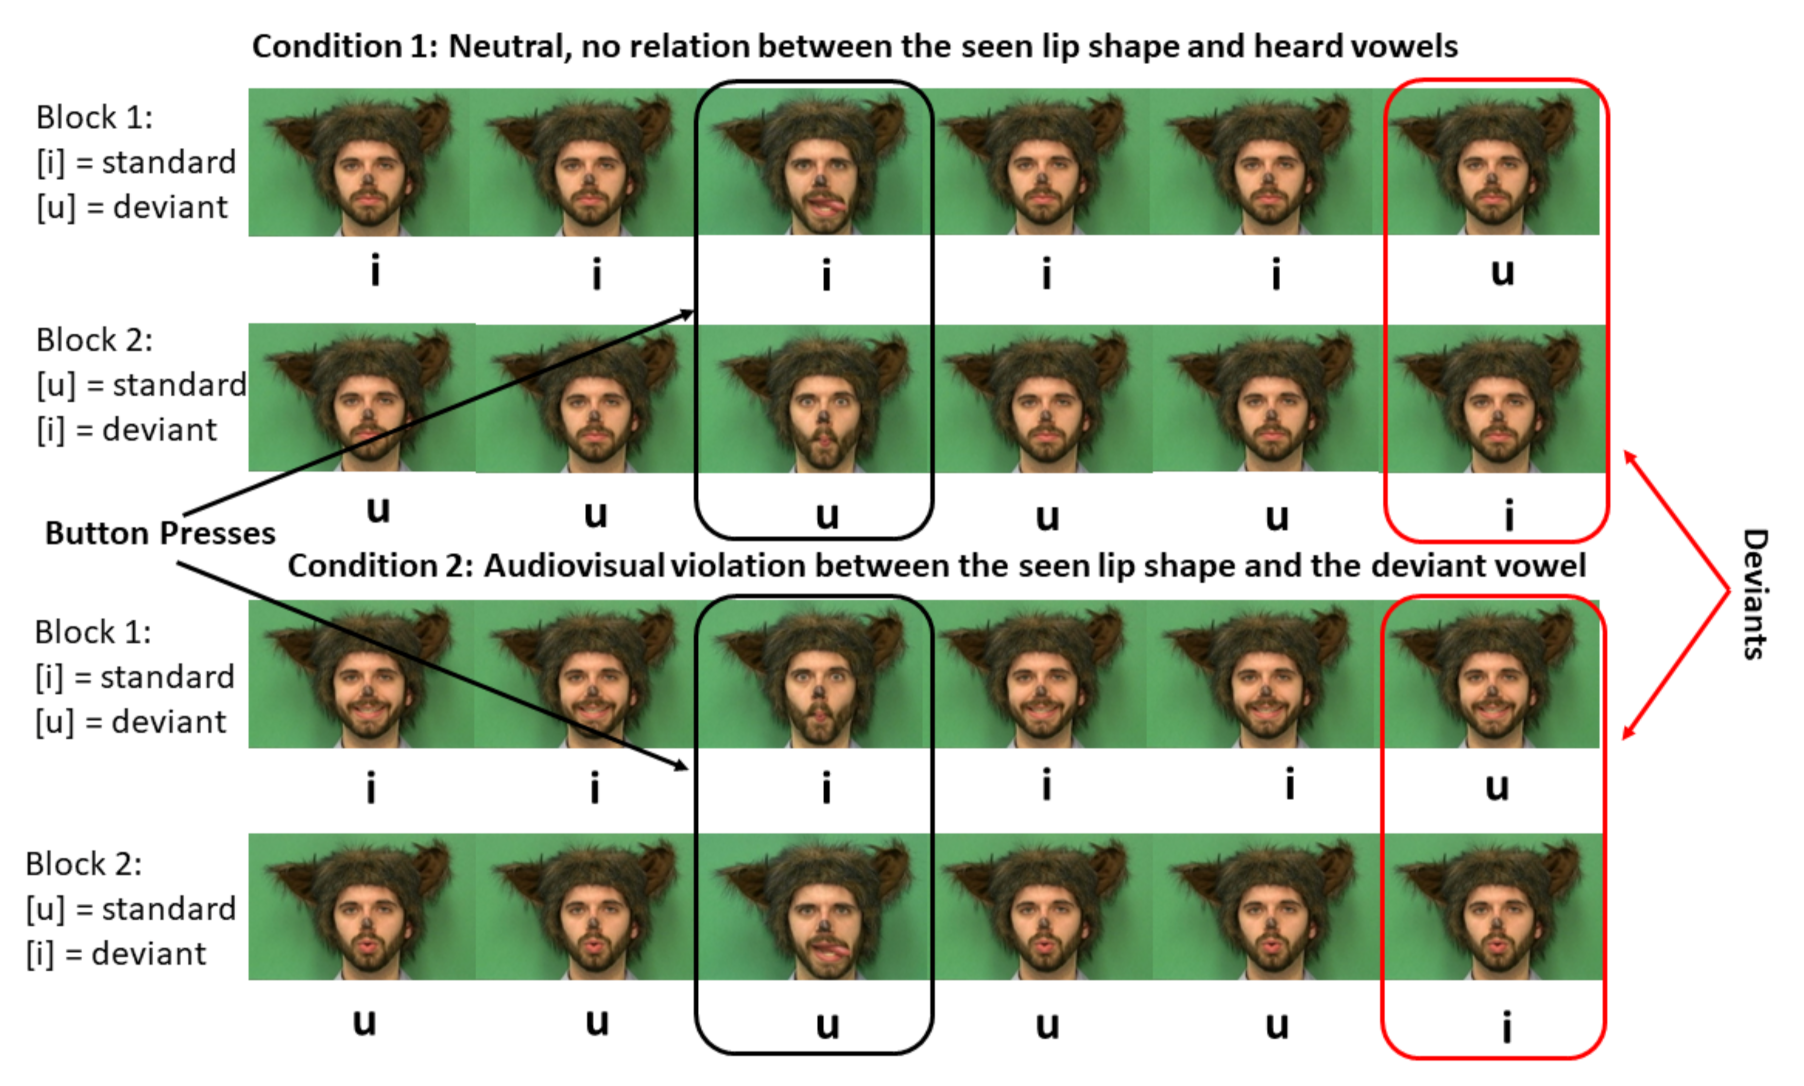
2.3. Design
2.4. ERP Measures
2.5. Statistical Analysis
3. Results
3.1. Screening Measures
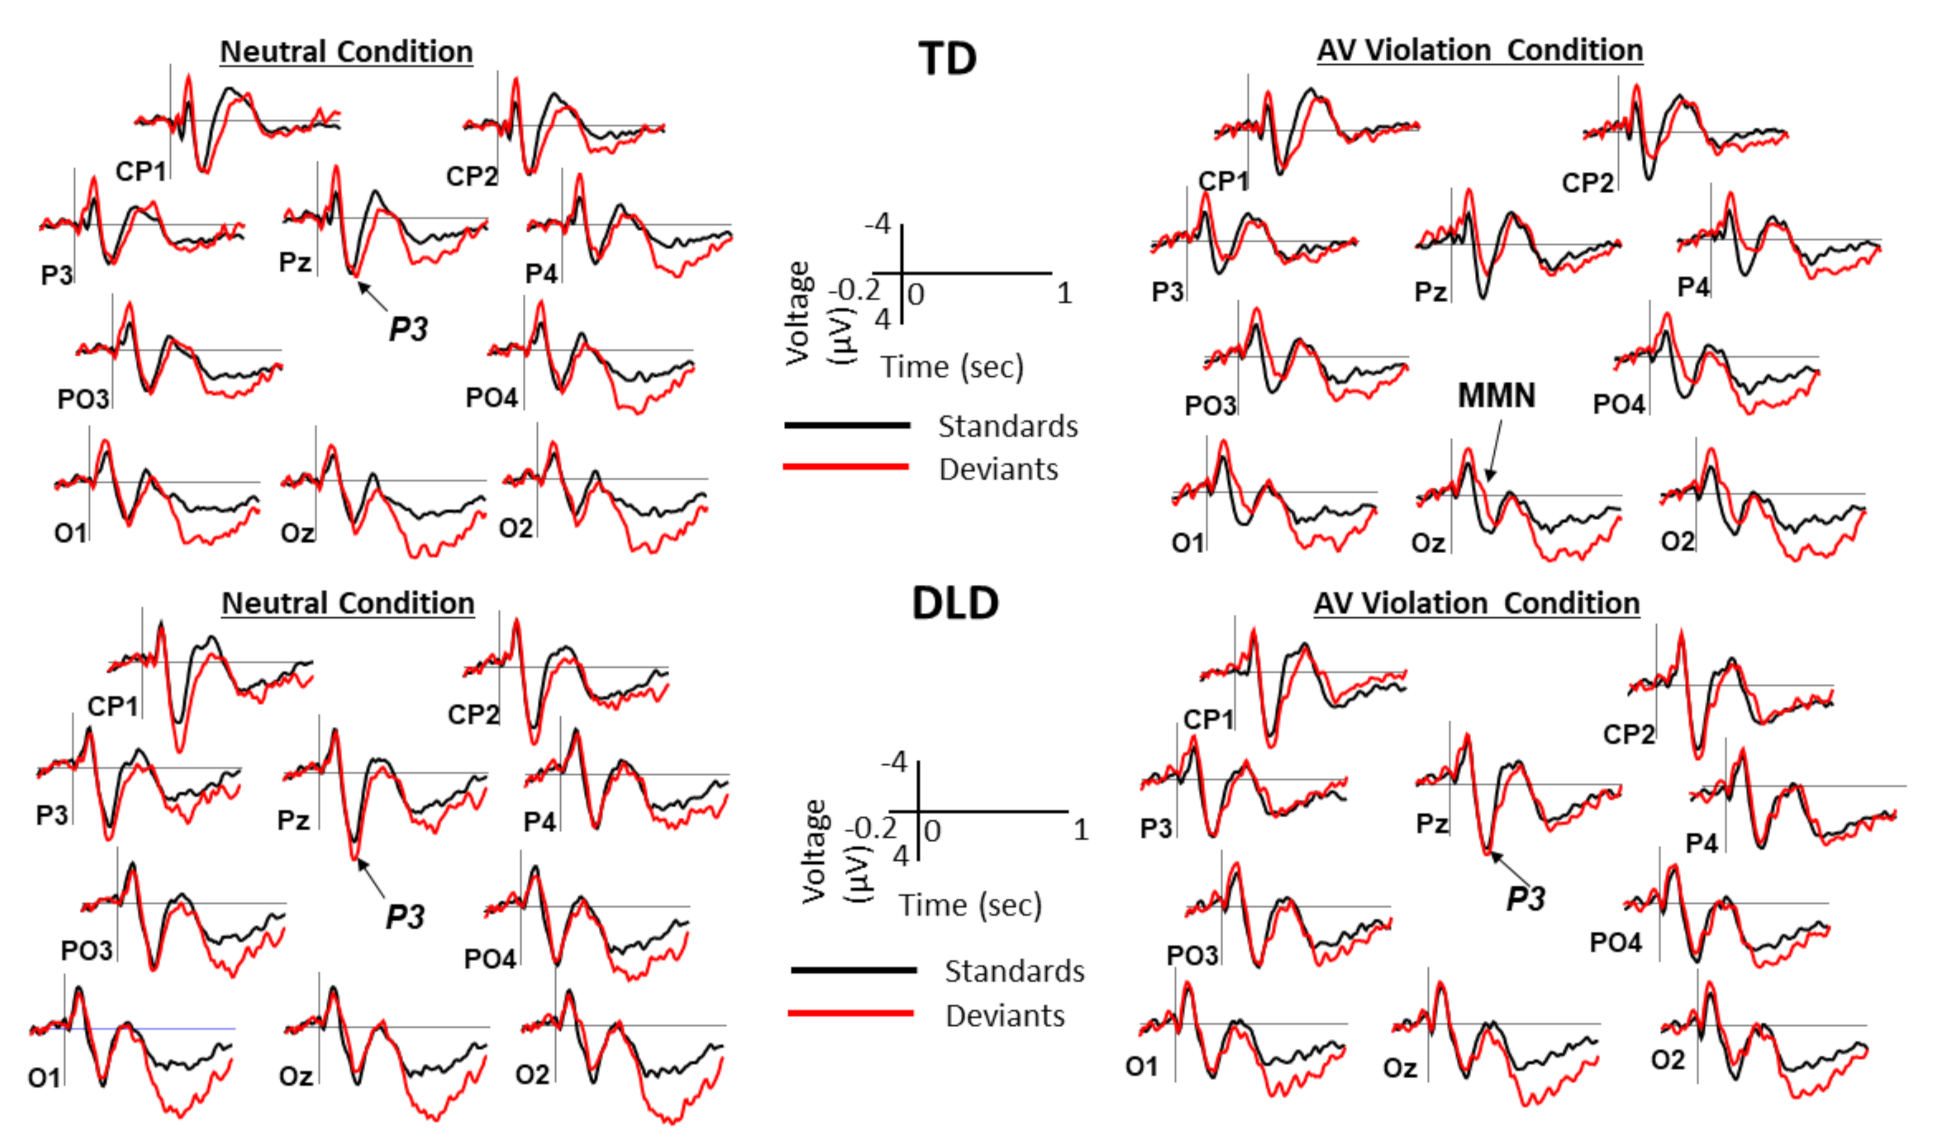
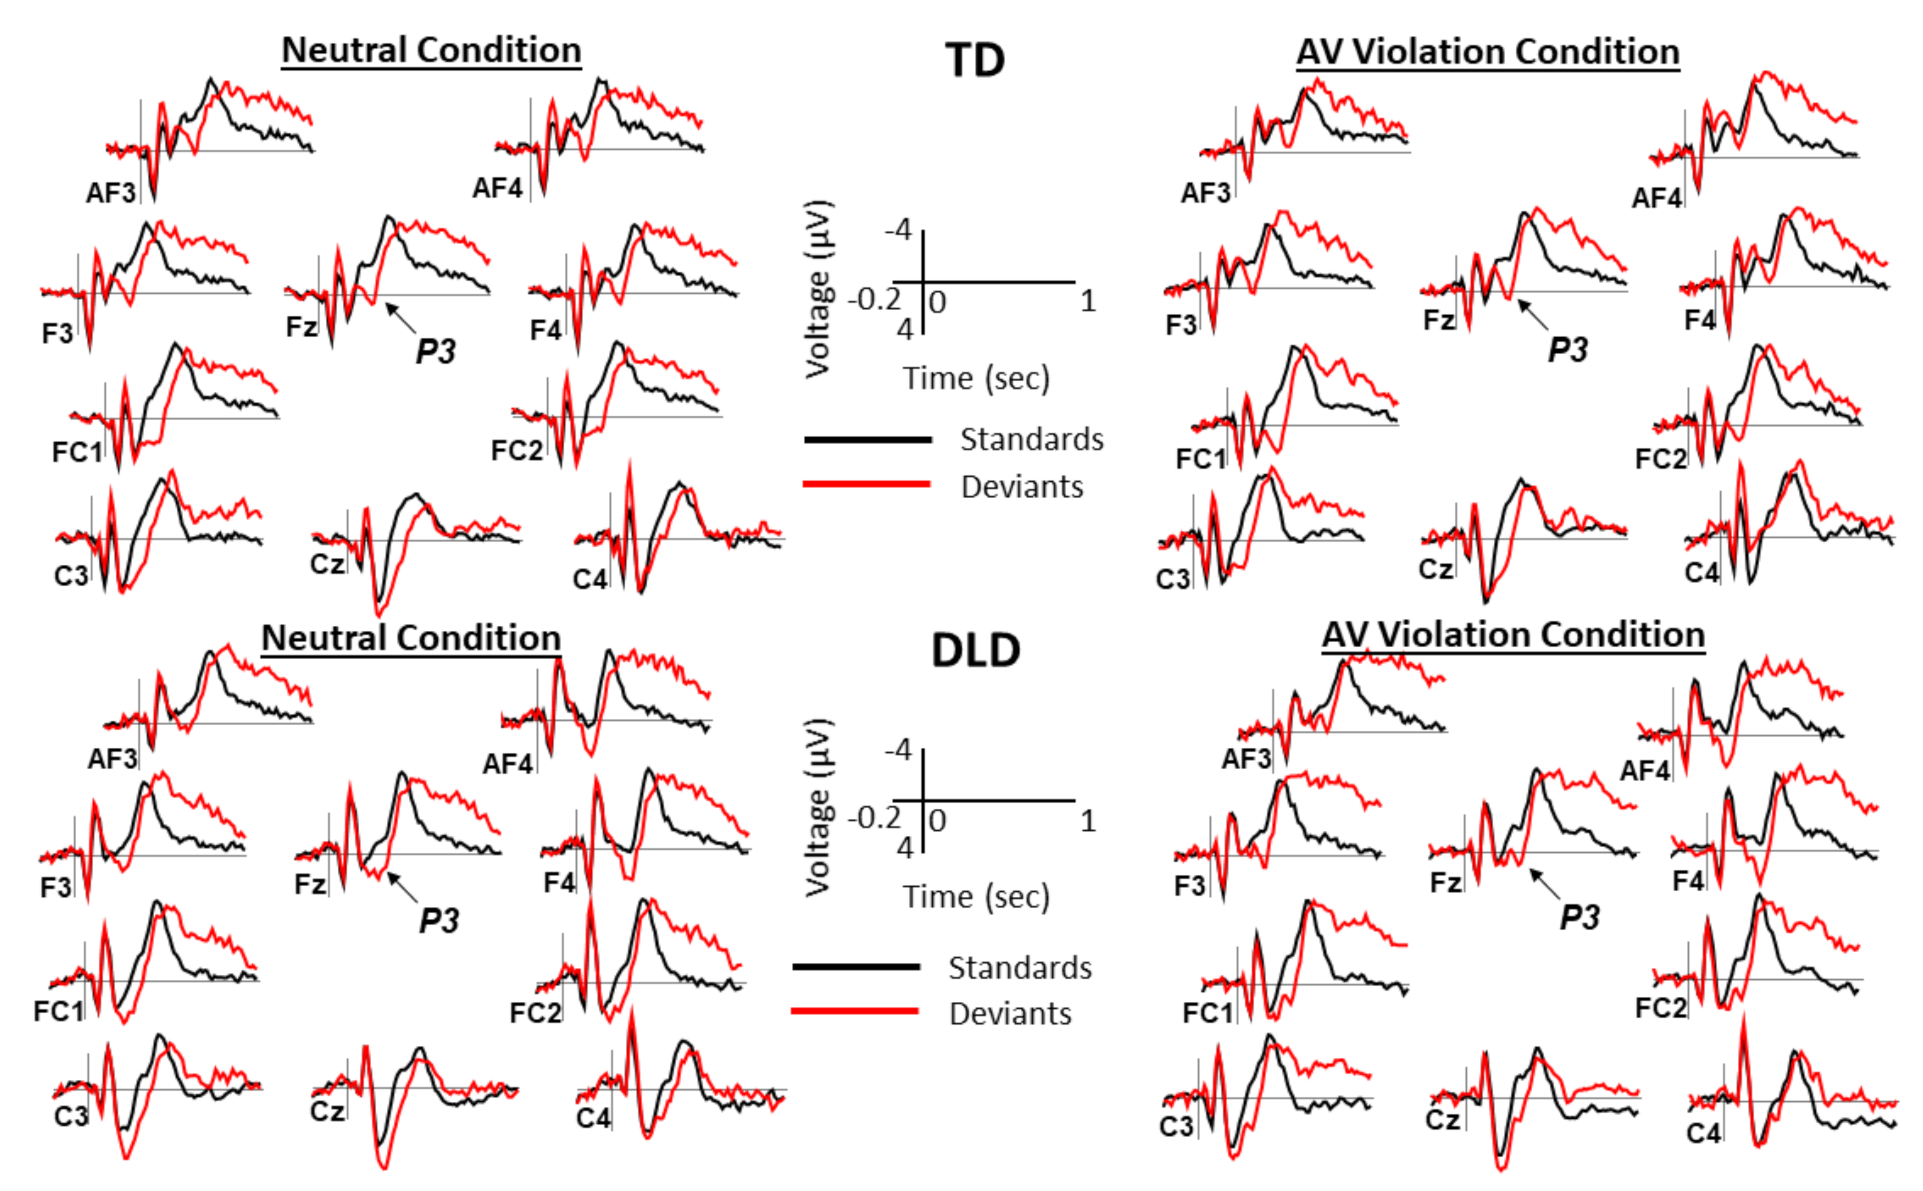
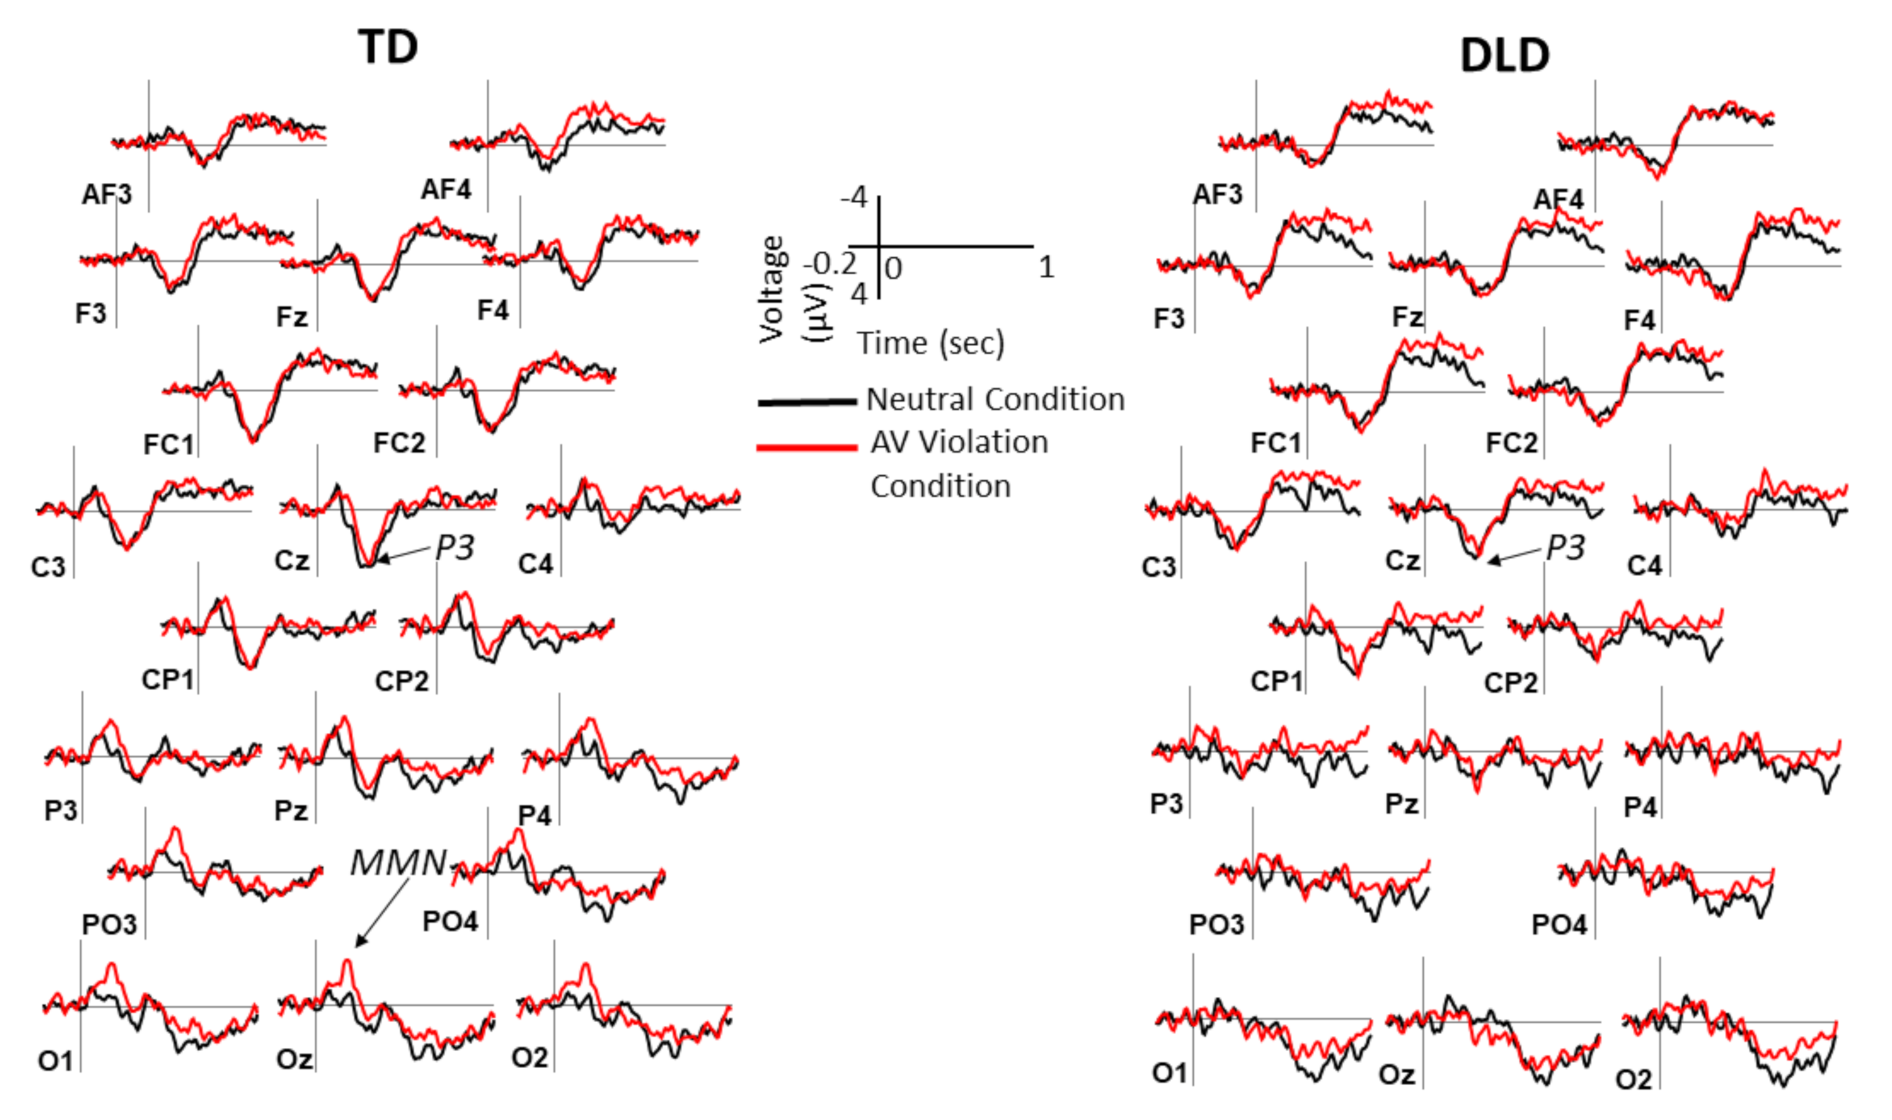
3.2. Behavioral and ERP Results
3.3. Regressions
4. Discussion
5. Limitations and Future Directions
Supplementary Materials
Author Contributions
Funding
Institutional Review Board Statement
Informed Consent Statement
Data Availability Statement
Acknowledgments
Conflicts of Interest
References
- Patterson, M.L.; Werker, J.F. Two-month-old infants match phonetic information in lips and voice. Dev. Sci. 2003, 6, 191–196. [Google Scholar] [CrossRef]
- Weikum, W.M.; Vouloumanos, A.; Navarra, J.; Soto-Faraco, S.; Sebastián-Gallés, N.; Werker, J.F. Visual language discrimination in infancy. Science 2007, 316, 1159. [Google Scholar] [CrossRef]
- Kaganovich, N. Development of sensitivity to audiovisual temporal asynchrony during mid-childhood. Dev. Psychol. 2016, 52, 232–241. [Google Scholar] [CrossRef] [PubMed]
- Ross, L.A.; Molholm, S.; Blanco, D.; Gomez-Ramirez, M.; Saint-Amour, D.; Foxe, J.J. The development of multisensory speech perception continues into the late childhood years. Eur. J. Neurosci. 2011, 33, 2329–2337. [Google Scholar] [CrossRef] [PubMed]
- Giedd, J.N.; Blumenthal, J.; Jeffries, N.O.; Castellanos, F.X.; Liu, H.; Zijdenbos, A.; Paus, T.; Evans, A.C.; Rapoport, J.L. Brain development during childhood and adolescence: A longitudinal MRI study. Nat. Neurosci. 1999, 2, 861–863. [Google Scholar] [CrossRef] [PubMed]
- Gogtay, N.; Giedd, J.N.; Lusk, L.; Hayashi, K.M.; Greenstein, D.; Vaituzis, A.C.; Nugent, T.F., III; Herman, D.H.; Clasen, L.S.; Toga, A.W.; et al. Dynamic mapping of human cortical development during childhood through early adulthood. Proc. Natl. Acad. Sci. USA 2004, 101, 8174–8179. [Google Scholar] [CrossRef] [PubMed]
- Cascio, C.J.; Simon, D.M.; Bryant, L.K.; DiCarlo, G.; Wallace, M.T. Neurodevelopmental and neuropsychiatric disorders affecting multisensory processes. In Multisensory Perception: From Laboratory to Clinic; Sathian, K., Ramachandran, V.S., Eds.; Academic Press: Cambridge, MA, USA, 2020. [Google Scholar]
- Stevenson, R.A.; Siemann, J.K.; Schneider, B.C.; Eberly, H.E.; Woynaroski, T.G.; Camarata, S.M.; Wallace, M.T. Multisensory temporal integration in autism spectrum disorders. J. Neurosci. 2014, 34, 691–697. [Google Scholar] [CrossRef]
- Foxe, J.J.; Molholm, S.; Del Bene, V.A.; Frey, H.-P.; Russo, N.N.; Blanco, D.; Saint-Amour, D.; Ross, L.A. Severe multisensory speech integration deficits in high-functioning school-aged children with Autism Spectrum Disorder (ASD) and their resolution during adolescence. Cereb. Cortex 2013, 25, 298–312. [Google Scholar] [CrossRef] [PubMed]
- Woynaroski, T.G.; Kwakye, L.D.; Foss-Feig, J.H.; Stevenson, R.A.; Stone, W.L.; Wallace, M.T. Multisensory speech perception in children with autism spectrum disorders. J. Autism Dev. Disord. 2013, 43, 2891–2902. [Google Scholar] [CrossRef]
- Froyen, D.; Willems, G.; Blomert, L. Evidence for a specific cross-modal association deficit in dyslexia: An electrophysiological study of letter–speech sound processing. Dev. Sci. 2011, 14, 635–648. [Google Scholar] [CrossRef]
- Hairston, W.D.; Burdette, J.H.; Flowers, D.L.; Wood, F.B.; Wallace, M.T. Altered temporal profile of visual-auditory multisensory interactions in dyslexia. Exp. Brain Res. 2005, 166, 474–480. [Google Scholar] [CrossRef]
- Grondin, S.; Dionne, G.; Malenfant, N.; Plourde, M.; Cloutier, M.E.; Jean, C. Temporal processing skills of children with and without specific language impairment. Can. J. Speech Lang. Pathol. Audiol. 2007, 31, 38–46. [Google Scholar]
- Kaganovich, N.; Schumaker, J.; Rowland, C. Atypical audiovisual word processing in school-age children with a history of specific language impairment: An event-related potential study. J. Neurodev. Disord. 2016, 8, 1–22. [Google Scholar] [CrossRef] [PubMed]
- Stevenson, R.A.; Segers, M.; Ferber, S.; Barense, M.D.; Camarata, S.; Wallace, M.T. Keeping time in the brain: Autism spectrum disorder and audiovisual temporal processing. Autism Res. 2015, 9, 720–738. [Google Scholar] [CrossRef]
- Hahn, N.; Foxe, J.J.; Molholm, S. Impairments of multisensory integration and cross-sensory learning as pathways to dyslexia. Neurosci. Biobehav. Rev. 2014, 47, 384–392. [Google Scholar] [CrossRef] [PubMed]
- Leonard, L. Children with Specific Language Impairment, 2nd ed.; The MIT Press: Cambridge, MA, USA, 2014. [Google Scholar]
- Bishop, D.V.M.; Snowling, M.J.; Thompson, P.A.; Greenhalgh, T.; CATALISE consortium. CATALISE: A Multinational and Multidisciplinary Delphi Consensus Study. Identifying Language Impairments in Children. PLoS ONE 2016, 11, e0158753. [Google Scholar] [CrossRef] [PubMed]
- Tomblin, J.B.; Records, N.L.; Buckwalter, P.; Zhang, X.; Smith, E.; O’Brien, M. Prevalence of Specific Language Impairment in Kindergarten Children. J. Speech Lang. Heart Res. 1997, 40, 1245–1260. [Google Scholar] [CrossRef]
- Center for Disease Control and Prevention. CDC Estimates 1 in 68 Children Has Been Identified with Autism Spectrum Disorder; Department of Health and Human Services: Washington, DC, USA, 2014. Available online: https://www.cdc.gov/media/releases/2014/p0327-autism-spectrum-disorder.html (accessed on 15 April 2021).
- Yairi, E.; Ambrose, N. Stuttering: Recent Developments and Future Directions. ASHA Lead. 2004, 9, 4–15. [Google Scholar] [CrossRef]
- Nippold, M.A.; Schwarz, I.E. Do children recover from specific language impairment? Adv. Speech Lang. Pathol. 2002, 4, 41–49. [Google Scholar] [CrossRef]
- Records, N.L.; Tomblin, J.B.; Freese, P. The quality of life of young adults with histories of specific language impairment. Am. J. Speech Lang. Pathol. 1992, 1, 44–53. [Google Scholar] [CrossRef]
- Wadman, R.; Durkin, K.; Conti-Ramsden, G. Social stress in young people with specific language impairment. J. Adolesc. 2011, 34, 421–431. [Google Scholar] [CrossRef] [PubMed]
- Boliek, C.; Keintz, C.; Norrix, L.; Obrzut, J. Auditory-visual perception of speech in children with learning disabilities: The McGurk effect. Can. J. Speech Lang. Pathol. Audiol. 2010, 34, 124–131. [Google Scholar]
- Hayes, E.A.; Tiippana, K.; Nicol, T.G.; Sams, M.; Kraus, N. Integration of heard and seen speech: A factor in learning disabilities in children. Neurosci. Lett. 2003, 351, 46–50. [Google Scholar] [CrossRef]
- Meronen, A.; Tiippana, K.; Westerholm, J.; Ahonen, T. Audiovisual Speech Perception in Children With Developmental Language Disorder in Degraded Listening Conditions. J. Speech Lang. Heart Res. 2013, 56, 211–221. [Google Scholar] [CrossRef]
- Norrix, L.W.; Plante, E.; Vance, R.; Boliek, C.A. Auditory-Visual Integration for Speech by Children With and Without Specific Language Impairment. J. Speech Lang. Heart Res. 2007, 50, 1639–1651. [Google Scholar] [CrossRef]
- Hickok, G.; Rogalsky, C.; Matchin, W.; Basilakos, A.; Cai, J.; Pillay, S.; Ferrill, M.; Mickelsen, S.; Anderson, S.W.; Love, T.; et al. Neural networks supporting audiovisual integration for speech: A large-scale lesion study. Cortex 2018, 103, 360–371. [Google Scholar] [CrossRef]
- Van Engen, K.J.; Xie, Z.; Chandrasekaran, B. Audiovisual sentence recognition not predicted by susceptibility to the McGurk effect. Atten. Percept. Psychophys. 2017, 79, 396–403. [Google Scholar] [CrossRef]
- Erickson, L.C.; Zielinski, B.A.; Zielinski, J.E.V.; Liu, G.; Turkeltaub, P.E.; Leaver, A.M.; Rauschecker, J.P. Distinct cortical locations for integration of audiovisual speech and the McGurk effect. Front. Psychol. 2014, 5, 534. [Google Scholar] [CrossRef]
- Jackson, E.; Leitao, S.; Claessen, M. The relationship between phonological short-term memory, receptive vocabulary, and fast mapping in children with specific language impairment. Int. J. Lang. Commun. Disord. 2016, 51, 61–73. [Google Scholar] [CrossRef] [PubMed]
- Leonard, L.; McGregor, K.K.; Allen, G.D. Grammatical morphology and speech perception in children with specific language impairment. J. Speech Heart Res. 1992, 35, 1076–1085. [Google Scholar] [CrossRef] [PubMed]
- Wang, J.; Joanisse, M.F.; Booth, J.R. Neural representations of phonology in temporal cortex scaffold longitudinal reading gains in 5- to 7-year-old children. NeuroImage 2020, 207. [Google Scholar] [CrossRef]
- Suárez-Pellicioni, M.; Fuchs, L.; Booth, J.R. Temporo-frontal activation during phonological processing predicts gains in arithmetic facts in young children. Dev. Cogn. Neurosci. 2019, 40, 100735. [Google Scholar] [CrossRef]
- Jerger, S.; Damian, M.F.; Spence, M.J.; Tye-Murray, N.; Abdi, H. Developmental shifts in children’s sensitivity to visual speech: A new multimodal picture–word task. J. Exp. Child Psychol. 2009, 102, 40–59. [Google Scholar] [CrossRef] [PubMed]
- Jerger, S.; Damian, M.F.; Tye-Murray, N.; Abdi, H. Children use visual speech to compensate for non-intact auditory speech. J. Exp. Child Psychol. 2014, 126, 295–312. [Google Scholar] [CrossRef]
- Jerger, S.; Damian, M.F.; Tye-Murray, N.; Abdi, H. Children perceive speech onsets by ear and eye. J. Child Lang. 2016, 44, 185–215. [Google Scholar] [CrossRef] [PubMed]
- Jerger, S.; Damian, M.F.; McAlpine, R.P.; Abdi, H. Visual speech fills in both discrimination and identification of non-intact auditory speech in children. J. Child Lang. 2018, 45, 392–414. [Google Scholar] [CrossRef] [PubMed]
- Fort, M.; Kandel, S.; Chipot, J.; Savariaux, C.; Granjon, L.; Spinelli, E. Seeing the initial articulatory gestures of a word triggers lexical access. Lang. Cogn. Process. 2013, 28, 1207–1223. [Google Scholar] [CrossRef]
- Fort, M.; Spinelli, E.; Savariaux, C.; Kandel, S. The word superiority effect in audiovisual speech perception. Speech Commun. 2010, 52, 525–532. [Google Scholar] [CrossRef]
- Fort, M.; Spinelli, E.; Savariaux, C.; Kandel, S. Audiovisual vowel monitoring and the word superiority effect in children. Int. J. Behav. Dev. 2012, 36, 457–467. [Google Scholar] [CrossRef]
- Näätänen, R. The Perception of speech sounds by the human brain as reflected by the mismatch negativity (MMN) and its magnetic equivalent (MMNm). Psychophysiology 2001, 38, 1–21. [Google Scholar] [CrossRef]
- Näätänen, R.; Kujala, T.; Winkler, I. Auditory processing that leads to conscious perception: A unique window to central auditory processing opened by the mismatch negativity and related responses. Psychophysiology 2010, 48, 4–22. [Google Scholar] [CrossRef]
- Näätänen, R.; Simpson, M.; Loveless, N. Stimulus deviance and evoked potentials. Biol. Psychol. 1982, 14, 53–98. [Google Scholar] [CrossRef]
- Näätänen, R.; Sussman, E.S.; Salisbury, D.; Shafer, V.L. Mismatch Negativity (MMN) as an Index of Cognitive Dysfunction. Brain Topogr. 2014, 27, 451–466. [Google Scholar] [CrossRef]
- Deheane-Lambertz, G. Electrophysiological correlates of categorical phoneme perception in adults. NeuroReport 1997, 3, 919–924. [Google Scholar] [CrossRef]
- Dehaene-Lambertz, G.; Baillet, S. A phonological representation in the infant brain. NeuroReport 1998, 9, 1885–1888. [Google Scholar] [CrossRef]
- Sharma, A.; Dorman, M.F. Neurophysiologic correlates of cross-language phonetic perception. J. Acoust. Soc. Am. 2000, 107, 2697–2703. [Google Scholar] [CrossRef]
- Kimura, M.; Schröger, E.; Czigler, I. Visual mismatch negativity and its importance in visual cognitive sciences. NeuroReport 2011, 22, 669–673. [Google Scholar] [CrossRef] [PubMed]
- Kimura, M.; Schröger, E.; Czigler, I.; Ohira, H. Human Visual System Automatically Encodes Sequential Regularities of Discrete Events. J. Cogn. Neurosci. 2010, 22, 1124–1139. [Google Scholar] [CrossRef] [PubMed]
- Kimura, M.; Katayama, J.; Ohira, H.; Schröger, E. Visual mismatch negativity: New evidence from the equiprobable paradigm. Psychophysiology 2009, 46, 402–409. [Google Scholar] [CrossRef] [PubMed]
- Kimura, M.; Katayama, J.; Murohashi, H. Probability-independent and -dependent ERPs reflecting visual change detection. Psychophysiology 2006, 43, 180–189. [Google Scholar] [CrossRef] [PubMed]
- Tales, A.; Troscianko, T.; Wilcock, G.K.; Newton, P.; Butler, S.R. Age-related changes in the preattentional detection of visual change. NeuroReport 2002, 13, 969–972. [Google Scholar] [CrossRef] [PubMed][Green Version]
- Schmitt, C.; Klingenhoefer, S.; Bremmer, F. Preattentive and Predictive Processing of Visual Motion. Sci. Rep. 2018, 8, 12399. [Google Scholar] [CrossRef] [PubMed]
- Winkler, I.; Czigler, I.; Sussman, E.; Horváth, J.; Balázs, L. Preattentive Binding of Auditory and Visual Stimulus Features. J. Cogn. Neurosci. 2005, 17, 320–339. [Google Scholar] [CrossRef] [PubMed]
- Müller, D.; Winkler, I.; Roeber, U.; Schaffer, S.; Czigler, I.; Schröger, E. Visual Object Representations Can Be Formed outside the Focus of Voluntary Attention: Evidence from Event-related Brain Potentials. J. Cogn. Neurosci. 2010, 22, 1179–1188. [Google Scholar] [CrossRef] [PubMed]
- Czigler, I. Visual Mismatch Negativity and Categorization. Brain Topogr. 2013, 27, 590–598. [Google Scholar] [CrossRef] [PubMed]
- Besle, J.; Caclin, A.; Mayet, R.; Delpuech, C.; Lecaignard, F.; Giard, M.-H.; Morlet, D. Audiovisual Events in Sensory Memory. J. Psychophysiol. 2007, 21, 231–238. [Google Scholar] [CrossRef]
- Besle, J.; Hussain, Z.; Giard, M.-H.; Bertrand, O. The Representation of Audiovisual Regularities in the Human Brain. J. Cogn. Neurosci. 2013, 25, 365–373. [Google Scholar] [CrossRef]
- WMA. Declaration of Helsinki-Ethical Principles for Medical Research Involving Human Subjects; W.M. Association: Helsinki, Finland, 1964. [Google Scholar]
- American Electroencephalographic Society. Guideline thirteen: Guidelines for standard electrode placement nomenclature. J. Clin. Neurophysiol. 1994, 11, 111–113. [Google Scholar]
- Van Rijn, A.C.M.; Peper, A.; Grimbergen, C.A. High-quality recording of bioelectric events. Med. Biol. Eng. Comput. 1990, 28, 389–397. [Google Scholar] [CrossRef]
- BioSemi. Active Electrodes. 2013. Available online: http://www.biosemi.com/active_electrode.htm. (accessed on 15 April 2021).
- MettingVanRijn, A.C.; Kuiper, A.P.; Dankers, T.E.; Grimbergen, C.A. Low-cost active electrode improves the resolution in biopotential recordings. In Proceedings of the 18th Annual International Conference of the IEEE Engineering in Medicine and Biology Society, Amsterdam, The Netherlands, 31 October–3 November 1996. [Google Scholar]
- Pflieger, M.E. Theory of a Spatial Filter for Removing Ocular Artifacts with Preservation of EEG. Paper presented at the EMSE Workshop; Princeton University. Available online: http://www.sourcesignal.com/SpFilt_Ocular_Artifact.pdf. (accessed on 15 April 2021).
- Gelman, A.; Hill, J.; Yajima, M. Why We (Usually) Don’t Have to Worry About Multiple Comparisons. J. Res. Educ. Eff. 2012, 5, 189–211. [Google Scholar] [CrossRef]
- Graf Estes, K.; Evans, J.L.; Else-Quest, N.M. Differences in the nonword repetition performance of children with and without specific language impairment: A meta-analysis. J. Speech Lang. Heart Res. 2007, 50, 177–195. [Google Scholar] [CrossRef]
- Tomblin, J.B.; Nippold, M.A. (Eds.) Understanding Individual Differences in Language Development Across the School Years; Language and Speech Disorders; Psychology Press: New York, NY, USA, 2014. [Google Scholar]
- Ebbels, S.H.; Dockrell, J.E.; Van Der Lely, H.K.J. Non-word repetition in adolescents with specific language impairment (SLI). Int. J. Lang. Commun. Disord. 2012, 47, 257–273. [Google Scholar] [CrossRef] [PubMed]
- Stuart, N.J.; van der Lely, H. Role of aspect in understanding tense: An investigation with adolescents with SLI. Int. J. Lang. Commun. Disord. 2015, 50, 187–201. [Google Scholar] [CrossRef] [PubMed]
- Tuomainen, O.; Stuart, N.J.; van der Lely, H.K.J. Phonetic categorisation and cue weighting in adolescents with Specific Language Impairment (SLI). Clin. Linguist. Phon. 2015, 29, 557–572. [Google Scholar] [CrossRef] [PubMed]
- Sussman, E. A new view on the MMN and attention debate: The role of context in processing auditory events. J. Psychophysiol. 2007, 23, 164–175. [Google Scholar] [CrossRef]
- Barutchu, A.; Danaher, J.; Crewther, S.G.; Innes-Brown, H.; Shivdasani, M.N.; Paolini, A.G. Audiovisual integration in noise by children and adults. J. Exp. Child Psychol. 2010, 105, 38–50. [Google Scholar] [CrossRef]
- Hollich, G.; Newman, R.S.; Jusczyk, P.W. Infants’ Use of Synchronized Visual Information to Separate Streams of Speech. Child Dev. 2005, 76, 598–613. [Google Scholar] [CrossRef]
- Knowland, V.C.P.; Evans, S.; Snell, C.; Rosen, S.; Evans, S. Visual Speech Perception in Children with Language Learning Impairments. J. Speech Lang. Heart Res. 2016, 59, 1–14. [Google Scholar] [CrossRef]
- White-Schwoch, T.; Carr, K.W.; Thompson, E.C.; Anderson, S.; Nicol, T.; Bradlow, A.R.; Zecker, S.G.; Kraus, N. Auditory Processing in Noise: A Preschool Biomarker for Literacy. PLoS Biol. 2015, 13, e1002196. [Google Scholar] [CrossRef]
- Ziegler, J.C.; Pech-Georgel, C.; George, F.; Alario, F.-X.; Lorenzi, C. Deficits in speech perception predict language learning impairment. Proc. Natl. Acad. Sci. USA 2005, 102, 14110–14115. [Google Scholar] [CrossRef]
- Thelen, A.; Matusz, P.J.; Murray, M.M. Multisensory context portends object memory. Curr. Biol. 2014, 24, R734–R735. [Google Scholar] [CrossRef][Green Version]
- Buchwald, A.B.; Winters, S.J.; Pisoni, D.B. Visual speech primes open-set recognition of spoken words. Lang. Cogn. Process. 2009, 24, 580–610. [Google Scholar] [CrossRef][Green Version]
- Tsang, T.; Atagi, N.; Johnson, S.P. Selective attention to the mouth is associated with expressive language skills in monolingual and bilingual infants. J. Exp. Child Psychol. 2018, 169, 93–109. [Google Scholar] [CrossRef]
- Young, G.S.; Merin, N.; Rogers, S.J.; Ozonoff, S. Gaze behavior and affect at 6 months: Predicting clinical outcomes and language development in typically developing infants and infants at risk for autism. Dev. Sci. 2009, 12, 798–814. [Google Scholar] [CrossRef] [PubMed]
- Tenenbaum, E.J.; Sobel, D.M.; Sheinkopf, S.J.; Malle, B.F.; Morgan, J.L. Attention to the mouth and gaze following in infancy predict language development. J. Child Lang. 2015, 42, 1173–1190. [Google Scholar] [CrossRef] [PubMed]
- Werker, J.F.; Curtin, S. PRIMIR: A developmental framework of infant speech processing. Lang. Learn. Dev. 2005, 1, 197–234. [Google Scholar] [CrossRef]
- Trauner, D.; Wulfeck, B.; Tallal, P.; Hesselink, J. Neurological and MRI profiles of children with developmental language impairment. Dev. Med. Child Neurol. 2000, 42, 470–475. [Google Scholar] [CrossRef] [PubMed]
- McMurray, B.; Samelson, V.M.; Lee, S.H.; Tomblin, J.B. Individual differences in online spoken word recognition: Implications for SLI. Cogn. Psychol. 2010, 60, 1–39. [Google Scholar] [CrossRef]


| Age (Years, Months) | TONI-4 | CARS | Mother’s Education (Years) | Father’s Education (Years) | CELF-4 | ||||||
|---|---|---|---|---|---|---|---|---|---|---|---|
| CFD | RS | FS | WS | WC2 R/E/T | CLS | ||||||
| DLD | 10; 1 (0.4) | 105.8 (1.7) | 15.6 (0.3) | 15.2 (0.8) | 13.5 (0.6) | 9.4 (0.5) | 7.7 (0.6) | 9.9 (0.4) | 9.4 (1.3) | 11.0 (0.8)/10.1 (0.7)/10.5 (0.7) | 95.8 (2.5) |
| TD | 10; 1 (0.4) | 109.0 (2.4) | 15.1 (0.1) | 15.7 (0.5) | 17.2 (0.8) | 11.8 (0.5) | 11.8 (0.5) | 12.7 (0.4) | 11.0 (0.4) | 13.6 (0.6)/12.0 (0.5)/13.0 (0.5) | 113.7 (2.2) |
| F | <1 | 1.11 | 3.39 | <1 | 13.58 | 10.23 | 26.92 | 23.39 | 2.177 | 7.26/5.72/7.65 | 28.12 |
| p | 0.96 | 0.3 | 0.08 | 0.6 | 0.001 | 0.003 | <0.001 | <0.001 | 0.3 | 0.01/0.03/0.01 | <0.001 |
| Nonword Repetition | TAPS-3 | Conners’ | |||||
|---|---|---|---|---|---|---|---|
| Syllables | Number Memory | ||||||
| 1 | 2 | 3 | 4 | Forward | Reversed | ADHD Index | |
| DLD | 99.5 (0.5) | 94.2 (2.0) | 89.6 (2.0) | 67.7 (3.6) | 7.4 (0.5) | 9 (0.4) | 55.8 (2.6) |
| TD | 100 (0.0) | 98.6 (0.7) | 98 (0.7) | 84.9 (2.4) | 10.8 (0.6) | 11.8 (0.7) | 47.9 (1.3) |
| F | 1.0 | 4.3 | 15.1 | 15.7 | 20.1 | 11.8 | 6.629 |
| p | 0.32 | 0.05 | 0.001 | <0.001 | <0.001 | 0.002 | 0.012 |
| ACC (% Correct) | RT (ms) | |||
|---|---|---|---|---|
| Neutral Face | Articulating Face | Neutral Face | Articulating Face | |
| DLD | 95.4 (1.2) | 95.2 (1.1) | 594.5 (21.2) | 613.7 (21.6) |
| TD | 97.9 (0.4) | 97.4 (0.6) | 626.5 (24.3) | 631.2 (22.1) |
| b | p-Value | 95% CI | bstd | ||
|---|---|---|---|---|---|
| DLD versus TD neutral condition | −2.49 | 0.050 | −4.98 | 0.00 | −0.64 |
| DLD versus TD AV violation condition | −2.20 | 0.083 | −4.69 | 0.29 | −0.56 |
| AV violation vs. neutral for DLD group | −0.23 | 0.606 | −1.11 | 0.65 | −0.06 |
| AV violation vs. neutral for TD group | −0.52 | 0.246 | −1.40 | 0.36 | −0.13 |
| b | p-Value | 95% CI | bstd | ||
|---|---|---|---|---|---|
| DLD versus TD neutral condition | −32.00 | 0.31 | −93.84 | 29.84 | −0.34 |
| DLD versus TD AV violation condition | −17.48 | 0.58 | −79.32 | 44.36 | −0.19 |
| AV violation vs. neutral for DLD group | 19.21 | 0.001 | 8.36 | 30.06 | 0.20 |
| AV violation vs. neutral for TD group | 4.69 | 0.397 | −6.16 | 15.54 | 0.05 |
| b | p-Value | 95% CI | bstd | ||
|---|---|---|---|---|---|
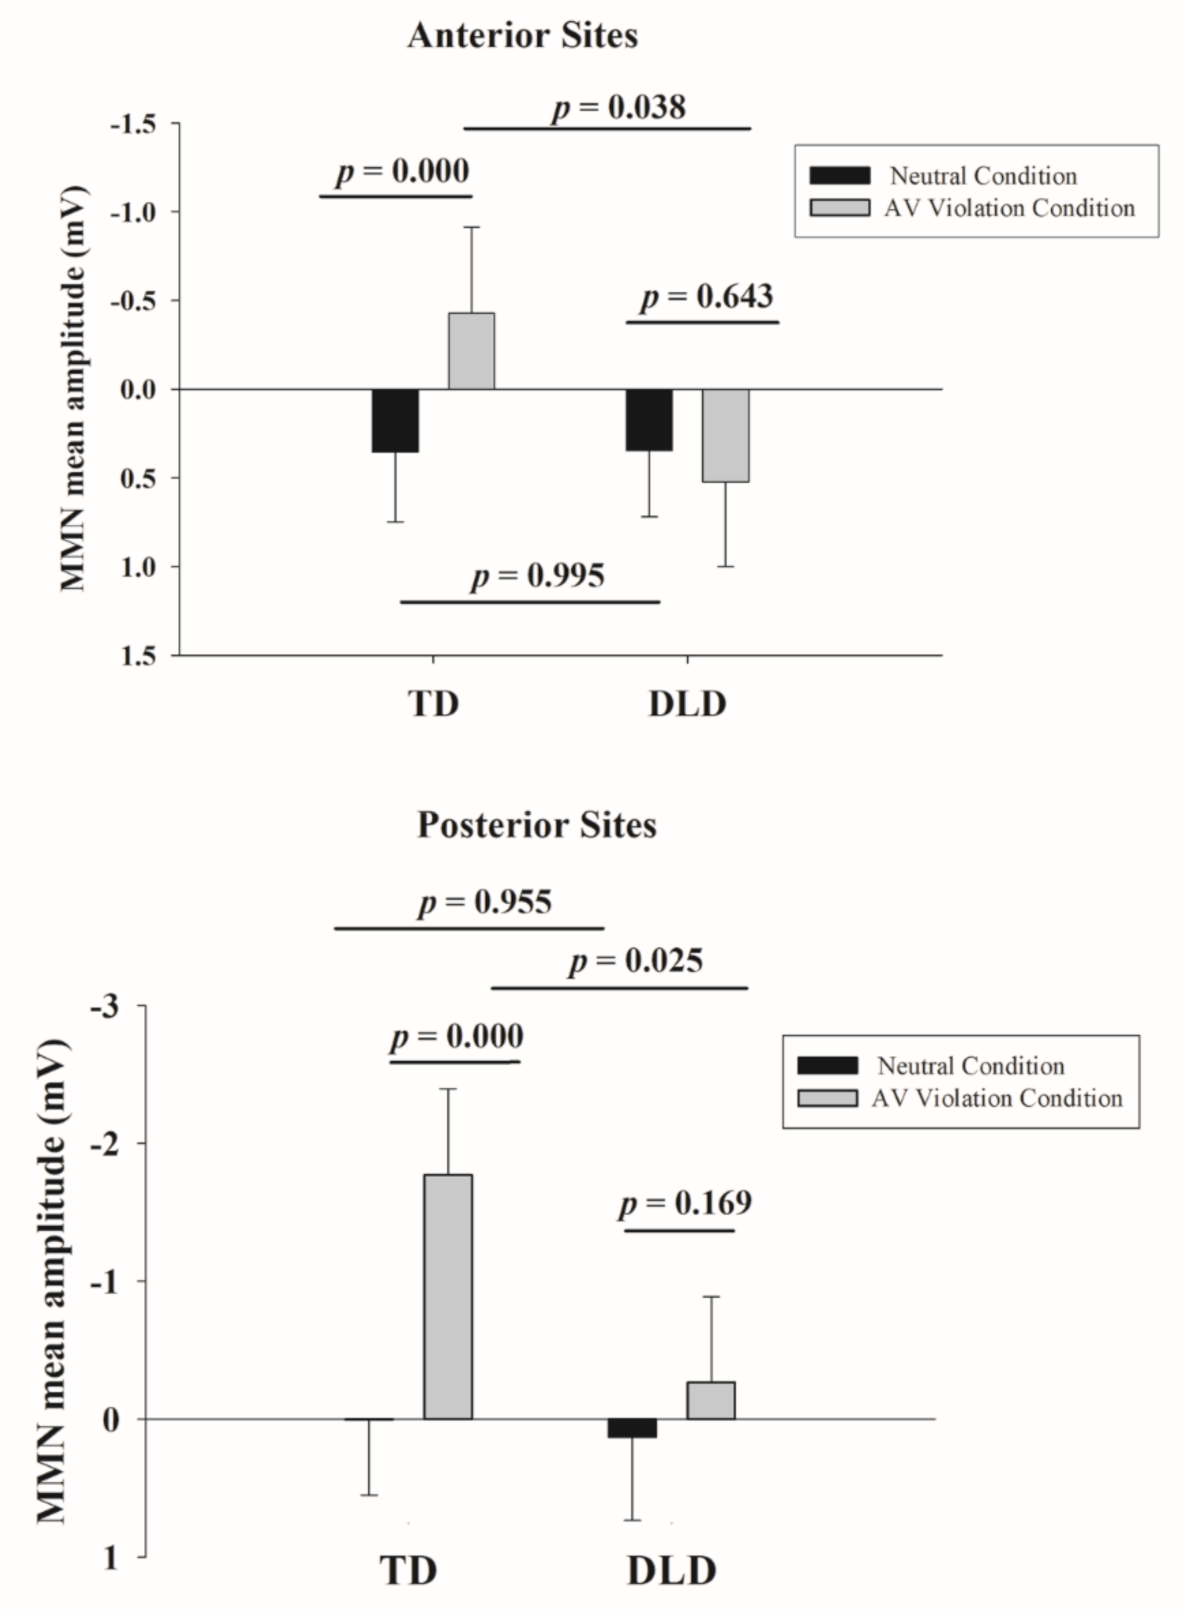
| DLD versus TD neutral condition | 0.04 | 0.955 | −1.31 | 1.38 | 0.01 |
| DLD versus TD AV violation condition | 1.53 | 0.025 | 0.19 | 2.88 | 0.52 |
| AV violation vs. neutral for DLD group | −0.30 | 0.169 | −0.73 | 0.13 | −0.10 |
| AV violation vs. neutral for TD group | −1.80 | 0.000 | −2.23 | −1.37 | −0.61 |
| b | p-Value | 95% CI | bstd | ||
|---|---|---|---|---|---|
| DLD versus TD neutral condition | 0.00 | 0.995 | −0.86 | 0.87 | 0.00 |
| DLD versus TD AV violation condition | 0.92 | 0.038 | 0.05 | 1.78 | 0.41 |
| AV violation vs. neutral for DLD group | 0.09 | 0.643 | −0.29 | 0.47 | 0.04 |
| AV violation vs. neutral for TD group | −0.82 | 0.000 | −1.20 | −0.44 | −0.37 |
Publisher’s Note: MDPI stays neutral with regard to jurisdictional claims in published maps and institutional affiliations. |
© 2021 by the authors. Licensee MDPI, Basel, Switzerland. This article is an open access article distributed under the terms and conditions of the Creative Commons Attribution (CC BY) license (https://creativecommons.org/licenses/by/4.0/).
Share and Cite
Kaganovich, N.; Schumaker, J.; Christ, S. Impaired Audiovisual Representation of Phonemes in Children with Developmental Language Disorder. Brain Sci. 2021, 11, 507. https://doi.org/10.3390/brainsci11040507
Kaganovich N, Schumaker J, Christ S. Impaired Audiovisual Representation of Phonemes in Children with Developmental Language Disorder. Brain Sciences. 2021; 11(4):507. https://doi.org/10.3390/brainsci11040507
Chicago/Turabian StyleKaganovich, Natalya, Jennifer Schumaker, and Sharon Christ. 2021. "Impaired Audiovisual Representation of Phonemes in Children with Developmental Language Disorder" Brain Sciences 11, no. 4: 507. https://doi.org/10.3390/brainsci11040507
APA StyleKaganovich, N., Schumaker, J., & Christ, S. (2021). Impaired Audiovisual Representation of Phonemes in Children with Developmental Language Disorder. Brain Sciences, 11(4), 507. https://doi.org/10.3390/brainsci11040507