Improving Emotion Perception in Children with Autism Spectrum Disorder with Computer-Based Training and Hearing Amplification


Abstract
1. Introduction
- Do social perception abilities differ between the TD and ASD groups?
- Do these differences change after the training intervention?
- Do neural responses to changes in emotional undertones in speech differ between the TD and ASD groups?
- Do neural responses change after the training intervention?
2. Materials and Methods
2.1. Ethical Approval
2.2. Participants
2.3. Study Design
2.4. Assessment Materials and Apparatus
2.4.1. Hearing Screen
2.4.2. Autism Characteristics and Communication Behaviors
2.4.3. Behavioral Social Perception
2.4.4. Cortical Auditory Evoked Potentials
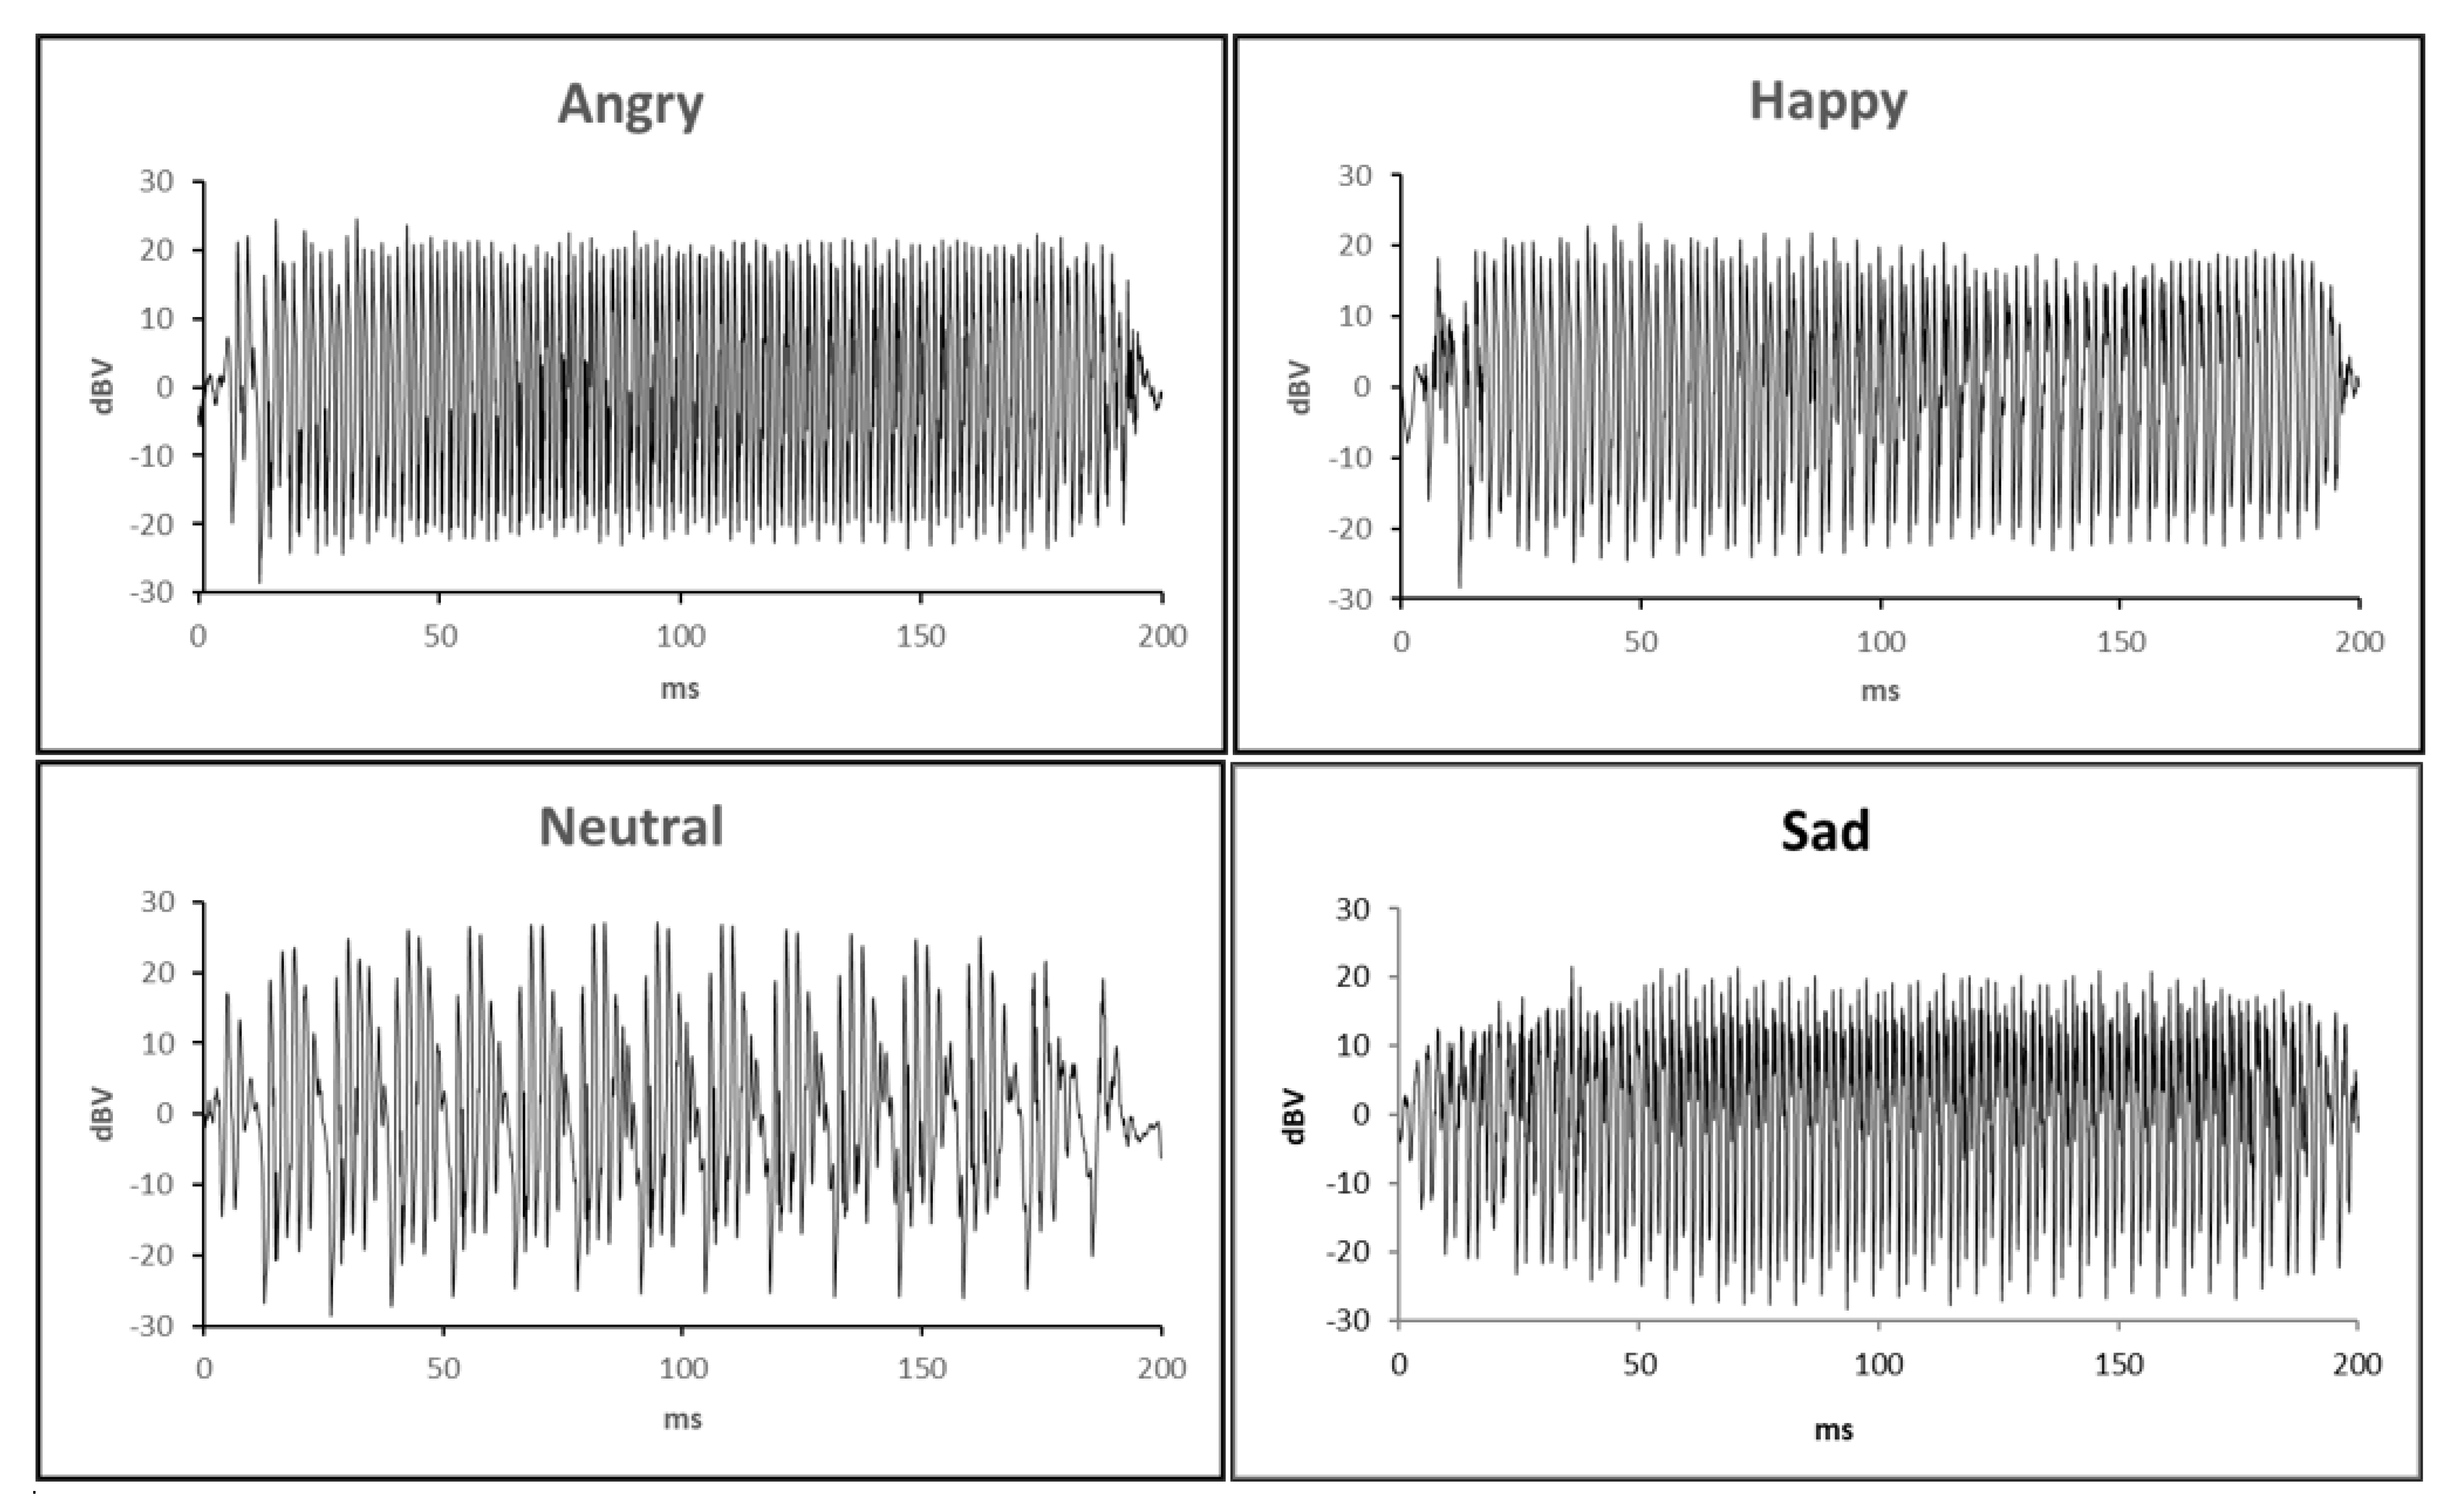
Stimuli and Sequences
Experimental Setup and Data Acquisition
Data Processing
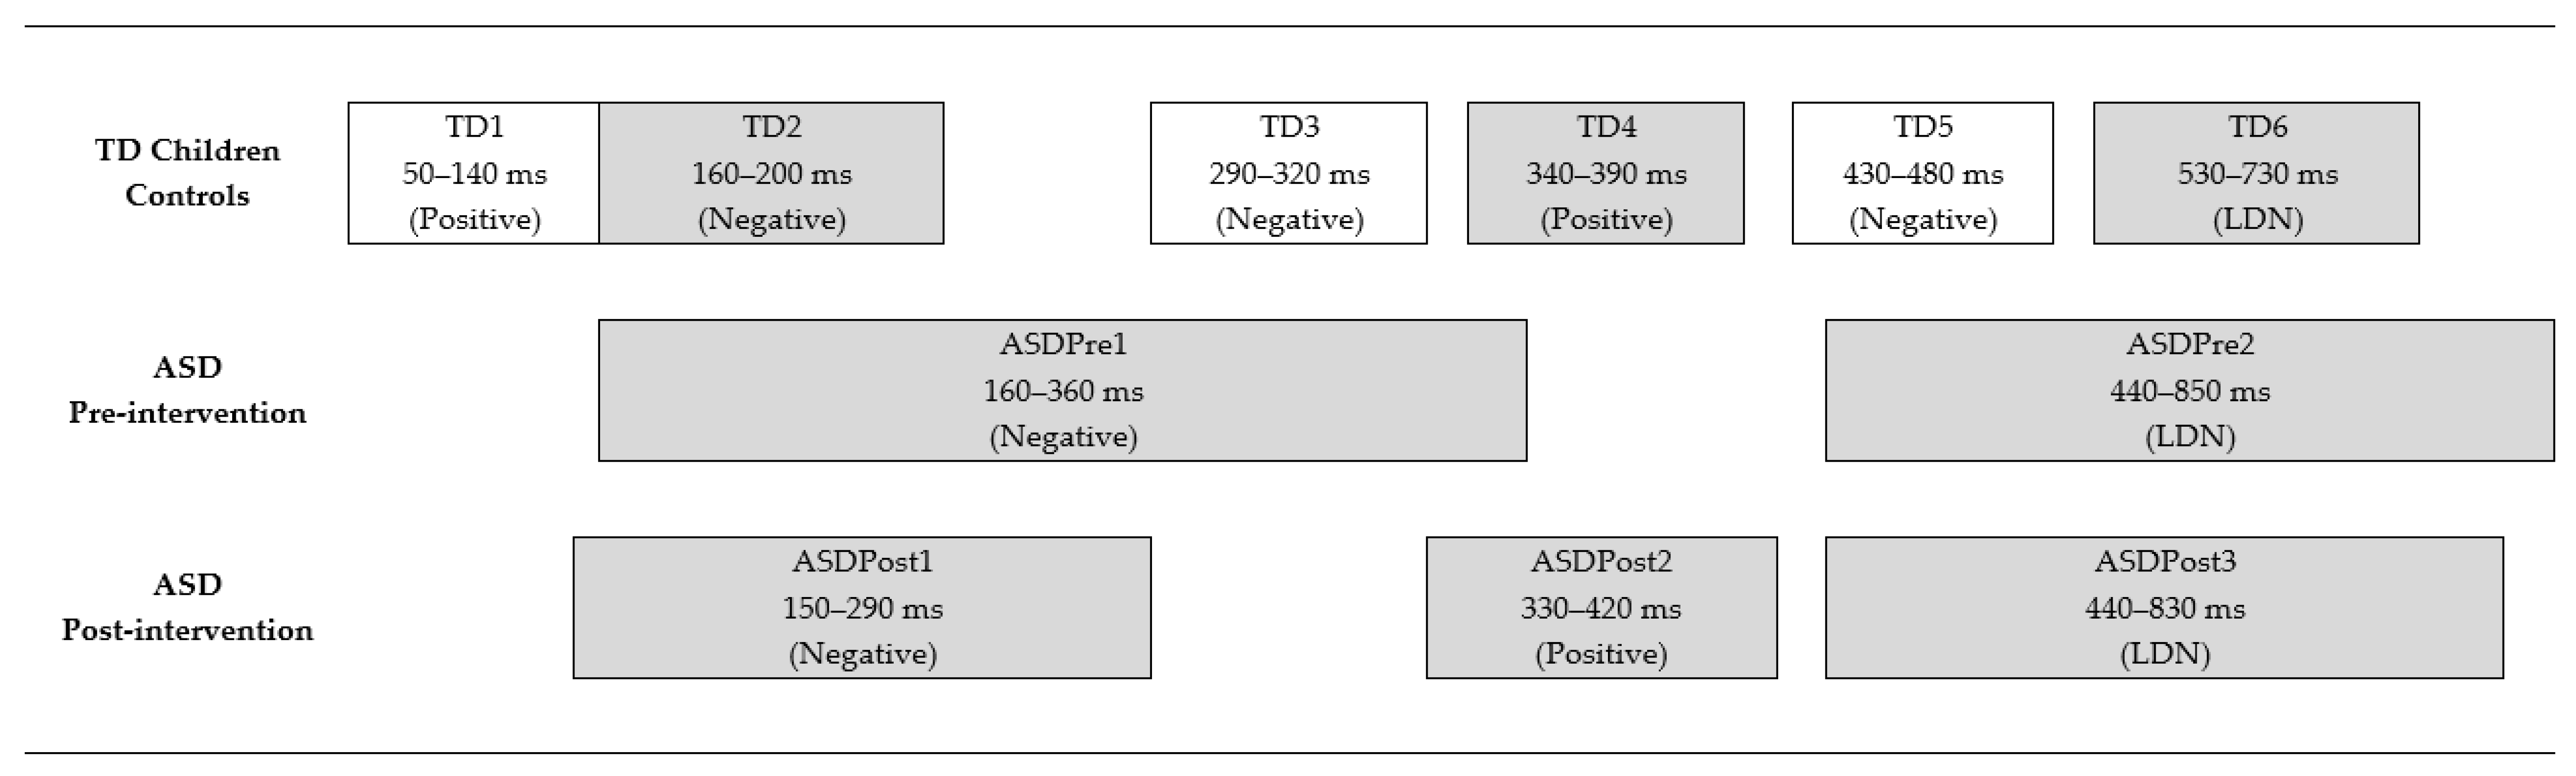
Data Analysis
- Peak latency for Combined-emotions-minus-Neutral difference waveform,
- Peak latency for Angry-minus-Neutral difference waveform,
- Peak latency for Happy-minus-Neutral difference waveform,
- Peak latency for Sad-minus-Neutral difference waveform,
- MMR magnitude for Combined-emotions-minus-Neutral difference waveform,
- MMR magnitude for Angry-minus-Neutral difference waveform,
- MMR magnitude for Happy-minus-Neutral difference waveform, and
- MMR magnitude for Sad-minus-Neutral difference waveform.
2.4.5. Statistical Analyses
- Related-samples analyses to determine whether behavioral results from the social perception assessment differed from each other at the two baseline time points, and at the two post-intervention time points.
- Independent-samples analyses to compare behavioral social perception results between the TD and ASD groups (pre- and post-intervention vs. TD).
- Related-samples analyses to explore the effects of the intervention on behavioral social perception within the ASD group.
- Repeated-measures analyses of variance (ANOVAs) were conducted on peak latencies and MMR magnitudes within each mismatch window to explore differences between each electrode site (Cz, Fz, F4, and F3).
- Independent-samples analyses to compare peak latencies and MMR magnitudes between the TD and ASD groups (pre- and post-intervention vs. TD), for Combined-emotions difference waveforms.
- Related-samples analyses to explore the effects of the intervention on peak latencies and MMR magnitudes between the ASD pre- and post-intervention waveforms, for Combined-emotions difference waveforms.
- Related-samples analyses to explore peak latencies and MMR magnitudes differences between emotions within each group of waveforms (TD, ASD pre-, and ASD post-intervention).
3. Results
3.1. Participant Characteristics
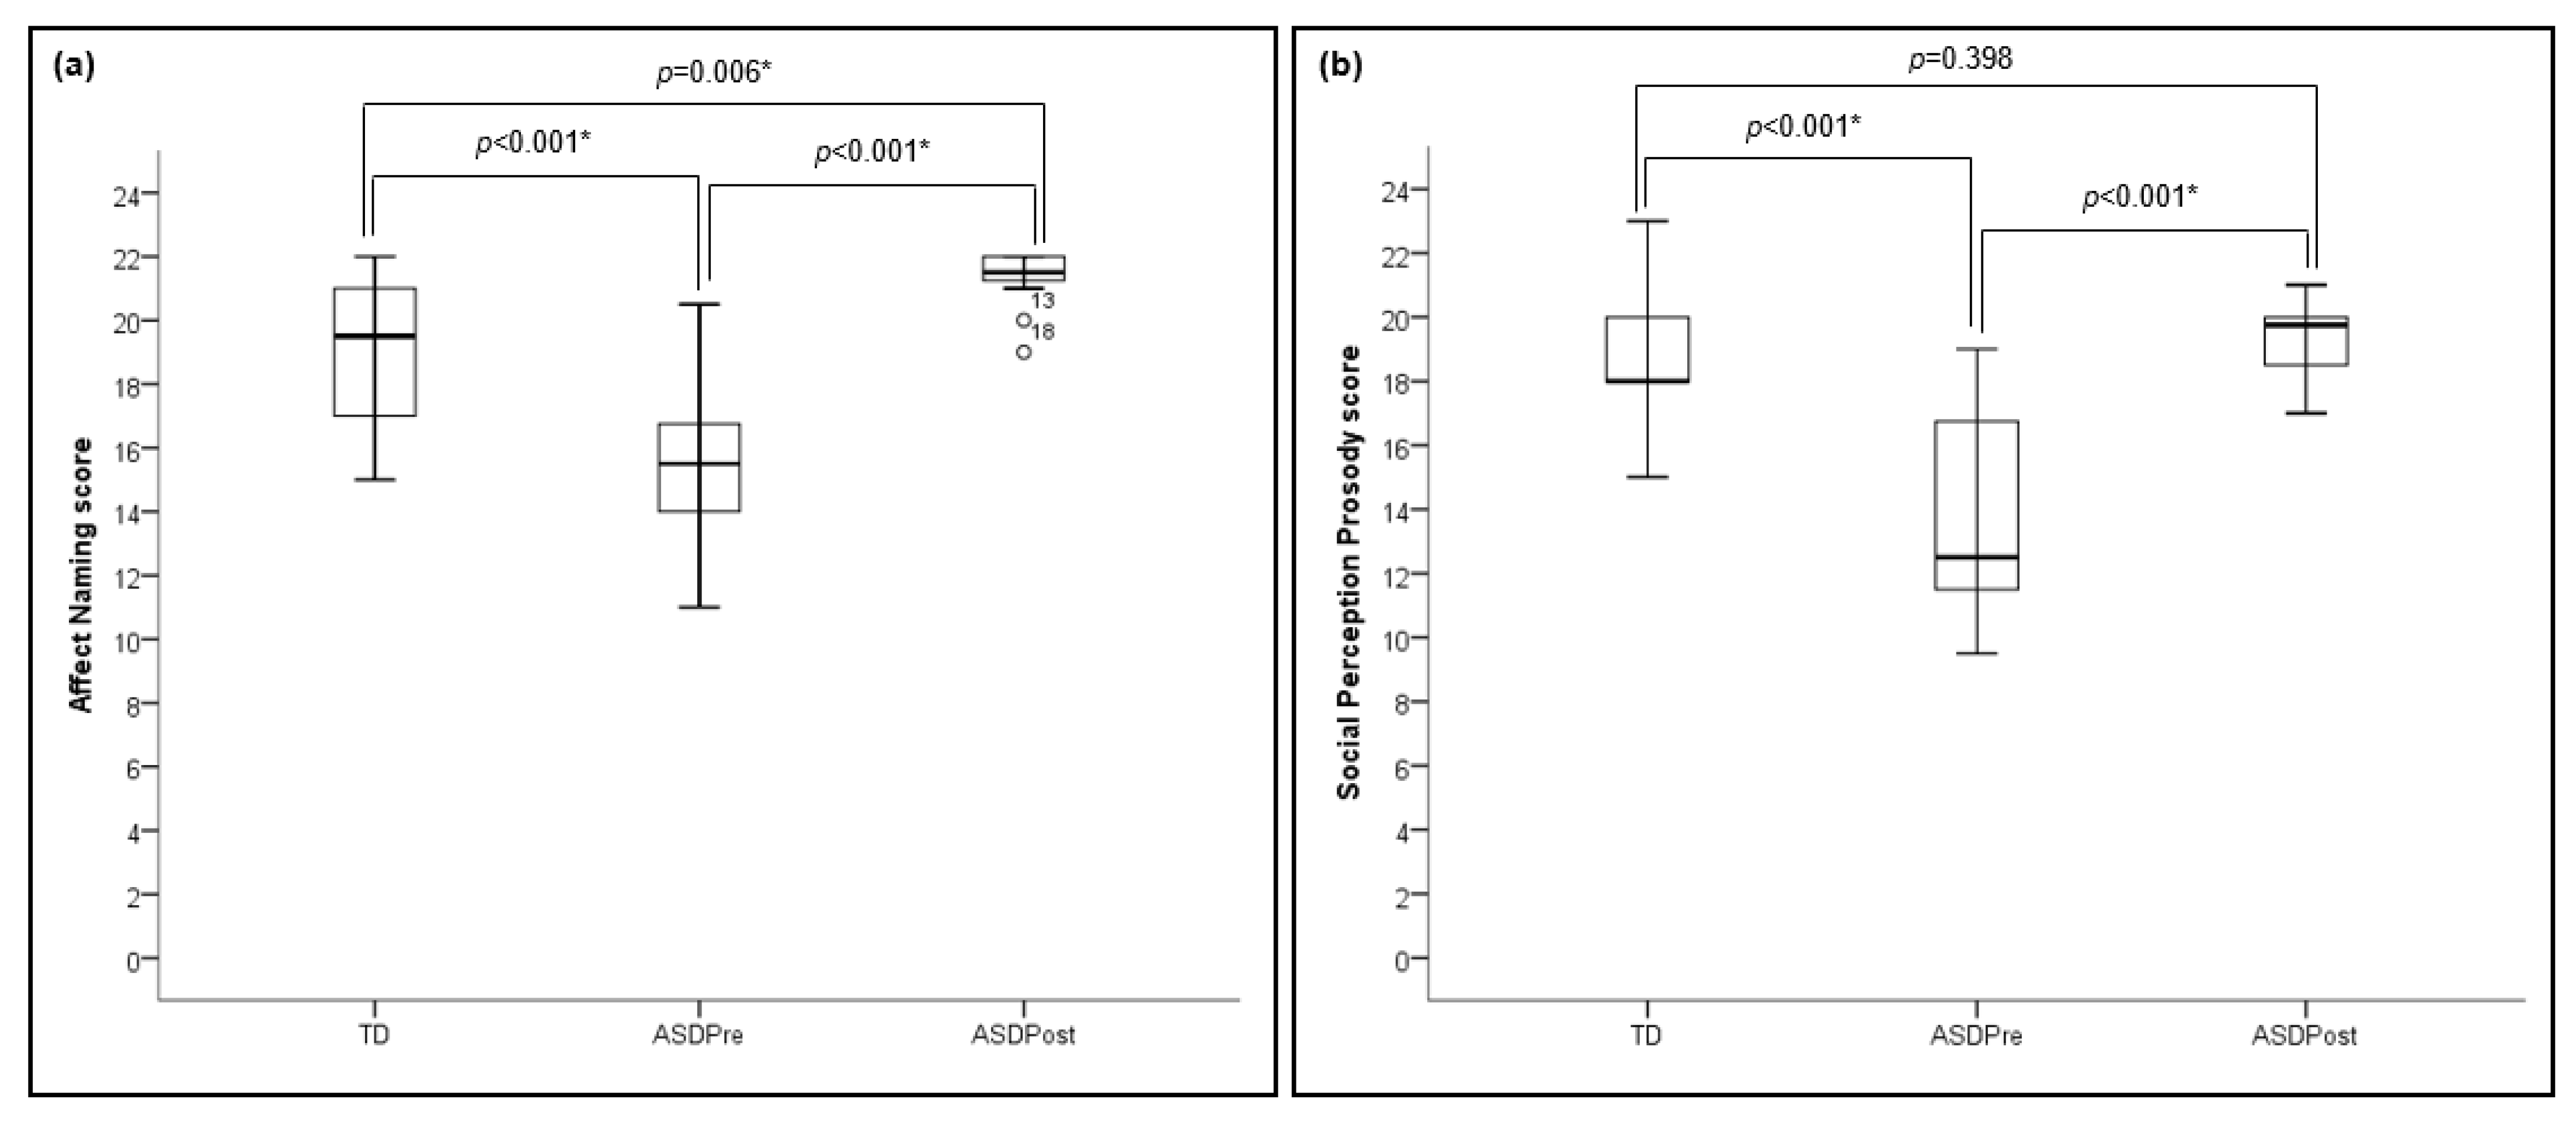
3.2. Behavioral Social Perception
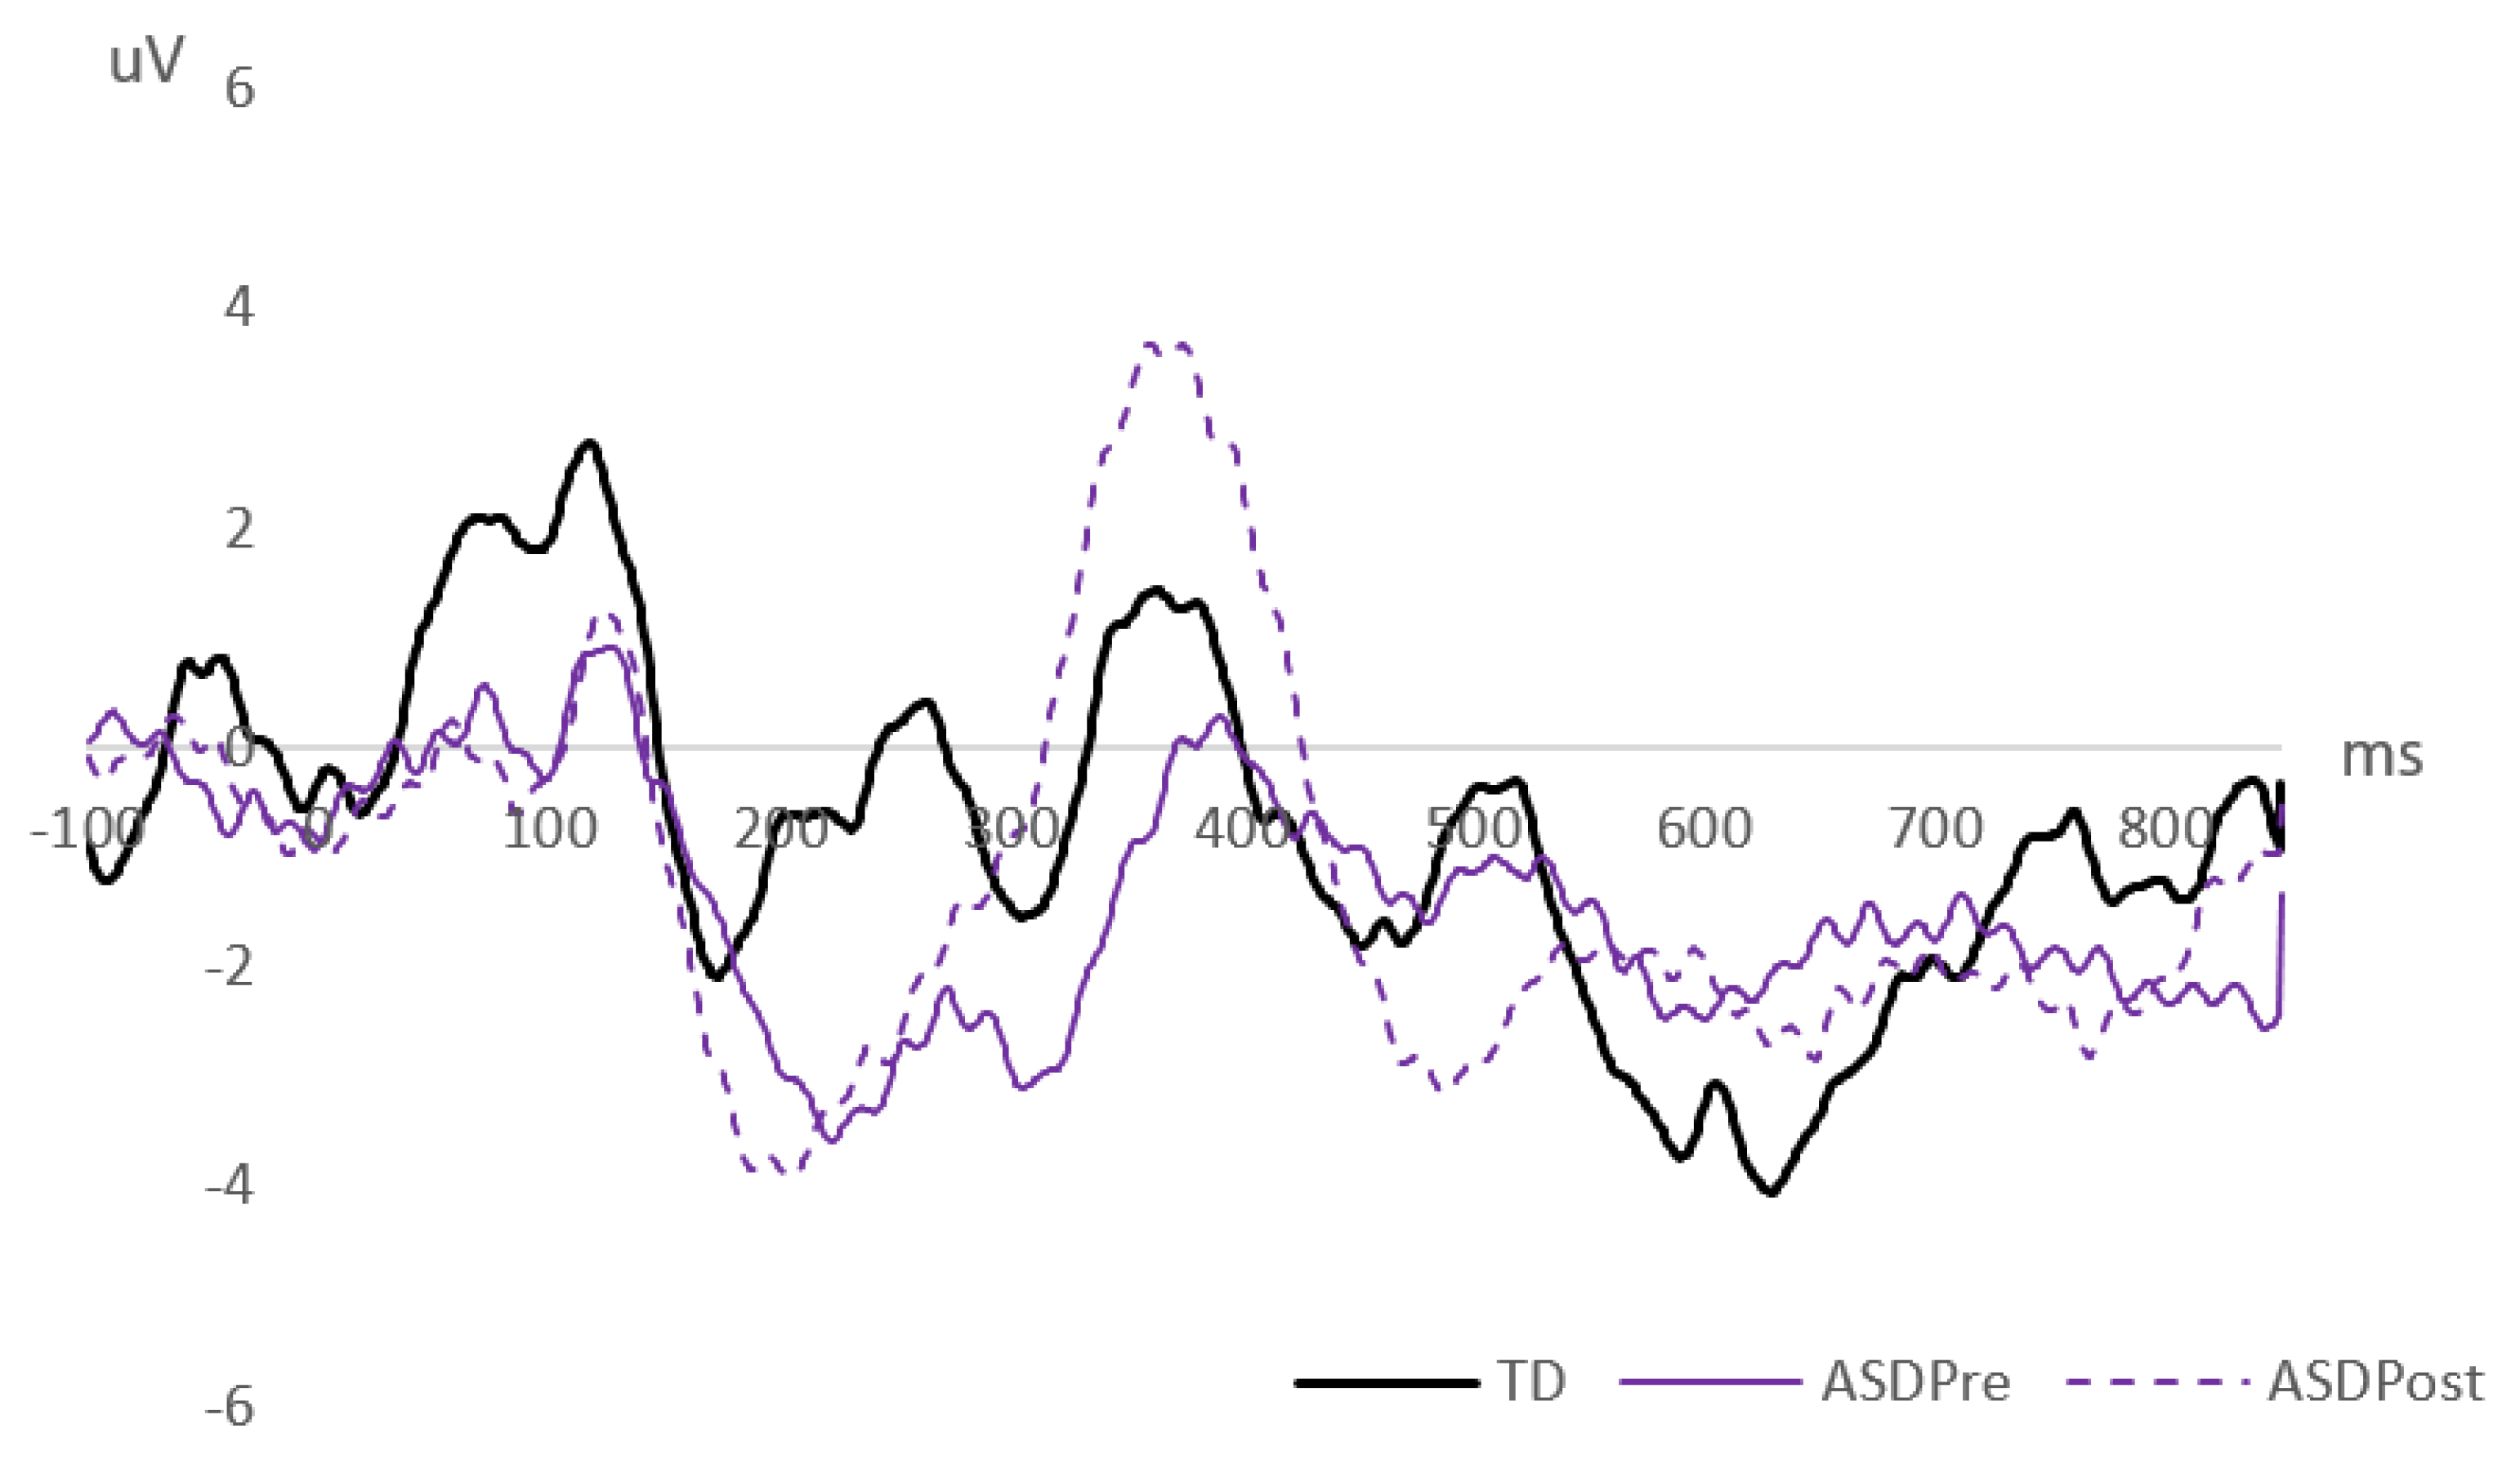
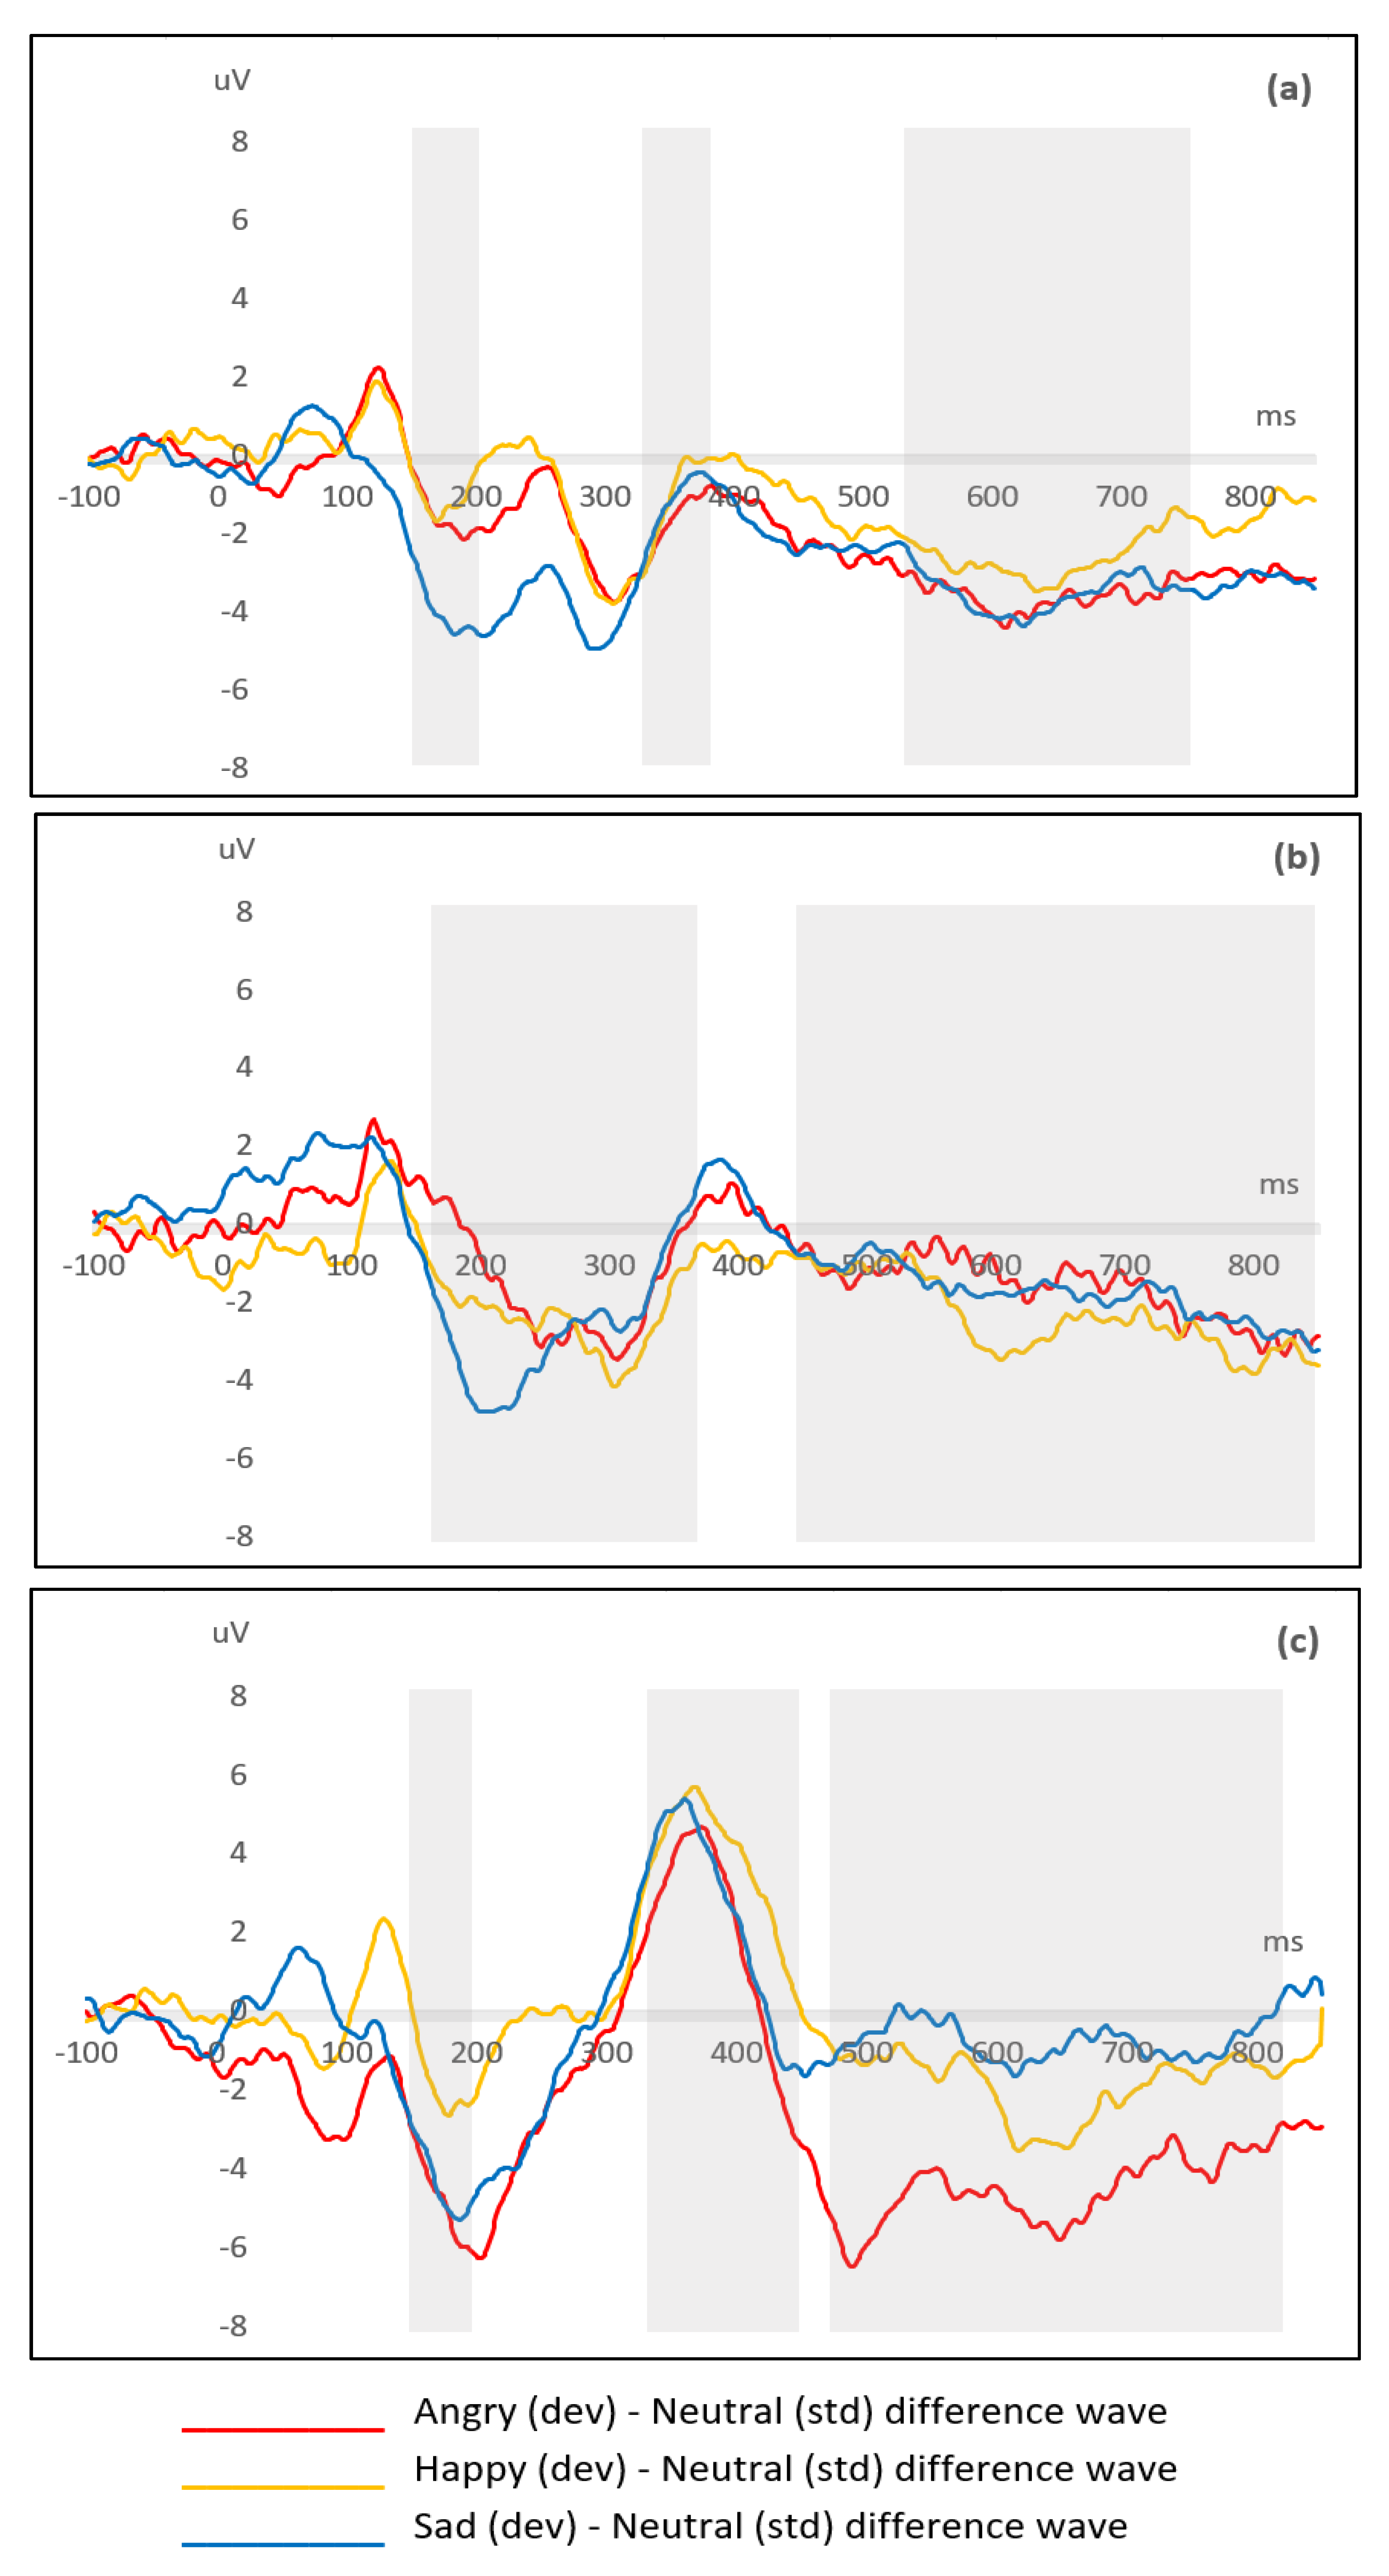
3.3. Cortical Auditory Evoked Potentials
4. Discussion
4.1. Behavioral Results and Implications
4.2. Electrophysiological Results and Implications
4.3. Limitations and Future Directions
5. Conclusions
Supplementary Materials
Author Contributions
Funding
Institutional Review Board Statement
Informed Consent Statement
Data Availability Statement
Acknowledgments
Conflicts of Interest
References
- American Psychiatric Association. Diagnostic and Statistical Manual of Mental Disorders, 5th ed.; American Psychiatric Association: Arlington, VA, USA, 2013. [Google Scholar]
- Kaland, N.; Mortensen, E.L.; Smith, L. Social communication impairments in children and adolescents with Asperger syndrome: Slow response time and the impact of prompting. Res. Autism Spectr. Disord. 2011, 5, 1129–1137. [Google Scholar] [CrossRef]
- Wang, A.T.; Lee, S.S.; Sigman, M.; Dapretto, M. Neural basis of irony comprehension in children with Autism: The role of prosody and context. Brain 2006, 129, 932–943. [Google Scholar] [CrossRef]
- Frith, U.; Happe, F. Language and communication in autistic disorders. Philos. Trans. R. Soc. B 1994, 346, 97–104. [Google Scholar] [CrossRef]
- McCann, J.; Peppé, S.J.E. Prosody in Autism Spectrum Disorders: A critical review. Int. J. Lang. Commun. Disord. 2003, 38, 325–350. [Google Scholar] [CrossRef]
- Paul, R.; Augustyn, A.; Klin, A.; Volkmar, F.R. Perception and production of prosody by speakers with Autism Spectrum Disorders. J. Autism Dev. Disord. 2005, 35, 205–220. [Google Scholar] [CrossRef] [PubMed]
- Tager-Flusberg, H.; Caronna, E. Language disorders: Autism and other pervasive developmental disorders. Pediatr. Clin. N. Am. 2007, 54, 469–481. [Google Scholar] [CrossRef] [PubMed]
- Crystal, D. Prosodic Systems and Intonation in English; University Press Archive: Cambridge, UK, 1976; Volume 1. [Google Scholar]
- Kalathottukaren, R.T.; Purdy, S.C.; Ballard, E. Behavioral measures to evaluate prosodic skills: A review of assessment tools for children and adults. Contemp. Issues Commun. Sci. Disord. 2015, 42, 138–154. [Google Scholar] [CrossRef]
- Johnstone, T.; Scherer, K.R. Chapter 14: Vocal communication of emotion. In The Handbook of Emotion; Lewis, M., Haviland, J., Eds.; Guilford: New York, NY, USA, 2000; pp. 220–235. [Google Scholar]
- Juslin, P.N.; Laukka, P. Impact of intended emotion intensity on cue utilization and decoding accuracy in vocal expression of emotion. Emotion 2001, 1, 381–412. [Google Scholar] [CrossRef] [PubMed]
- Murray, I.R.; Arnott, J.L. Toward the simulation of emotion in synthetic speech: A review of the literature on human vocal emotion. J. Acoust. Soc. Am. 1993, 93, 1097–1108. [Google Scholar] [CrossRef] [PubMed]
- Peppé, S.J.E. Why is prosody in speech-language pathology so difficult? Int. J. Speech Lang. Pathol. 2009, 11, 258–271. [Google Scholar] [CrossRef]
- Steinhauer, K.; Alter, K.; Friederici, A.D. Brain potentials indicate immediate use of prosodic cues in natural speech processing. Nat. Neurosci. 1999, 2, 191–196. [Google Scholar] [CrossRef] [PubMed]
- Witteman, J.; Van Heuven, V.J.P.; Schiller, N.O. Hearing feelings: A quantitative meta-analysis on the neuroimaging literature of emotional prosody perception. Neuropsychologia 2012, 50, 2752–2763. [Google Scholar] [CrossRef] [PubMed]
- Bamiou, D.; Musiek, F.E.; Luxon, L.M. Aetiology and clinical presentations of auditory processing disorders—A review. Arch. Dis. Child. 2001, 85, 361–365. [Google Scholar] [CrossRef]
- Dawes, P.; Bishop, D. Auditory processing disorder in relation to developmental disorders of language, communication and attention: A review and critique. Int. J. Lang. Commun. Disord. 2009, 44, 440–465. [Google Scholar] [CrossRef] [PubMed]
- Haesen, B.; Boets, B.; Wagemans, J. A review of behavioural and electrophysiological studies on auditory processing and speech perception in Autism Spectrum Disorders. Res. Autism Spectr. Disord. 2011, 5, 701–714. [Google Scholar] [CrossRef]
- O’Connor, K. Auditory processing in Autism Spectrum Disorder: A review. Neurosci. Biobehav. Rev. 2012, 36, 836–854. [Google Scholar] [CrossRef] [PubMed]
- Schafer, E.C.; Mathews, L.; Gopal, K.; Canale, E.; Creech, A.; Manning, J.; Kaiser, K. Behavioral auditory processing in children and young adults with Autism Spectrum Disorder. J. Am. Acad. Audiol. 2020. [Google Scholar] [CrossRef]
- Bonnel, A.; Mottron, L.; Peretz, I.; Trudel, M.; Gallun, E.; Bonnel, A. Enhanced pitch sensitivity in individuals with Autism: A signal detection analysis. J. Cogn. Neurosci. 2003, 15, 226–235. [Google Scholar] [CrossRef]
- Ouimet, T.; Foster, N.E.V.; Tryfon, A.; Hyde, K.L. Auditory-musical processing in Autism Spectrum Disorders: A review of behavioral and brain imaging studies. Ann. N. Y. Acad. Sci. 2012, 1252, 325–331. [Google Scholar] [CrossRef] [PubMed]
- Järvinen-Pasley, A.; Heaton, P. Evidence for reduced domain-specificity in auditory processing in Autism. Dev. Sci. 2007, 10, 786–793. [Google Scholar] [CrossRef]
- Järvinen-Pasley, A.; Peppé, S.J.E.; King-Smith, G.; Heaton, P. The relationship between form and function level receptive prosodic abilities in Autism. J. Autism Dev. Disord. 2008, 38, 1328–1340. [Google Scholar] [CrossRef]
- Alcántara, J.I.; Weisblatt, E.J.L.; Moore, B.C.J.; Bolton, P.F. Speech-in-noise perception in high-functioning individuals with Autism or Asperger’s syndrome. J. Child Psychol. Psychiatry 2004, 45, 1107–1114. [Google Scholar] [CrossRef]
- Alcántara, J.I.; Cope, T.E.; Cope, W.; Weisblatt, E.J. Auditory temporal-envelope processing in high-functioning children with Autism Spectrum Disorder. Neuropsychologia 2012, 50, 1235–1251. [Google Scholar] [CrossRef]
- Tomchek, S.D.; Dunn, W. Sensory processing in children with and without Autism: A comparative study using the short sensory profile. Am. J. Occup. Ther. 2007, 61, 190–200. [Google Scholar] [CrossRef]
- Carpenter, M.L.; Estrem, T.L.; Crowell, R.L.; Edrisinha, C.D. (Central) auditory processing skills in young adults with Autism Spectrum Disorder. Commun. Disord. Deaf Stud. Hear. Aids 2014, 2, 1–8. [Google Scholar] [CrossRef]
- DePape, A.R.; Hall, G.B.C.; Tillmann, B.; Trainor, L.J. Auditory processing in high-functioning adolescents with Autism Spectrum Disorder. PLoS ONE 2012, 7, e44084. [Google Scholar] [CrossRef] [PubMed]
- Brooks, P.J.; Ploog, B.O. Attention to emotional tone of voice in speech perception in children with Autism. Res. Autism Spectr. Disord. 2013, 7, 845–857. [Google Scholar] [CrossRef]
- Singh, L.; Harrow, M.S. Influences of semantic and prosodic cues on word repetition and categorization in Autism. J. Speech Lang. Hear. Res. 2014, 57, 1764–1778. [Google Scholar] [CrossRef]
- Jansson-Verkasalo, E.; Ceponienè, R.; Kielinen, M.; Suominen, K.; Jäntti, V.; Linna, S.L.; Moilanen, I.; Näätänen, R. Deficient auditory processing in children with Asperger syndrome, as indexed by event-related potentials. Neurosci. Lett. 2003, 338, 197–200. [Google Scholar] [CrossRef]
- Kujala, T.; Kuuluvainen, S.; Saalasti, S.; Jansson-Verkasalo, E.; von Wendt, L.; Lepistö, T. Speech-feature discrimination in children with Asperger syndrome as determined with the multi-feature mismatch negativity paradigm. Clin. Neurophysiol. 2010, 121, 1410–1419. [Google Scholar] [CrossRef] [PubMed]
- Lepistö, T.; Nieminen-von Wendt, T.; von Wendt, L.; Näätänen, R.; Kujala, T. Auditory cortical change detection in adults with Asperger syndrome. Neurosci. Lett. 2007, 414, 136–140. [Google Scholar] [CrossRef] [PubMed]
- Fan, Y.; Cheng, Y. Atypical mismatch negativity in response to emotional voices in people with Autism Spectrum Conditions. PLoS ONE 2014, 9, e102471. [Google Scholar] [CrossRef] [PubMed]
- Korpilahti, P.; Jansson-Verkasalo, E.; Mattila, M.L.; Kuusikko, S.; Suominen, K.; Rytky, S.; Pauls, D.L.; Moilanen, I. Processing of affective speech prosody is impaired in Asperger syndrome. J. Autism Dev. Disord. 2006, 37, 1539–1549. [Google Scholar] [CrossRef] [PubMed]
- Kujala, T.; Lepistö, T.; Nieminen-von Wendt, T.; Näätänen, P.; Näätänen, R. Neurophysiological evidence for cortical discrimination impairment of prosody in Asperger syndrome. Neurosci. Lett. 2005, 383, 260–265. [Google Scholar] [CrossRef] [PubMed]
- Demopoulos, C.; Hopkins, J.; Kopald, B.E.; Paulson, K.; Doyle, L.; Andrews, W.E.; Lewine, J.D. Deficits in auditory processing contribute to impairments in vocal affect recognition in Autism Spectrum Disorders: A MEG study. Neuropsychology 2015, 29, 1–27. [Google Scholar] [CrossRef] [PubMed]
- Lerner, M.; McPartland, J.C.; Morris, J.P. Multimodal emotion processing in Autism Spectrum Disorders: An event-related potential study. Dev. Cogn. Neurosci. 2013, 3, 11–21. [Google Scholar] [CrossRef] [PubMed]
- Goydke, K.N.; Altenmüller, E.; Möller, J.; Münte, T.F. Changes in emotional tone and instrumental timbre are reflected by the mismatch negativity. Cogn. Brain Res. 2004, 21, 351–359. [Google Scholar] [CrossRef]
- Schirmer, A.; Striano, T.; Friederici, A.D. Sex differences in the preattentive processing of vocal emotional expressions. Cogn. Neurosci. Neuropsychol. 2005, 16, 635–639. [Google Scholar] [CrossRef]
- Schirmer, A.; Escoffier, N. Emotional MMN: Anxiety and heart rate correlate with the ERP signature for auditory change detection. Clin. Neurophysiol. 2010, 121, 53–59. [Google Scholar] [CrossRef] [PubMed]
- Csépe, V. On the origin and development of the mismatch negativity. Ear Hear. 1995, 16, 91–104. [Google Scholar] [CrossRef]
- Ashburner, J.; Ziviani, J.; Rodger, S. Sensory processing and classroom emotional, behavioral, and educational outcomes in children with Autism Spectrum Disorder. Am. J. Occup. Ther. 2008, 62, 564–573. [Google Scholar] [CrossRef] [PubMed]
- Landon, J.; Shepherd, D.; Lodhia, V. A qualitative study of noise sensitivity in adults with Autism Spectrum Disorder. Res. Autism Spectr. Disord. 2016, 32, 43–52. [Google Scholar] [CrossRef]
- Irwin, J.; Preston, J.; Brancazio, L.; D’angelo, M.; Turcios, J. Development of an audiovisual speech perception app for children with Autism Spectrum Disorders. Clin. Linguist. Phon. 2015, 29, 76–83. [Google Scholar] [CrossRef] [PubMed]
- Kozou, H.; Azouz, H.G.; Abdou, R.M.; Shaltout, A. Evaluation and remediation of central auditory processing disorders in children with Autism Spectrum Disorders. Int. J. Pediatr. Otorhinolaryngol. 2018, 104, 36–42. [Google Scholar] [CrossRef] [PubMed]
- Russo, N.M.; Hornickel, J.; Nicol, T.; Zecker, S.; Kraus, N. Biological changes in auditory function following training in children with Autism Spectrum Disorders. Behav. Brain Funct. 2010, 6, 60–67. [Google Scholar] [CrossRef]
- Schafer, E.C.; Mathews, L.; Mehta, S.; Hill, M.; Munoz, A.; Bishop, R.; Moloney, M. Personal FM systems for children with Autism Spectrum Disorders: An initial investigation. J. Commun. Disord. 2013, 46, 30–52. [Google Scholar] [CrossRef]
- Schafer, E.C.; Traber, J.; Layden, P.; Amin, A.; Sanders, K.; Bryant, D.; Baldus, N. Use of wireless technology for children with auditory processing disorders, attention-deficit hyperactivity disorder, and language disorders. Semin. Hear. 2014, 35, 193–205. [Google Scholar] [CrossRef]
- Schafer, E.C.; Wright, S.; Anderson, C.; Jones, J.; Pitts, K.; Bryant, D.; Wastson, M.; Box, J.; Neve, M.; Mathews, L.; et al. Assistive technology evaluations: Remote-microphone technology for children with Autism Spectrum Disorder. J. Commun. Disord. 2016, 64, 1–17. [Google Scholar] [CrossRef] [PubMed]
- Schafer, E.C.; Gopal, K.V.; Mathews, L.; Thompson, S.; Kaiser, K.; McCullough, S.; Jones, J.; Castillo, P.; Canale, E.; Hutcheson, A. Effects of auditory training and remote microphone technology on the behavioral performance of children and young adults who have Autism Spectrum Disorder. J. Am. Acad. Audiol. 2019, 30, 431–443. [Google Scholar] [CrossRef]
- Rance, G.; Saunders, K.; Carew, P.; Johansson, M.; Tan, J. The use of listening devices to ameliorate auditory deficit in children with Autism. J. Pediatr. 2014, 164, 352–357. [Google Scholar] [CrossRef] [PubMed]
- Rance, G.; Chisari, D.; Saunders, K.; Rault, J. Reducing listening-related stress in school-aged children with Autism Spectrum Disorder. J. Autism Dev. Disord. 2017, 47, 2010–2022. [Google Scholar] [CrossRef] [PubMed]
- Gopal, K.V.; Schafer, E.C.; Mathews, L.; Nandy, R.; Beaudoin, D.; Schadt, L.; Brown, A.; Phillips, B.; Caldwell, J. Effects of auditory training on electrophysiological measures in individuals with Autism Spectrum Disorder. J. Am. Acad. Audiol. 2020, 31, 96–104. [Google Scholar] [CrossRef] [PubMed]
- Eiserman, W.D.; Shisler, L.; Foust, T.; Buhrmann, J.; Winston, R.; White, K.R. Screening for hearing loss in early childhood programs. Early Child. Res. Q. 2007, 22, 105–117. [Google Scholar] [CrossRef][Green Version]
- Hall, J.W. Effective and efficient pre-school hearing screening: Essential for successful early hearing detection and intervention (EHDI). J. Early Hear. Detect. Interv. 2016, 1, 2–12. [Google Scholar]
- Gorga, M.P.; Neely, S.T.; Dorn, P.A. Distortion product otoacoustic emission test performance for a priori criteria and for multifrequency audiometric standards. Ear Hear. 1999, 20, 345–362. [Google Scholar] [CrossRef]
- Ramos, J.A.; Kristensen, S.G.B.; Beck, D.L. An overview of OAEs and normative data for DPOAEs. Hear. Rev. 2013, 20, 30–33. [Google Scholar]
- Schopler, E.; Van Bourgondien, M.E.; Wellman, G.J.; Love, S.R. Childhood Autism Rating Scale, 2nd ed.; Western Psychological Services: Los Angeles, CA, USA, 2010. [Google Scholar]
- Bishop, D.V.M. The Children’s Communication Checklist-2; Psychological Corporation: London, UK, 2003. [Google Scholar]
- Pearson. Advanced Clinical Solutions for WAIS-IV and WMS-IV; Pearson: San Antonio, TX, USA, 2009. [Google Scholar]
- Holdnack, J.; Goldstein, G.; Drozdick, L. Social perception and WAIS-IV performance in adolescents and adults diagnosed with Asperger’s syndrome and Autism. Assessment 2011, 18, 192–200. [Google Scholar] [CrossRef]
- Ross, E.D.; Thompson, R.D.; Yenkosky, J. Lateralization of affective prosody in brain and the callosal integration of hemispheric language functions. Brain Lang. 1997, 56, 27–54. [Google Scholar] [CrossRef]
- Keogh, T.; Kei, J.; Driscoll, C.; Smyth, V. Distortion-product otoacoustic emissions in schoolchildren: Effects of ear asymmetry, handedness, and gender. J. Am. Acad. Audiol. 2001, 12, 506–513. [Google Scholar] [PubMed]
- Cheour, M.; Korpilahti, P.; Martynova, O.; Lang, A. Mismatch negativity and late discriminative negativity in investigating speech perception and learning in children and infants. Audiol. Neurotol. 2001, 6, 2–11. [Google Scholar] [CrossRef] [PubMed]
- Halliday, L.F.; Barry, J.G.; Hardiman, M.J.; Bishop, D.V. Late, not early mismatch responses to changes in frequency are reduced or deviant in children with dyslexia: An event-related potential study. J. Neurodev. Disord. 2014, 6, 21–35. [Google Scholar] [CrossRef] [PubMed]
- Korpilahti, P.; Krause, C.M.; Holopainen, I.; Lang, A.H. Early and late mismatch negativity elicited by words and speech-like stimuli in children. Brain Lang. 2001, 76, 332–339. [Google Scholar] [CrossRef] [PubMed]
- Golan, O.; Ashwin, E.; Granader, Y.; McClintock, S.; Day, K.; Leggett, V.; Baron-Cohen, S. Enhancing emotion recognition in children with Autism Spectrum Conditions: An intervention using animated vehicles with real emotional faces. J. Autism Dev. Disord. 2010, 40, 269–279. [Google Scholar] [CrossRef]
- Lacava, P.G.; Golan, O.; Baron-Cohen, S.; Smith-Myles, B. Using assistive technology to teach emotion recognition to students with Asperger syndrome. Remedial Spec. Educ. 2007, 28, 174–181. [Google Scholar] [CrossRef]
- Lacava, P.G.; Rankin, A.; Mahlios, E.; Cook, K.; Simpson, R.L. A single case design evaluation of a software and tutor intervention addressing emotion recognition and social interaction in four boys with ASD. Autism Int. J. Res. Pract. 2010, 14, 161–178. [Google Scholar] [CrossRef] [PubMed]
- Silver, M.; Oakes, P. Evaluation of a new computer intervention to teach people with Autism or Asperger syndrome to recognize and predict emotions in others. Autism Int. J. Res. Pract. 2001, 5, 299–316. [Google Scholar] [CrossRef]
- Matsuda, S.; Yamamoto, J. Intervention for increasing the comprehension of affective prosody in children with Autism Spectrum Disorders. Res. Autism Spectr. Disord. 2013, 7, 938–946. [Google Scholar] [CrossRef]
- Ploog, B.O.; Banerjee, S.; Brooks, P.J. Attention to prosody (intonation) and content in children with Autism and in typical children using spoken sentences in a computer game. Res. Autism Spectr. Disord. 2009, 3, 743–758. [Google Scholar] [CrossRef]
- Holbrook, S.; Israelsen, M. Speech prosody interventions for persons with Autism Spectrum Disorders: A systematic review. Am. J. Speech-Lang. Pathol. 2020, 29, 2189–2205. [Google Scholar] [CrossRef] [PubMed]
- Didehbani, N.; Allen, T.; Kandalaft, M.; Krawczyk, D.; Chapman, S. Virtual reality social cognition training for children with high functioning Autism. Comput. Hum. Behav. 2016, 62, 703–711. [Google Scholar] [CrossRef]
- Golan, O.; Baron-Cohen, S.; Hill, J.J.; Golan, Y. The reading the mind in films task: Complex emotion recognition in adults with and without Autism Spectrum Conditions. Soc. Neurosci. 2006, 1, 111–123. [Google Scholar] [CrossRef] [PubMed]
- Kandalaft, M.R.; Didehbani, N.; Krawczyk, D.C.; Allen, T.T.; Chapman, S.B. Virtual reality social cognition training for young adults with high-functioning Autism. J. Autism Dev. Disord. 2013, 43, 34–44. [Google Scholar] [CrossRef]
- Ferreira, D.A.; Bueno, C.D.; De Costa, S.S.; Sleifer, P. Mismatch negativity in children: Reference values. Int. Arch. Otorhinolaryngol. 2019, 23, 142–146. [Google Scholar] [CrossRef]
- Gomot, M.; Giard, M.; Roux, S.; Barthélémy, C.; Bruneau, N. Maturation of frontal and temporal components of mismatch negativity (MMN) in children. Neuroreport 2000, 11, 3109–3112. [Google Scholar] [CrossRef] [PubMed]
- Shafer, V.L.; Morr, M.L.; Kreuzer, J.A.; Kurtzberg, D. Maturation of mismatch negativity in school-age children. Ear Hear. 2000, 21, 242–251. [Google Scholar] [CrossRef] [PubMed]
- Cheng, Y.; Wu, H.; Tzeng, Y.; Yang, M.; Zhao, L.; Lee, C. The development of mismatch responses to mandarin lexical tones in early infancy. Dev. Neuropsychol. 2013, 38, 281–300. [Google Scholar] [CrossRef] [PubMed]
- Shafer, V.L.; Yu, Y.H.; Datta, H. Maturation of speech discrimination in 4- to 7-yr-old children as indexed by event-related potential mismatch responses. Ear Hear. 2010, 31, 735–745. [Google Scholar] [CrossRef] [PubMed]
- Tremblay, K.; Kraus, N.; McGee, T.; Ponton, C.; Otis, B. Central auditory plasticity: Changes in the N1-P2 complex after speech-sound training. Ear Hear. 2001, 22, 79–90. [Google Scholar] [CrossRef] [PubMed]
- Tremblay, K.L.; Kraus, N. Auditory training induces asymmetrical changes in cortical neural activity. J. Speech Lang. Hear. Res. 2002, 45, 564–572. [Google Scholar] [CrossRef]
- Kraus, N.; McGee, T.; Carrell, T.; Sharma, A. Neurophysiologic bases of speech discrimination. Ear Hear. 1995, 16, 19–37. [Google Scholar] [CrossRef]
- Tong, Y.; Melara, R.D.; Rao, A. P2 enhancement from auditory discrimination training is associated with improved reaction times. Brain Res. 2009, 1297, 80–88. [Google Scholar] [CrossRef] [PubMed]
- Tremblay, K.L.; Ross, B.; Inoue, K.; McClannahan, K.; Collet, G. Is the auditory evoked P2 response a biomarker of learning? Front. Syst. Neurosci. 2014, 8, 1–13. [Google Scholar] [CrossRef] [PubMed]
- Banse, R.; Scherer, K.R. Acoustic profiles in vocal emotion expression. J. Personal. Soc. Psychol. 1996, 70, 614–636. [Google Scholar] [CrossRef]
- Yildirim, S.; Bulut, M.; Lee, C.M.; Kazemzadeh, A.; Deng, Z.; Lee, S.; Narayanan, S.; Busso, C. An acoustic study of emotions expressed in speech. In Proceedings of the Eighth International Conference on Spoken Language Processing, Jeju Island, Korea, 4–8 October 2004; pp. 1–4. [Google Scholar]
- Belyk, M.; Brown, S. The acoustic correlates of valence depend on emotion family. J. Voice 2014, 28, 523.e9–523.e18. [Google Scholar] [CrossRef]
- Peppé, S.J.E.; McCann, J.; Gibbon, F.; O’Hare, A.; Rutherford, M. Receptive and expressive prosodic ability in children with high-functioning Autism. J. Speech Lang. Hear. Res. 2007, 50, 1015–1028. [Google Scholar] [CrossRef]
- Cisler, J.; Bacon, A.; Williams, N. Phenomenological characteristics of attentional biases towards threat: A critical review. Cogn. Ther. Res. 2009, 33, 221–234. [Google Scholar] [CrossRef] [PubMed]
- Green, H.L.; Shuffrey, L.C.; Levinson, L.; Shen, G.; Avery, T.; Randazzo-Wagner, M.; Sepulveda, D.M.; Garcia, P.; Maddox, C.; Garcia, F.; et al. Evaluation of mismatch negativity as a marker for language impairment in Autism Spectrum Disorder. J. Commun. Disord. 2020, 87, 1–15. [Google Scholar] [CrossRef] [PubMed]
- Baranek, G.T.; David, F.J.; Poe, M.D.; Stone, W.L.; Watson, L.R. Sensory Experiences Questionnaire: Discriminating sensory features in young children with autism, developmental delays, and typical development. J. Child Psychol. Psychiatry 2006, 47, 591–601. [Google Scholar] [CrossRef]
- Harlor, A.D.B.; Bower, C. Hearing assessment in infants and children: Recommendations beyond neonatal screening. Pediatrics 2009, 124, 1252–1263. [Google Scholar] [CrossRef]
- Cupples, L.; Ching, T.Y.C.; Crowe, K.; Seeto, M.; Leigh, G.; Street, L.; Day, J.; Marnane, V.; Thomson, J. Outcomes of 3-year-old children with hearing loss and different types of additional disabilities. J. Deaf Stud. Deaf Educ. 2013, 19, 20–39. [Google Scholar] [CrossRef]
- Demopoulos, C.; Lewine, J.D. Audiometric profiles in Autism Spectrum Disorders: Does subclinical hearing loss impact communication? Autism Res. 2016, 9, 107–120. [Google Scholar] [CrossRef] [PubMed]
- Peppé, S.J.E.; McCann, J.; Gibbon, F.; O’Hare, A.; Rutherford, M. Assessing prosodic and pragmatic ability in children with high-functioning Autism. J. Pragmat. 2006, 38, 1776–1791. [Google Scholar] [CrossRef]


| Measure | TD Group (n = 14) | ASD Group (n = 12) | |
|---|---|---|---|
| DPOAE SNRs (right ear) | 2 kHz | 12.66 | 12.89 |
| 3 kHz | 14.62 | 14.63 | |
| 4 kHz | 13.11 | 14.82 | |
| 5 kHz | 13.69 | 14.37 | |
| 6 kHz | 14.97 | 15.49 | |
| DPOAE SNRs (left ear) | 2 kHz | 12.97 | 14.64 |
| 3 kHz | 14.73 | 15.17 | |
| 4 kHz | 13.35 | 15.77 | |
| 5 kHz | 13.64 | 14.97 | |
| 6 kHz | 15.75 | 15.40 | |
| CARS-2 | Mean | - | 37.00 |
| Minimum | - | 29.00 | |
| Maximum | - | 49.00 | |
| CCC-2 (GCC) | Mean | 66.36 | 38.42 |
| SD | 18.92 | 13.75 | |
| CCC-2 (SIDC) | Mean | −1.86 | −8.50 |
| SD | 5.61 | 7.62 |
| Difference Waveform | Measure | Group 1 (M, SD) | Group 2 (M, SD) | Statistical Results |
|---|---|---|---|---|
| Combined Emotions—Neutral | Peak latency at MMN | TD (179.32, 10.11) | ASD Pre (259.10, 18.59) | t(12.81) = 12.33, p < 0.001 * |
| TD (179.32, 10.11) | ASD Post (196.03, 9.01) | t(22) = −4.17, p < 0.001 * | ||
| ASD Pre (259.10, 18.59) | ASD Post (196.03, 9.01) | t(9) = 8.42, p < 0.001 * | ||
| Magnitude at MMN | TD (3.06, 1.60) | ASD Pre (5.05, 3.19) | t(12.27) = 1.81, p = 0.094 | |
| TD (3.06, 1.60) | ASD Post (4.71, 2.96) | t(22) = −1.77, p = 0.091 | ||
| ASD Pre (5.05, 3.19) | ASD Post (4.71, 2.96) | t(9) = 0.34, p = 0.746 | ||
| Peak latency at MMP | TD (356.27, 45.85) | ASD Post (361.85, 11.43) | t(15.20) = −0.44, p = 0.668 | |
| Magnitude at MMP | TD (4.46, 2.88) | ASD Post (5.27, 3.31) | t(22) = −0.64, p = 0.532 | |
| Peak latency at LDN | TD (618.20, 16.00) | ASD Pre (722.00, 38.76) | t(11.21) = 8.00, p < 0.001 * | |
| TD (618.20, 16.00) | ASD Post (633.70, 24.10) | t(22) = −1.90, p = 0.071 | ||
| ASD Pre (722.00, 38.76) | ASD Post (633.70, 24.10) | t(9) = 9.09, p < 0.001 * | ||
| Magnitude at LDN | TD (5.32, 2.03) | ASD Pre (3.82, 2.89) | t(22) = −1.50, p = 0.149 | |
| TD (5.32, 2.03) | ASD Post (4.28, 3.64) | t(22) = 0.90, p = 0.378 | ||
| ASD Pre (3.82, 2.89) | ASD Post (4.28, 3.64) | t(9) = −0.52, p = 0.615 |
| Participant Group | Region | Friedman Results | Emotion 1 (Mdn, IQR) | Emotion 2 (Mdn, IQR) | Wilcoxon Results |
|---|---|---|---|---|---|
| TD | MMN | Χ2(2) = 7.02, p = 0.030 * | Angry (2.50, 3.49) | Happy (2.89, 2.99) | Z = −0.52, p = 0.600 |
| Angry (2.50, 3.49) | Sad (5.00, 3.19) | Z = −2.67, p = 0.008 * | |||
| Happy (2.89, 2.99) | Sad (5.00, 3.19) | Z = −2.73, p = 0.006 * | |||
| MMP | Χ2(2) = 1.71, p = 0.424 | - | - | - | |
| LDN | Χ2(2) = 0.11, p = 0.947 | - | - | - | |
| ASD Pre | MMN | Χ2(2) = 1.40, p = 0.497 | - | - | - |
| LDN | Χ2(2) = 5.00, p = 0.082 | - | - | - | |
| ASD Post | MMN | Χ2(2) = 7.40, p = 0.025 * | Angry (7.21, 7.06) | Happy (4.14, 3.22) | Z = −2.50, p = 0.013 * |
| Angry (7.21, 7.06) | Sad (8.06, 4.12) | Z = −0.15, p = 0.878 | |||
| Happy (4.14, 3.22) | Sad (8.06, 4.12) | Z = −2.09, p = 0.037 * | |||
| MMP | Χ2(2) = 16.20, p < 0.001 * | Angry (4.13, 2.32) | Happy (11.03, 4.31) | Z = −2.80, p = 0.005 * | |
| Angry (4.13, 2.32) | Sad (7.73, 2.96) | Z = −2.50, p = 0.013 * | |||
| Happy (11.03, 4.31) | Sad (7.73, 2.96) | Z = −2.40, p = 0.017 * | |||
| LDN | Χ2(2) = 17.59, p < 0.001 * | Angry (9.44, 6.39) | Happy (4.74, 3.41) | Z = −2.67, p = 0.008 * | |
| Angry (9.44, 6.39) | Sad (3.96, 2.99) | Z = −2.80, p = 0.005 * | |||
| Happy (4.74, 3.41) | Sad (3.96, 2.99) | Z = −2.09, p = 0.037 * |
Publisher’s Note: MDPI stays neutral with regard to jurisdictional claims in published maps and institutional affiliations. |
© 2021 by the authors. Licensee MDPI, Basel, Switzerland. This article is an open access article distributed under the terms and conditions of the Creative Commons Attribution (CC BY) license (https://creativecommons.org/licenses/by/4.0/).
Share and Cite
Leung, J.H.; Purdy, S.C.; Corballis, P.M. Improving Emotion Perception in Children with Autism Spectrum Disorder with Computer-Based Training and Hearing Amplification. Brain Sci. 2021, 11, 469. https://doi.org/10.3390/brainsci11040469
Leung JH, Purdy SC, Corballis PM. Improving Emotion Perception in Children with Autism Spectrum Disorder with Computer-Based Training and Hearing Amplification. Brain Sciences. 2021; 11(4):469. https://doi.org/10.3390/brainsci11040469
Chicago/Turabian StyleLeung, Joan H., Suzanne C. Purdy, and Paul M. Corballis. 2021. "Improving Emotion Perception in Children with Autism Spectrum Disorder with Computer-Based Training and Hearing Amplification" Brain Sciences 11, no. 4: 469. https://doi.org/10.3390/brainsci11040469
APA StyleLeung, J. H., Purdy, S. C., & Corballis, P. M. (2021). Improving Emotion Perception in Children with Autism Spectrum Disorder with Computer-Based Training and Hearing Amplification. Brain Sciences, 11(4), 469. https://doi.org/10.3390/brainsci11040469