Examining Mental Workload in a Spatial Navigation Transfer Game via Functional near Infrared Spectroscopy
Abstract
1. Introduction
2. Materials and Methods
2.1. Spatial Navigation Transfer (SNT) Game Tasks
2.2. Functional Near Infrared Spectroscopy (fNIRS)
2.3. Participants and Experiment Protocol
2.4. Data Analysis
2.4.1. fNIRS Data Processing
2.4.2. Statistical Analyses
3. Results
3.1. Behavioral Results
3.2. fNIRS Results
3.3. Perceived Mental Workload Results
3.4. Results Summary
4. Discussion
5. Conclusions
Author Contributions
Funding
Institutional Review Board Statement
Informed Consent Statement
Data Availability Statement
Conflicts of Interest
Appendix A
- Enrolled in the full-time or part-time graduate degree program
- 18 years old or older
- Right-handed, with vision correctible to 20/20
- Do not have history of seizures, head injury, or neurological dysfunction (e.g., Stroke or seizure)
- Do not have a history of depression, schizophrenia, or social phobia.
- Do not have previous admission to an alcohol/drug treatment program or diagnosis of alcohol/drug abuse.
- Are not take any medication known to affect alertness/brain activity (e.g., sleeping pills, Valium, or Xanax).
- Is not pregnant.
Appendix B
| RT (ms) | TT (ms) | |
|---|---|---|
| Valid | 27 | 27 |
| Missing | 0 | 0 |
| Mean | 4770.222 | 24,358.889 |
| Median | 4400.000 | 23,599.000 |
| Std. Deviation | 1778.093 | 7670.567 |
| Skewness | 0.952 | 1.130 |
| Std. Error of Skewness | 0.448 | 0.448 |
| Kurtosis | 1.060 | 1.239 |
| Std. Error of Kurtosis | 0.872 | 0.872 |
| Shapiro-Wilk | 0.937 | 0.898 |
| p-value of Shapiro-Wilk | 0.106 | 0.012 |
| Range | 7608.000 | 29,795.000 |
Appendix C
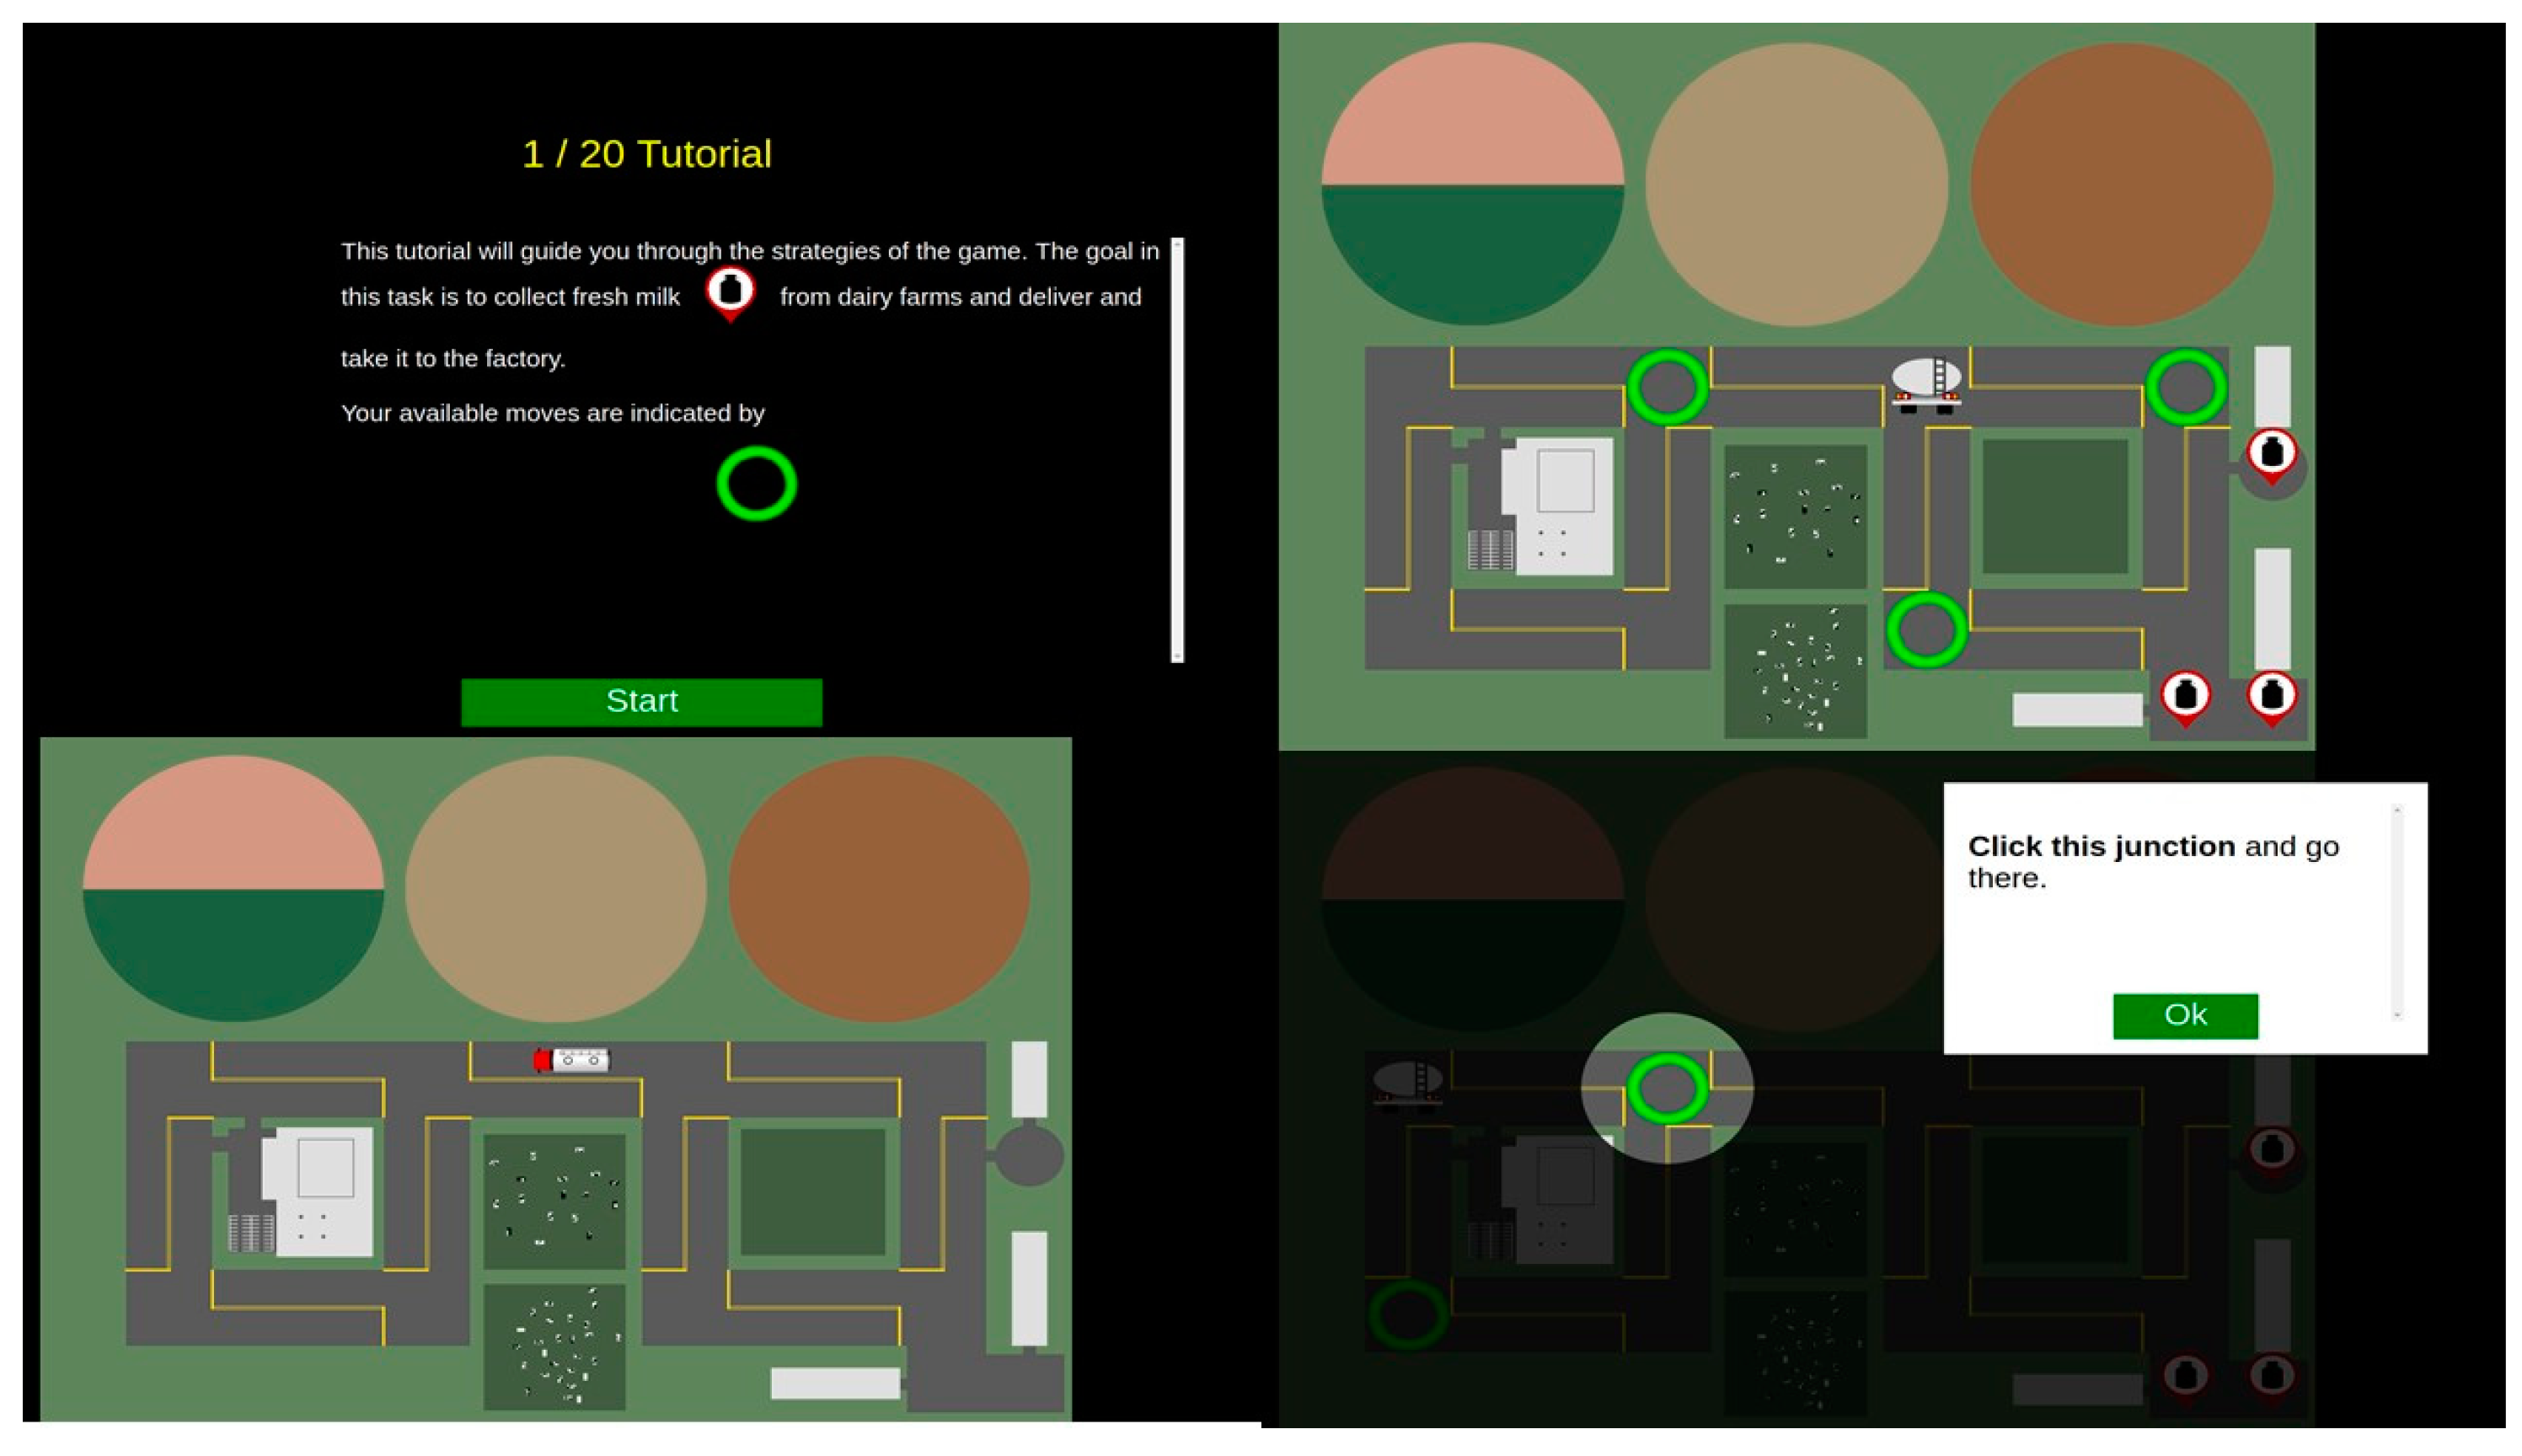
Appendix D
| DV | Week 1 Mean ± SD | |||||
|---|---|---|---|---|---|---|
| School Bus | Ambulance | |||||
| Low | Mid | High | Low | Mid | High | |
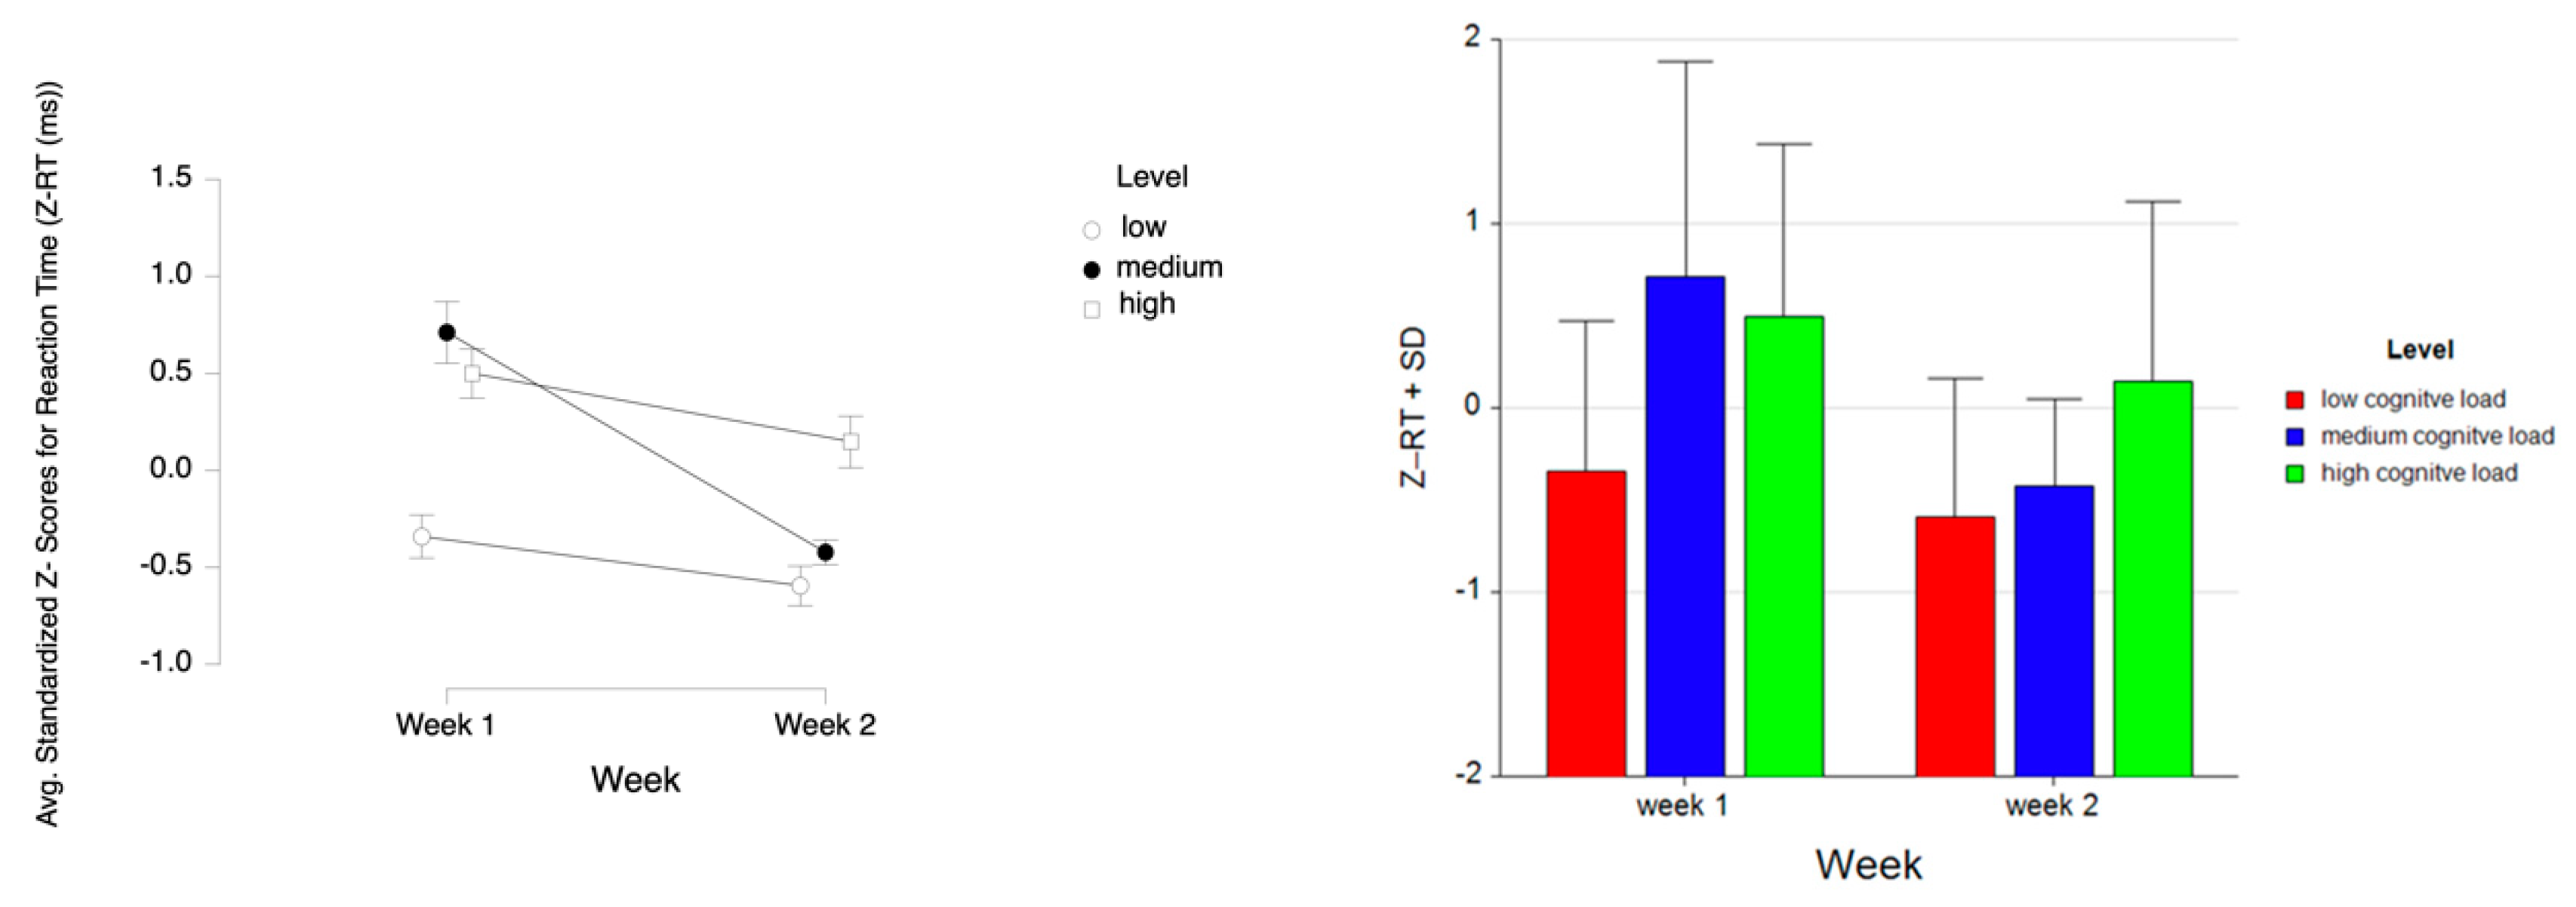
| Z_RT | −0.279 ± 0.345 | 0.668 ± 1.536 | 0.531 ± 0.866 | −0.402 ± 1.105 | 0.754 ± 0.636 | 0.468 ± 1.006 |
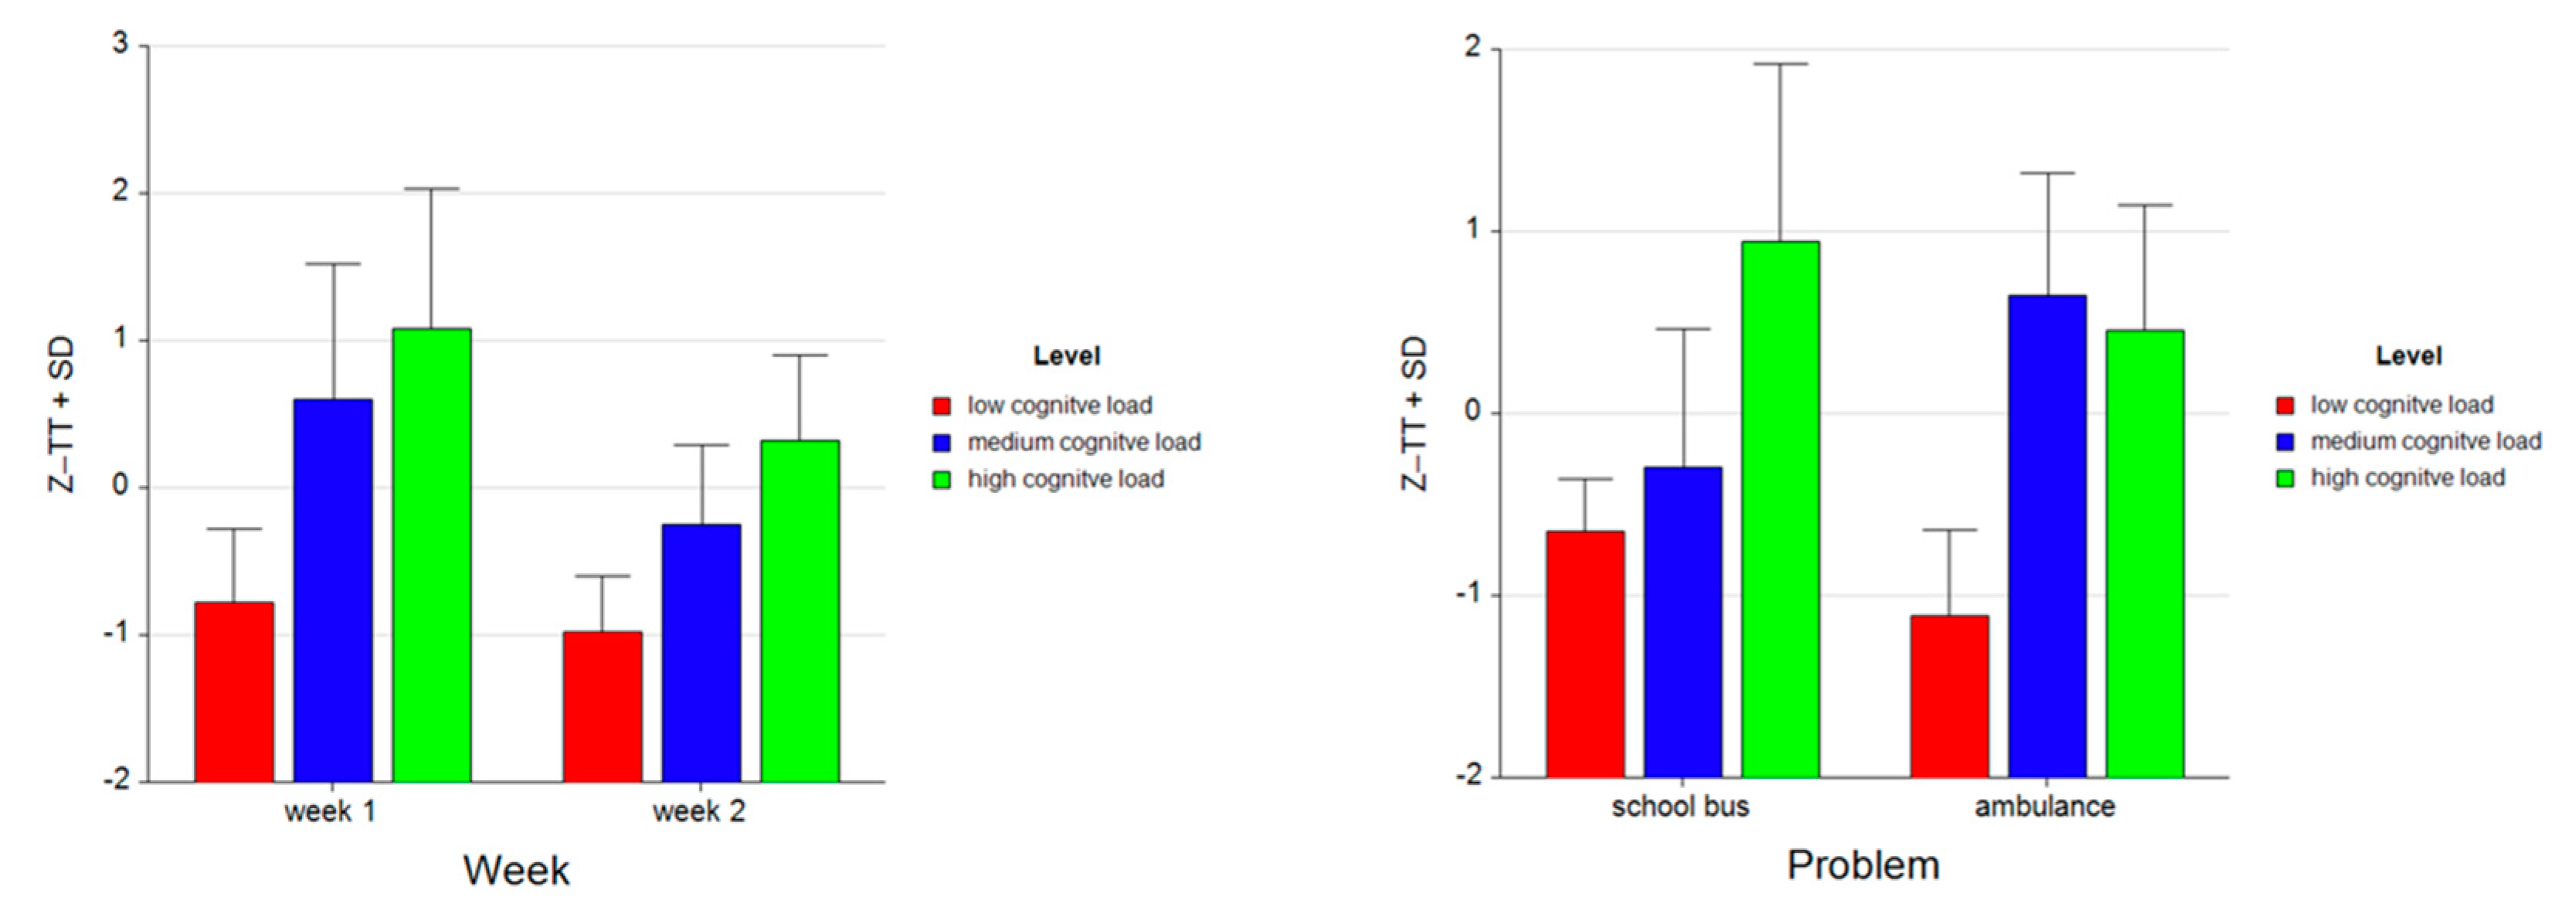
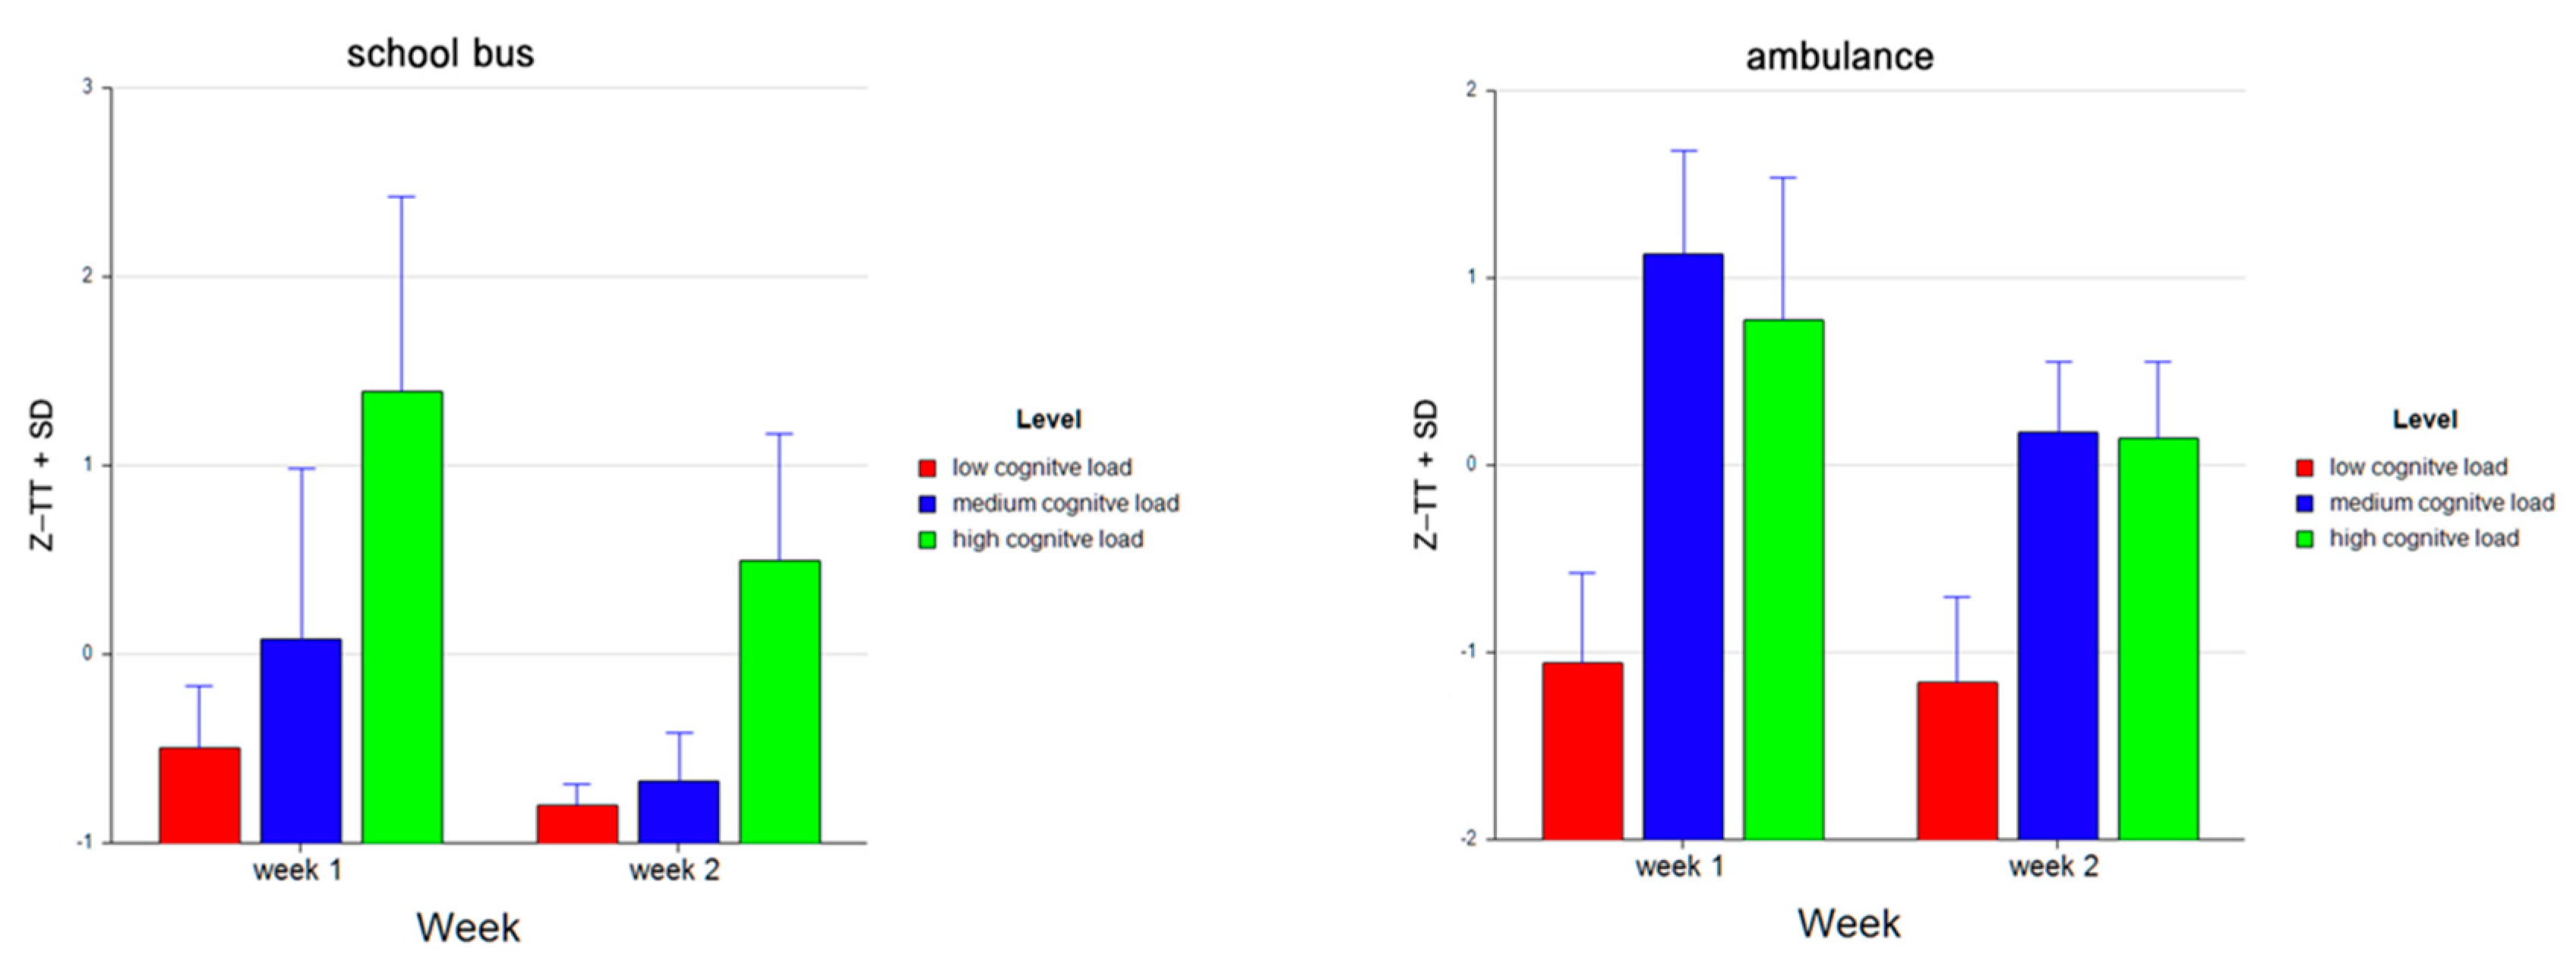
| Z_TT | −0.498 ± 0.327 | 0.079 ± 0.907 | 1.395 ± 1.025 | −1.057 ± 0.481 | 1.128 ± 0.550 | 0.775 ± 0.762 |
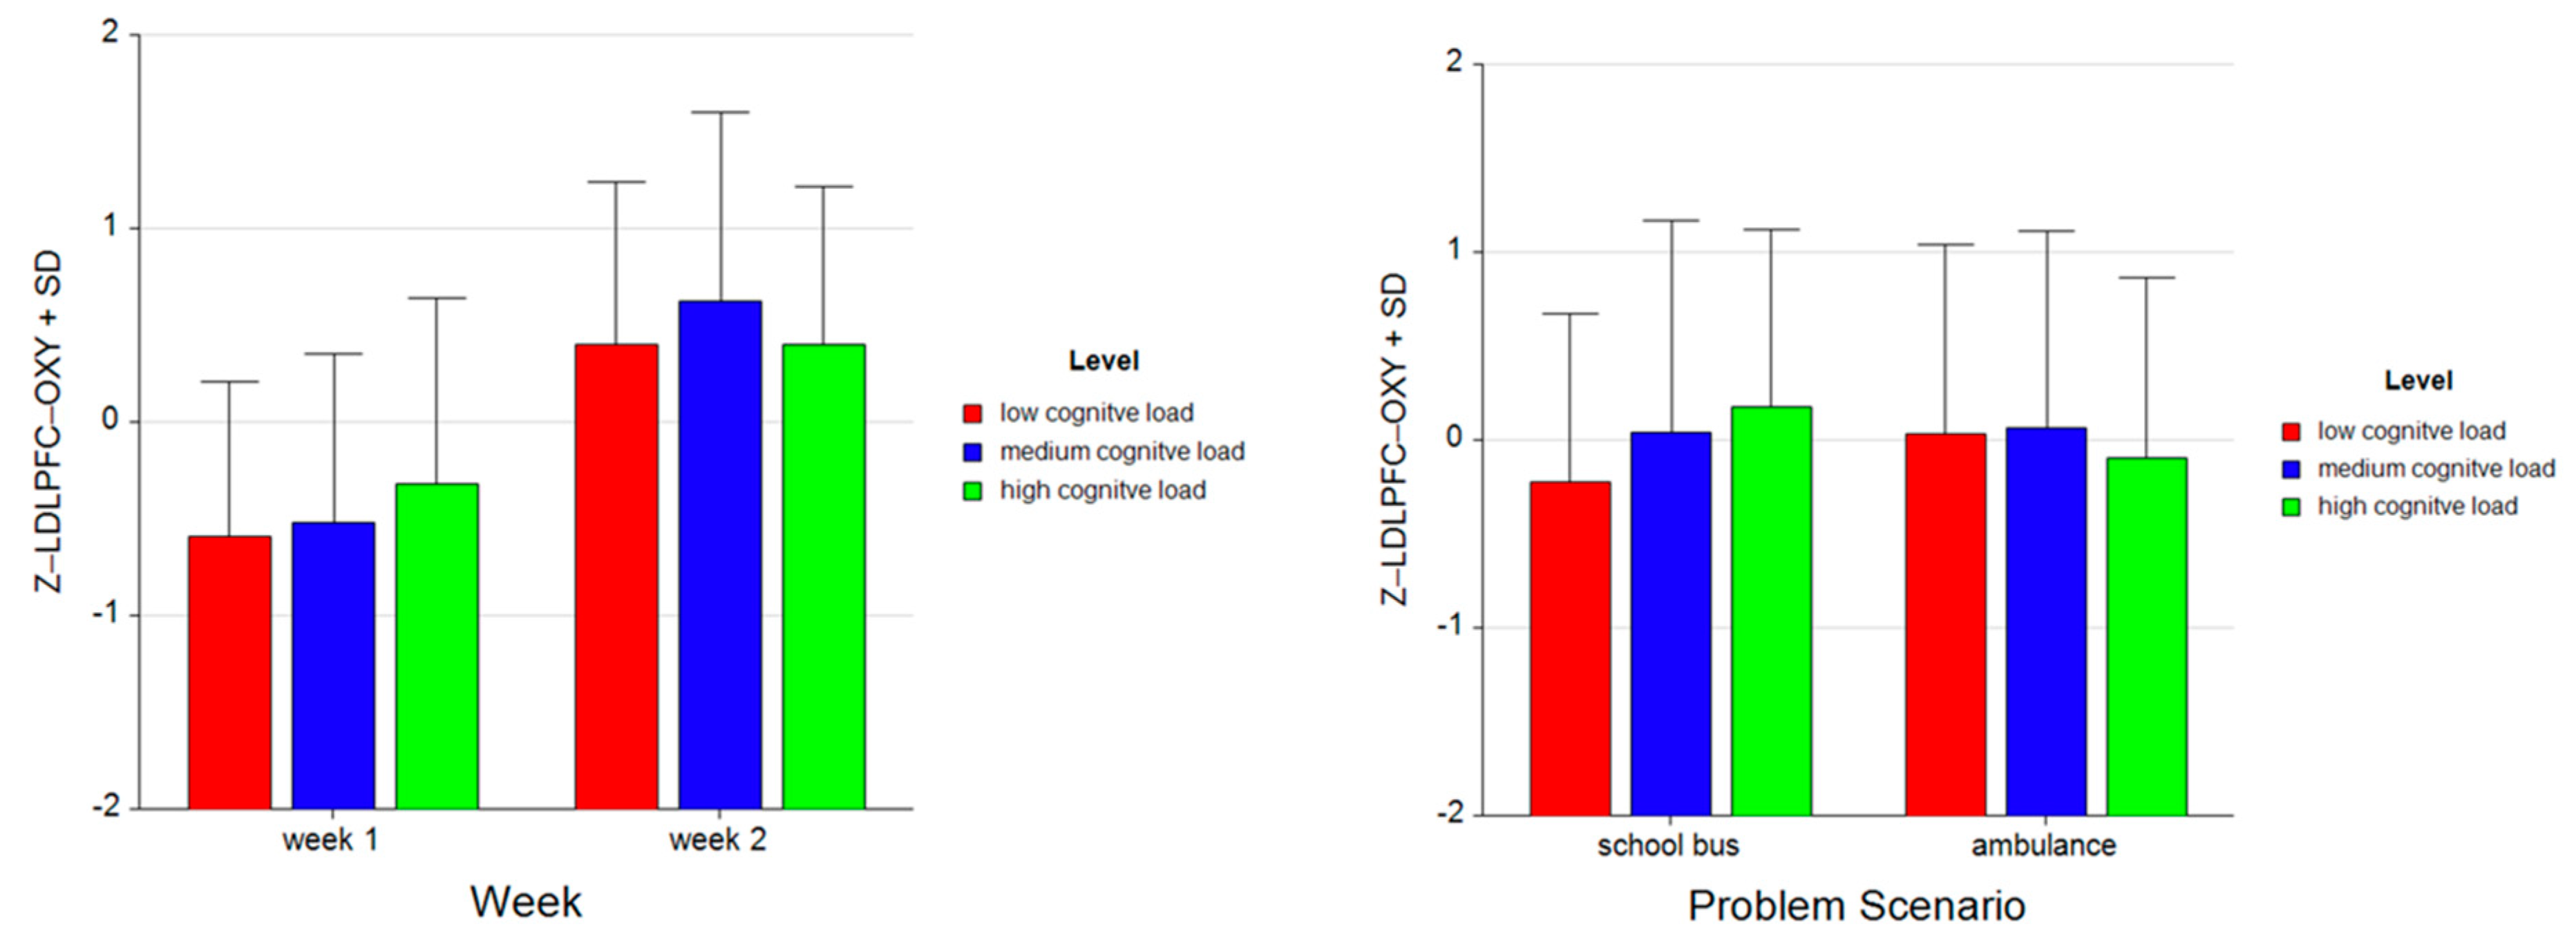
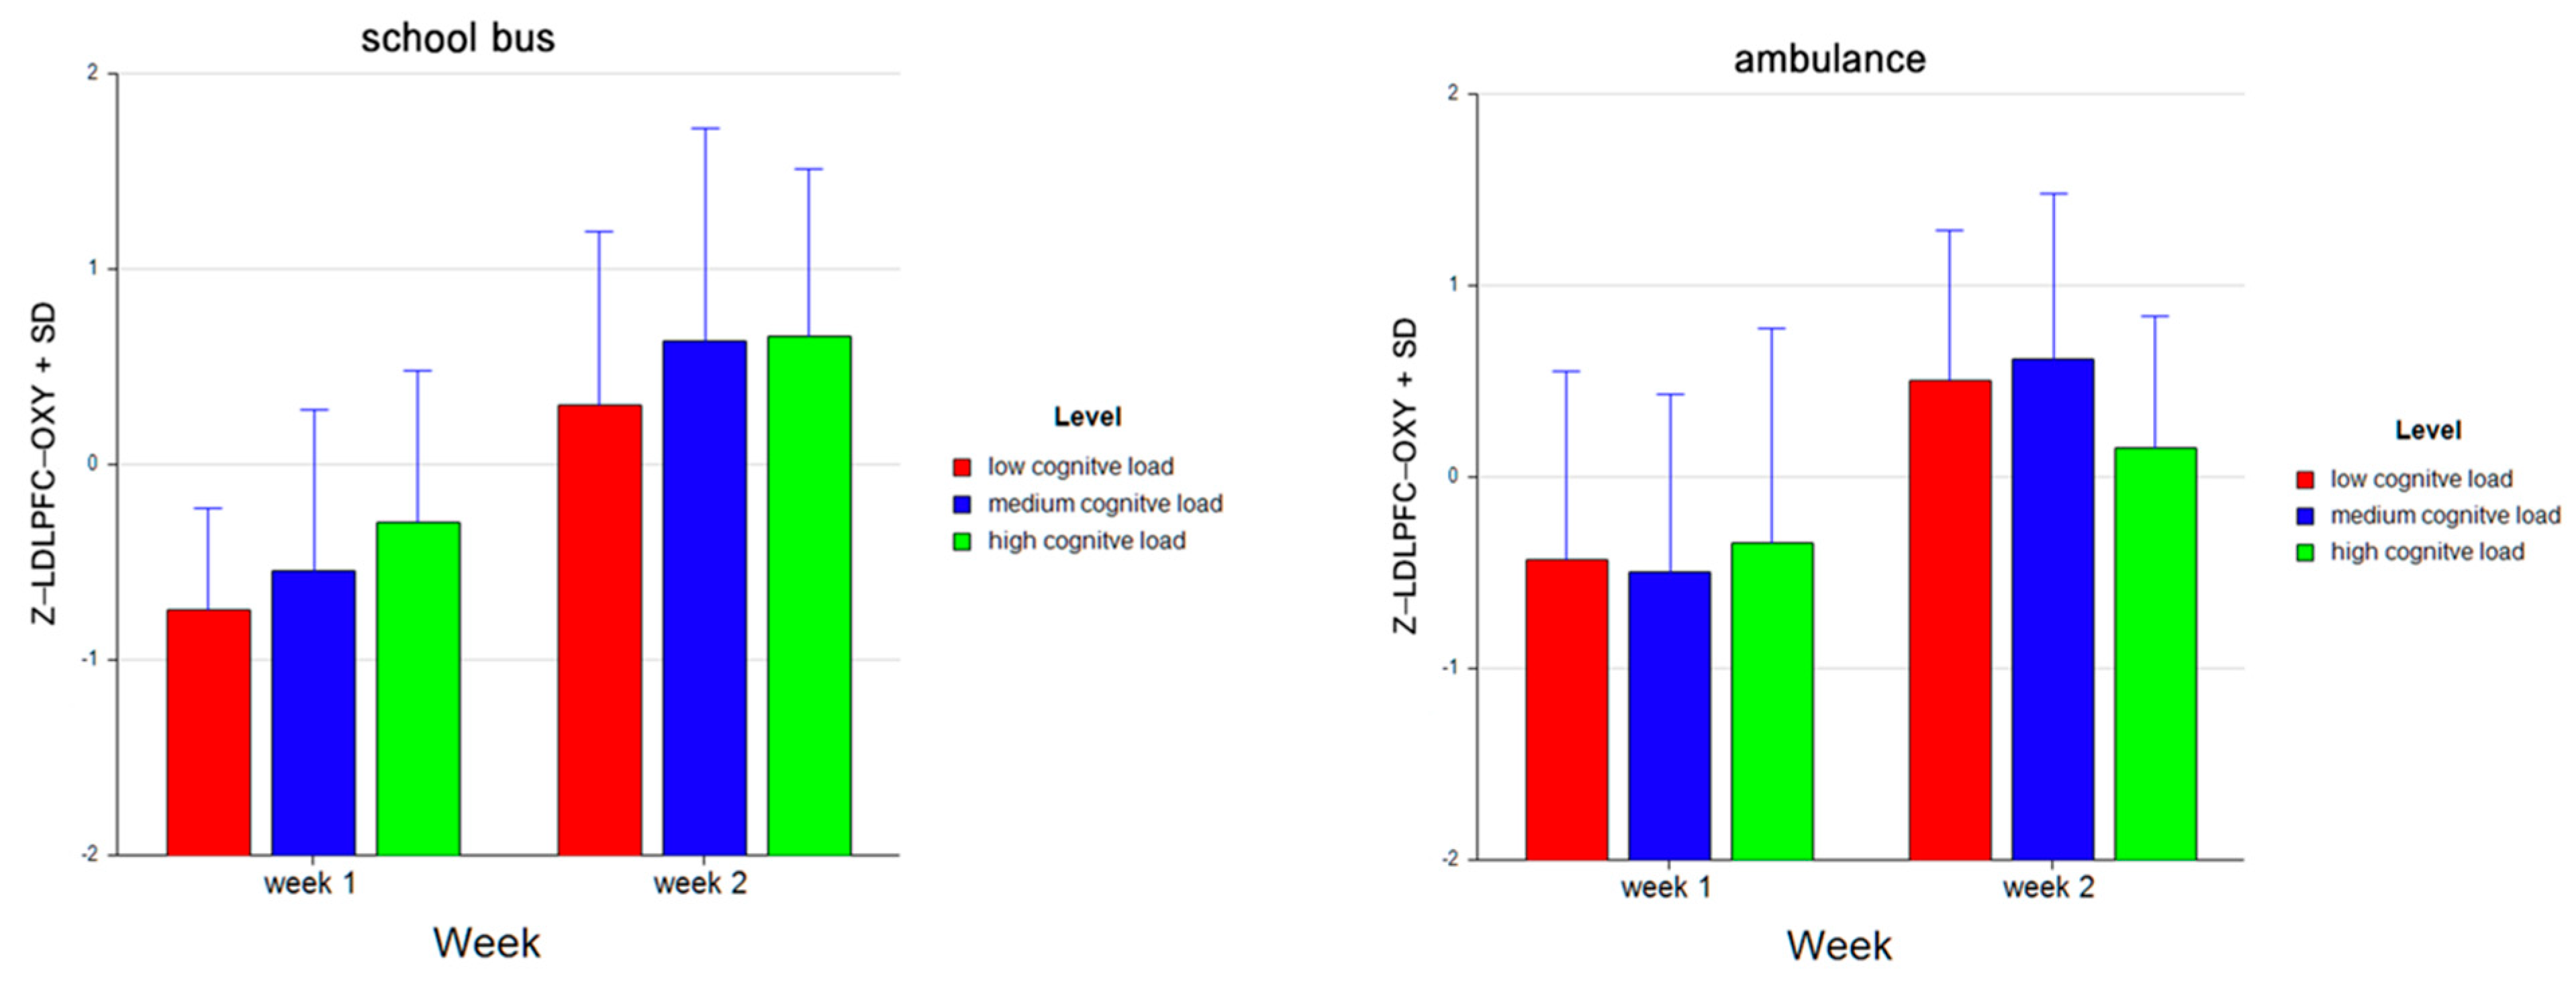
| Z_LDLPFC | −0.745 ± 0.518 | −0.542 ± 0.824 | −0.294 ± 0.775 | −0.435 ± 0.989 | −0.496 ± 0.930 | −0.342 ± 1.121 |
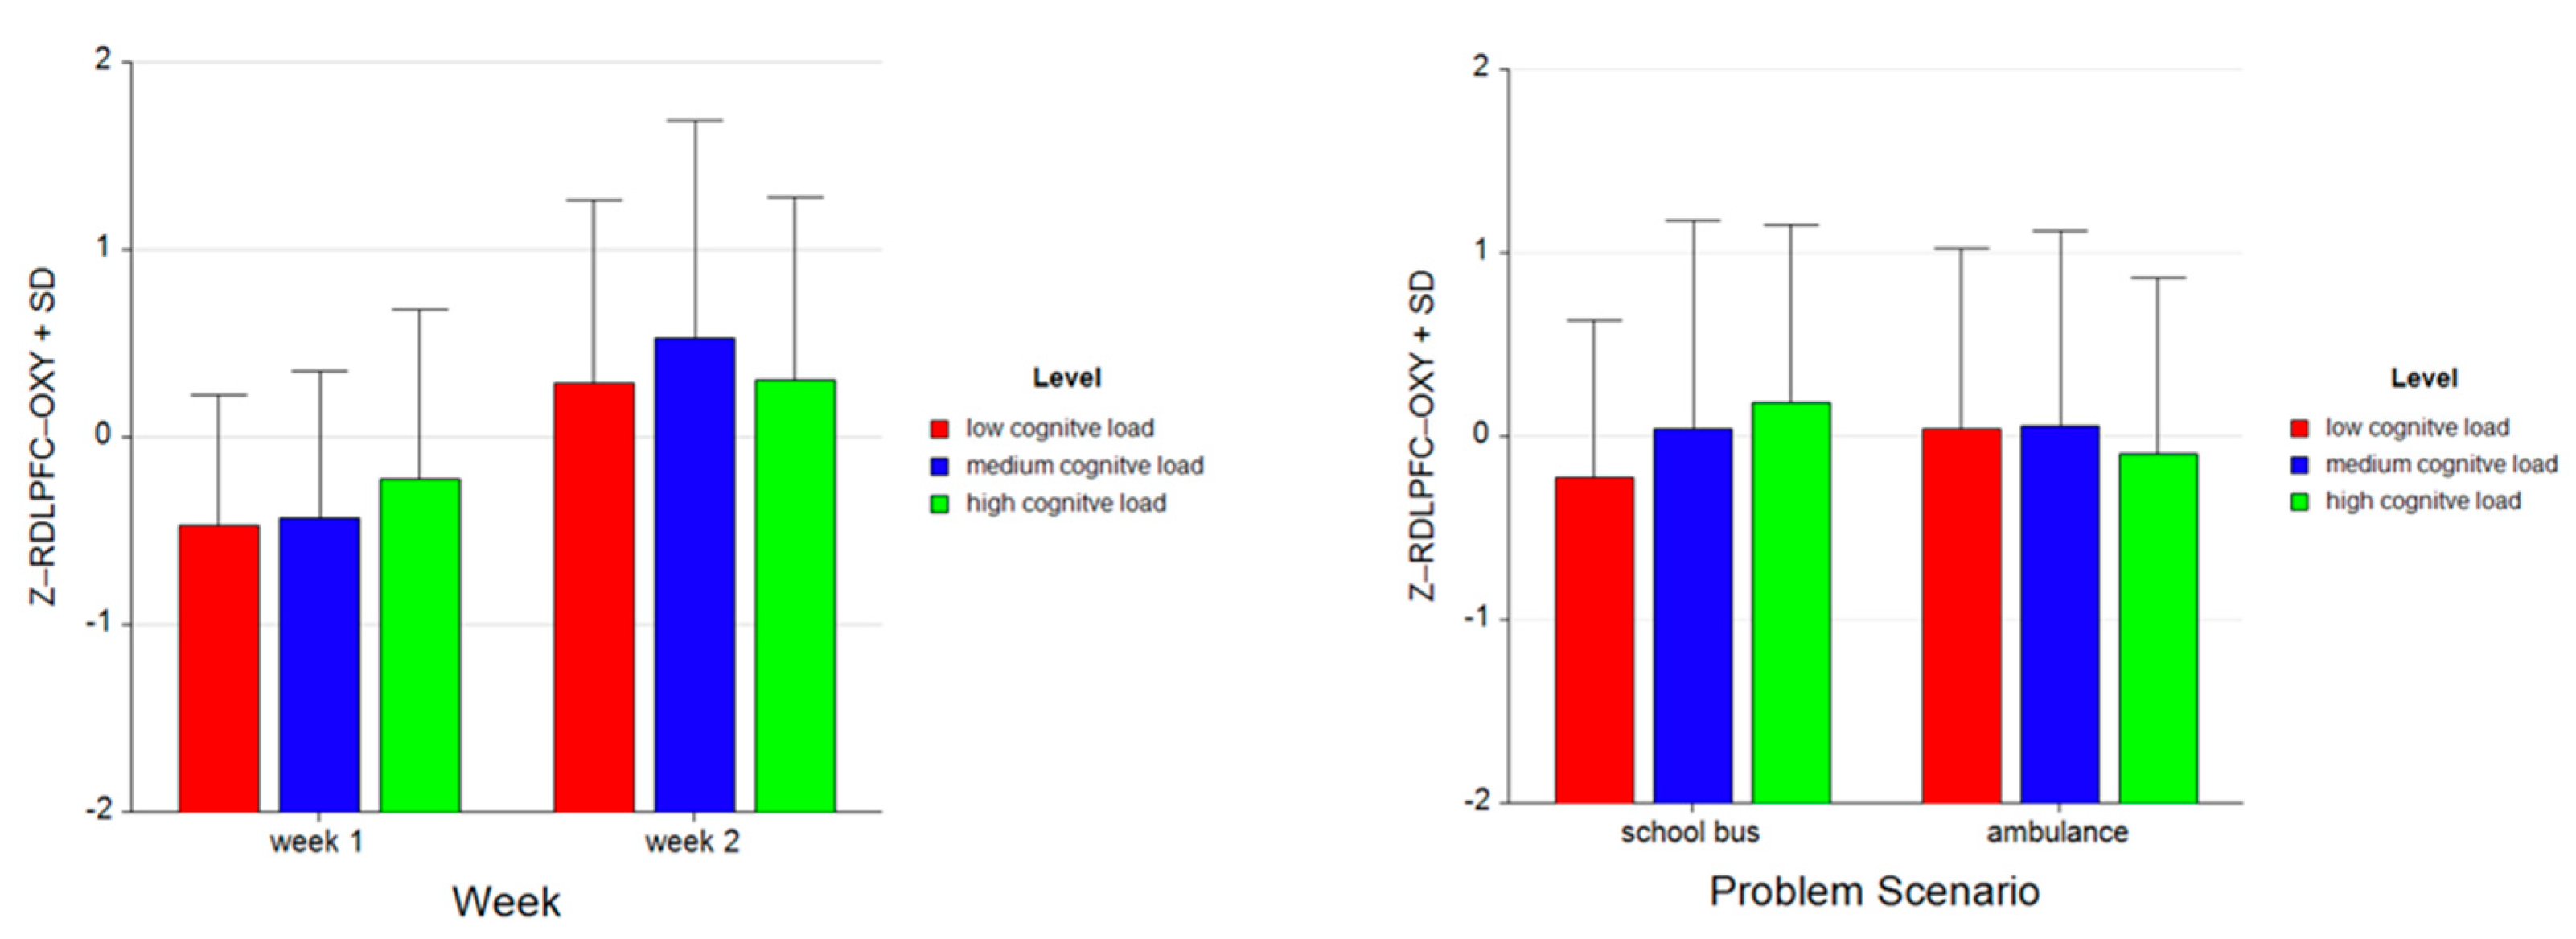
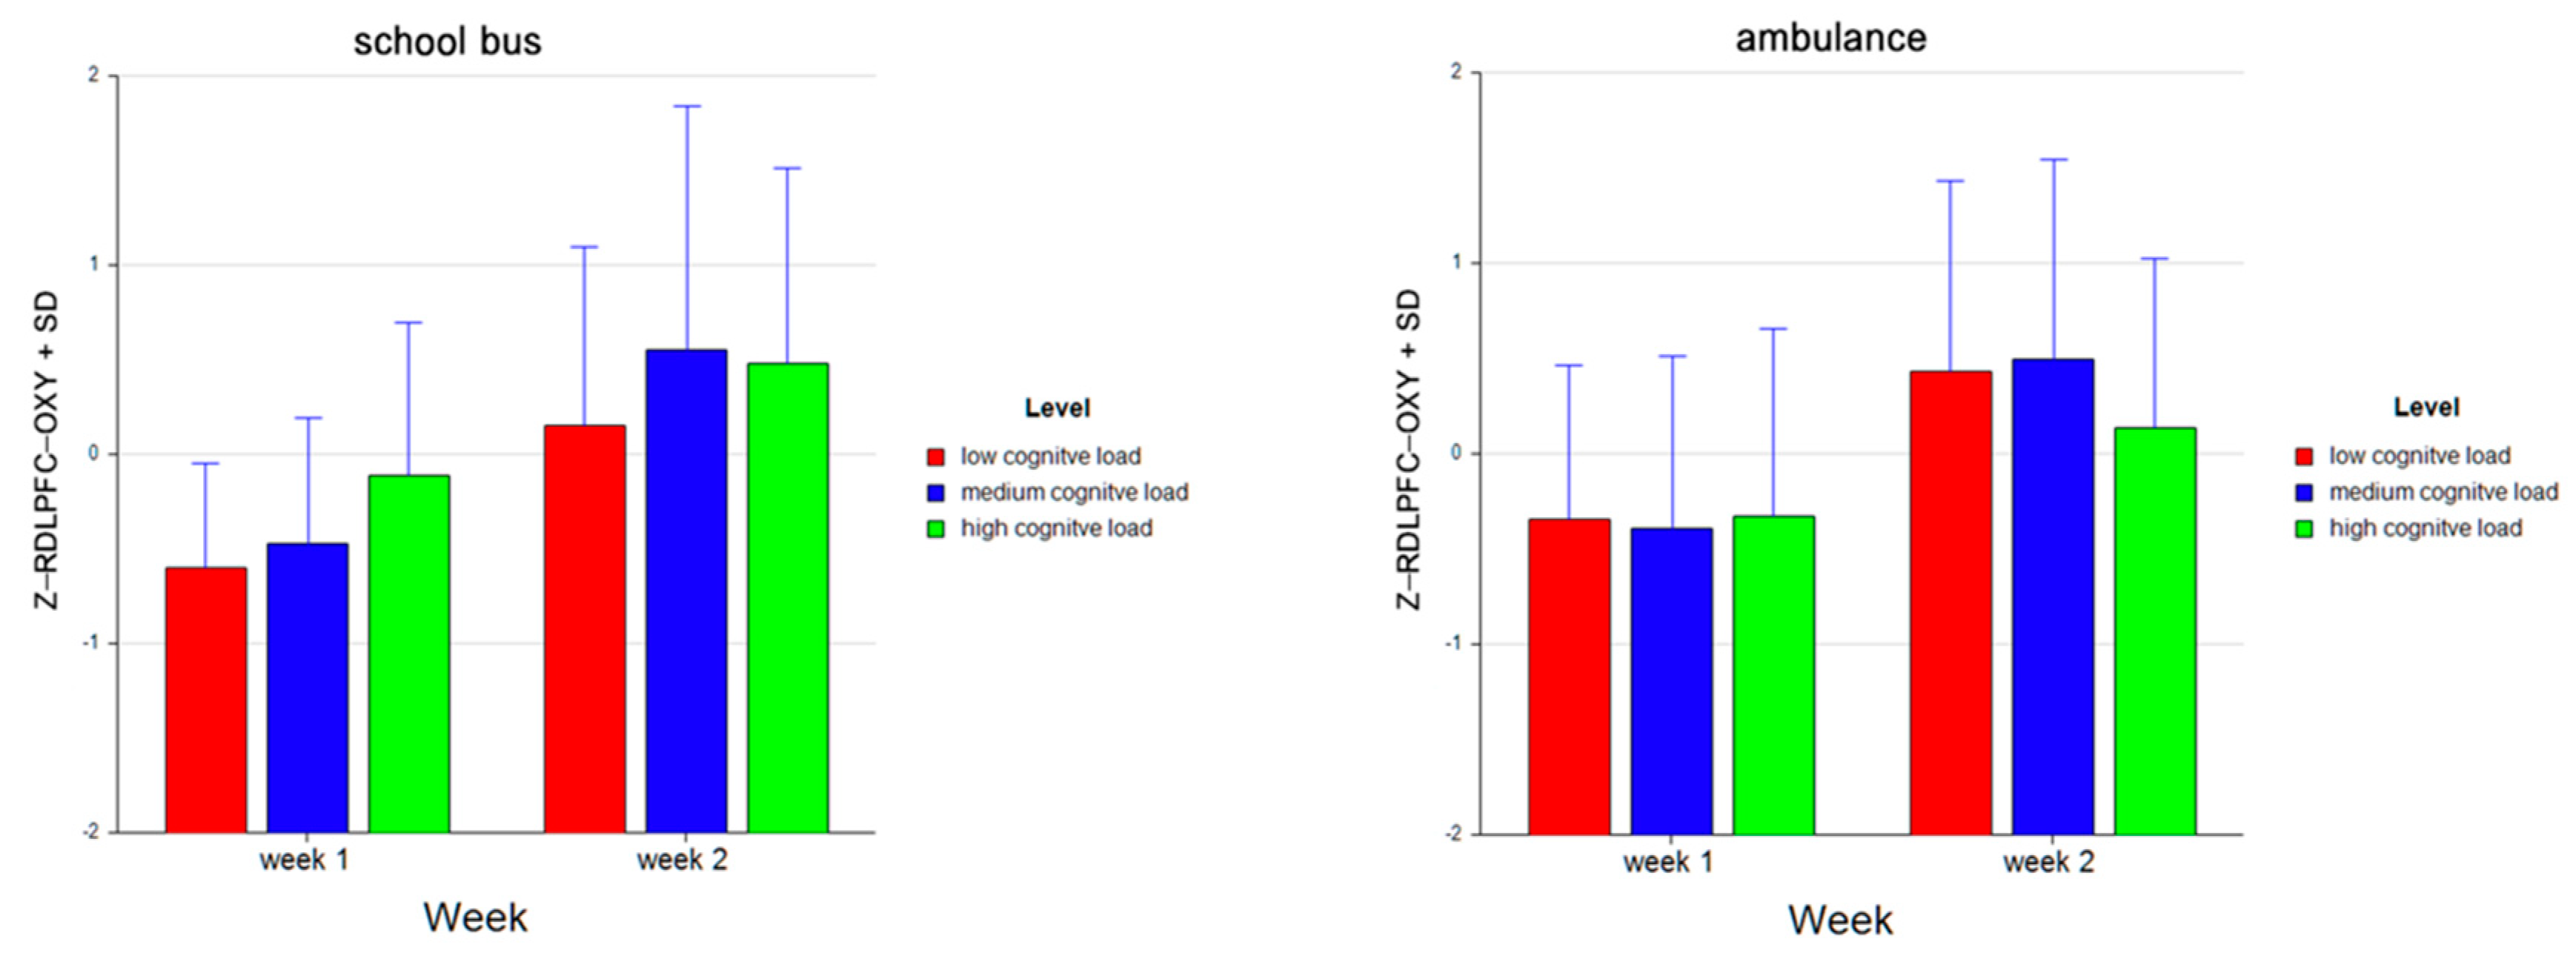
| Z_RDLPFC | −0.602 ± 0.551 | −0.471 ± 0.660 | −0.110 ± 0.807 | −0.340 ± 0.806 | −0.388 ± 0.902 | −0.330 ± 0.988 |
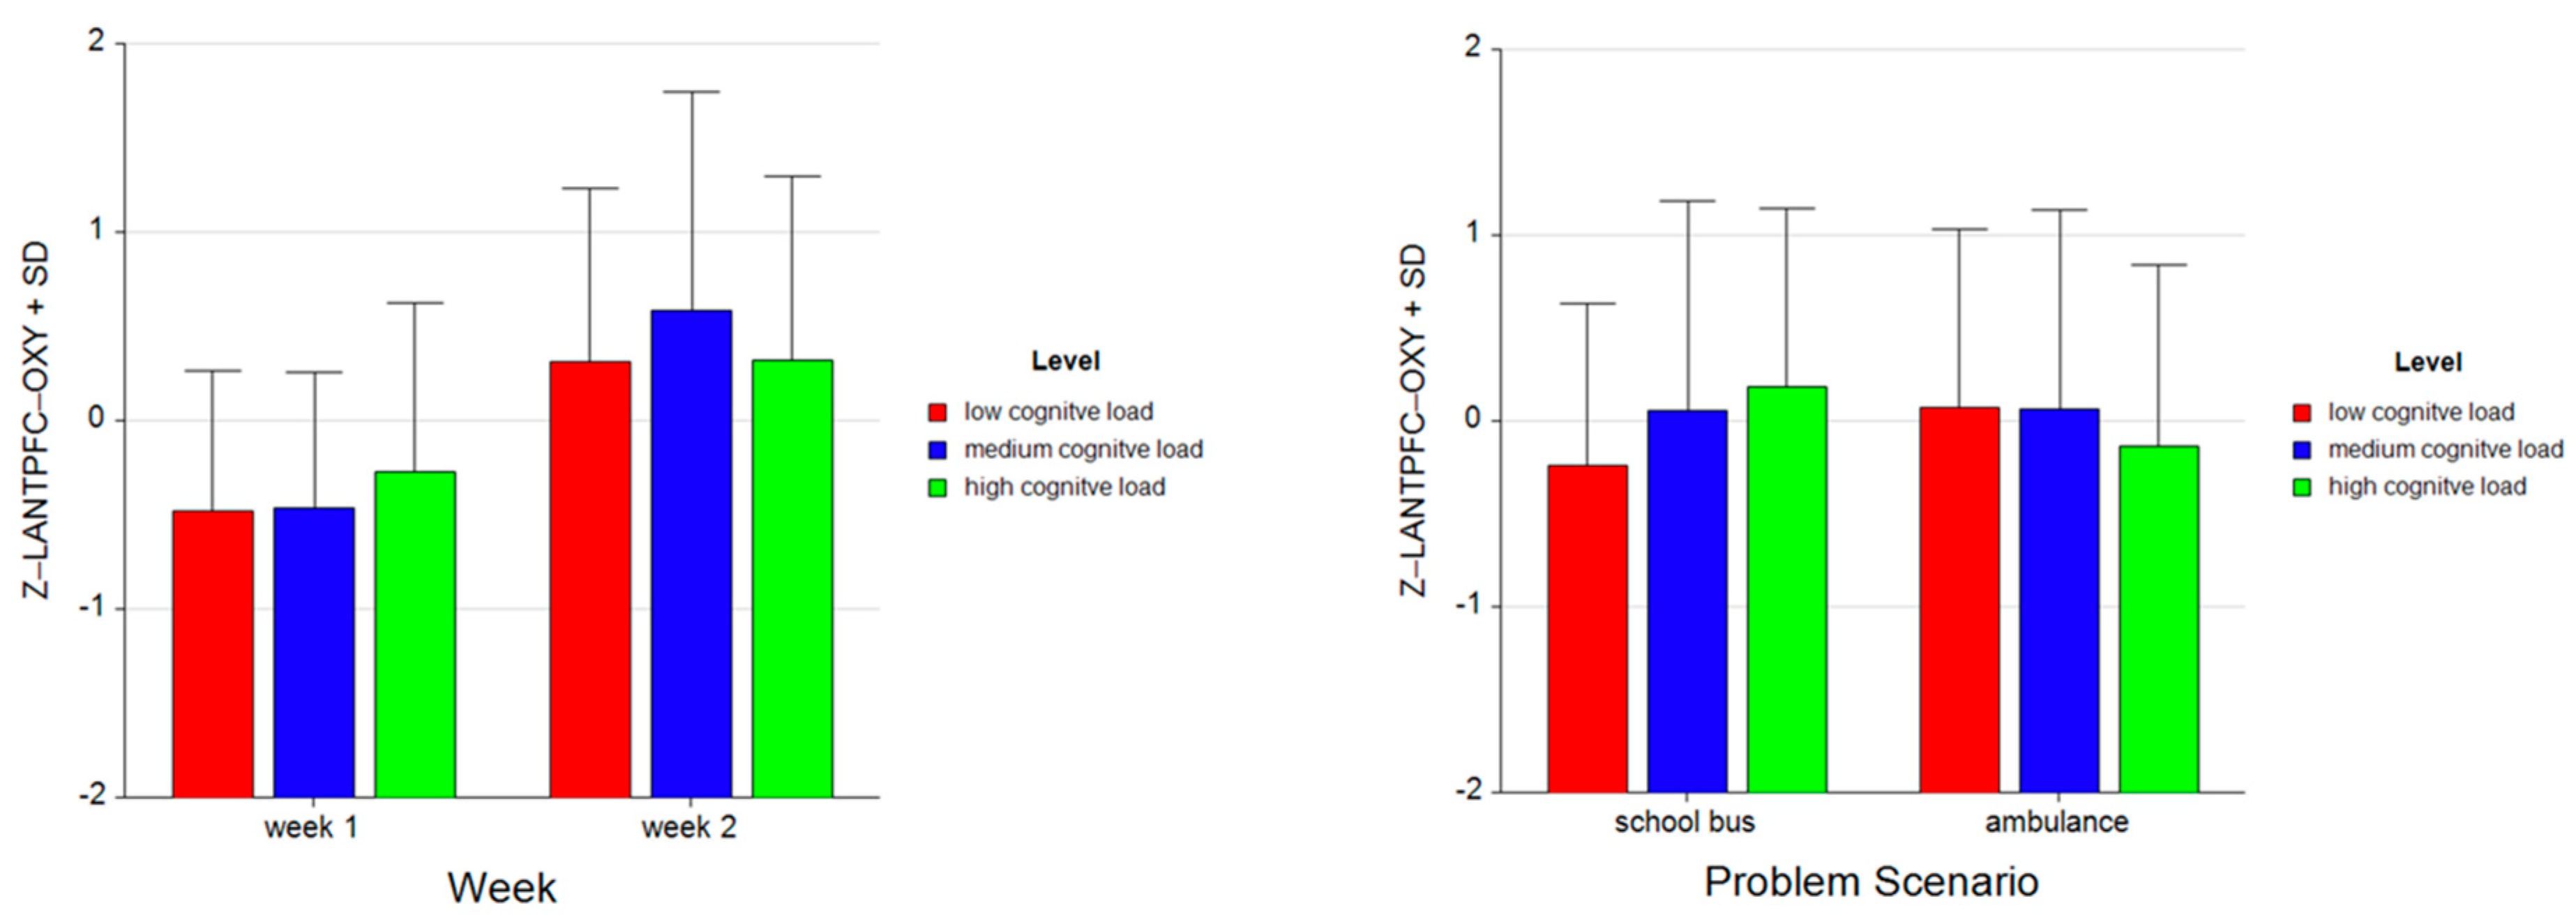
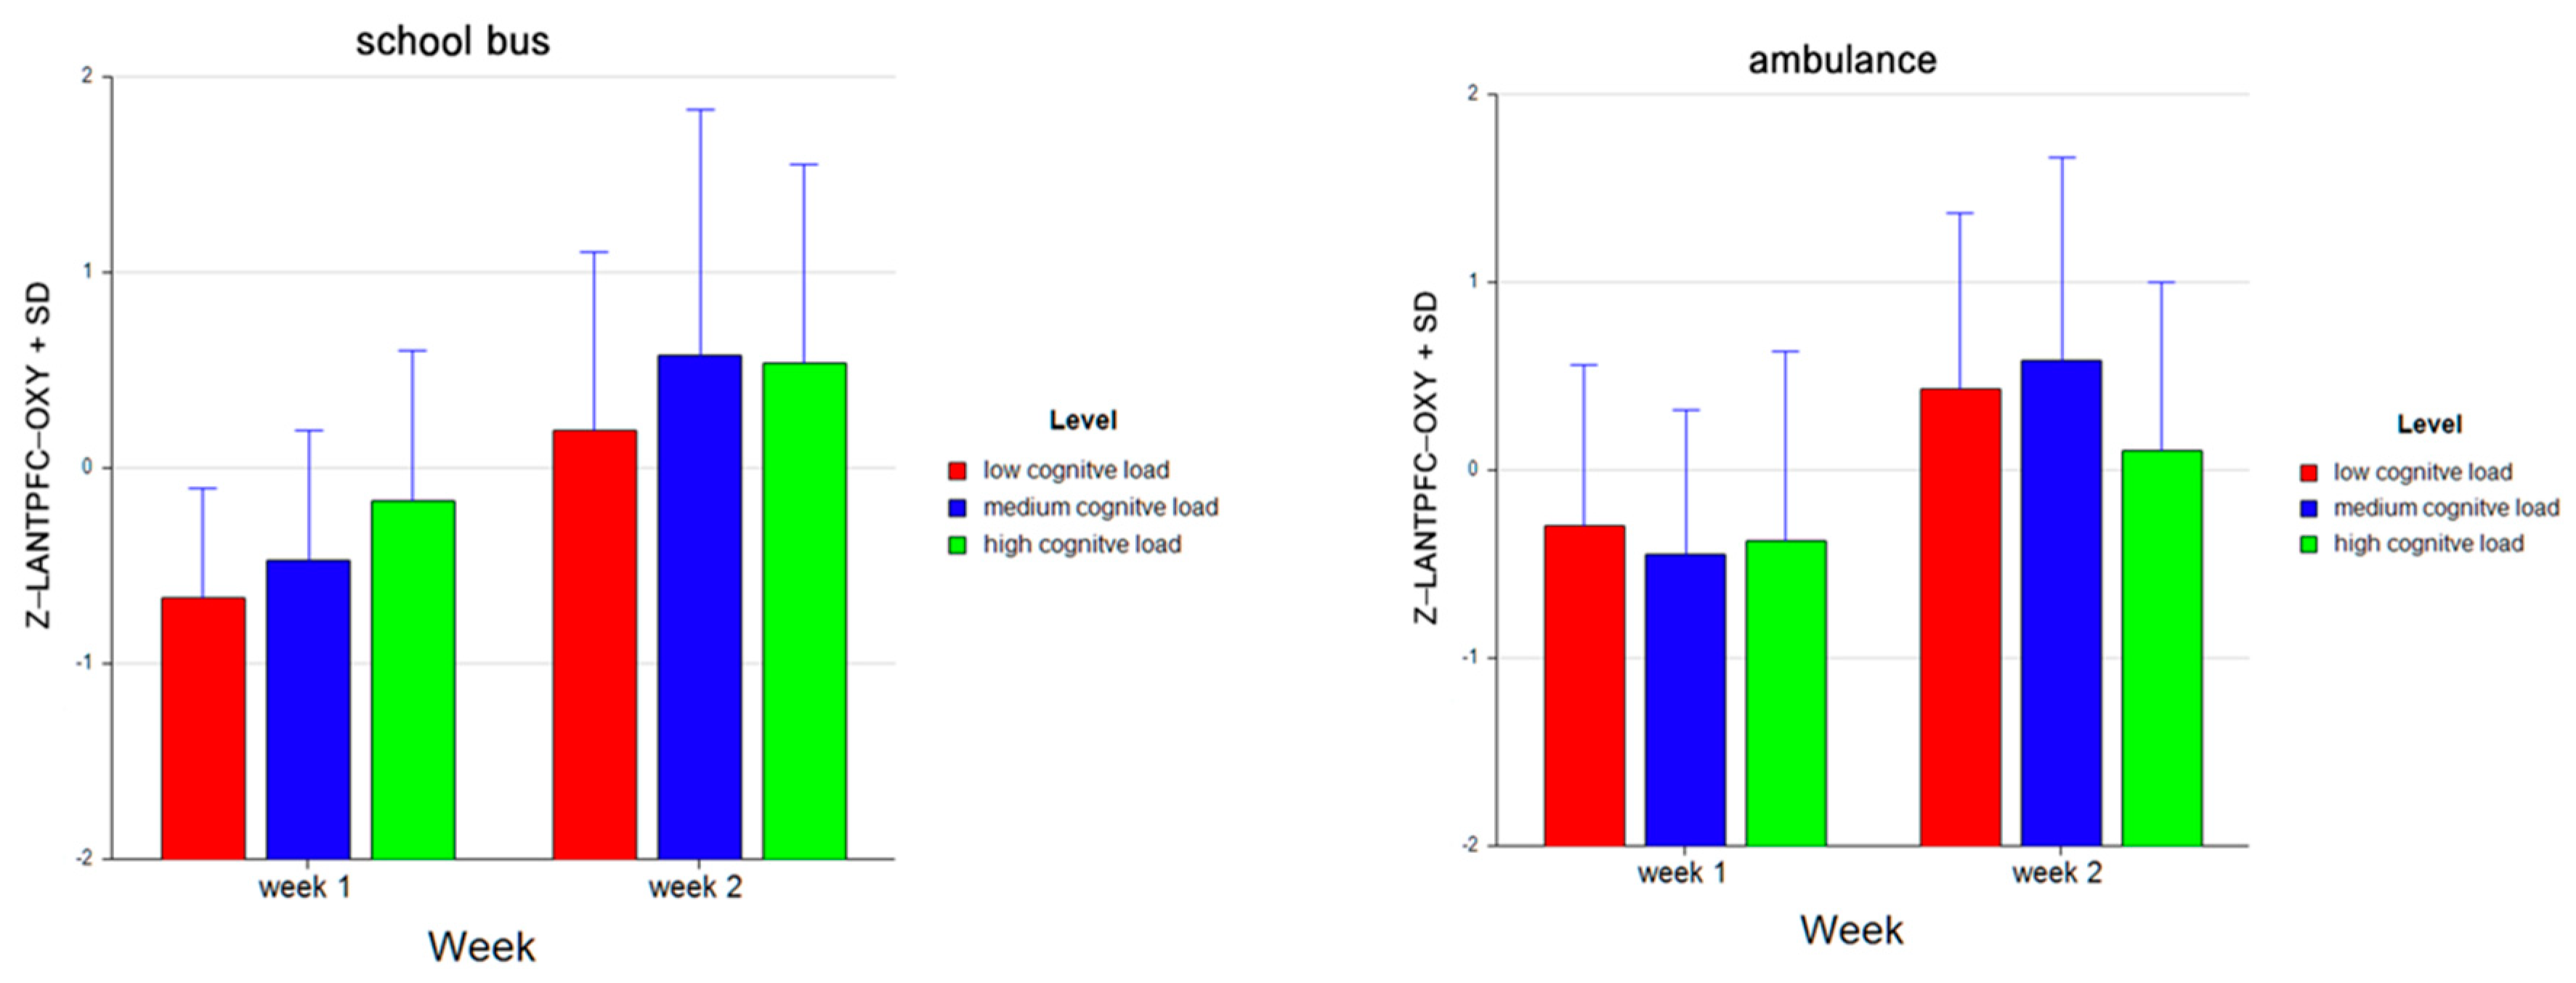
| Z_LANTPFC | −0.661 ± 0.554 | −0.469 ± 0.664 | −0.169 ± 0.773 | −0.292 ± 0.854 | −0.451 ± 0.775 | −0.375 ± 1.007 |
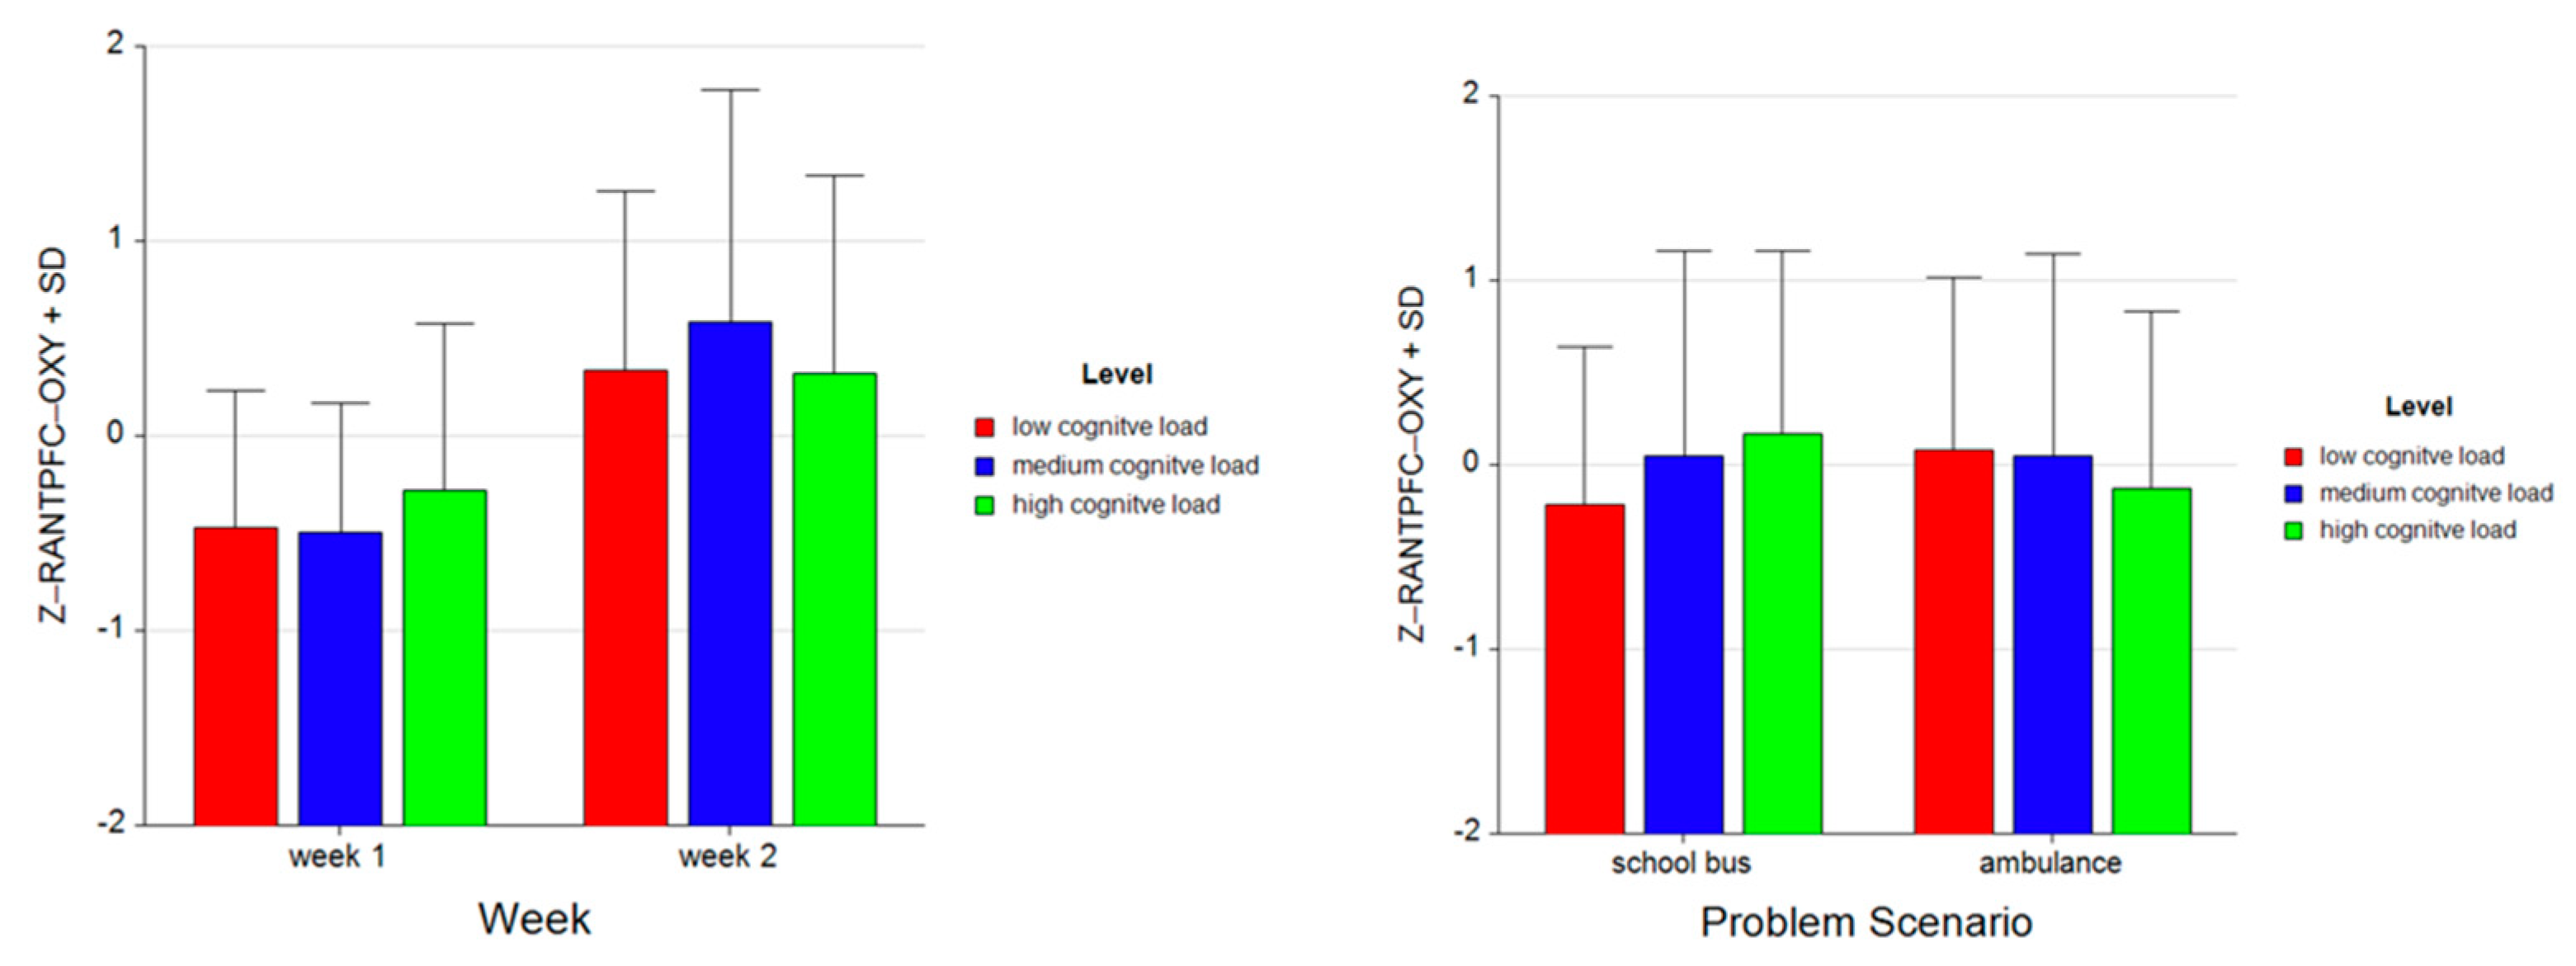
| Z_RANTPFC | −0.644 ± 0.493 | −0.511 ± 0.491 | −0.197 ± 0.708 | −0.292 ± 0.827 | −0.474 ± 0.803 | −0.364 ± 0.991 |
| DV | Week 2 Mean ± SD | |||||
|---|---|---|---|---|---|---|
| School Bus | Ambulance | |||||
| Low | Mid | High | Low | Mid | High | |
| Z_RT | −0.642 ± 0.129 | −0.3948 ± 0.409 | 0.117 ± 1.156 | −0.549 ± 1.067 | −0.449 ± 0.527 | 0.178 ± 0.772 |
| Z_TT | −0.800 ± 0.113 | −0.673 ± 0.261 | 0.498 ± 0.672 | −1.159 ± 0.457 | 0.172 ± 0.382 | 0.141 ± 0.412 |
| Z_LDLPFC | −0.222 ± 0.894 | 0.043 ± 1.126 | 0.179 ± 0.941 | 0.033 ± 1.003 | 0.060 ± 1.051 | −0.093 ± 0.955 |
| Z_RDLPFC | −0.224 ± 0.853 | 0.040 ± 1.137 | 0.184 ± 0.964 | 0.044 ± 0.979 | 0.054 ± 1.067 | −0.098 ± 0.961 |
| Z_LANTPFC | −0.236 ± 0.864 | 0.054 ± 1.126 | 0.181 ± 0.964 | 0.068 ± 0.960 | 0.066 ± 1.069 | −0.134 ± 0.972 |
| Z_RANTPFC | −0.214 ± 0.856 | 0.046 ± 1.112 | 0.169 ± 0.994 | 0.079 ± 0.941 | 0.048 ± 1.099 | −0.127 ± 0.958 |
References
- Liang, L.-Y.; Shewokis, P.A.; Getchell, N. Brain Activation in the Prefrontal Cortex during Motor and Cognitive Tasks in Adults. J. Behav. Brain Sci. 2016, 6, 463–474. [Google Scholar] [CrossRef]
- De Neys, W.; Goel, V. Heuristics and biases in the brain: Dual neural pathways decision making. In Neuroscience of Decision Making; Psychology Press: Hove, UK, 2011; pp. 137–154. [Google Scholar]
- Bonnelle, V.; Leech, R.; Kinnunen, K.M.; Ham, T.E.; Beckmann, C.F.; De Boissezon, X.; Greenwood, R.J.; Sharp, D.J. Default Mode Network Connectivity Predicts Sustained Attention Deficits after Traumatic Brain Injury. J. Neurosci. 2011, 31, 13442–13451. [Google Scholar] [CrossRef] [PubMed]
- Shewokis, P.A.; Ayaz, H.; Panait, L.; Liu, Y.; Syed, M.; Greenawald, L.; Shariff, F.U.; Castellanos, A.; Lind, D.S. Brain-in-the-loop learning using fNIR and simulated virtual reality surgical tasks: Hemodynamic and behavioral effects. In Foundations of Augmented Cognition; Schmorrow, D., Fidopiastis, C., Eds.; Springer: Berlin/Heidelberg, Germany, 2015; Volume 9183, pp. 324–355. [Google Scholar]
- Liu, Y.; Ayaz, H.; Shewokis, P.A. Mental workload classification with concurrent electroencephalography and functional near-infrared spectroscopy. Brain-Comput. Interfaces 2017, 78, 1–11. [Google Scholar] [CrossRef]
- Shewokis, P.A.; Shariff, F.U.; Liu, Y.; Ayaz, H.; Castellanos, A.; Lind, D.S. Acquisition, retention and transfer of simulated laparoscopic tasks using fNIR and a contextual interference paradigm. Am. J. Surg. 2017, 213, 336–345. [Google Scholar] [CrossRef]
- Geake, J.; Hansen, P.C. Neural correlates of intelligence as revealed by fMRI of fluid analogies. NeuroImage 2005, 26, 555–564. [Google Scholar] [CrossRef]
- Christoff, K.; Gabrieli, J.D. The frontopolar cortex and human cognition: Evidence for a rostrocaudal hierarchical organization within the human prefrontal cortex. Psychobiology 2000, 28, 168–186. [Google Scholar]
- Paas, F.; Renkl, A.; Sweller, J. Cognitive Load Theory and Instructional Design: Recent Developments. Educ. Psychol. 2003, 38, 1–4. [Google Scholar] [CrossRef]
- Sweller, J.; Van Merriënboer, J.J.G.; Paas, F. Cognitive Architecture and Instructional Design: 20 Years Later. Educ. Psychol. Rev. 2019, 31, 261–292. [Google Scholar] [CrossRef]
- Paas, F.; Renkl, A.; Sweller, J. Cognitive Load Theory: Instructional Implications of the Interaction between Information Structures and Cognitive Architecture. Instr. Sci. 2004, 32, 1–8. [Google Scholar] [CrossRef]
- Sweller, J. Cognitive load theory, learning difficulty, and instructional design. Learn. Instr. 1994, 4, 295–312. [Google Scholar] [CrossRef]
- Van Merriënboer, J.J.; Sweller, J. Cognitive load theory in health professional education: Design principles and strategies. Med. Educ. 2010, 44, 85–93. [Google Scholar] [CrossRef] [PubMed]
- Van Merriënboer, J.J.G.; Kester, L.; Paas, F. Teaching complex rather than simple tasks: Balancing intrinsic and germane load to enhance transfer of learning. Appl. Cogn. Psychol. 2006, 20, 343–352. [Google Scholar] [CrossRef]
- Van Merrienboer, J.J.; Sweller, J. Cognitive load theory and complex learning: Recent developments and future directions. Educ. Psychol. Rev. 2005, 17, 147–177. [Google Scholar] [CrossRef]
- Van Merriënboer, J.J.; Ayres, P. Research on cognitive load theory and its design implications for e-learning. Educ. Technol. Res. Dev. 2005, 53, 5–13. [Google Scholar] [CrossRef]
- Van Gog, T.; Kirschner, F.; Kester, L.; Paas, F. Timing and Frequency of Mental Effort Measurement: Evidence in Favour of Repeated Measures. Appl. Cogn. Psychol. 2012, 26, 833–839. [Google Scholar] [CrossRef]
- Schmeck, A.; Opfermann, M.; Van Gog, T.; Paas, F.; Leutner, D. Measuring cognitive load with subjective rating scales during problem solving: Differences between immediate and delayed ratings. Instr. Sci. 2014, 43, 93–114. [Google Scholar] [CrossRef]
- Izzetoglu, K.; Ayaz, H.; Merzagora, A.; Izzetoglu, M.; Shewokis, P.A.; Bunce, S.C.; Pourrezaei, K.; Rosen, A.; Onaral, B. The Evolution of Field Deployable Fnir Spectroscopy from Bench to Clinical Settings. J. Innov. Opt. Heal. Sci. 2011, 4, 239–250. [Google Scholar] [CrossRef]
- Shewokis, P.A.; Ayaz, H.; Curtin, A.; Izzetoglu, K.; Onaral, B. Brain in the loop learning using functional near infrared spectroscopy. In International Conference on Augmented Cognition; Springer: Berlin/Heidelberg, Germany, 2013; pp. 381–389. [Google Scholar]
- Ikegami, T.; Taga, G. Decrease in cortical activation during learning of a multi-joint discrete motor task. Exp. Brain Res. 2008, 191, 221–236. [Google Scholar] [CrossRef]
- Izzetoglu, M.; Izzetoglu, K.; Bunce, S.; Ayaz, H.; Devaraj, A.; Onaral, B.; Pourrezaei, K. Functional near-infrared neuroimaging. IEEE Trans. Neural Syst. Rehabil. Eng. IEEE Eng. Med. Biol. Soc. 2005, 13, 153–159. [Google Scholar] [CrossRef]
- Ayaz, H.; Onaral, B.; Izzetoglu, K.; Shewokis, P.A.; McKendrick, R.; Parasuraman, R. Continuous monitoring of brain dynamics with functional near infrared spectroscopy as a tool for neuroergonomic research: Empirical examples and a technological development. Front. Hum. Neurosci. 2013, 7, 871. [Google Scholar] [CrossRef]
- Izzetoglu, M.; Holtzer, R. Effects of Processing Methods on fNIRS Signals Assessed during Active Walking Tasks in Older Adults. IEEE Trans. Neural Syst. Rehabil. Eng. 2020, 28, 699–709. [Google Scholar] [CrossRef] [PubMed]
- Fishburn, F.A.; Norr, M.E.; Medvedev, A.V.; Vaidya, C.J. Sensitivity of fNIRS to cognitive state and load. Front. Hum. Neurosci. 2014, 8, 76. [Google Scholar] [CrossRef] [PubMed]
- Ayaz, H.; Shewokis, P.A.; Bunce, S.C.; Izzetoglu, K.; Willems, B.; Onaral, B. Optical brain monitoring for operator training and mental workload assessment. NeuroImage 2012, 59, 36–47. [Google Scholar] [CrossRef] [PubMed]
- Gentili, R.J.; Shewokis, P.A.; Ayaz, H.; Contreras-Vidal, J.L. Functional near-infrared spectroscopy-based correlates of prefrontal cortical dynamics during a cognitive-motor executive adaptation task. Front. Hum. Neurosci. 2013, 7, 277. [Google Scholar] [CrossRef] [PubMed]
- Ayaz, H.; Shewokis, P.A.; Curtin, A.; Izzetoglu, M.; Izzetoglu, K.; Onaral, B. Using MazeSuite and functional near infrared spectroscopy to study learning in spatial navigation. JoVE J. Vis. Exp. 2011, e3443. [Google Scholar] [CrossRef] [PubMed]
- Gagne, R.M. Contributions of learning to human development. Psychol. Rev. 2006, 75, 177–191. [Google Scholar] [CrossRef][Green Version]
- Royer, J.M.; Mestre, J.P.; Dufresne, R.J. Introduction: Framing the transfer problem. In Transfer of Learning from a Modern Multidisciplinary Perspective; Mestre, J.P., Ed.; Information Age Publishing: Charlotte, NC, USA, 2005; pp. vii–xxvi. [Google Scholar]
- Thorndike, E.L.; Woodworth, R.S. The influence of improvement in one mental function upon the efficiency of other functions: III. Functions involving attention, observation and discrimination. Psychol. Rev. 2006, 8, 553–564. [Google Scholar] [CrossRef]
- Izzetoglu, K.; Bunce, S.; Onaral, B.; Pourrezaei, K.; Chance, B. Functional optical brain imaging using near-infrared during cognitive tasks. Int. J. Hum. Comput. Interact. 2004, 17, 211–227. [Google Scholar] [CrossRef]
- Izzetoglu, K.; Ayaz, H.; Hing, J.T.; Shewokis, P.A.; Bunce, S.C.; Oh, P.; Onaral, B. UAV Operators Workload Assessment by Optical Brain Imaging Technology (fNIR). In Handbook of Unmanned Aerial Vehicles; Valavanis, K.P., Vachtsevanos, G.J., Eds.; Springer: Dordrecht, The Netherlands, 2015. [Google Scholar] [CrossRef]
- Barbey, A.K.; Koenigs, M.; Grafman, J. Dorsolateral prefrontal contributions to human working memory. Cortex 2013, 49, 1195–1205. [Google Scholar] [CrossRef]
- Barbey, A.K.; Krueger, F.; Grafman, J. An evolutionarily adaptive neural architecture for social reasoning. Trends Neurosci. 2009, 32, 603–610. [Google Scholar] [CrossRef]
- Huey, E.D.; Krueger, F.; Grafman, J.; Inagaki, K.; Hatano, G. Representations in the Human Prefrontal Cortex. Curr. Dir. Psychol. Sci. 2006, 15, 167–171. [Google Scholar] [CrossRef]
- Cohen, J. Statistical Power Analysis for the Behavioral Sciences; Academic Press: Cambridge, MA, USA, 2013. [Google Scholar]
- Kole, J.A.; Snyder, H.R.; Brojde, C.L.; Friend, A. What’s the Problem? Familiarity, Working Memory, and Transfer in a Problem- Solving Task. Am. J. Psychol. 2015, 128, 147–157. [Google Scholar] [CrossRef] [PubMed]
- Ngu, B.H.; Yeung, A.S. Fostering analogical transfer: The multiple components approach to algebra word problem solving in a chemistry context. Contemp. Educ. Psychol. 2012, 37, 14–32. [Google Scholar] [CrossRef]
- Hockey, G.R.J. Compensatory control in the regulation of human performance under stress and high workload: A cognitive-energetical framework. Biol. Psychol. 1997, 45, 73–93. [Google Scholar] [CrossRef]

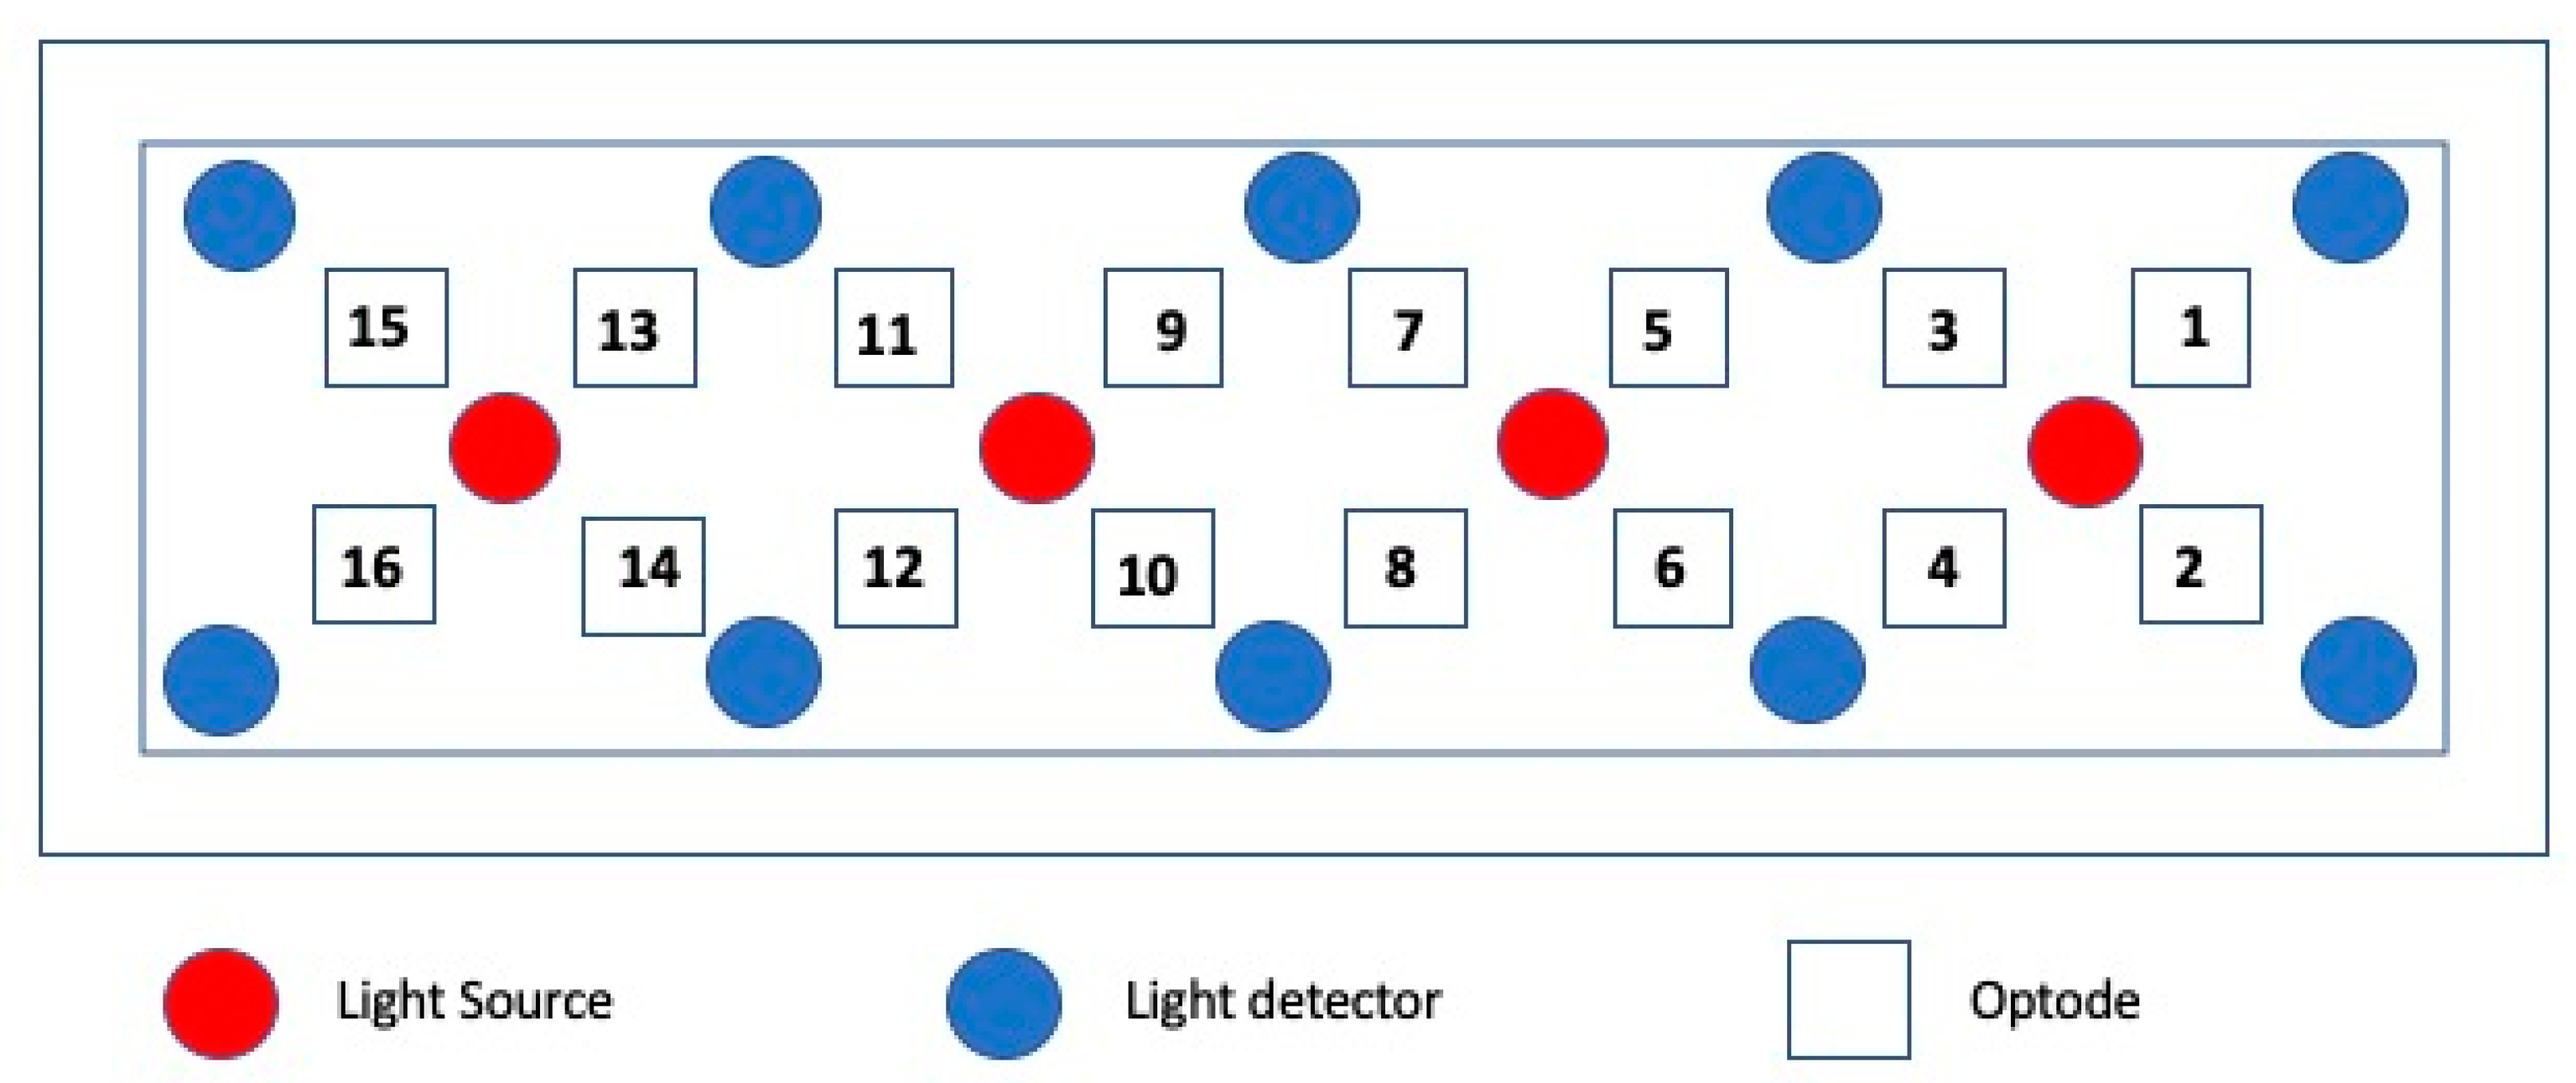
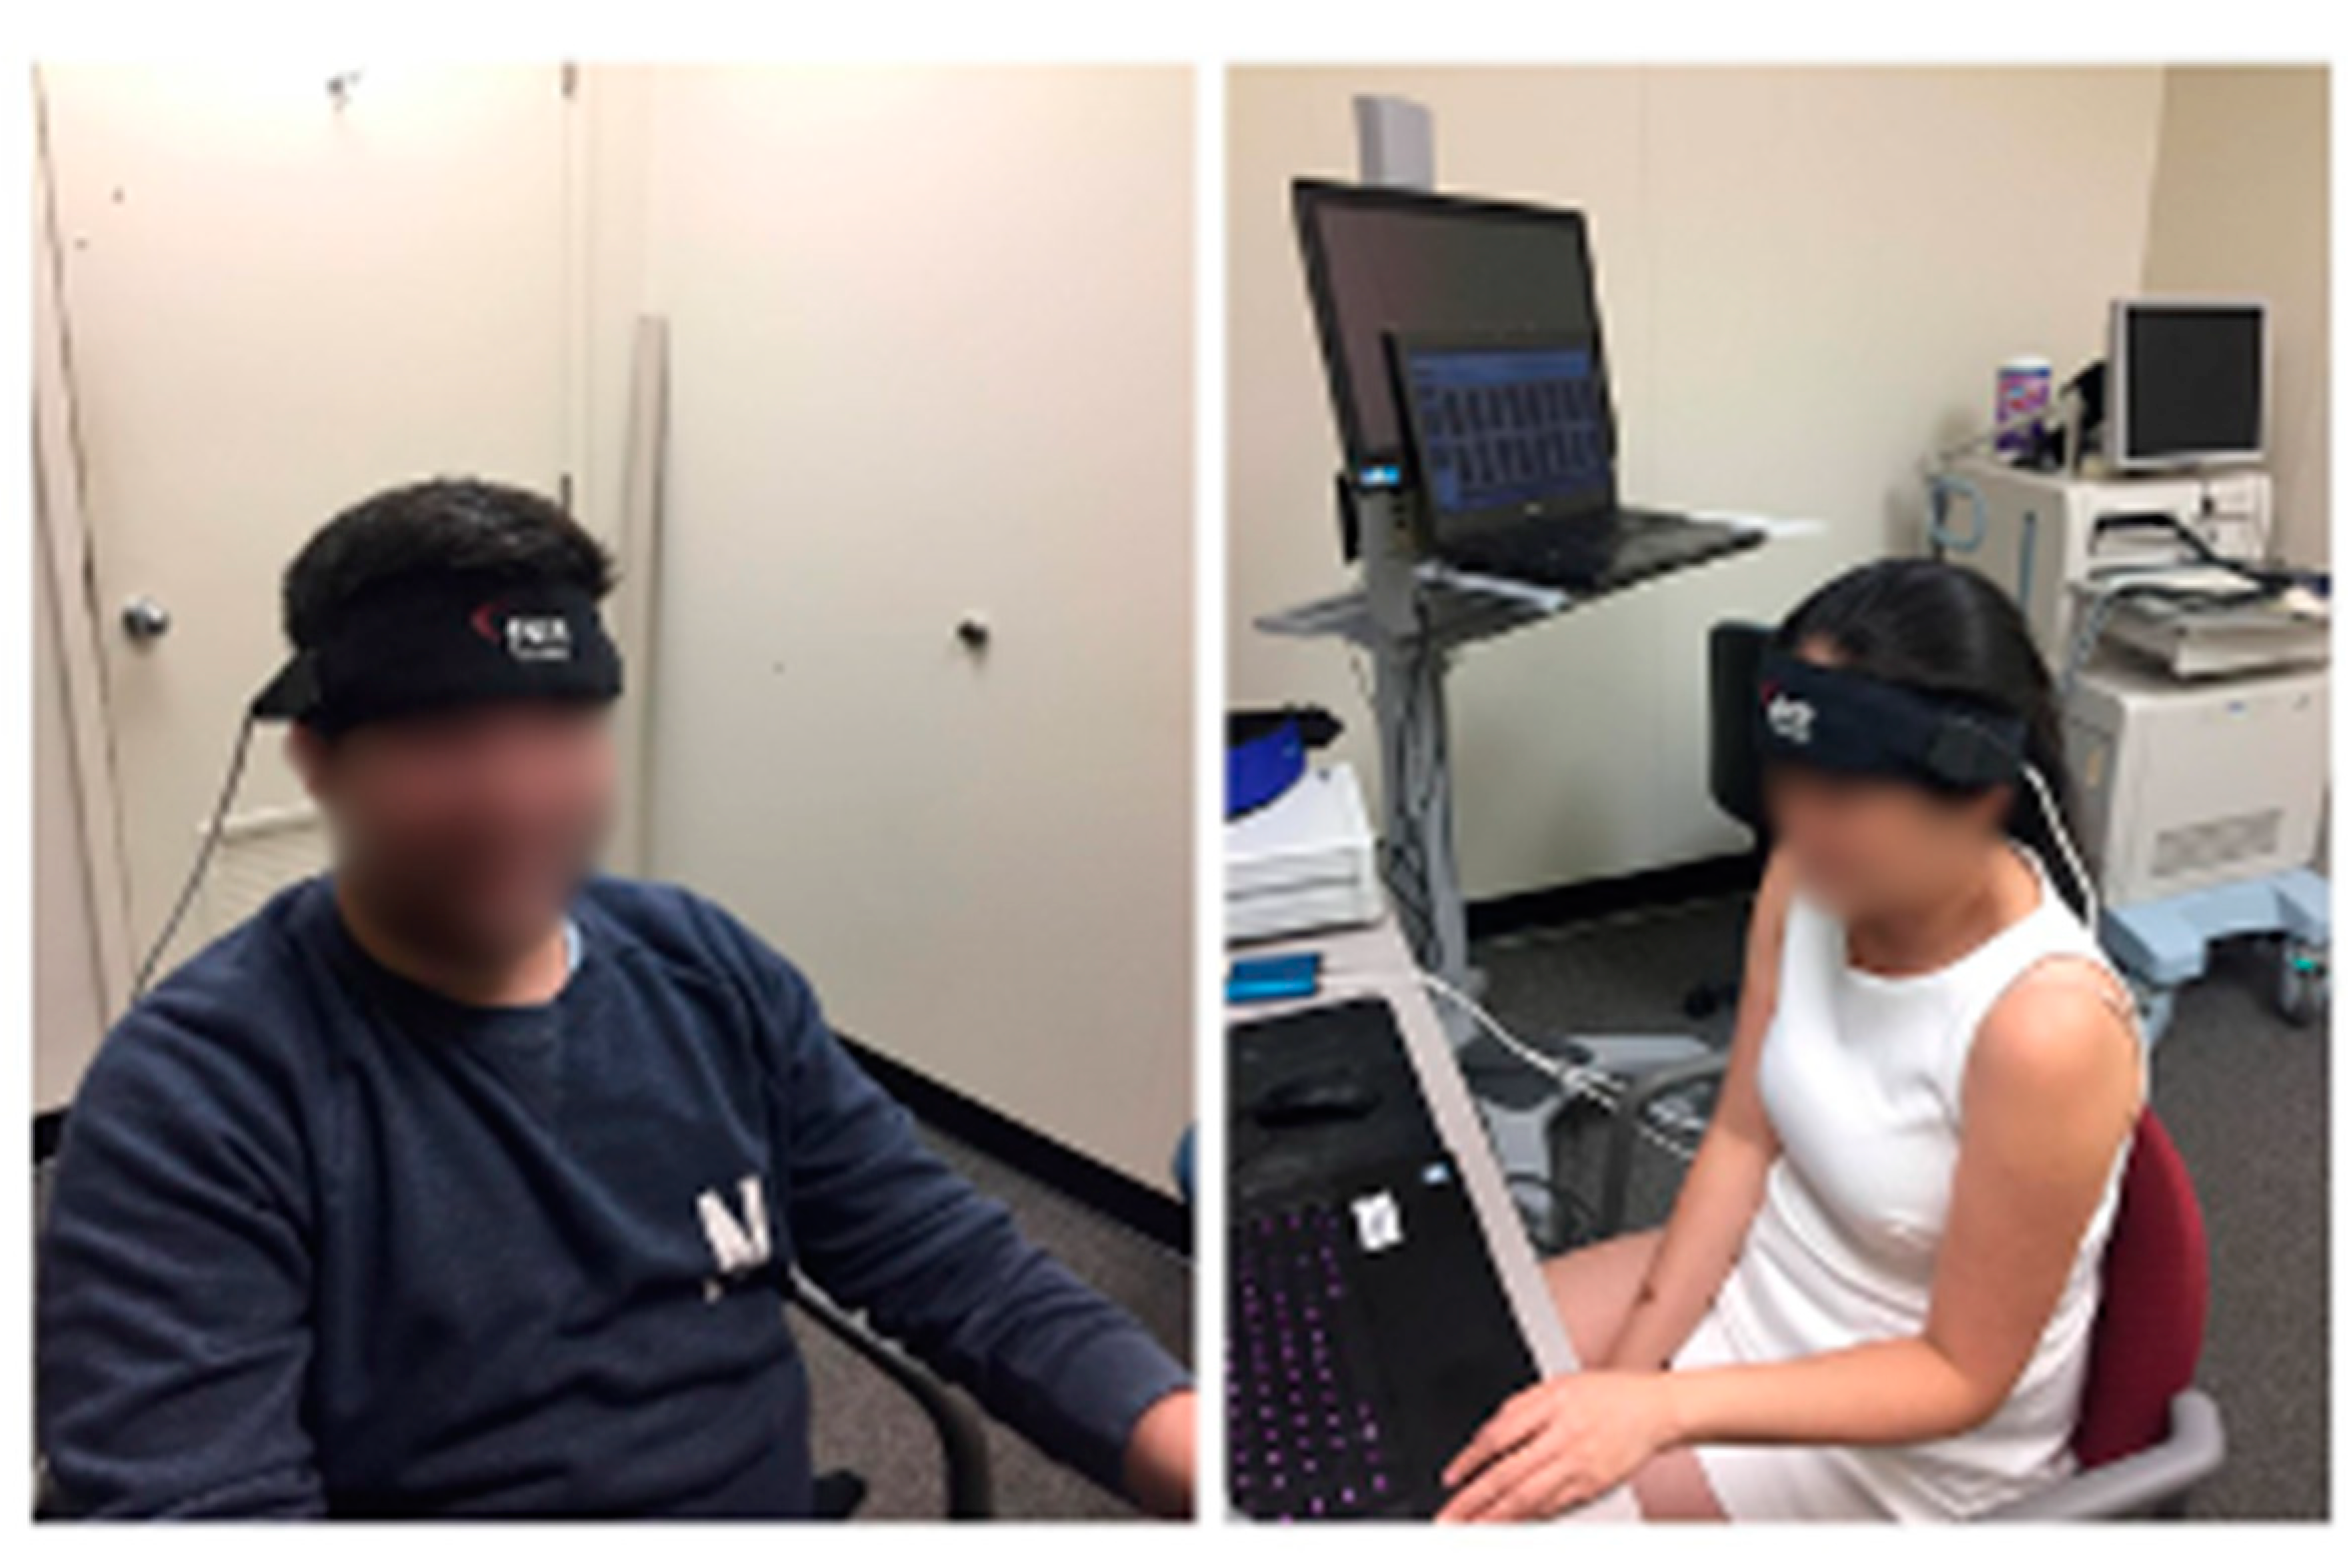
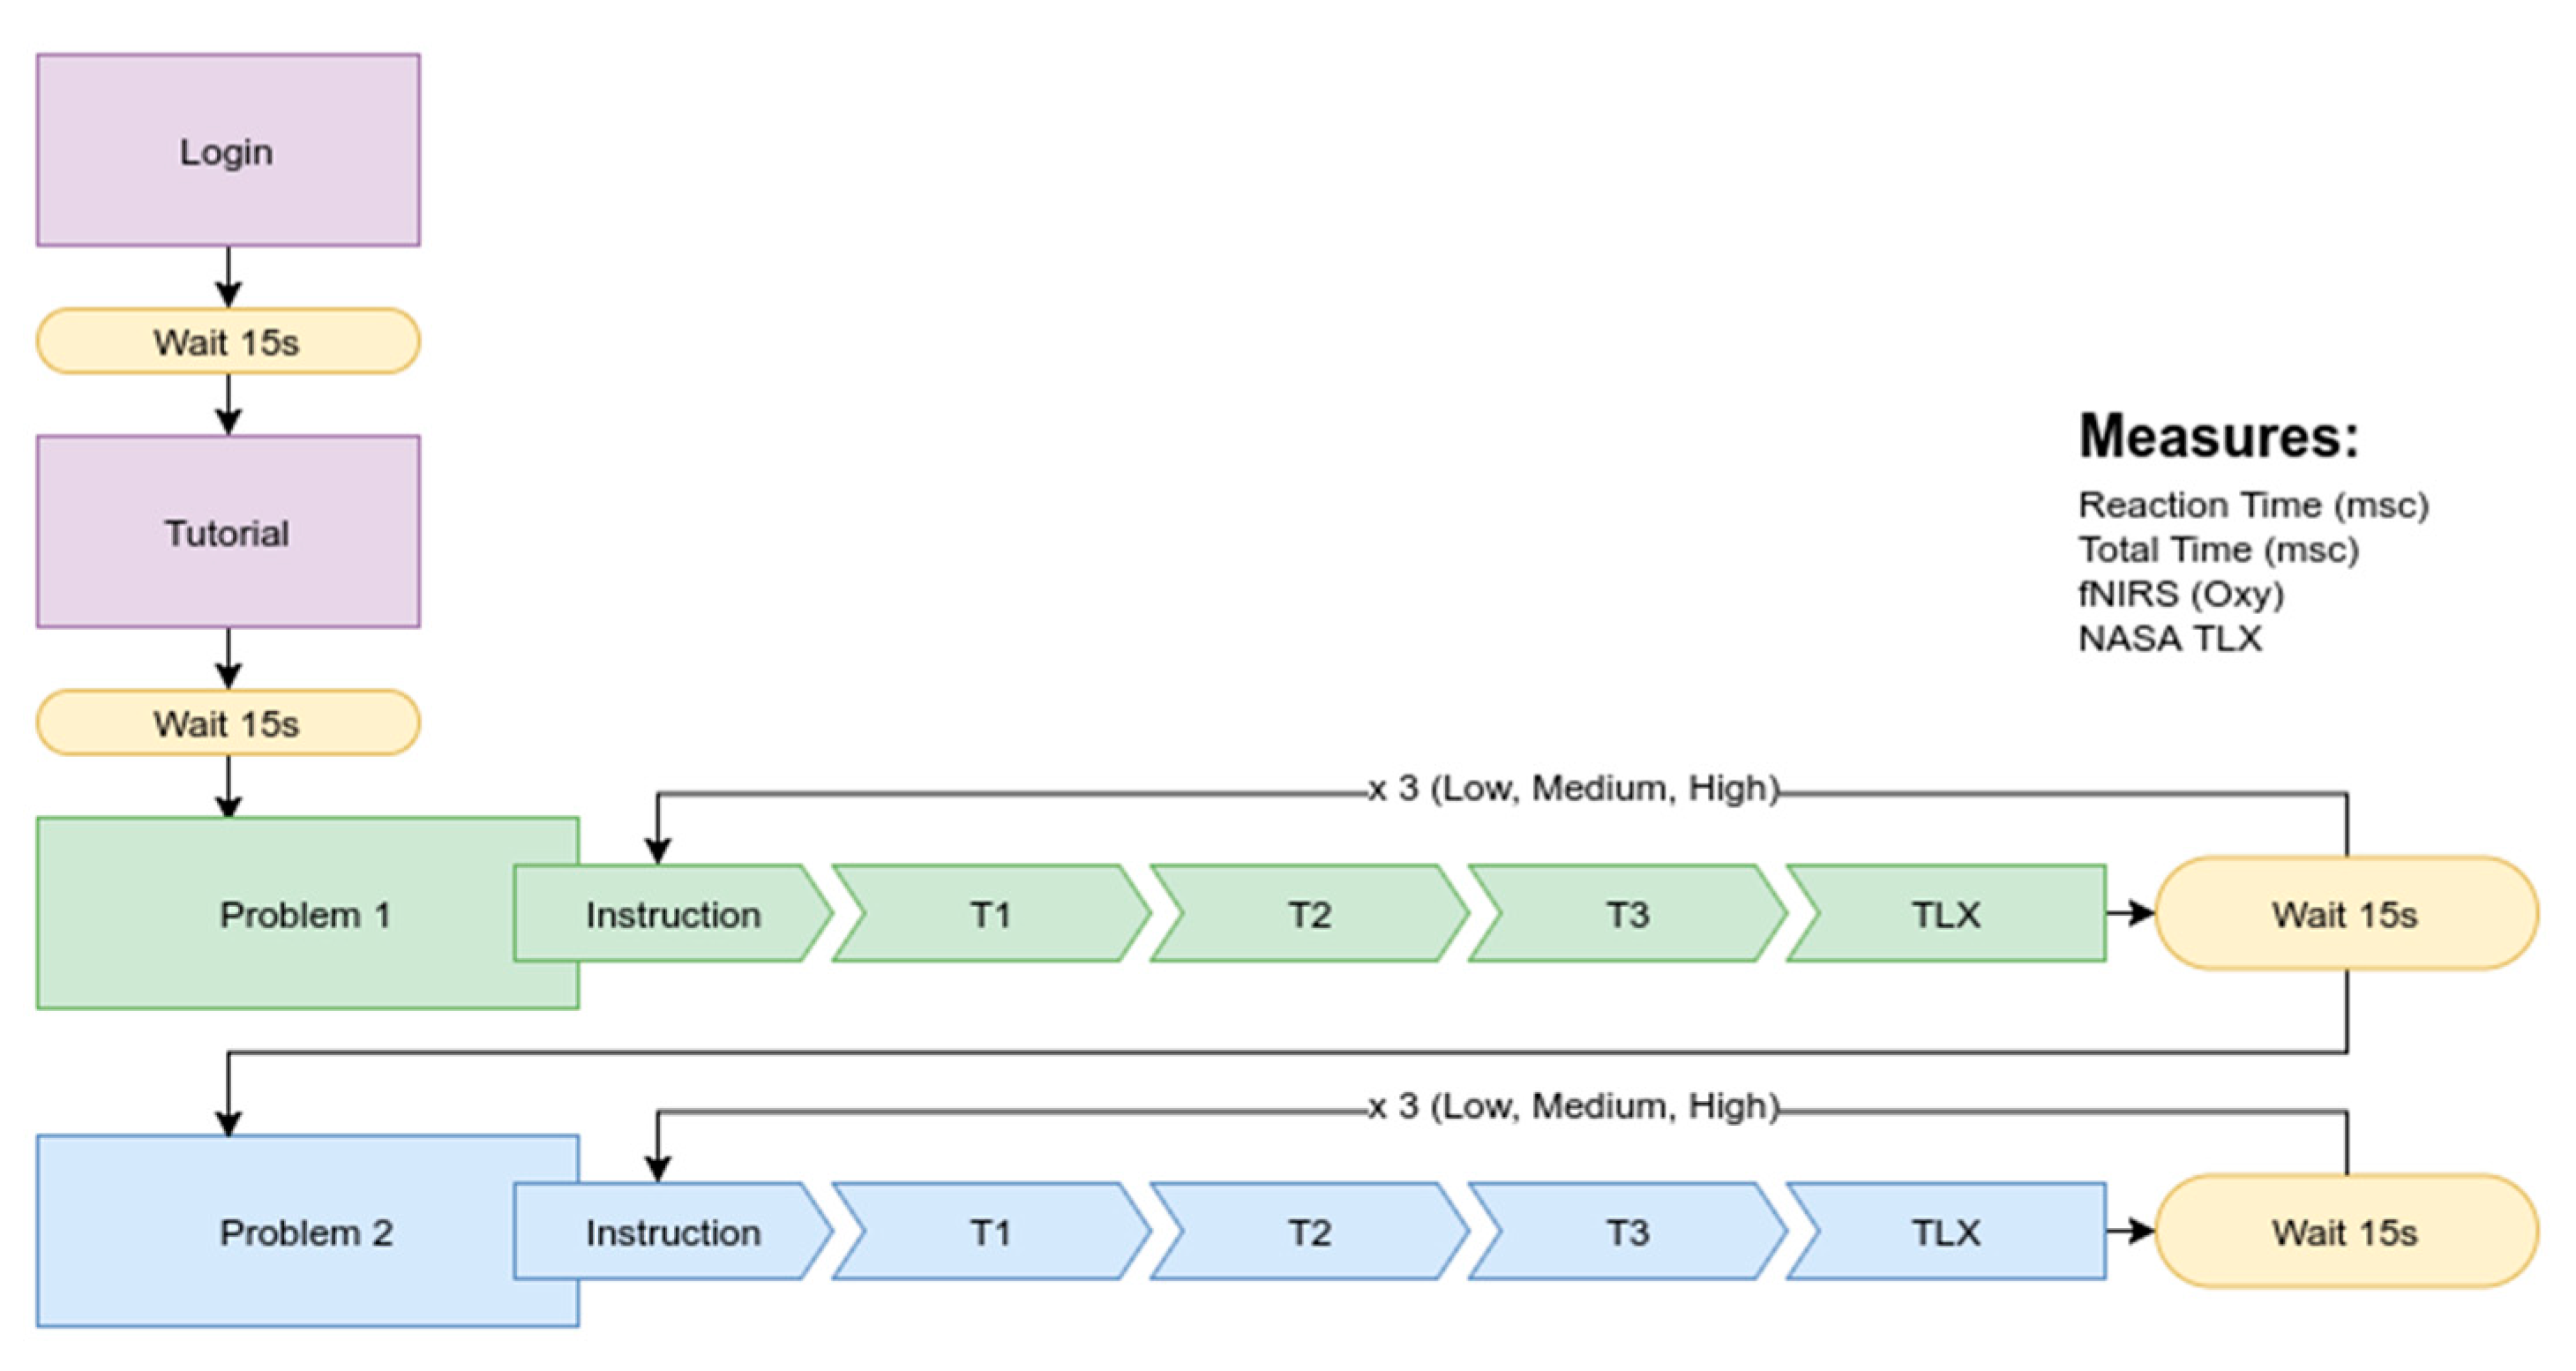







| DV | Effect | F(df) | p-Value | η2 |
|---|---|---|---|---|
| TT | Week × Level | F (2, 52) = 14.71 | <0.001 | 0.36 |
| Problem × Level | F (2, 52) = 93.28, | <0.001 | 0.78 | |
| Week | F (1, 26) = 95.34 | <0.001 | 0.79 | |
| Level | F (2, 52) = 289.81 | <0.001 | 0.92 | |
| RT | Week × Level | F (2, 52) = 12.19 | <0.001 | 0.32 |
| Week | F (1, 26) = 46.46 | <0.001 | 0.64 | |
| Level | F (2, 52) = 30.42 | <0.001 | 0.54 | |
| LDLPFC | Week × Level | F (2, 52) = 6.92 | <0.05 | 0.21 |
| Problem × Level | F (2, 52) = 13.23 | <0.001 | 0.34 | |
| Week | F (1, 26) = 32.58 | <0.001 | 0.56 | |
| Level | F (2, 52) = 4.23 | <0.05 | 0.14 | |
| RDLPFC | Week × Level | F (2, 52) = 7.18 | <0.05 | 0.22 |
| Problem × Level | F (2, 52) = 18.07 | <0.001 | 0.41 | |
| Week | F (1, 26) = 16.31 | <0.001 | 0.39 | |
| Level | F (2, 52) = 4.05 | <0.05 | 0.14 | |
| LANTPFC | Week × Level | F (2, 52) = 5.27 | <0.05 | 0.17 |
| Problem × Level | F (2, 52) = 15.52 | <0.001 | 0.37 | |
| Week | F (1, 26) = 29.62 | <0.001 | 0.53 | |
| Level | F (2, 52) = 3.75 | <0.05 | 0.13 | |
| RANTPFC | Week × Level | F (2, 52) = 7.47 | <0.05 | 0.22 |
| Problem × Level | F (2, 52) = 15.42 | <0.001 | 0.37 | |
| Week | F (1, 26) = 25.92 | <0.001 | 0.50 | |
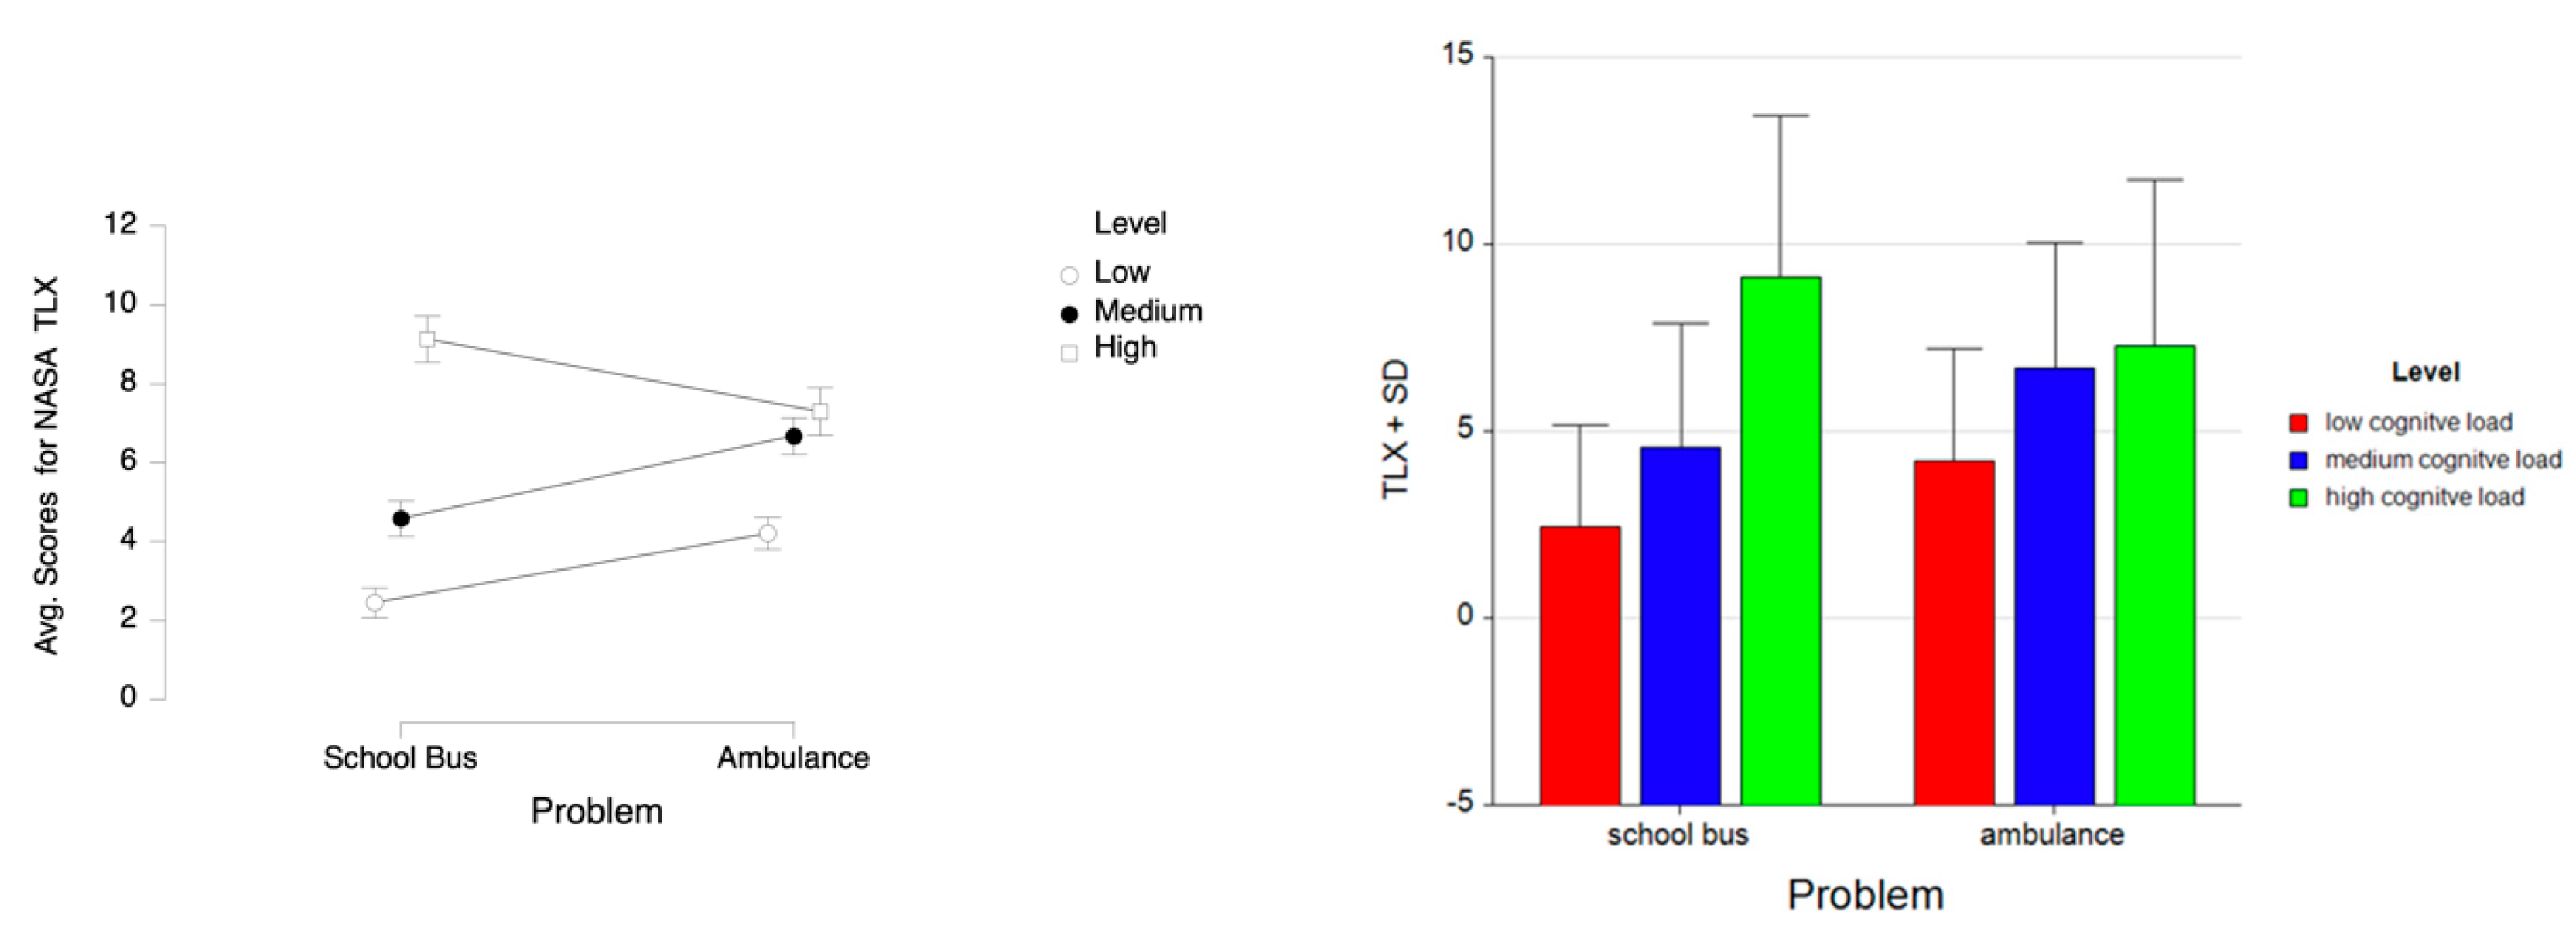
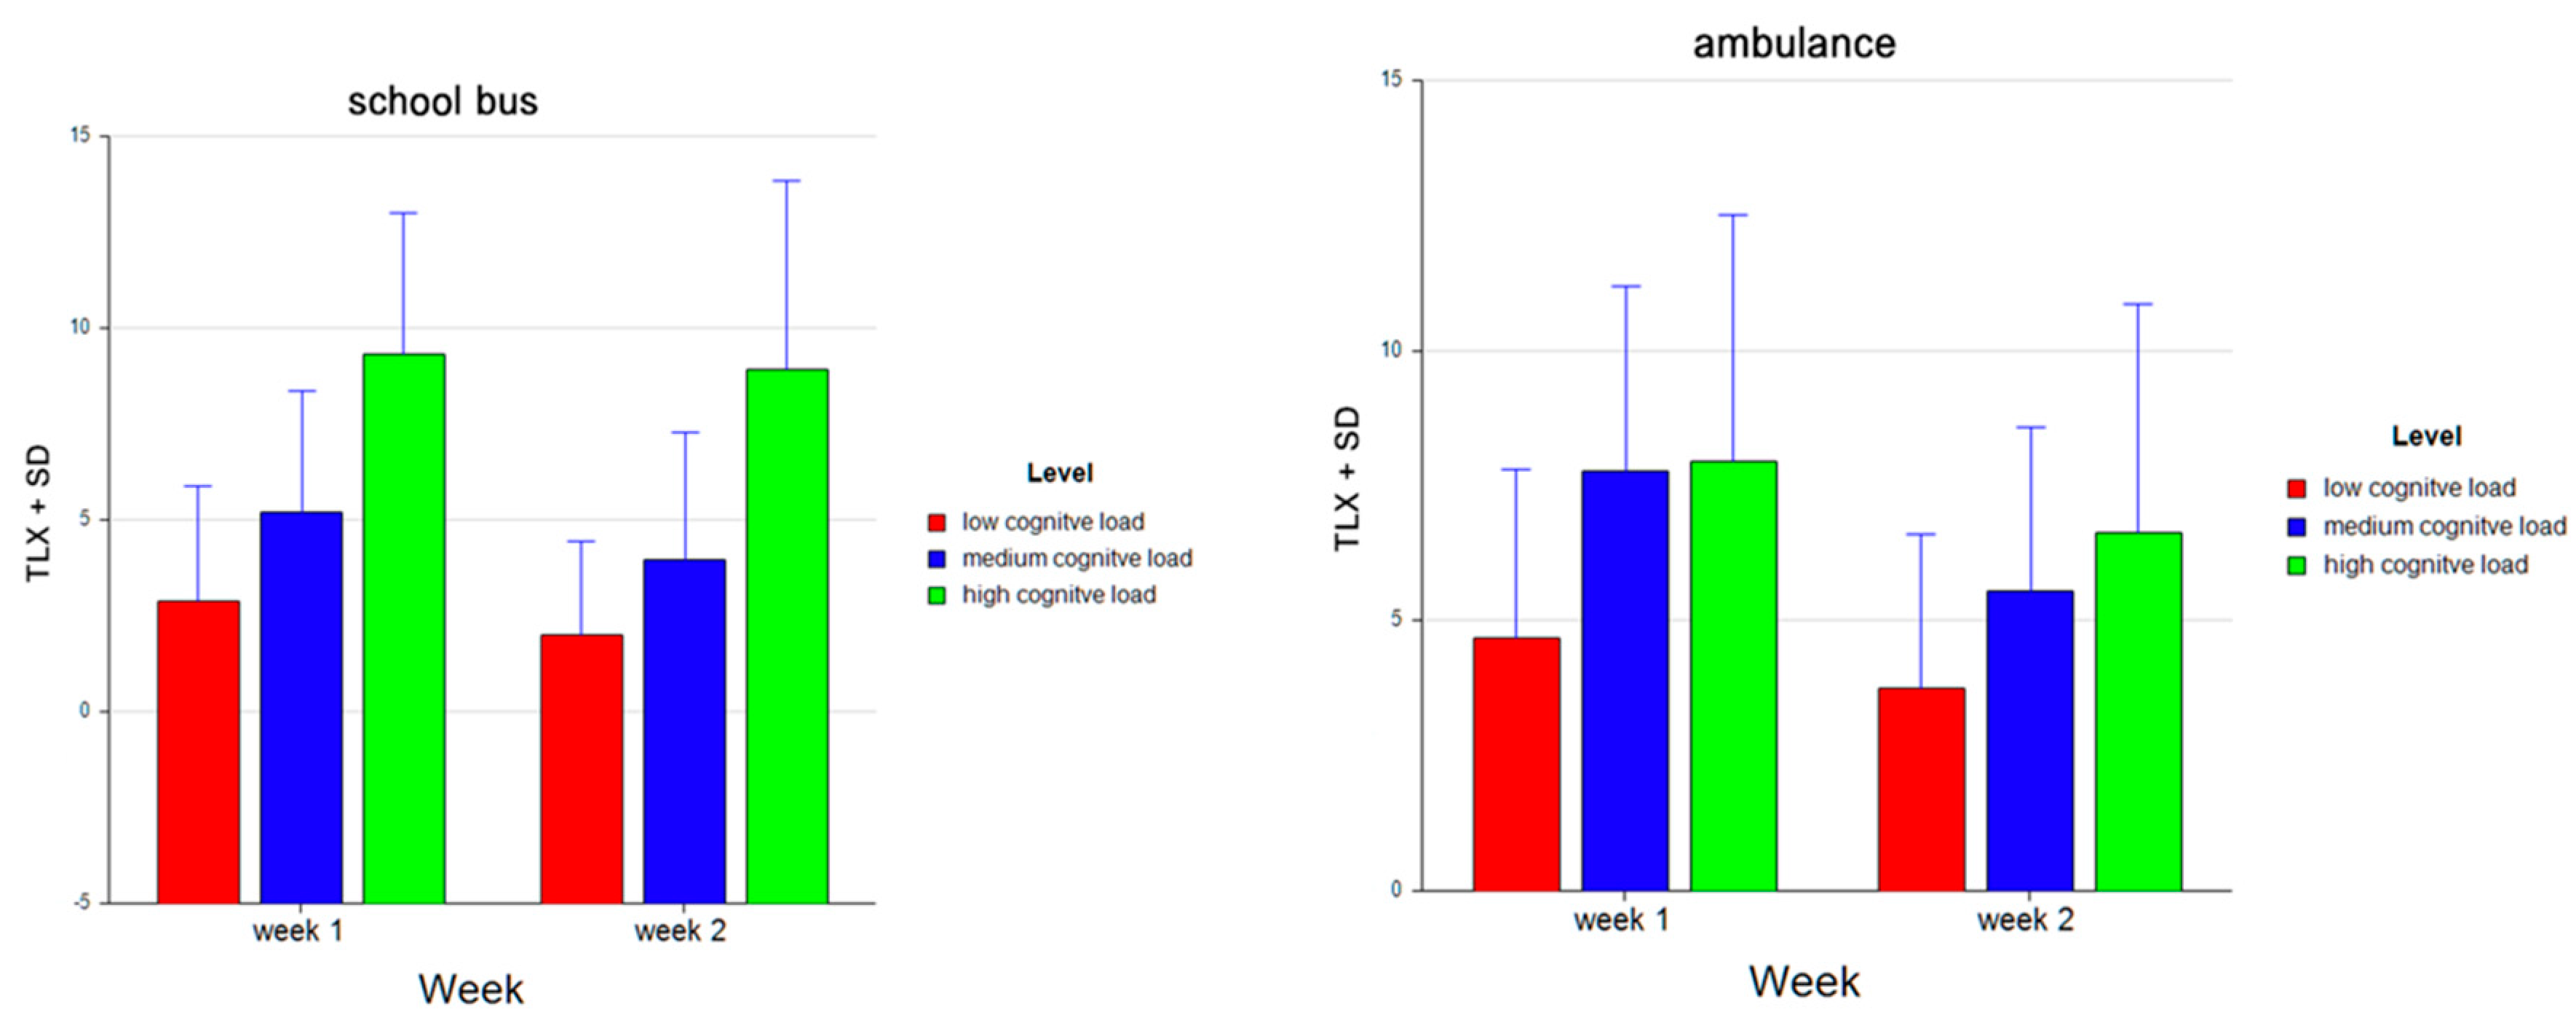
| TLX | Problem × Level | F (2, 52) = 20.90 | <0.001 | 0.45 |
| Level | F (2, 52) = 66.72 | <0.001 | 0.72 | |
| Week | F (1, 26) = 9.39 | <0.05 | 0.27 |
Publisher’s Note: MDPI stays neutral with regard to jurisdictional claims in published maps and institutional affiliations. |
© 2021 by the authors. Licensee MDPI, Basel, Switzerland. This article is an open access article distributed under the terms and conditions of the Creative Commons Attribution (CC BY) license (http://creativecommons.org/licenses/by/4.0/).
Share and Cite
Galoyan, T.; Betts, K.; Abramian, H.; Reddy, P.; Izzetoglu, K.; Shewokis, P.A. Examining Mental Workload in a Spatial Navigation Transfer Game via Functional near Infrared Spectroscopy. Brain Sci. 2021, 11, 45. https://doi.org/10.3390/brainsci11010045
Galoyan T, Betts K, Abramian H, Reddy P, Izzetoglu K, Shewokis PA. Examining Mental Workload in a Spatial Navigation Transfer Game via Functional near Infrared Spectroscopy. Brain Sciences. 2021; 11(1):45. https://doi.org/10.3390/brainsci11010045
Chicago/Turabian StyleGaloyan, Tamara, Kristen Betts, Hovag Abramian, Pratusha Reddy, Kurtulus Izzetoglu, and Patricia A. Shewokis. 2021. "Examining Mental Workload in a Spatial Navigation Transfer Game via Functional near Infrared Spectroscopy" Brain Sciences 11, no. 1: 45. https://doi.org/10.3390/brainsci11010045
APA StyleGaloyan, T., Betts, K., Abramian, H., Reddy, P., Izzetoglu, K., & Shewokis, P. A. (2021). Examining Mental Workload in a Spatial Navigation Transfer Game via Functional near Infrared Spectroscopy. Brain Sciences, 11(1), 45. https://doi.org/10.3390/brainsci11010045


