Resting EEG, Hair Cortisol and Cognitive Performance in Healthy Older People with Different Perceived Socioeconomic Status

 ,
,
Abstract
1. Introduction
2. Materials and Methods
2.1. Participants
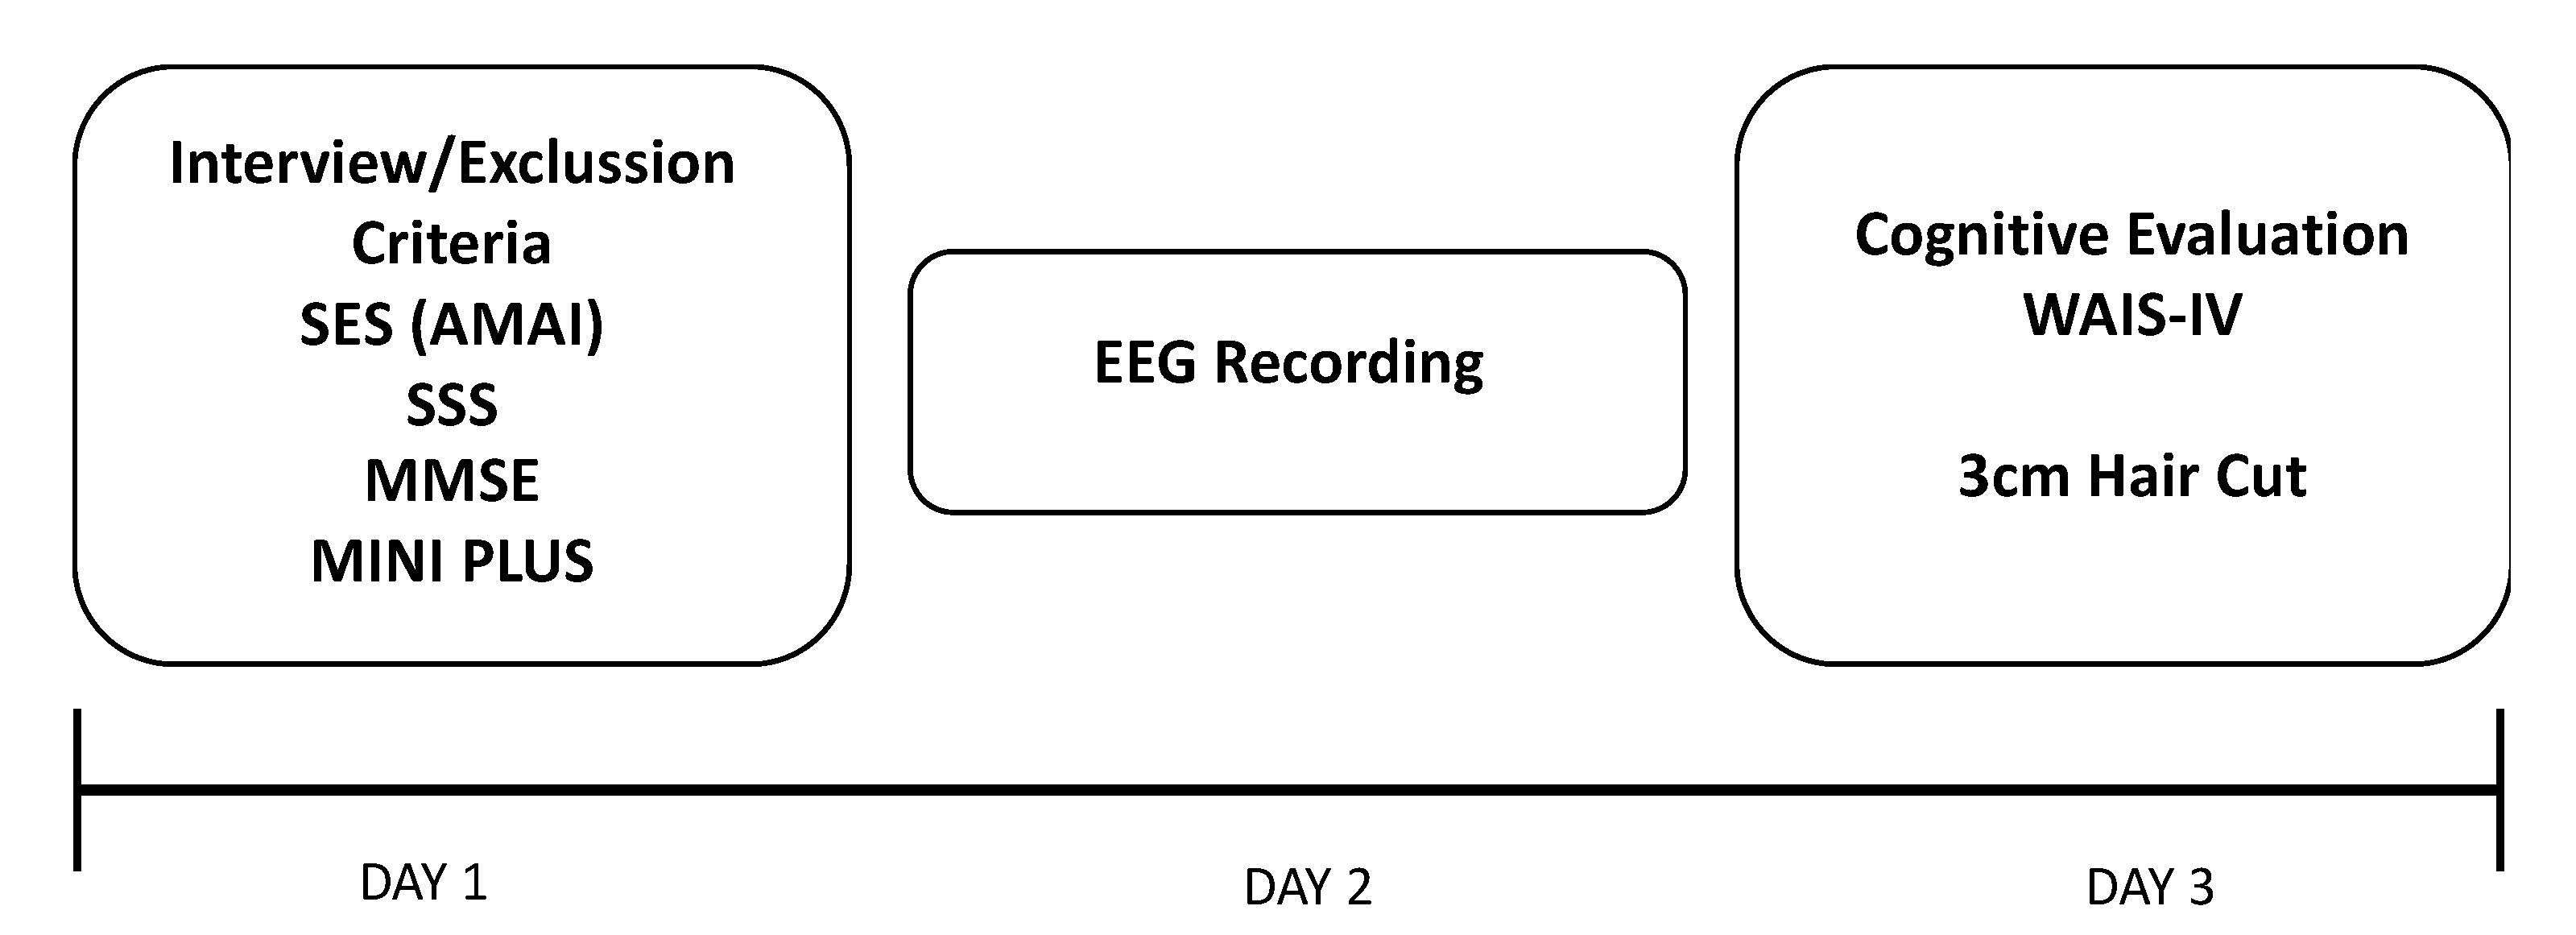
2.2. Procedure
2.3. Outcome Measures
2.3.1. Objective Socioeconomic Status AMAI
2.3.2. Subjective Socioeconomic Status
2.3.3. Cognitive Evaluation
2.3.4. Electroencephalogram (EEG)
EEG Recording
EEG Edition and Analysis
2.3.5. Hair Cortisol Concentration
2.4. Statistical Analysis
3. Results
3.1. Descriptive Data
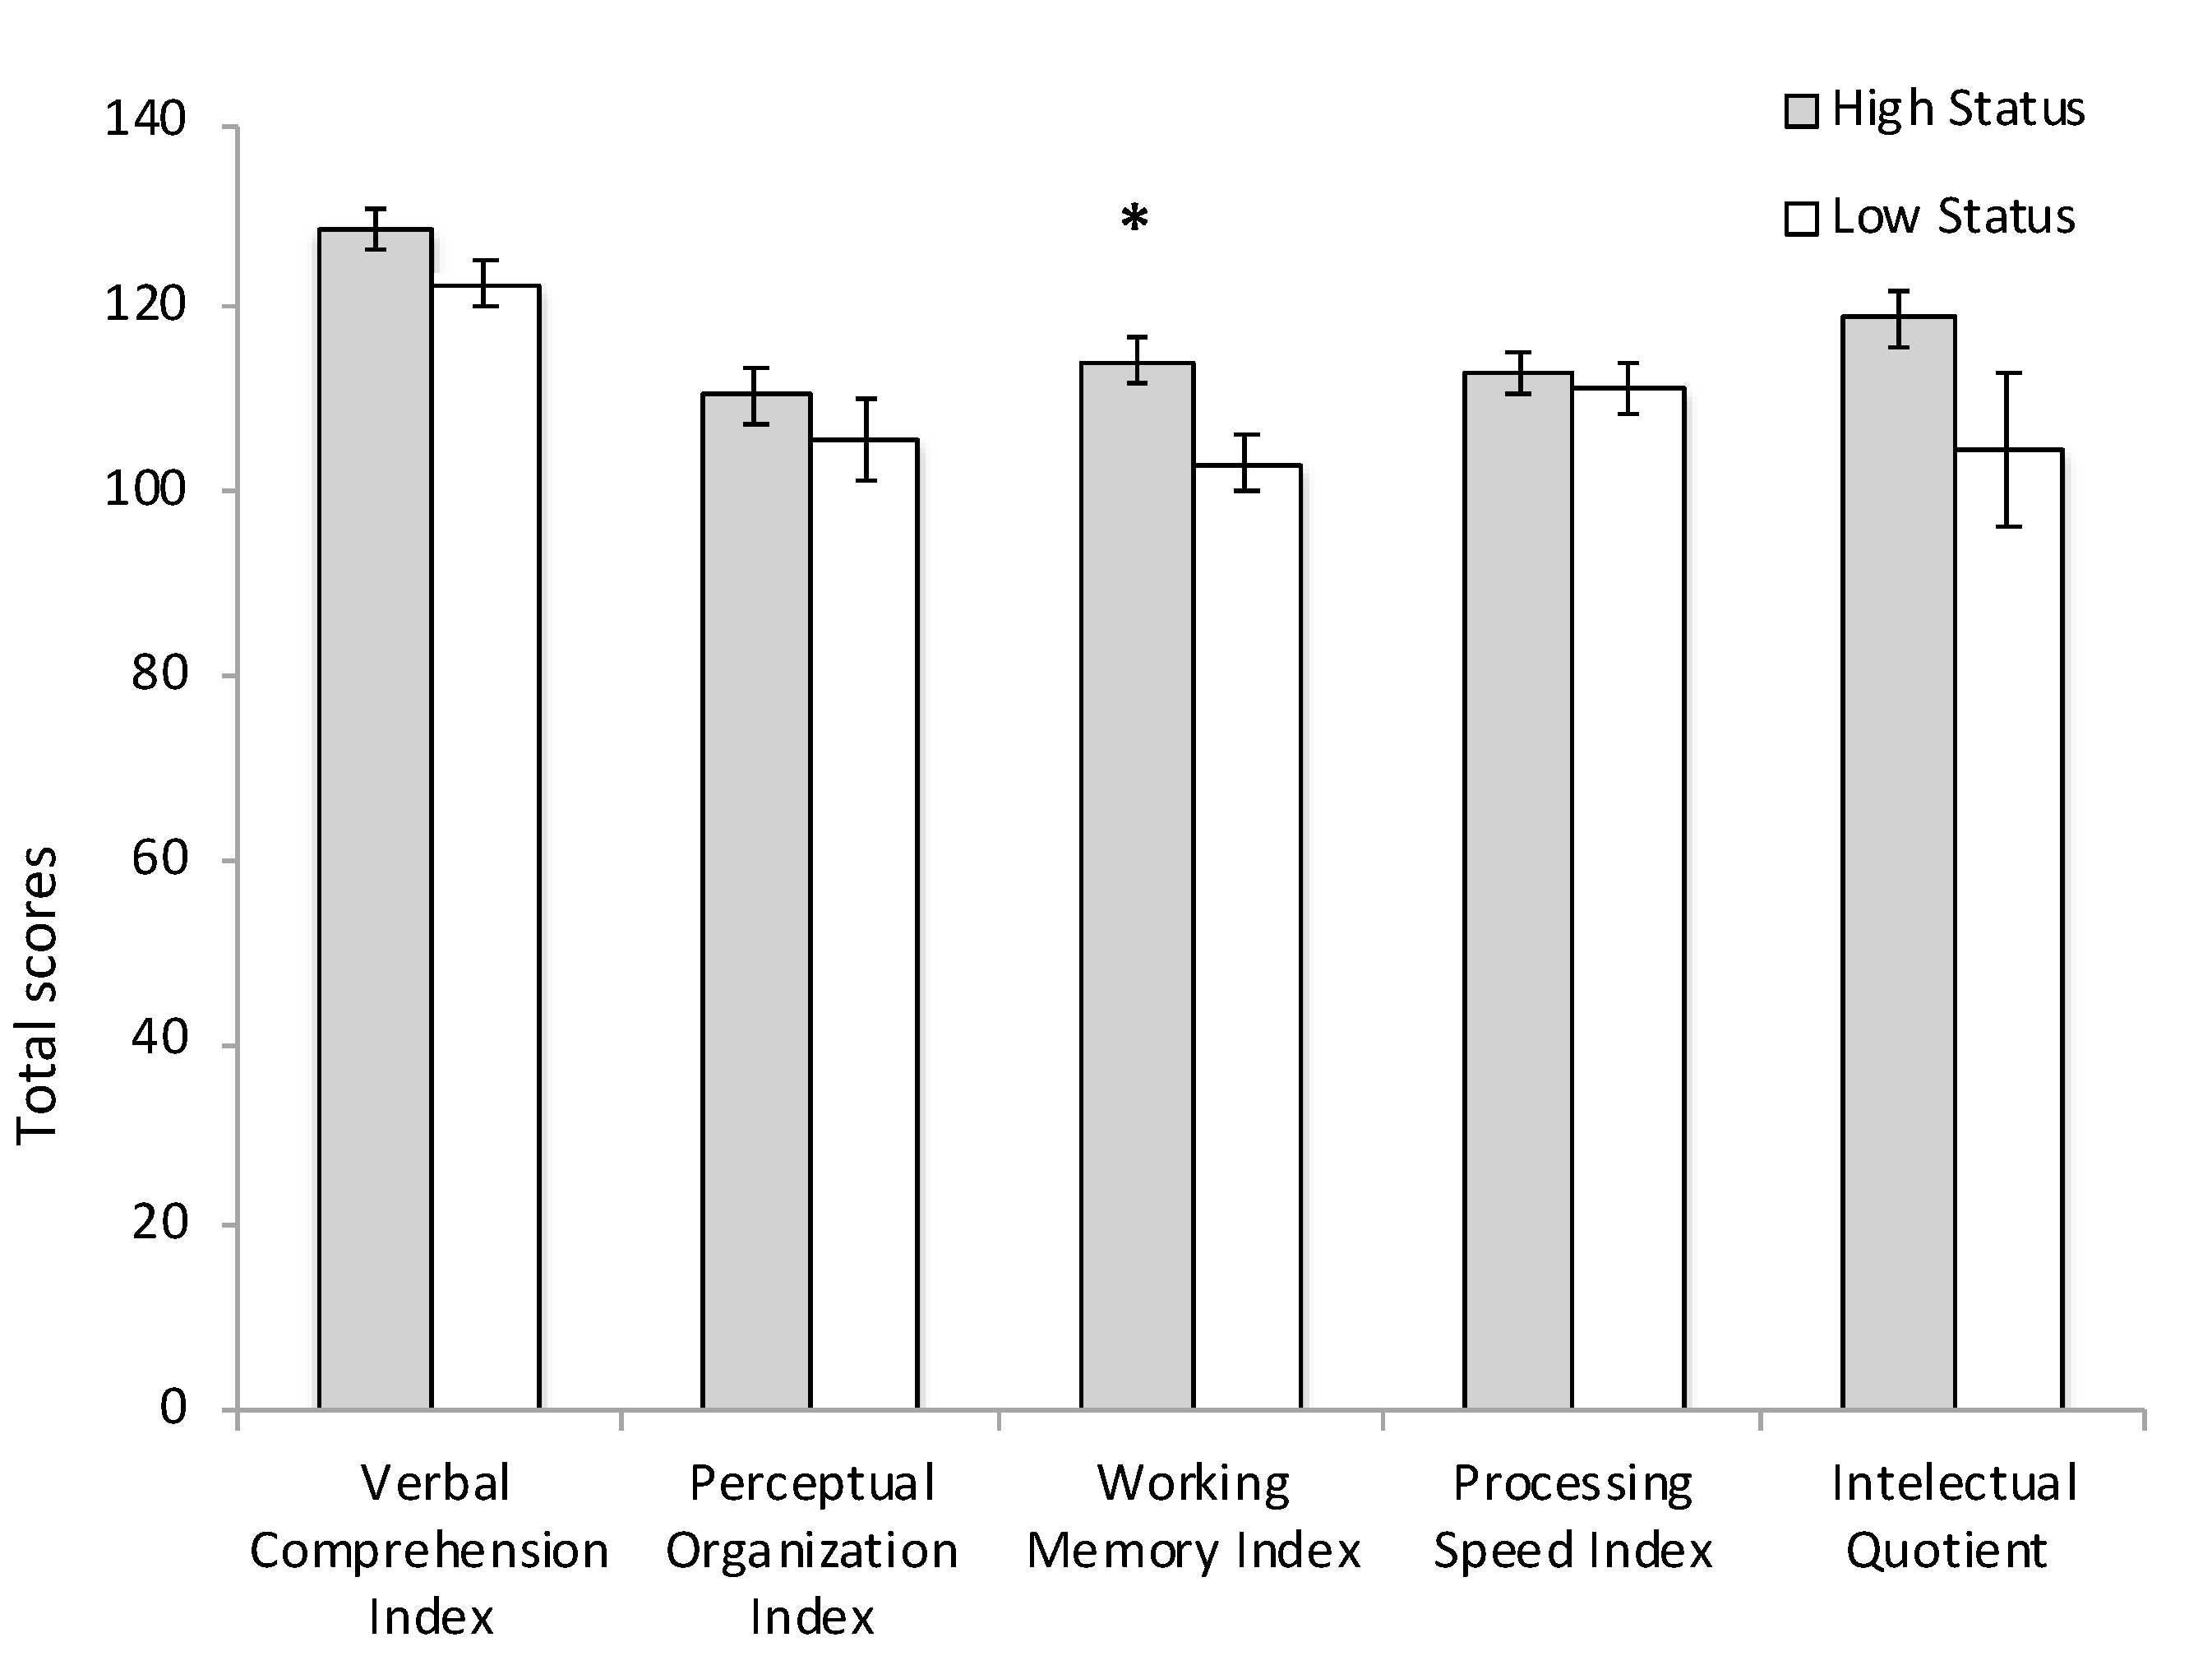
3.2. Cognitive Performance
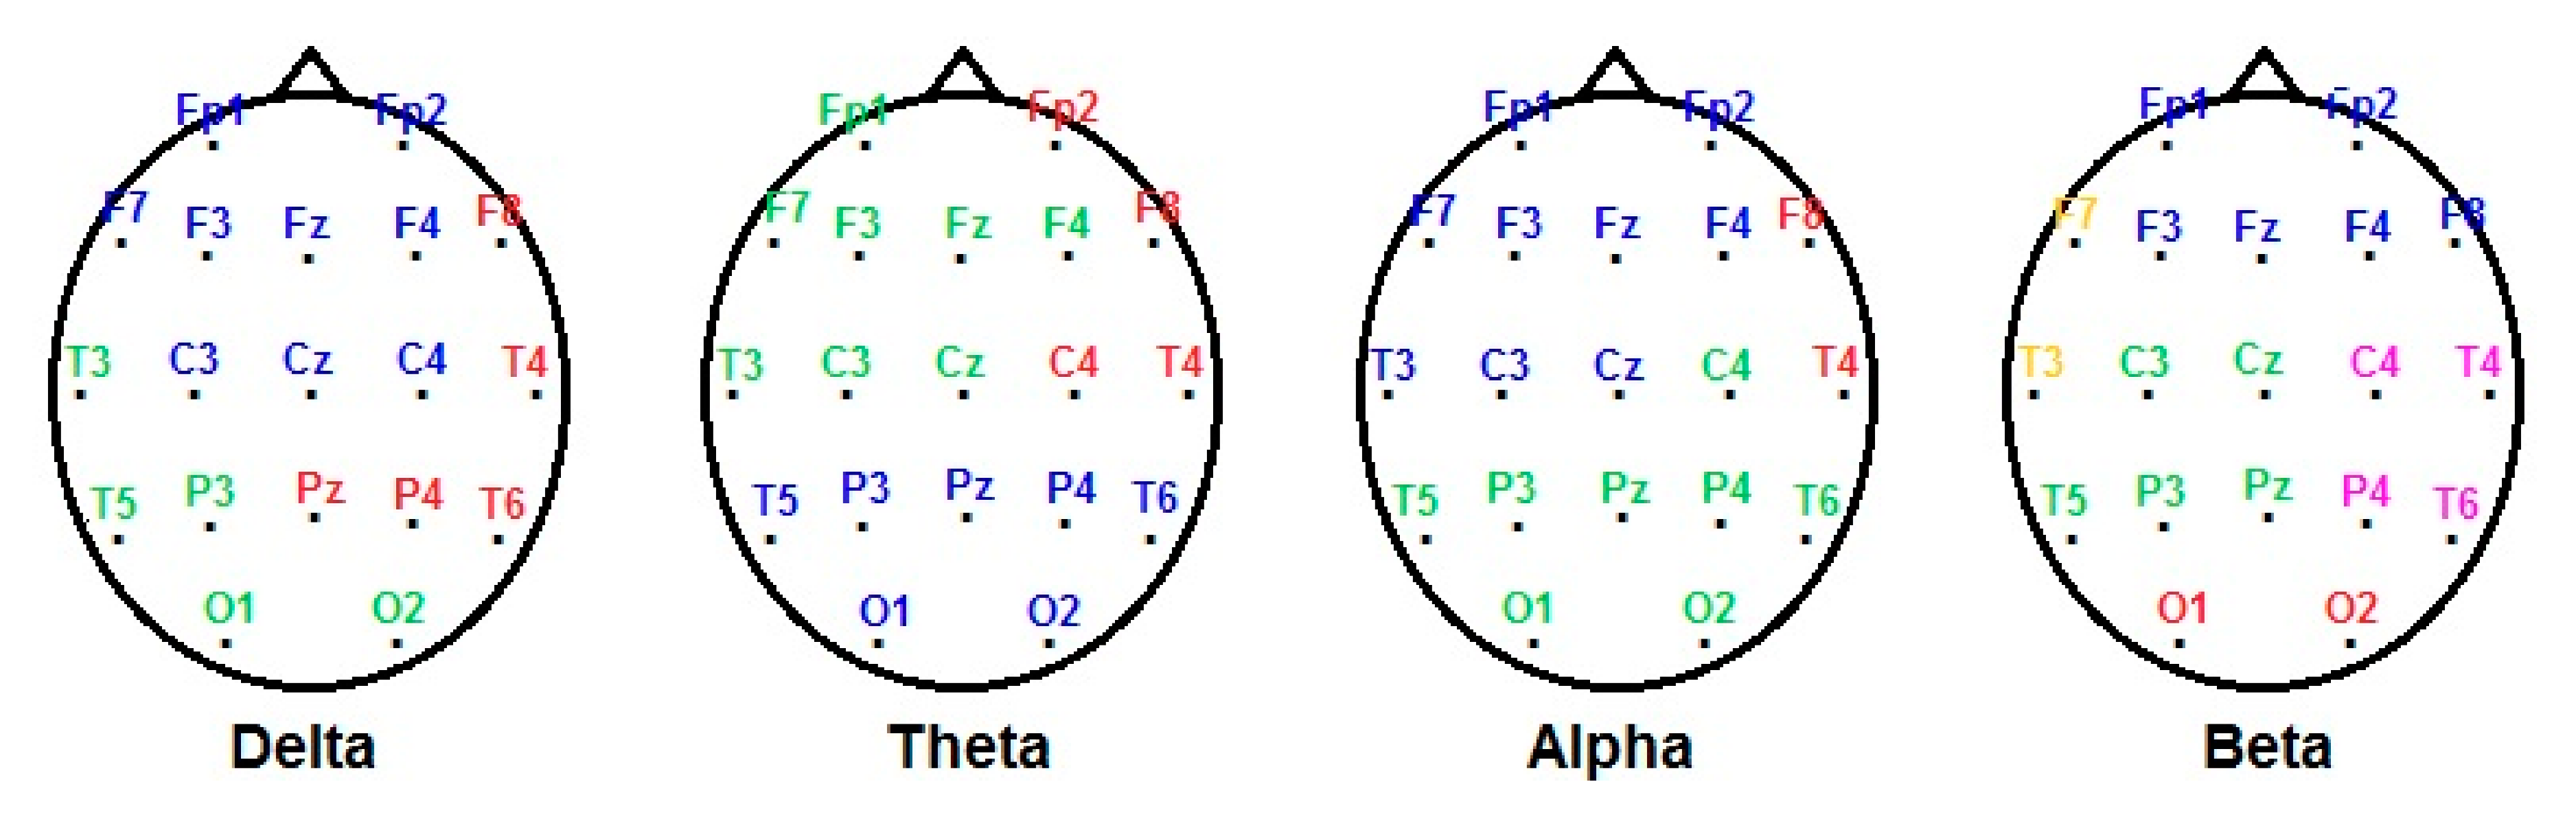
3.3. EEG Measures
3.4. Hair Cortisol Concentration (HCC)
4. Discussion
4.1. SES Effects on Cognitive Performance
4.2. SES Effects on EEG
4.3. SES Effects on HCC
5. Conclusions
Author Contributions
Funding
Acknowledgments
Conflicts of Interest
References
- Tsolaki, A.; Kazis, D.; Kompatsiaris, I.; Kosmidou, V.; Tsolaki, M. Electroencephalogram and alzheimer’s disease: Clinical and research approaches. Int. J. Alzheimer’s Dis 2014, 2014, 349249. [Google Scholar] [CrossRef] [PubMed]
- Prichep, L.S.; John, E.R.; Ferris, S.H.; Rausch, L.; Fang, Z.; Cancro, R.; Torossian, C.; Reisberg, B. Prediction of longitudinal cognitive decline in normal elderly with subjective complaints using electrophysiological imaging. Neurobiol. Aging 2006, 27, 471–481. [Google Scholar] [CrossRef] [PubMed]
- Prichep, L.S. Quantitative EEG and electromagnetic brain lmaging in aging and in the evolution of dementia. Ann. N. Y. Acad. Sci. 2007, 1097, 156–167. [Google Scholar] [CrossRef] [PubMed]
- Huang, C.; Wahlund, L.O.; Dierks, T.; Julin, P.; Winblad, B.; Jelic, V. Discrimination of Alzheimer’s disease and mild cognitive impairment by equivalent EEG sources: A cross-sectional and longitudinal study. Clin. Neurophysiol. 2000, 111, 1961–1967. [Google Scholar] [CrossRef]
- Jelic, V.; Johansson, S.E.; Almkvista, O.; Julin, P.; Nordberg, B.; Winblad, B.; Wahlunda, L.-O. Quantitative electroencephalography in mild cognitive impairment: Longitudinal changes and possible prediction of Alzheimer’s disease. Neurobiol. Aging 2000, 21, 533–540. [Google Scholar] [CrossRef]
- Rossini, P.M.; Del Percio, C.; Pasqualetti, P.; Cassetta, E.; Binetti, G.; Dal Forno, G.; Ferreri, F.; Frisoni, G.; Chiovenda, P.; Miniussi, C.; et al. Conversion from mild cognitive impairment to Alzheimer’s disease is predicted by sources and coherence of brain electroencephalography rhythms. Neuroscience 2018, 143, 793–803. [Google Scholar] [CrossRef]
- Claus, J.J.; Kwa, V.I.; Teunisse, S.; van Gool, W.A.; Koelman, J.H.; Bour, L.J.; Ongerboer de Visser, B.W. Slowing on quantitative spectral EEG is a marker for rate of subsequent cognitive and functional decline in early Alzheimer disease. Alzheimer Dis. Assoc. Disord. 1998, 12, 167–174. [Google Scholar] [CrossRef]
- Musaeus, C.S.; Engedal, K.; Høgh, P.; Jelic, V.; Mørup, M.; Naik, M.; Oeksengaard, A.R.; Snaedal, J.; Wahlund, L.O.; Waldemar, G.; et al. EEG theta power is an early marker of cognitive decline in dementia due to Alzheimer’s disease. J. Alzheimer’s Dis 2018, 64, 1359–1371. [Google Scholar] [CrossRef]
- Coben, L.A.; Danziger, W.; Storandt, M. A longitudinal EEG study of mild senile dementia of Alzheimer type: Changes at 1 year and at 2.5 years. Electroenceph. Clin. Neurophysiol. 1985, 61, 101–112. [Google Scholar] [CrossRef]
- Nakano, T.; Miyasaka, M.; Ohtaka, T.; Ohmori, K. Longitudinal changes in computerized EEG and mental function of the aged: A nine-year follow-up study. Int. Psychogeriatr. 1992, 4, 9–23. [Google Scholar] [CrossRef]
- Roozendaal, B.; McEwen, B.S.; Chattarji, S. Stress, memory and the amygdala. Nat. Rev. Neurosci. 2009, 10, 423–433. [Google Scholar] [CrossRef] [PubMed]
- LeBeau, M.A.; Montgomery, M.A.; Brewer, J.D. The role of variations in growth rate and sample collection on interpreting results of segmental analyses of hair. Forensic Sci. Int. 2011, 210, 110–116. [Google Scholar] [CrossRef] [PubMed]
- Loussouarn, G. African hair growth parameters. BJD 2001, 145, 294–297. [Google Scholar] [CrossRef]
- Pulopulos, M.M.; Hidalgo, V.; Almela, M.; Puig-Perez, S.; Villada, C.; Salvador, A. Hair cortisol and cognitive performance in healthy older people. Psychoneuroendocrinology 2014, 44, 100–111. [Google Scholar] [CrossRef] [PubMed]
- McLennan, S.; Ihle, A.; Steudte-Schmiedgen, S.; Kirschbaum, C.; Kliegel, M. Hair cortisol and cognitive performance in working age adults. Psychoneuroendocrinology 2016, 67, 100–103. [Google Scholar] [CrossRef] [PubMed]
- Feeney, J.; Aisling, M.; Halloran, O’. The association between hair cortisol, hair cortisone and cognitive function in a population based cohort of older adults: Results from the Irish longitudinal study on ageing. J. Gerontol. A 2020, 75, 257–265. [Google Scholar] [CrossRef]
- Steptoe, A.; Kunz-Ebrecht, S.R.; Owen, N.; Feldman, P.J.; Willemsen, G.; Kirschbaum, C.; Marmot, M. Socioeconomic status and stress-related responses over the working day. Psychosom. Med. 2003, 65, 461–470. [Google Scholar] [CrossRef]
- Wright, C.E.; Steptoe, A. Subjective socioeconomic position, gender and cortisol responses to waking in an elderly population. Psychoneuroendocrinology 2005, 30, 582–590. [Google Scholar] [CrossRef]
- Gray, N.A.; Dhana, A.; Van Der Vyver, L.; Van Wyk, J.; Khumalo, N.P.; Stein, D.J. Determinants of hair cortisol concentration in children: A systematic review. Psychoneuroendocrinology 2018, 87, 204–214. [Google Scholar] [CrossRef]
- Ursache, A.; Merz, E.C.; Melvin, S.; Meyer, J.; Noble, K.G. Socioeconomic status, hair cortisol and internalizing symptoms in parents and children. Psychoneuroendocrinology 2017, 78, 142–150. [Google Scholar] [CrossRef]
- Jackson, S.E.; Steptoe, A. Obesity, Perceived Weight Discrimination, and Hair Cortisol: A Population-Based Study. Psychoneuroendocrinology 2018, 98, 67–73. [Google Scholar] [CrossRef] [PubMed]
- Chan, M.Y.; Na, J.; Agres, P.F.; Savalia, N.K.; Park, D.C.; Wig, G.S. Socioeconomic status moderates age-related differences in the brain’s functional network organization and anatomy across the adult lifespan. Proc. Natl. Acad. Sci. USA 2018, 22, E5144–E5153. [Google Scholar] [CrossRef] [PubMed]
- Farah, M.J. The neuroscience of socioeconomic status: Correlates, causes, and consequences. Neuron 2017, 96, 56–71. [Google Scholar] [CrossRef]
- Johnson, N.F.; Kim, C.; Gold, B.T. Socioeconomic status is positively correlated with frontal white matter integrity in aging. Age 2013, 35, 2045–2056. [Google Scholar] [CrossRef] [PubMed]
- Derry, H.M.; Fagundes, C.P.; Andridge, R.; Glaser, R.; Malarkey, W.B.; Kiecolt-Glaser, J.K. Lower subjective social status exaggerates interleukin-6 responses to a laboratory stressor. Psychoneuroendocrinology 2013, 38, 2676–2685. [Google Scholar] [CrossRef] [PubMed]
- Dickerson, S.S.; Kemeny, M.E. Acute stressors and cortisol responses: A theoretical integration and synthesis of laboratory research. Psychol. Bull. 2004, 130, 355–391. [Google Scholar] [CrossRef] [PubMed]
- Weiss, D.; Weiss, M. The interplay of subjective social status and essentialist beliefs about cognitive aging on cortisol reactivity to challenge in older adults. Psychophysiology 2016, 53, 1256–1262. [Google Scholar] [CrossRef]
- Präg, P.; Mills, M.C.; Wittek, R. Subjective socioeconomic status and health in cross-national comparison. Soc. Sci. Med. 2016, 149, 84–92. [Google Scholar] [CrossRef] [PubMed]
- Euteneuer, F. Subjective social status and health. Curr. Opin. Psychiatry 2014, 5, 337–343. [Google Scholar] [CrossRef]
- Zahodne, L.B.; Kraak, A.Z.; Zaheed, A.; Sol, K. Subjective Social Status predicts late-life memory trajectories through both mental and physical health pathways. Gerontology 2018, 64, 466–474. [Google Scholar] [CrossRef]
- Goldman, N.; Cornman, J.; Chang, M.C. Measuring subjective social status: A case study of older Taiwanese. J. Cross Cult. Gerontol. 2006, 21, 71–89. [Google Scholar] [CrossRef] [PubMed]
- Wechsler, D. Adult Intelligence Scale—Fourth Edition (WAIS-IV); Psychological Corporation: San Antonio, Texas, USA, 2008. [Google Scholar]
- Asociación Mexicana de Agencias de Inteligencia de Mercado y Opinión (AMAI) The Mexican Association of Marketing Research and Public Opinion Agencies. Available online: https://nse.amai.org/niveles-socio-economicos-amai/ (accessed on 13 November 2018).
- Adler, N.E.; Epel, E.S.; Castellazzo, G.; Ickovics, J.R. Relationship of subjective and objective social status with psychological and physiological functioning: Preliminary data in healthy white women. Health Psychol. 2000, 19, 586–592. [Google Scholar] [CrossRef] [PubMed]
- Hernández, J.L.; Valdés, P.; Biscay, R.; Virues, T.; Szava, S.; Bosch, J.; Riquenes, A.; Clark, I. A global scale factor in brain topography. Int. J. Neurosci. 1994, 76, 267–278. [Google Scholar] [CrossRef] [PubMed]
- Valdés, P.; Biscay, R.; Galán, L.; Bosch, J.; Zsava, S.; Virués, T. High resolution spectral EEG norms topography. Brain Topogr 1990, 3, 281–282. [Google Scholar]
- Wennig, R. Potential problems with the interpretation of hair analysis results. Foresinc Sci. Int. 2000, 107, 5–12. [Google Scholar] [CrossRef]
- Stern, Y.; Gurland, B.; Tatemichi, T.; Tang, M.; Wilder, D.; Mayeux, R. Influence of education and occupation on the incidence of Alzheimer’s disease. JAMA 1994, 27, 1004–1010. [Google Scholar] [CrossRef]
- Caamaño-Isorna, F.; Corral, M.; Montes-Martínez, A.; Takkouche, B. Education and Dementia: A meta-analytic study. Neuroepidemiology 2006, 26, 226–232. [Google Scholar] [CrossRef] [PubMed]
- Swaab, D.F. Brain aging and Alzheimer’s disease, “wear and tear” versus “use it or lose it”. Neurobiol. Aging 1991, 12, 317–324. [Google Scholar] [CrossRef]
- Stern, Y. Cognitive reserve. Neuropsychologia 2009, 47, 2015–2028. [Google Scholar] [CrossRef] [PubMed]
- Andersen, I.; Burr, H.; Kristensen, T.S.; Gamborg, M.; Osler, M.; Prescott, E.; Diderichsen, F. Do factors in the psychosocial work environment mediate the effect of socioeconomic position on the risk of myocardial infarction? Study from the copenhagen centre for prospective population studies. Occup. Environ. Med. 2004, 61, 886–892. [Google Scholar] [CrossRef]
- Kristensen, T.S.; Borg, V.; Hannerz, H. Socioeconomic status and psychosocial work environment: Results from a Danish national study. Scand. J. Public Health 2002, 59, 41–48. [Google Scholar] [CrossRef]
- Christ, S.E.; Van Essen, D.C.; Watson, J.M.; Brubaker, L.E.; McDermott, K.B. The contributions of prefrontal cortex and executive control to deception: Evidence from activation likelihood estimate meta-analyses. Cereb. Cortex 2009, 19, 1557–1566. [Google Scholar] [CrossRef] [PubMed]
- Wee, L.E.; Yeo, W.X.; Yang, G.R.; Hannan, N.; Lim, K.; Chua, C.; Tan, M.Y.; Fong, N.; Yeap, A.; Chen, L.; et al. Individual and area level socioeconomic status and its sssociation with cognitive function and cognitive impairment (Low MMSE) among community-dwelling elderly in Singapore. Dement. Geriatr. Cogn. Disord. 2012, 2, 529–542. [Google Scholar] [CrossRef] [PubMed]
- Huang, Y.; Yim, O.S.; Lai, P.S.; Yu, R.; Chew, S.H.; Gwee, X.; Nyunt, M.S.Z.; Gao, Q.; Ng, T.-P.; Ebstein, R.P.; et al. Successful aging, cognitive function, socioeconomic status, and leukocyte telomere length. Psychoneuroendocrinology 2019, 103, 180–187. [Google Scholar] [CrossRef] [PubMed]
- Moretti, D.V. Electroencephalography reveals lower regional blood perfusion and atrophy of the temporoparietal network associated with memory deficits and hippocampal volume reduction in mild cognitive impairment due to Alzheimer’s disease. Neuropsychiatr. Dis. Treat. 2015, 11, 461–470. [Google Scholar] [CrossRef]
- Babiloni, C.; Del Percio, C.; Pascarelli, M.T.; Lizio, R.; Noce, G.; Lopez, S.; Rizzo, M.; Ferri, R.; Soricelli, A.; Nobili, F.; et al. Abnormalities of functional cortical source connectivity of resting-state electroencephalographic alpha rhythms are similar in patients with mild cognitive impairment due to Alzheimer’s and Lewy body diseases. Neurobiol. Aging 2019, 77, 112–127. [Google Scholar] [CrossRef]
- Smailovic, U.; Koenig, T.; Kåreholt, I.; Andersson, T.; Kramberger, M.G.; Winblad, B.; Jelic, V. Quantitative EEG power and synchronization correlate with Alzheimer’s disease CSF biomarkers. Neurobiol. Aging 2018, 63, 88–95. [Google Scholar] [CrossRef]
- Cutler, D.; Lleras-Muney, A.; Vogl, T. Socioeconomic status and health: Dimensions and mechanisms. Work. Pap. Ser. 2008, 14333, 1–50. [Google Scholar]
- Dowd, J.; Simanek, A.; Aiello, A. Socio-economic status, cortisol and allostatic load: A review of the literature. Int. J. Epidemiol. 2009, 38, 1297–1309. [Google Scholar] [CrossRef]
- Vliegenthart, J.; Noppe, G.; van Rossum, E.; Koper, J.; Raat, H.; van den Akker, E. Socioeconomic status in children is associated with hair cortisol levels as a biological measure of chronic stress. Psychoneuroendocrinology 2016, 65, 9–14. [Google Scholar] [CrossRef]
- O’Brien, K.M.; Tronick, E.Z.; Moore, C.L. Relationship between hair cortisol and perceived chronic stress in a diverse sample. Stress Health 2013, 29, 337–344. [Google Scholar] [CrossRef] [PubMed]
- Kudielka, B.M.; Hellhammer, D.H.; Wüst, S. Why do we respond so differently? Reviewing determinants of human salivary cortisol responses to challenge. Psychoneuroendocrinology 2009, 34, 2–18. [Google Scholar] [CrossRef] [PubMed]


| Frequency Band | Factor | High Status (n = 17) (Mean ± SEM) | Low Status (n = 13) (Mean ± SEM) | U Mann–Whitney | p |
|---|---|---|---|---|---|
| Delta | Factor 1 | 0.100 ± 0.298 | −0.165 ± 0.181 | 113 | 0.93 |
| Factor 2 | −0.211 ± 0.245 | 0.098 ± 0.218 | 95 | 0.53 | |
| Factor 3 | −0.480 ± 0.225 | 0.602 ± 0.219 | 40 | 0.002 | |
| Theta | Factor 1 | 0.110 ± 0.237 | −0.204 ± 0.293 | 131 | 0.41 |
| Factor 2 | −0.021 ± 0.299 | 0.022 ± 0.189 | 100 | 0.68 | |
| Factor 3 | −0.304 ± 0.222 | 0.457 ± 0.274 | 61 | 0.039 | |
| Alpha | Factor 1 | 0.078 ± 0.198 | −0.214 ± 0.326 | 114 | 0.9 |
| Factor 2 | −0.006 ± 0.225 | −0.011 ± 0.322 | 137 | 0.28 | |
| Factor 3 | 0.225 ± 0.247 | −0.395 ± 0.238 | 58 | 0.028 | |
| Beta | Factor 1 | 0.208 ± 0.211 | −0.145 ± 0.301 | 150 | 0.10 |
| Factor 2 | 0.220 ± 0.214 | −0.132 ± 0.283 | 139 | 0.24 | |
| Factor 3 | 0.026 ± 0.248 | −0.001 ± 0.289 | 142 | 0.19 | |
| Factor 4 | 0.203 ± 0.231 | −0.421 ± 0.232 | 88 | 0.36 | |
| Factor 5 | 0.272 ± 0.262 | −0.355 ± 0.237 | 164 | 0.025 |
© 2020 by the authors. Licensee MDPI, Basel, Switzerland. This article is an open access article distributed under the terms and conditions of the Creative Commons Attribution (CC BY) license (http://creativecommons.org/licenses/by/4.0/).
Share and Cite
Villada, C.; González-López, M.; Aguilar-Zavala, H.; Fernández, T. Resting EEG, Hair Cortisol and Cognitive Performance in Healthy Older People with Different Perceived Socioeconomic Status. Brain Sci. 2020, 10, 635. https://doi.org/10.3390/brainsci10090635
Villada C, González-López M, Aguilar-Zavala H, Fernández T. Resting EEG, Hair Cortisol and Cognitive Performance in Healthy Older People with Different Perceived Socioeconomic Status. Brain Sciences. 2020; 10(9):635. https://doi.org/10.3390/brainsci10090635
Chicago/Turabian StyleVillada, Carolina, Mauricio González-López, Herlinda Aguilar-Zavala, and Thalía Fernández. 2020. "Resting EEG, Hair Cortisol and Cognitive Performance in Healthy Older People with Different Perceived Socioeconomic Status" Brain Sciences 10, no. 9: 635. https://doi.org/10.3390/brainsci10090635
APA StyleVillada, C., González-López, M., Aguilar-Zavala, H., & Fernández, T. (2020). Resting EEG, Hair Cortisol and Cognitive Performance in Healthy Older People with Different Perceived Socioeconomic Status. Brain Sciences, 10(9), 635. https://doi.org/10.3390/brainsci10090635