Stimulus Intensity Affects Variability of Motor Evoked Responses of the Non-Paretic, but Not Paretic Tibialis Anterior Muscle in Stroke


Abstract
:1. Introduction
2. Materials and Methods
2.1. Electromyography (EMG)
2.2. TMS
2.3. Data and Statistical Analyses
2.3.1. Data Analyses
2.3.2. Statistical Analyses
3. Results
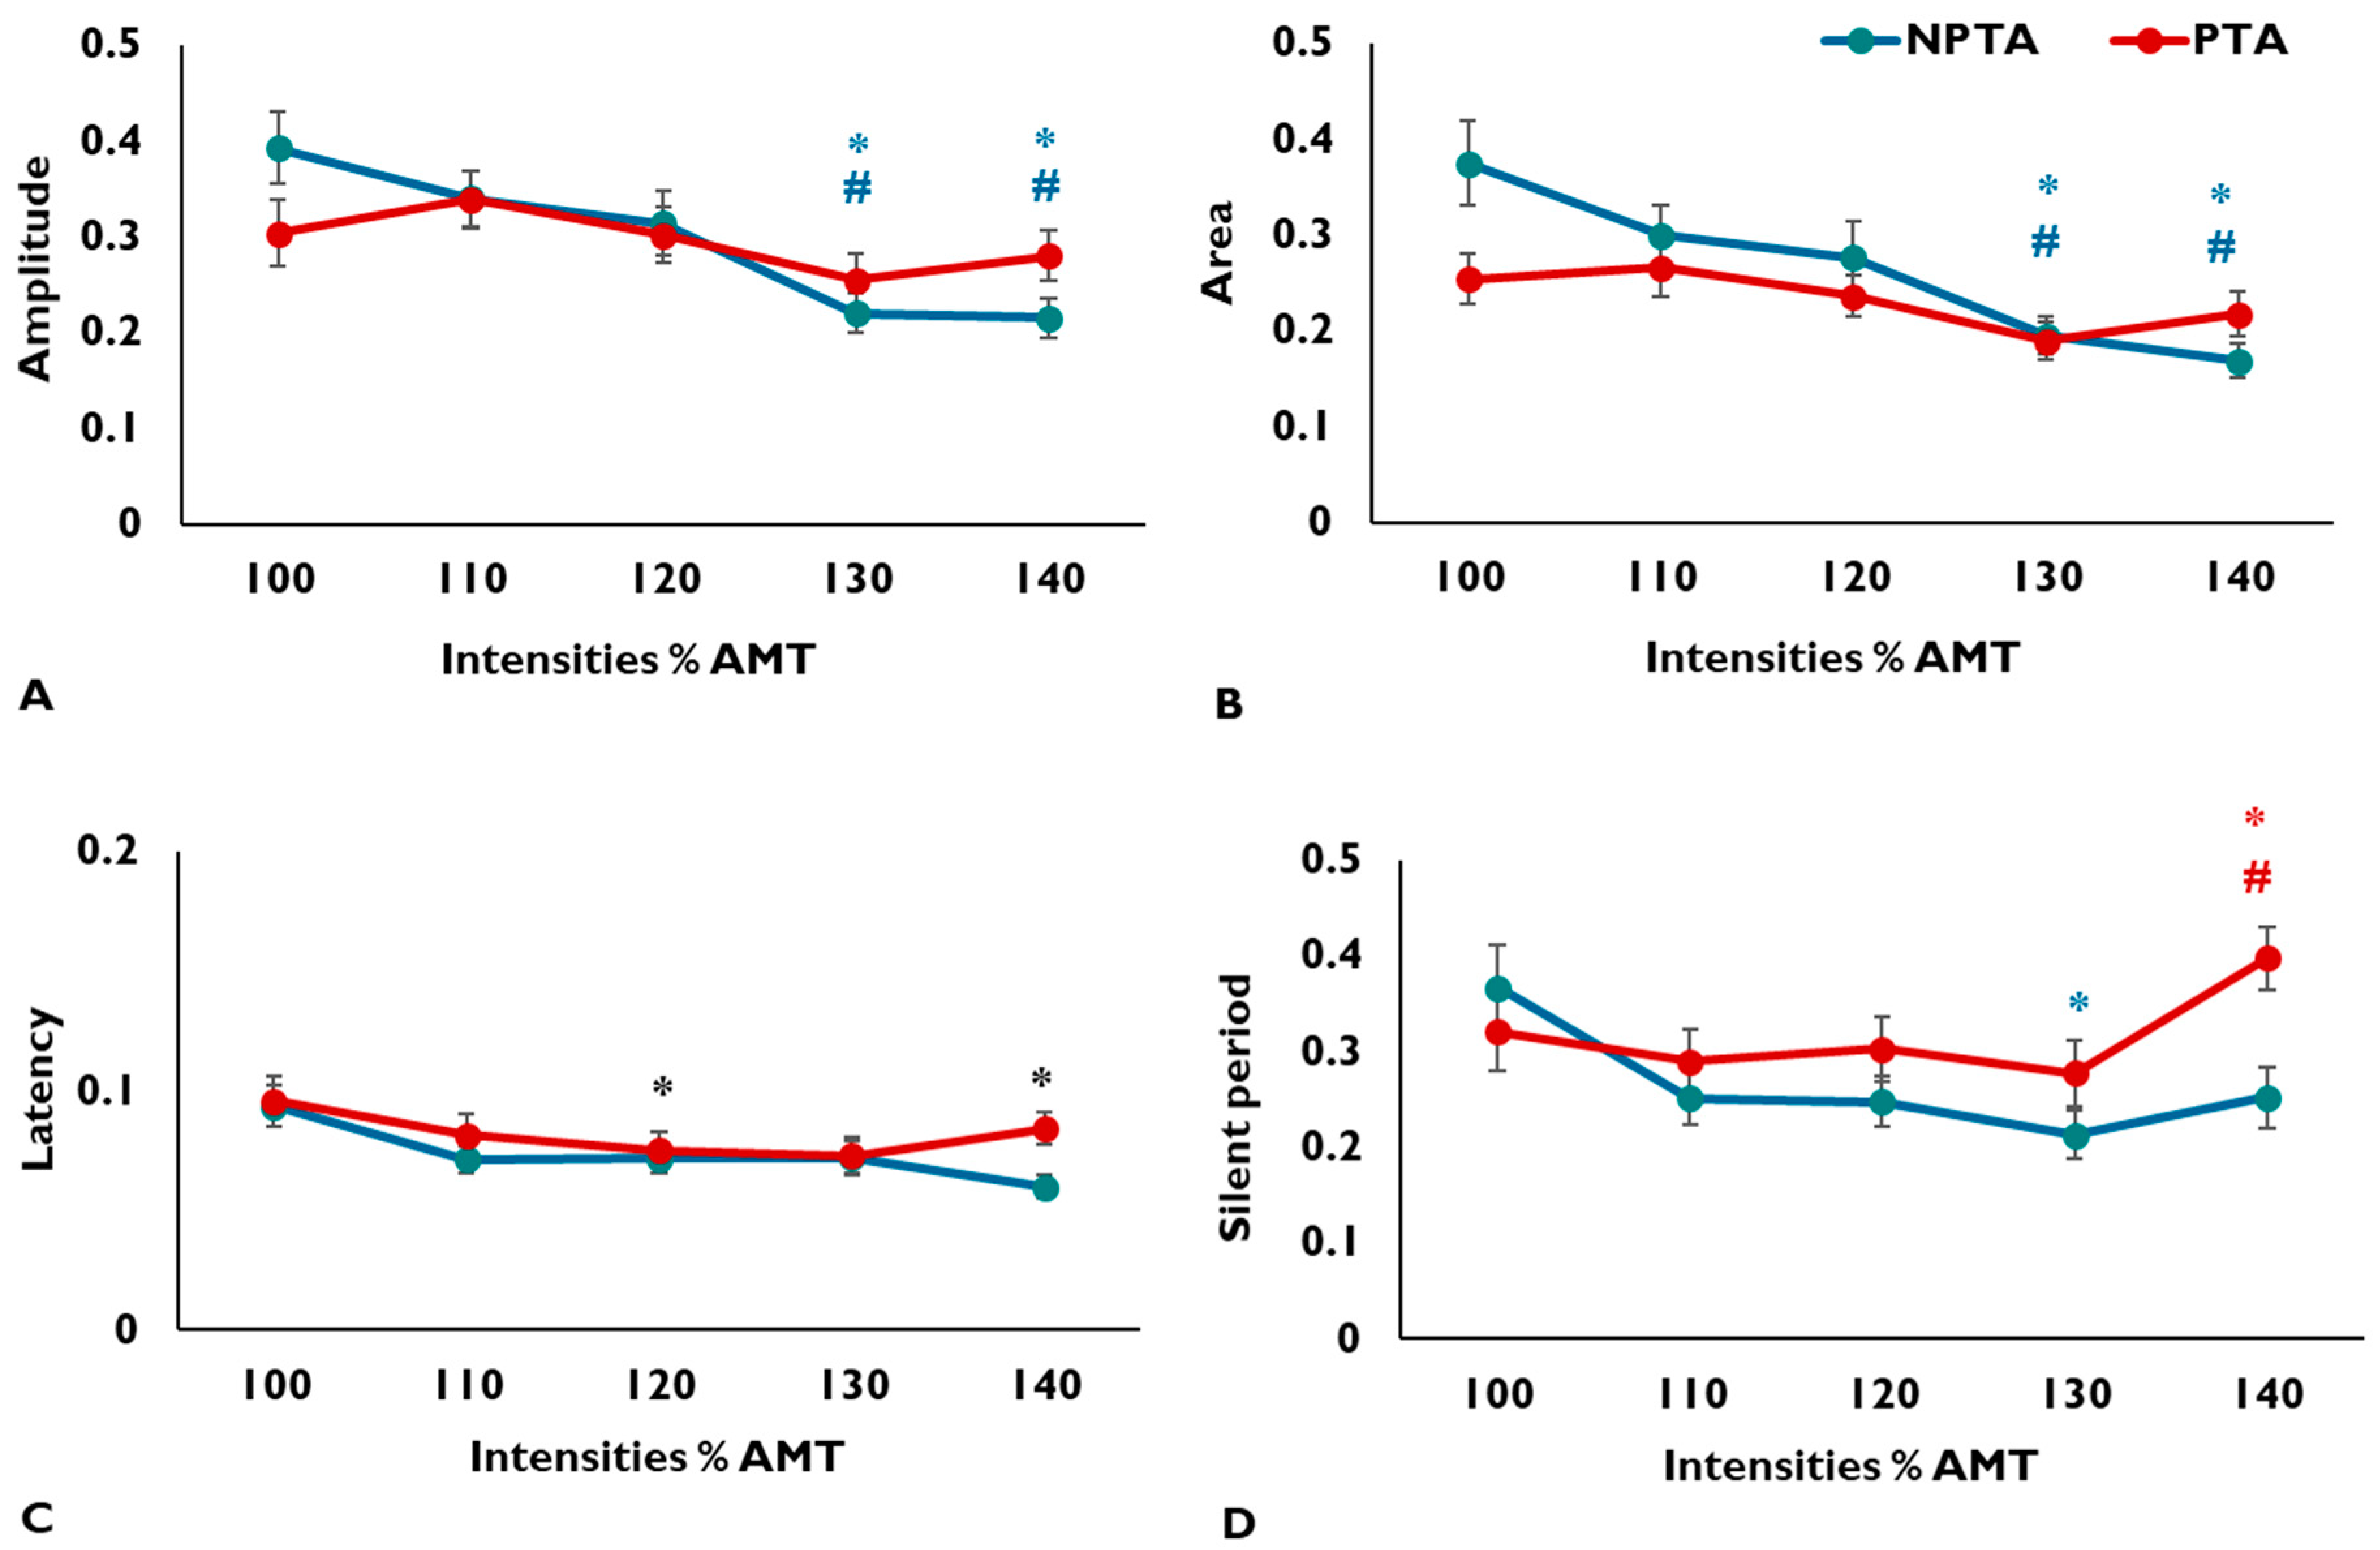
3.1. MEP Amplitude
3.2. MEP Area
3.3. MEP Latency
3.4. CSP Duration
4. Discussion
4.1. Variability in MEP Amplitude and Area
4.2. Variability in MEP Latency and Silent Period
4.3. Study Limitations
5. Conclusions
Author Contributions
Funding
Acknowledgments
Conflicts of Interest
References
- Kiers, L.; Cros, D.; Chiappa, K.; Fang, J. Variability of motor potentials evoked by transcranial magnetic stimulation. Electroencephalogr. Clin. Neurophysiol. 1993, 89, 415–423. [Google Scholar] [CrossRef]
- Thickbroom, G.; Byrnes, M.; Mastaglia, F. A model of the effect of MEP amplitude variation on the accuracy of TMS mapping. Clin. Neurophysiol. 1999, 110, 941–943. [Google Scholar] [CrossRef]
- Kischka, U.; Fajfr, R.; Fellenberg, T.; Hess, C.W. Facilitation of motor evoked potentials from magnetic brain stimulation in man: A comparative study of different target muscles. J. Clin. Neurophysiol. Off. Publ. Am. Electroencephalogr. Soc. 1993, 10, 505–512. [Google Scholar] [CrossRef] [PubMed]
- Darling, W.G.; Wolf, S.L.; Butler, A.J. Variability of motor potentials evoked by transcranial magnetic stimulation depends on muscle activation. Exp. Brain Res. 2006, 174, 376–385. [Google Scholar] [CrossRef] [Green Version]
- Bell, S.J.; Lauer, A.; Lench, D.H.; Hanlon, C.A. Visual Attention Affects the Amplitude of the Transcranial Magnetic Stimulation-Associated Motor Evoked Potential: A Preliminary Study With Clinical Utility. J. Psychiatr. Pract. 2018, 24, 220. [Google Scholar] [CrossRef]
- Tamm, A.S.; Lagerquist, O.; Ley, A.L.; Collins, D.F. Chronotype influences diurnal variations in the excitability of the human motor cortex and the ability to generate torque during a maximum voluntary contraction. J. Biol. Rhythm. 2009, 24, 211–224. [Google Scholar] [CrossRef] [Green Version]
- Pitcher, J.B.; Ogston, K.M.; Miles, T.S. Age and sex differences in human motor cortex input–output characteristics. J. Physiol. 2003, 546, 605–613. [Google Scholar] [CrossRef]
- Goetz, S.M.; Luber, B.; Lisanby, S.H.; Peterchev, A.V. A novel model incorporating two variability sources for describing motor evoked potentials. Brain Stimul. 2014, 7, 541–552. [Google Scholar] [CrossRef] [Green Version]
- Julkunen, P.; Ruohonen, J.; Sääskilahti, S.; Säisänen, L.; Karhu, J. Threshold curves for transcranial magnetic stimulation to improve reliability of motor pathway status assessment. Clin. Neurophysiol. 2011, 122, 975–983. [Google Scholar] [CrossRef]
- Smith, M.-C.; Stinear, C.M. Transcranial magnetic stimulation (TMS) in stroke: Ready for clinical practice? J. Clin. Neurosci. 2016, 31, 10–14. [Google Scholar] [CrossRef]
- Lewis, G.N.; Signal, N.; Taylor, D. Reliability of lower limb motor evoked potentials in stroke and healthy populations: How many responses are needed? Clin. Neurophysiol. 2014, 125, 748–754. [Google Scholar] [CrossRef] [PubMed] [Green Version]
- Bashir, S.; Yoo, W.-K.; Kim, H.S.; Lim, H.S.; Rotenberg, A.; Abu Jamea, A. The number of pulses needed to measure corticospinal excitability by navigated transcranial magnetic stimulation: Eyes open vs. close condition. Front Hum. Neurosci. 2017, 11, 121. [Google Scholar] [CrossRef] [PubMed] [Green Version]
- Bastani, A.; Jaberzadeh, S. A higher number of TMS-elicited MEP from a combined hotspot improves intra-and inter-session reliability of the upper limb muscles in healthy individuals. PLoS ONE 2012, 7, e47582. [Google Scholar] [CrossRef] [PubMed] [Green Version]
- Cavaleri, R.; Schabrun, S.M.; Chipchase, L.S. The number of stimuli required to reliably assess corticomotor excitability and primary motor cortical representations using transcranial magnetic stimulation (TMS): A systematic review and meta-analysis. Syst. Rev. 2017, 6, 48. [Google Scholar] [CrossRef] [PubMed] [Green Version]
- Christie, A.; Fling, B.; Crews, R.T.; Mulwitz, L.A.; Kamen, G. Reliability of motor-evoked potentials in the ADM muscle of older adults. J. Neurosci. Methods 2007, 164, 320–324. [Google Scholar] [CrossRef] [PubMed]
- Luc, B.A.; Lepley, A.S.; Tevald, M.A.; Gribble, P.A.; White, D.B.; Pietrosimone, B.G. Reliability of corticomotor excitability in leg and thigh musculature at 14 and 28 days. J. Sport. Rehabil. 2014, 23, 330–338. [Google Scholar] [CrossRef] [PubMed]
- Beaulieu, L.-D.; Massé-Alarie, H.; Ribot-Ciscar, E.; Schneider, C. Reliability of lower limb transcranial magnetic stimulation outcomes in the ipsi-and contralesional hemispheres of adults with chronic stroke. Clin. Neurophysiol. 2017, 128, 1290–1298. [Google Scholar] [CrossRef]
- Groppa, S.; Oliviero, A.; Eisen, A.; Quartarone, A.; Cohen, L.; Mall, V.; Kaelin-Lang, A.; Mima, T.; Rossi, S.; Thickbroom, G. A practical guide to diagnostic transcranial magnetic stimulation: Report of an IFCN committee. Clin. Neurophysiol. 2012, 123, 858–882. [Google Scholar] [CrossRef] [Green Version]
- Cacchio, A.; Paoloni, M.; Cimini, N.; Mangone, M.; Liris, G.; Aloisi, P.; Santilli, V.; Marrelli, A. Reliability of TMS-related measures of tibialis anterior muscle in patients with chronic stroke and healthy subjects. J. Neurol. Sci. 2011, 303, 90–94. [Google Scholar] [CrossRef]
- Hermens, H.J.; Freriks, B.; Merletti, R.; Stegeman, D.; Blok, J.; Rau, G.; Disselhorst-Klug, C.; Hägg, G. European recommendations for surface electromyography. Roessingh Res. Dev. 1999, 8, 13–54. [Google Scholar]
- Sivaramakrishnan, A.; Tahara-Eckl, L.; Madhavan, S. Spatial localization and distribution of the TMS-related ‘hotspot’of the tibialis anterior muscle representation in the healthy and post-stroke motor cortex. Neurosci. Lett. 2016, 627, 30–35. [Google Scholar] [CrossRef] [PubMed] [Green Version]
- Awiszus, F. TMS and threshold hunting. In Supplements to Clinical Neurophysiology; Elsevier: Amsterdam, The Netherlands, 2003; Volume 56, pp. 13–23. [Google Scholar]
- Madhavan, S.; Rogers, L.M.; Stinear, J.W. A paradox: After stroke, the non-lesioned lower limb motor cortex may be maladaptive. Eur. J. Neurosci. 2010, 32, 1032–1039. [Google Scholar] [CrossRef] [PubMed] [Green Version]
- Brown, C.E. Coefficient of variation. In Applied Multivariate Statistics in Geohydrology and Related Sciences; Springer: Berlin, Germany, 1998; pp. 155–157. [Google Scholar]
- Cohen, J. Statistical Power Analysis for the Behavioral Sciences; Academic Press: New York, NY, USA, 2013. [Google Scholar]
- Richardson, J.T. Eta squared and partial eta squared as measures of effect size in educational research. Educ. Res. Rev. 2011, 6, 135–147. [Google Scholar] [CrossRef]
- Potter-Baker, K.A.; Lin, Y.-L.; Machado, A.G.; Conforto, A.B.; Cunningham, D.A.; Sankarasubramanian, V.; Sakaie, K.; Plow, E.B. Variability of motor evoked potentials in stroke explained by corticospinal pathway integrity. Brain Stimul. 2018, 11, 929–931. [Google Scholar] [CrossRef]
- Devanne, H.; Lavoie, B.; Capaday, C. Input-output properties and gain changes in the human corticospinal pathway. Exp. Brain Res. 1997, 114, 329–338. [Google Scholar] [CrossRef] [PubMed]
- Chipchase, L.; Schabrun, S.; Cohen, L.; Hodges, P.; Ridding, M.; Rothwell, J.; Taylor, J.; Ziemann, U. A checklist for assessing the methodological quality of studies using transcranial magnetic stimulation to study the motor system: An international consensus study. Clin. Neurophysiol. 2012, 123, 1698–1704. [Google Scholar] [CrossRef] [Green Version]
- Di Lazzaro, V.; Profice, P.; Ranieri, F.; Capone, F.; Dileone, M.; Oliviero, A.; Pilato, F. I-wave origin and modulation. Brain Stimul. 2012, 5, 512–525. [Google Scholar] [CrossRef]
- Di Lazzaro, V.; Rothwell, J.C. Corticospinal activity evoked and modulated by non-invasive stimulation of the intact human motor cortex. J. Physiol. 2014, 592, 4115–4128. [Google Scholar] [CrossRef]
- Fink, K.L.; Cafferty, W.B. Reorganization of intact descending motor circuits to replace lost connections after injury. Neurotherapeutics 2016, 13, 370–381. [Google Scholar] [CrossRef] [Green Version]
- Ziemann, U.; Ishii, K.; Borgheresi, A.; Yaseen, Z.; Battaglia, F.; Hallett, M.; Cincotta, M.; Wassermann, E.M. Dissociation of the pathways mediating ipsilateral and contralateral motor-evoked potentials in human hand and arm muscles. J. Physiol. 1999, 518, 895–906. [Google Scholar] [CrossRef]
- Säisänen, L.; Julkunen, P.; Niskanen, E.; Danner, N.; Hukkanen, T.; Lohioja, T.; Nurkkala, J.; Mervaala, E.; Karhu, J.; Könönen, M. Motor potentials evoked by navigated transcranial magnetic stimulation in healthy subjects. J. Clin. Neurophysiol. 2008, 25, 367–372. [Google Scholar] [CrossRef] [PubMed]
- Wassermann, E.M. Variation in the response to transcranial magnetic brain stimulation in the general population. Clin. Neurophysiol. 2002, 113, 1165–1171. [Google Scholar] [CrossRef]
- Fuhr, P.; Cohen, L.G.; Roth, B.J.; Hallett, M. Latency of motor evoked potentials to focal transcranial stimulation varies as a function of scalp positions stimulated. Electroencephalogr. Clin. Neurophysiol. 1991, 81, 81–89. [Google Scholar] [CrossRef]
- Terao, Y.; Ugawa, Y.; Sakai, K.; Miyauchi, S.; Fukuda, H.; Sasaki, Y.; Takino, R.; Hanajima, R.; Furubayashi, T.; Pütz, B. Localizing the site of magnetic brain stimulation by functional MRI. Exp. Brain Res. 1998, 121, 145–152. [Google Scholar] [CrossRef] [PubMed]
- Orth, M.; Rothwell, J. The cortical silent period: Intrinsic variability and relation to the waveform of the transcranial magnetic stimulation pulse. Clin. Neurophysiol. 2004, 115, 1076–1082. [Google Scholar] [CrossRef]
- Ho, K.-H.; Nithi, K.; Mills, K. Covariation between human intrinsic hand muscles of the silent periods and compound muscle action potentials evoked by magnetic brain stimulation: Evidence for common inhibitory connections. Exp. Brain Res. 1998, 122, 433–440. [Google Scholar] [CrossRef]

| Age (years) | 60.76 (10.28) |
| Sex (female, n, %) | 8, 30.76% |
| Affected side (right, n, %) | 11, 42.3% |
| Type of stroke (I/H) * | 14/9 |
| Time since stroke (years) | 5.05 (4.28) |
| FMLE (paretic) | 24.26 (3.07) |
| Gait speed (self-selected) (m/s) | 0.78 (0.21) |
| Intensities (%AMT) | Amplitude (mV) | Area (mVs) | Latency (ms) | CSP (ms) | Intensities (% MSO) |
|---|---|---|---|---|---|
| Non-paretic tibialis anterior | |||||
| 100 | 0.31 ± 0.1 | 1.77 ± 0.8 | 29.02 ± 2.4 | 69.66 ± 45.8 | 39.54 ± 8.1 |
| 110 | 0.45 ± 0.2 | 2.72 ± 1.5 | 28.03 ± 3.1 | 88.88 ± 51.2 | 43.50 ± 8.8 |
| 120 | 0.62 ± 0.2 | 3.93 ± 1.9 | 28.02 ± 2.3 | 98.86 ± 48.1 | 47.46 ± 9.5 |
| 130 | 0.75 ± 0.3 | 5.07 ± 2.6 | 27.19 ± 3.0 | 111.25 ± 55.2 | 51.42 ± 10.3 |
| 140 | 0.81 ± 0.3 | 5.41 ± 2.7 | 27.41 ± 3.3 | 109.46 ± 54.2 | 55.38 ± 11.0 |
| Paretic tibialis anterior | |||||
| 100 | 0.19 ± 0.1 | 1.81 ± 0.8 | 32.01 ± 4.8 | 107.77 ± 74.5 | 48.88 ± 10.7 |
| 110 | 0.26 ± 0.1 | 2.54 ± 1.5 | 32.18 ± 5.5 | 114.32 ± 77.3 | 53.77 ± 11.6 |
| 120 | 0.36 ± 0.2 | 3.27 ± 1.6 | 32.10 ± 5.2 | 124.85 ± 75.0 | 58.54 ± 12.5 |
| 130 | 0.41 ± 0.2 | 3.79 ± 2.0 | 31.46 ± 4.9 | 131.95 ± 95.7 | 63.35 ± 13.4 |
| 140 | 0.48 ± 0.3 | 4.46 ± 2.3 | 31.28 ± 5.1 | 125.79 ± 94.7 | 68.15 ± 14.4 |
© 2020 by the authors. Licensee MDPI, Basel, Switzerland. This article is an open access article distributed under the terms and conditions of the Creative Commons Attribution (CC BY) license (http://creativecommons.org/licenses/by/4.0/).
Share and Cite
Sivaramakrishnan, A.; Madhavan, S. Stimulus Intensity Affects Variability of Motor Evoked Responses of the Non-Paretic, but Not Paretic Tibialis Anterior Muscle in Stroke. Brain Sci. 2020, 10, 297. https://doi.org/10.3390/brainsci10050297
Sivaramakrishnan A, Madhavan S. Stimulus Intensity Affects Variability of Motor Evoked Responses of the Non-Paretic, but Not Paretic Tibialis Anterior Muscle in Stroke. Brain Sciences. 2020; 10(5):297. https://doi.org/10.3390/brainsci10050297
Chicago/Turabian StyleSivaramakrishnan, Anjali, and Sangeetha Madhavan. 2020. "Stimulus Intensity Affects Variability of Motor Evoked Responses of the Non-Paretic, but Not Paretic Tibialis Anterior Muscle in Stroke" Brain Sciences 10, no. 5: 297. https://doi.org/10.3390/brainsci10050297
APA StyleSivaramakrishnan, A., & Madhavan, S. (2020). Stimulus Intensity Affects Variability of Motor Evoked Responses of the Non-Paretic, but Not Paretic Tibialis Anterior Muscle in Stroke. Brain Sciences, 10(5), 297. https://doi.org/10.3390/brainsci10050297