Early Mortality of Brain Infarction Patients and Red Blood Cell Distribution Width

 , , , ,
Abstract
1. Introduction
2. Methods
2.1. Design and Subjects
2.2. Statistical Methods
3. Results
4. Discussion
5. Conclusions
Author Contributions
Funding
Conflicts of Interest
References
- Aslan, D.; Gümrük, F.; Gürgey, A.; Altay, C. Importance of RDW value in differential diagnosis of hypochrome anemias. Am. J. Hematol. 2002, 69, 31–33. [Google Scholar] [CrossRef] [PubMed]
- Abrahan, L.L., 4th; Ramos, J.D.A.; Cunanan, E.L.; Tiongson, M.D.A.; Punzalan, F.E.R. Red Cell Distribution Width and Mortality in Patients with Acute Coronary Syndrome: A Meta-Analysis on Prognosis. Cardiol. Res. 2018, 9, 144–152. [Google Scholar] [CrossRef] [PubMed]
- Fontana, V.; Spadaro, S.; Villois, P.; Righy Shinotsuka, C.; Fogagnolo, A.; Nobile, L.; Vincent, J.L.; Creteur, J.; Taccone, F.S. Can red blood cell distribution width predict outcome after cardiac arrest? Minerva Anestesiol. 2018, 84, 693–702. [Google Scholar]
- Salvatori, M.; Formiga, F.; Moreno-Gónzalez, R.; Chivite, D.; Migone De Amicis, M.; Cappellini, M.D.; Corbella, X. Red blood cell distribution width as a prognostic factor of mortality in elderly patients firstly hospitalized due to heart failure. Kardiol. Pol. 2019, 77, 632–638. [Google Scholar] [CrossRef] [PubMed]
- Goyal, H.; Awad, H.; Hu, Z.D. Prognostic value of admission red blood cell distribution width in acute pancreatitis: A systematic review. Ann. Transl. Med. 2017, 5, 342. [Google Scholar] [CrossRef]
- Milas, G.P.; Karageorgiou, V.; Cholongitas, E. Red cell distribution width to platelet ratio for liver fibrosis: A systematic review and meta-analysis of diagnostic accuracy. Expert Rev. Gastroenterol. Hepatol. 2019, 13, 877–891. [Google Scholar] [CrossRef]
- Hu, Z.D.; Lippi, G.; Montagnana, M. Diagnostic and prognostic value of red blood cell distribution width in sepsis: A narrative review. Clin. Biochem. 2020, 77, 1–6. [Google Scholar] [CrossRef]
- Lorente, L.; Martín, M.M.; Abreu-González, P.; Solé-Violán, J.; Ferreres, J.; Labarta, L.; Díaz, C.; González, O.; García, D.; Jiménez, A.; et al. Red Blood Cell Distribution Width during the First Week Is Associated with Severity and Mortality in Septic Patients. PLoS ONE 2014, 9, e105436. [Google Scholar] [CrossRef]
- Zhang, B.; Zhao, J. Red blood cell distribution width as a prognostic biomarker for mortality in traumatic brain injury. Int. J. Clin. Exp. Med. 2015, 8, 19172–19175. [Google Scholar]
- Song, S.Y.; Hua, C.; Dornbors, D., 3rd; Kang, R.J.; Zhao, X.X.; Du, X.; He, W.; Ding, Y.C.; Meng, R. Baseline Red Blood Cell Distribution Width as a Predictor of Stroke Occurrence and Outcome: A Comprehensive Meta-Analysis of 31 Studies. Front. Neurol. 2019, 10, 1237. [Google Scholar] [CrossRef]
- Wang, F.; Yu, Q.; Wu, X.; Ju, X.; Wang, L.; Hu, S. Correlation between the red blood cell distribution width and prognosis in elderly patients with cerebral infarction and severe hemiplegia. Chin. J. Cerebrovasc. Dis. 2015, 6, 287–291. [Google Scholar]
- Fan, L.; Gui, L.; Chai, E.Q.; Wei, C.J. Routine hematological parameters are associated with short- and long-term prognosis of patients with ischemic stroke. J. Clin. Lab. Anal. 2018, 32, 2. [Google Scholar] [CrossRef] [PubMed]
- Kim, J.; Kim, Y.D.; Song, T.J.; Park, J.H.; Lee, H.S.; Nam, C.M.; Nam, H.S.; Heo, J.H. Red blood cell distribution width is associated with poor clinical outcome in acute cerebral infarction. Thromb. Haemost. 2012, 108, 349–356. [Google Scholar] [CrossRef] [PubMed]
- Duchnowski, P.; Hryniewiecki, T.; Kusmierczyk, M.; Szymanski, P. Red cell distribution width is a prognostic marker of perioperative stroke in patients undergoing cardiac valve surgery. Interact. Cardiovasc. Thorac. Surg. 2017, 25, 925–929. [Google Scholar] [CrossRef] [PubMed]
- Teasdale, G.; Jennett, B. Assessement of coma and impaired conciousness. A practical scale. Lancet 1974, 2, 81–84. [Google Scholar] [CrossRef]
- Knaus, W.A.; Draper, E.A.; Wagner, D.P.; Zimmerman, J.E. APACHE II: A severity of disease classification system. Crit. Care Med. 1985, 13, 818–829. [Google Scholar] [CrossRef]
- Lorente, L.; Martín, M.M.; Abreu-González, P.; Ramos, L.; Argueso, M.; Solé-Violán, J.; Riaño-Ruiz, M.; Jiménez, A. Serum malondialdehyde levels in patients with malignant middle cerebral artery infarction are associated with mortality. PLoS ONE 2015, 10, e0125893. [Google Scholar] [CrossRef]
- Lorente, L.; Martín, M.M.; Abreu-González, P.; Sabatel, R.; Ramos, L.; Argueso, M.; Solé-Violán, J.; Riaño-Ruiz, M.; García-Marín, V. Serum malondialdehyde levels and mortality in patients with spontaneous intracerebral haemorrhage. World Neurosurg. 2018, 113, e542–e547. [Google Scholar] [CrossRef]
- Zangari, R.; Zanier, E.R.; Torgano, G.; Bersano, A.; Beretta, S.; Beghi, E.; Casolla, B.; Checcarelli, N.; Lanfranconi, S.; Maino, A.; et al. Early ficolin-1 is a sensitive prognostic marker for functional outcome in ischemic stroke. J. Neuroinflammation 2016, 13, 16. [Google Scholar] [CrossRef]
- Di Napoli, M.; Slevin, M.; Popa-Wagner, A.; Singh, P.; Lattanzi, S.; Divani, A.A. Monomeric C-Reactive Protein and Cerebral Hemorrhage: From Bench to Bedside. Front. Immunol. 2018, 9, 1921. [Google Scholar] [CrossRef]
- Lattanzi, S.; Di Napoli, M.; Ricci, S.; Divani, A.A. Matrix Metalloproteinases in Acute Intracerebral Hemorrhage. Neurotherapeutics 2020. [Google Scholar] [CrossRef] [PubMed]
- Watters, O.; O’Connor, J.J. A role for tumor necrosis factor-α in ischemia and ischemic preconditioning. J. Neuroinflammation 2011, 8, 87. [Google Scholar] [CrossRef] [PubMed]
- Kagansky, N.; Levy, S.; Knobler, H. The Role of Hyperglycemia in Acute Stroke. Arch. Neurol. 2001, 58, 1209–1212. [Google Scholar] [CrossRef] [PubMed]
- Geng, X.; Liu, X.; Li, F.; Wang, J.; Sun, H.; Feng, A.; Sun, Y.; Sun, H.; Yang, F.; Zhao, J.; et al. Blood Pressure Variability at Different Time Periods Within First 24 Hours After Admission and Outcomes of Acute Ischemic Stroke. J. Clin. Hypertens. 2020, 22, 194–204. [Google Scholar] [CrossRef] [PubMed]
- Divani, A.A.; Liu, X.; Di Napoli, M.; Lattanzi, S.; Ziai, W.; James, M.L.; Jafarli, A.; Jafari, M.; Saver, J.L.; Hemphill, J.C.; et al. Blood Pressure Variability Predicts Poor In-Hospital Outcome in Spontaneous Intracerebral Hemorrhage. Stroke 2019, 50, 2023–2029. [Google Scholar] [CrossRef]
- Ghaffari, S. Oxidative stress in the regulation of normal and neoplastic hematopoiesis. Antioxid. Redox Signal. 2008, 10, 1923–1940. [Google Scholar] [CrossRef]
- Scharte, M.; Fink, M.P. Red blood cell physiology in critical illness. Crit. Care Med. 2003, 31, S651–S657. [Google Scholar] [CrossRef]
- Pierce, C.N.; Larson, D.F. Inflammatory cytokine inhibition of erythropoiesis in patients implanted with a mechanical circulatory assist device. Perfusion 2005, 20, 83–90. [Google Scholar] [CrossRef]
- Lippi, G.; Cervellin, G.; Sanchis-Gomar, F. Red blood cell distribution width: A marker of anisocytosis potentially associated with atrial fibrillation. World J. Cardiol. 2019, 11, 292–304. [Google Scholar] [CrossRef]
- Weymann, A.; Ali-Hasan-Al-Saegh, S.; Sabashnikov, A.; Popov, A.F.; Mirhosseini, S.J.; Liu, T.; Lotfaliani, M.; Sá, M.P.B.O.; Baker, W.L.L.; Yavuz, S.; et al. Prediction of New-Onset and Recurrent Atrial Fibrillation by Complete Blood Count Tests: A Comprehensive Systematic Review with Meta-Analysis. Med. Sci. Monit. Basic Res. 2017, 23, 79–222. [Google Scholar] [CrossRef]
- Weymann, A.; Ali-Hasan-Al-Saegh, S.; Popov, A.F.; Sabashnikov, A.; Mirhosseini, S.J.; Liu, T.; Tse, G.; Lotfaliani, M.; Ghanei, A.; Testa, L.; et al. Haematological indices as predictors of atrial fibrillation following isolated coronary artery bypass grafting, valvular surgery, or combined procedures: A systematic review with meta-analysis. Kardiol. Pol. 2018, 76, 107–118. [Google Scholar] [CrossRef] [PubMed]


| Survivors (n = 37) | Non-Survivors (n = 37) | p-Value | |
|---|---|---|---|
| Age (years): median (p 25–75) | 60 (47–68) | 61 (53–70) | 0.50 |
| Female: n (%) | 14 (37.8) | 14 (37.8) | 0.99 |
| Heart failure: n (%) | 1 (2.7) | 1 (2.7) | 0.99 |
| Diabetes mellitus: n (%) | 5 (13.5) | 9 (24.3) | 0.37 |
| COPD: n (%) | 1 (2.7) | 1 (2.7) | 0.99 |
| Chronic renal failure: n (%) | 2 (5.4) | 2 (5.4) | 0.99 |
| Arterial hypertension: n (%) | 21 (56.8) | 19 (51.4) | 0.82 |
| GCS score: median (p 25–75) | 8 (6–8) | 6 (3–7) | 0.01 |
| APACHE-II score: median (p 25–75) | 20 (16–25) | 22 (19–27) | 0.07 |
| Lactic acid (mmol/L): median (p 25–75) | 1.20 (0.90–1.70) | 1.60 (1.01–2.88) | 0.03 |
| Temperature (°C): median (p 25–75) | 36.4 (36.0–37.0) | 36.9 (36.0–37.2) | 0.10 |
| Bilirubin (mg/dL): median (p 25–75) | 0.60 (0.42–0.80) | 0.65 (0.35–1.13) | 0.85 |
| Glycemia (g/dL): median (p 25–75) | 127 (102–170) | 136 (113–161) | 0.50 |
| Creatinine (mg/dL): median (p 25–75) | 0.80 (0.65–1.10) | 1.00 (0.70–1.20) | 0.21 |
| Sodium (mEq/L): median (p 25–75) | 139 (136–143) | 140 (138–143) | 0.50 |
| PaO2 (mmHg): median (p 25–75) | 144 (104–285) | 115 (94–267) | 0.40 |
| PaO2/FIO2 ratio: median (p 25–75) | 293 (204–366) | 248 (188–320) | 0.18 |
| INR: median (p 25–75) | 1.06 (1.00–1.20) | 1.15 (1.01–1.31) | 0.05 |
| aPTT (seconds): median (p 25–75) | 28 (25–30) | 27 (26–32) | 0.99 |
| Platelets: median × 103/mm3 (p 25–75) | 200 (170–267) | 173 (134–212) | 0.02 |
| Fibrinogen (mg/dL): median (p 25–75) | 445 (415–526) | 419 (339–612) | 0.90 |
| Leukocytes: median × 103/mm3 (p 25–75) | 12.2 (9.5–17.0) | 13.8 (9.3–17.7) | 0.40 |
| Hemoglobin (g/dL): median (p 25–75) | 12.2 (11.4–14.5) | 12.5 (11.0–14.8) | 0.97 |
| Thrombolysis: n (%) | 12 (32.4) | 12 (32.4) | 0.99 |
| Hemorrhagic transformation: n (%) | 8 (21.6) | 8 (21.6) | 0.99 |
| Volume infarction (mL): median (p25–75) | 181 (105–235) | 190 (65–288) | 0.72 |
| Midline shift (mm): median (p 25–75) | 6.5 (2.8–11.2) | 10.0 (4.0–15.0) | 0.41 |
| Decompressive craniectomy: n (%) | 9 (24.3) | 7 (18.9) | 0.78 |
| Parameters | Survivors | Non-Survivors | p-Value |
|---|---|---|---|
| Day 1 | (n = 37) | (n = 37) | |
| RDW: median % (percentile 25–75) | 12.7 (11.2–13.2) | 13.9 (13.0–17.0) | <0.001 |
| Malondialdehyde: median nmol/mL (percentile 25–75) | 1.76 (1.39–2.24) | 2.99 (2.08–4.17) | <0.001 |
| TNF-alpha median pg/mL (percentile 25–75) | 9.8 (9.2–11.3) | 15.5 (13.2–16.7) | <0.001 |
| Day 4 | (n = 37) | (n = 20) | |
| RDW: median % (percentile 25–75) | 12.0 (10.3–14.5) | 15.1 (14.0–17.1) | <0.001 |
| Malondialdehyde: median nmol/mL (percentile 25–75) | 1.64 (1.37–1.90) | 2.95 (2.50–3.19) | <0.001 |
| TNF-alpha median pg/mL (percentile 25–75) | 9.8 (9.1–10.9) | 14.9 (13.3–16.2) | <0.001 |
| Day 8 | (n = 37) | (n = 13) | |
| RDW: median % (percentile 25–75) | 11.5 (9.9–14.0) | 14.9 (12.7–16.9) | 0.02 |
| Malondialdehyde: median nmol/mL (percentile 25–75) | 1.46 (1.19–1.92) | 2.71 (2.52–2.88) | <0.001 |
| TNF-alpha: median pg/mL (percentile 25–75) | 9.3 (8.9–10.4) | 14.8 (13.5–17.2) | <0.001 |
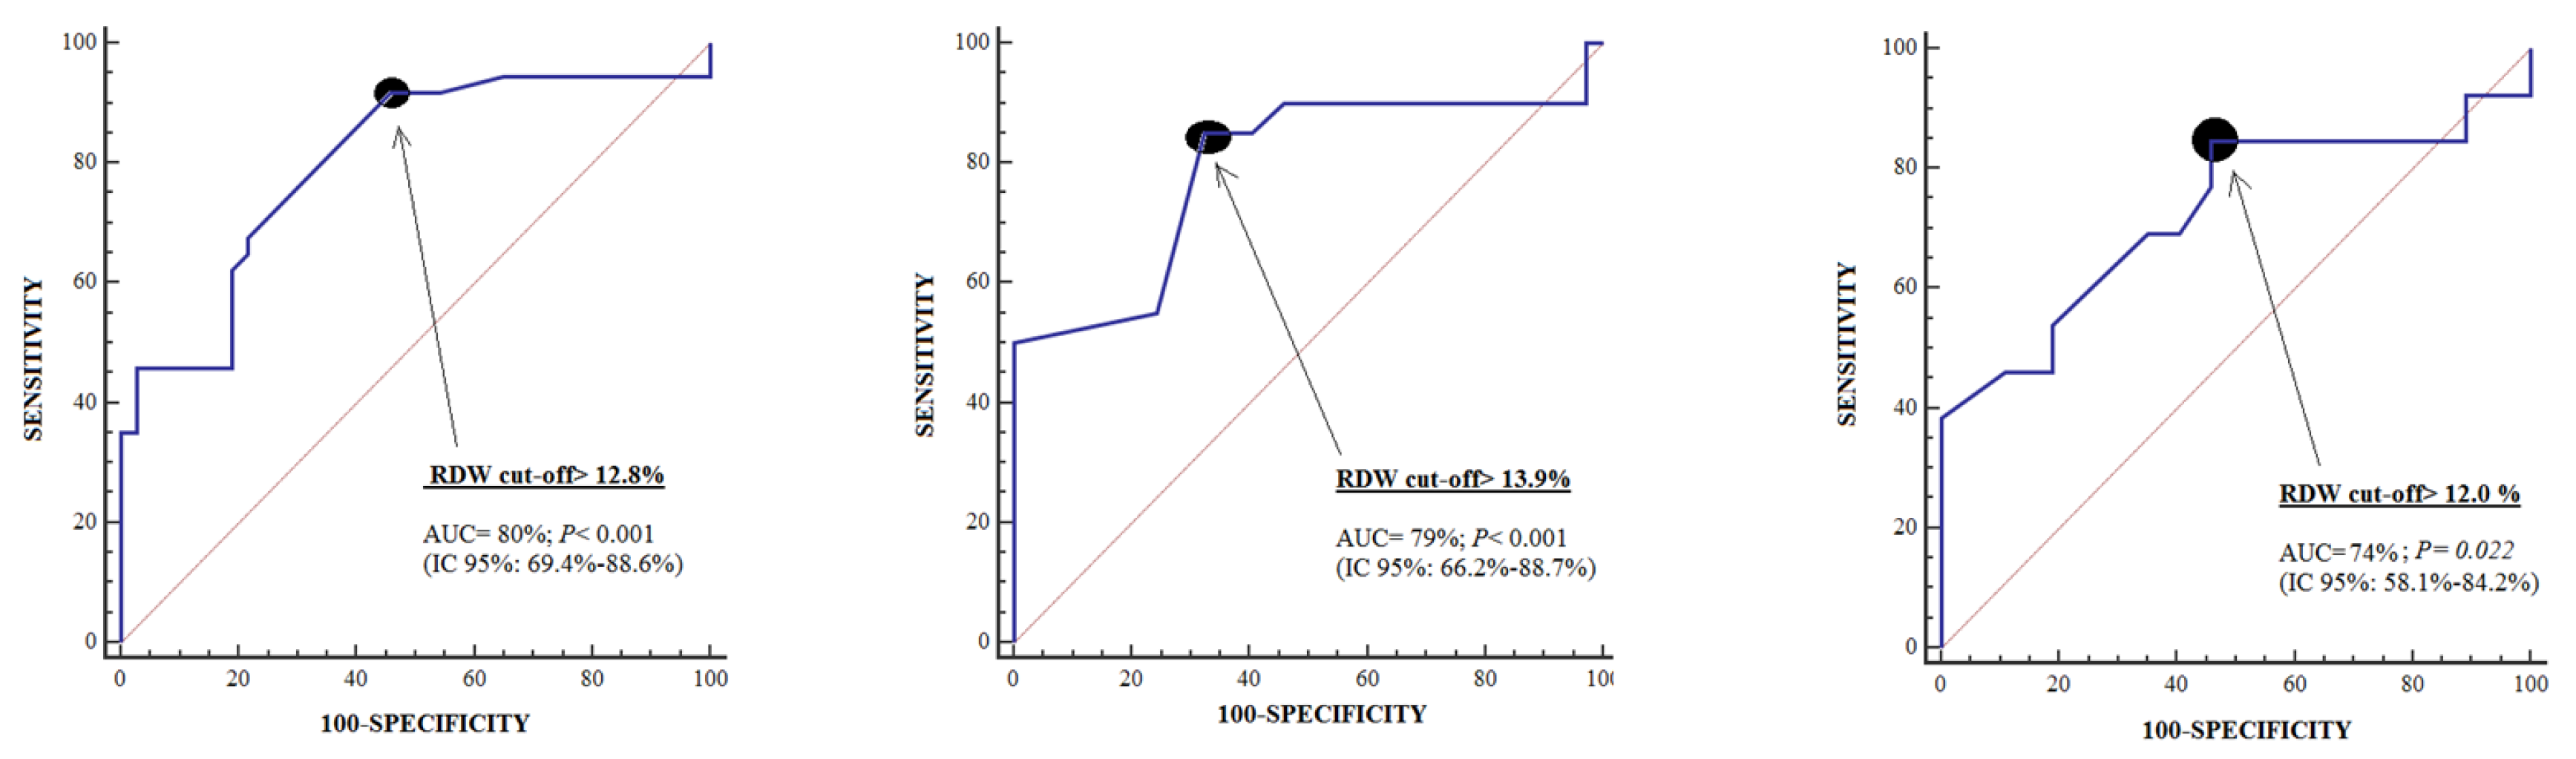
| Day 1 | Day 4 | Day 8 | |
|---|---|---|---|
| Cut-off of RDW in % | >12.8 | >13.9 | >12.0 |
| Specificity (95% confidence interval) | 54% (37%–71%) | 68% (50%–82%) | 54% (37%–71%) |
| Sensitivity (95% confidence interval) | 92% (78%–98%) | 85% (62%–97%) | 85% (55%–98%) |
| Variable | Odds Ratio | 95% Confidence Interval | p |
|---|---|---|---|
| Platelet count (each 1000/mm3) | 0.995 | 0.987–1.003 | 0.22 |
| Lactic acid (mmol/L) | 1.148 | 0.642–2.053 | 0.64 |
| Glasgow Coma Scale (points) | 0.661 | 0.480–0.910 | 0.01 |
| RDW (%) | 1.695 | 1.230–2.335 | 0.001 |
© 2020 by the authors. Licensee MDPI, Basel, Switzerland. This article is an open access article distributed under the terms and conditions of the Creative Commons Attribution (CC BY) license (http://creativecommons.org/licenses/by/4.0/).
Share and Cite
Lorente, L.; Martín, M.M.; Abreu-González, P.; Pérez-Cejas, A.; González-Rivero, A.F.; Ramos-Gómez, L.; Argueso, M.; Solé-Violán, J.; Cáceres, J.J.; Jiménez, A.; et al. Early Mortality of Brain Infarction Patients and Red Blood Cell Distribution Width. Brain Sci. 2020, 10, 196. https://doi.org/10.3390/brainsci10040196
Lorente L, Martín MM, Abreu-González P, Pérez-Cejas A, González-Rivero AF, Ramos-Gómez L, Argueso M, Solé-Violán J, Cáceres JJ, Jiménez A, et al. Early Mortality of Brain Infarction Patients and Red Blood Cell Distribution Width. Brain Sciences. 2020; 10(4):196. https://doi.org/10.3390/brainsci10040196
Chicago/Turabian StyleLorente, Leonardo, María M. Martín, Pedro Abreu-González, Antonia Pérez-Cejas, Agustín F. González-Rivero, Luis Ramos-Gómez, Mónica Argueso, Jordi Solé-Violán, Juan J. Cáceres, Alejandro Jiménez, and et al. 2020. "Early Mortality of Brain Infarction Patients and Red Blood Cell Distribution Width" Brain Sciences 10, no. 4: 196. https://doi.org/10.3390/brainsci10040196
APA StyleLorente, L., Martín, M. M., Abreu-González, P., Pérez-Cejas, A., González-Rivero, A. F., Ramos-Gómez, L., Argueso, M., Solé-Violán, J., Cáceres, J. J., Jiménez, A., & García-Marín, V. (2020). Early Mortality of Brain Infarction Patients and Red Blood Cell Distribution Width. Brain Sciences, 10(4), 196. https://doi.org/10.3390/brainsci10040196