1. Introduction
“Tinnitus”, derived from “tinnire”, Latin for
to ring, is a neuropsychiatric disorder where the patients report the perception of a ‘phantom sound’. Although the name suggests a ringing sound, the symptoms vary, with patients describing their tinnitus as a ringing, rushing, roaring, hissing, or clicking noise. The tinnitus may or may not be pulsatile, and its onset can be abrupt or gradual. The symptomatic presentation of tinnitus is further complicated by the sound being perceived preferentially in one or both ears, as being inside the head, or externally located. Adding further heterogeneity to the tinnitus experience is the fact that the volume can vary over time. While stress is known to exacerbate tinnitus, there is a general consensus that further basic research is necessary to understand the disease better and to improve treatment [
1].
Chronic diseases like tinnitus stand to gain greatly from emerging trends in mobile health (or ‘mHealth’). Increased interest in mobile health sensing was primarily driven by research interest in measuring a more ’organic’ presentation of the disease outside of a hospital.mHealth technologies can also help the patient update their doctor on their current symptoms, and collect feedback from the doctor on symptom management without the need to visit a clinic. The benefit of access to the doctor directly from mobile devices may therefore not only improve patient-doctor communication but may also improve access to healthcare for patients with movement constraints or poor access to healthcare. Patient involvement in tracking their own disease state may also improve self-monitoring, awareness, and consequently well-being while providing the physician with a more accurate picture of the patient’s symptoms, namely mitigating the effects of confounders like
recall bias while maintaining
ecological validity [
2].
The idea of tracking patients’ well-being has been explored through the use of mHealth apps that collect “Ecological Momentary Assessments” (EMAs). EMAs are preferred as the observations are on a patient’s current state, and in the patient’s current environment, which is particularly important for “rapidly fluctuating processes” like perception of pain, ability to cope with negative stimuli, and emotional affect [
3]. Self-reported EMAs have been explored in the context of mobile health through apps like “TrackYourTinnitus” [
4,
5], where the users of the app are notified a selected number of times at random intervals during the day to answer a short questionnaire. In other cases, the answering of the EMA questionnaire may also be self-initiated. The data collected through such apps have already yielded interesting observations, like the effect of the time-of-day on tinnitus [
6], the difference between users on the Android and iOS platforms [
7], and the possibility of the emotional state of the patient mediating the influence of tinnitus loudness on the emotional distress [
8].
This study uses EMA data generated by the “TinnitusTips” application (built on the TinnitusCare Framework), which combines the features of recording EMAs with a psychoeducation module. The psychoeducation module delivers a randomly selected ‘tip’ to the user upon the successful completion of the EMA questionnaire. Each tip has a goal, and a text on how to better achieve that goal (e.g., “Falling asleep better”) and helps the user to better handle their tinnitus. The data used in this work was generated as part of a user study meant to investigate the effect of the tips on a set of previously selected users who are admitted into the study. The set of users in the study are split into two groups, one of whom are exposed to the tips from the beginning of their interactions with the app, and the other who do not receive the tips for the first 8 weeks of app-interaction but subsequently receive the tips. The fact that some users are exposed to the tips after a fixed amount of interaction time makes it easy to isolate the effect of the tips themselves since the same user has been exposed to the app both with the ‘tip’ feedback (which can be seen as an intervention) and without it. We investigate the following questions in this study:
To what extent is the known positive relationship between tinnitus loudness and distress reflected in the EMA data?
How does the introduction of tips affect user behaviour within the system?
How does the introduction of tips affect the user’s symptom severity?
Question 1 helps understands if EMAs ‘work’, in that the values they reflect known relationships between loudness and distress in Tinnitus. Questions 2 & 3 investigate if the introduction of tips cause some change in the patients, either in their behaviour within the app, or in the way they experience their symptoms.
2. Materials and Methods
2.1. The TinnitusCare mHealth framework
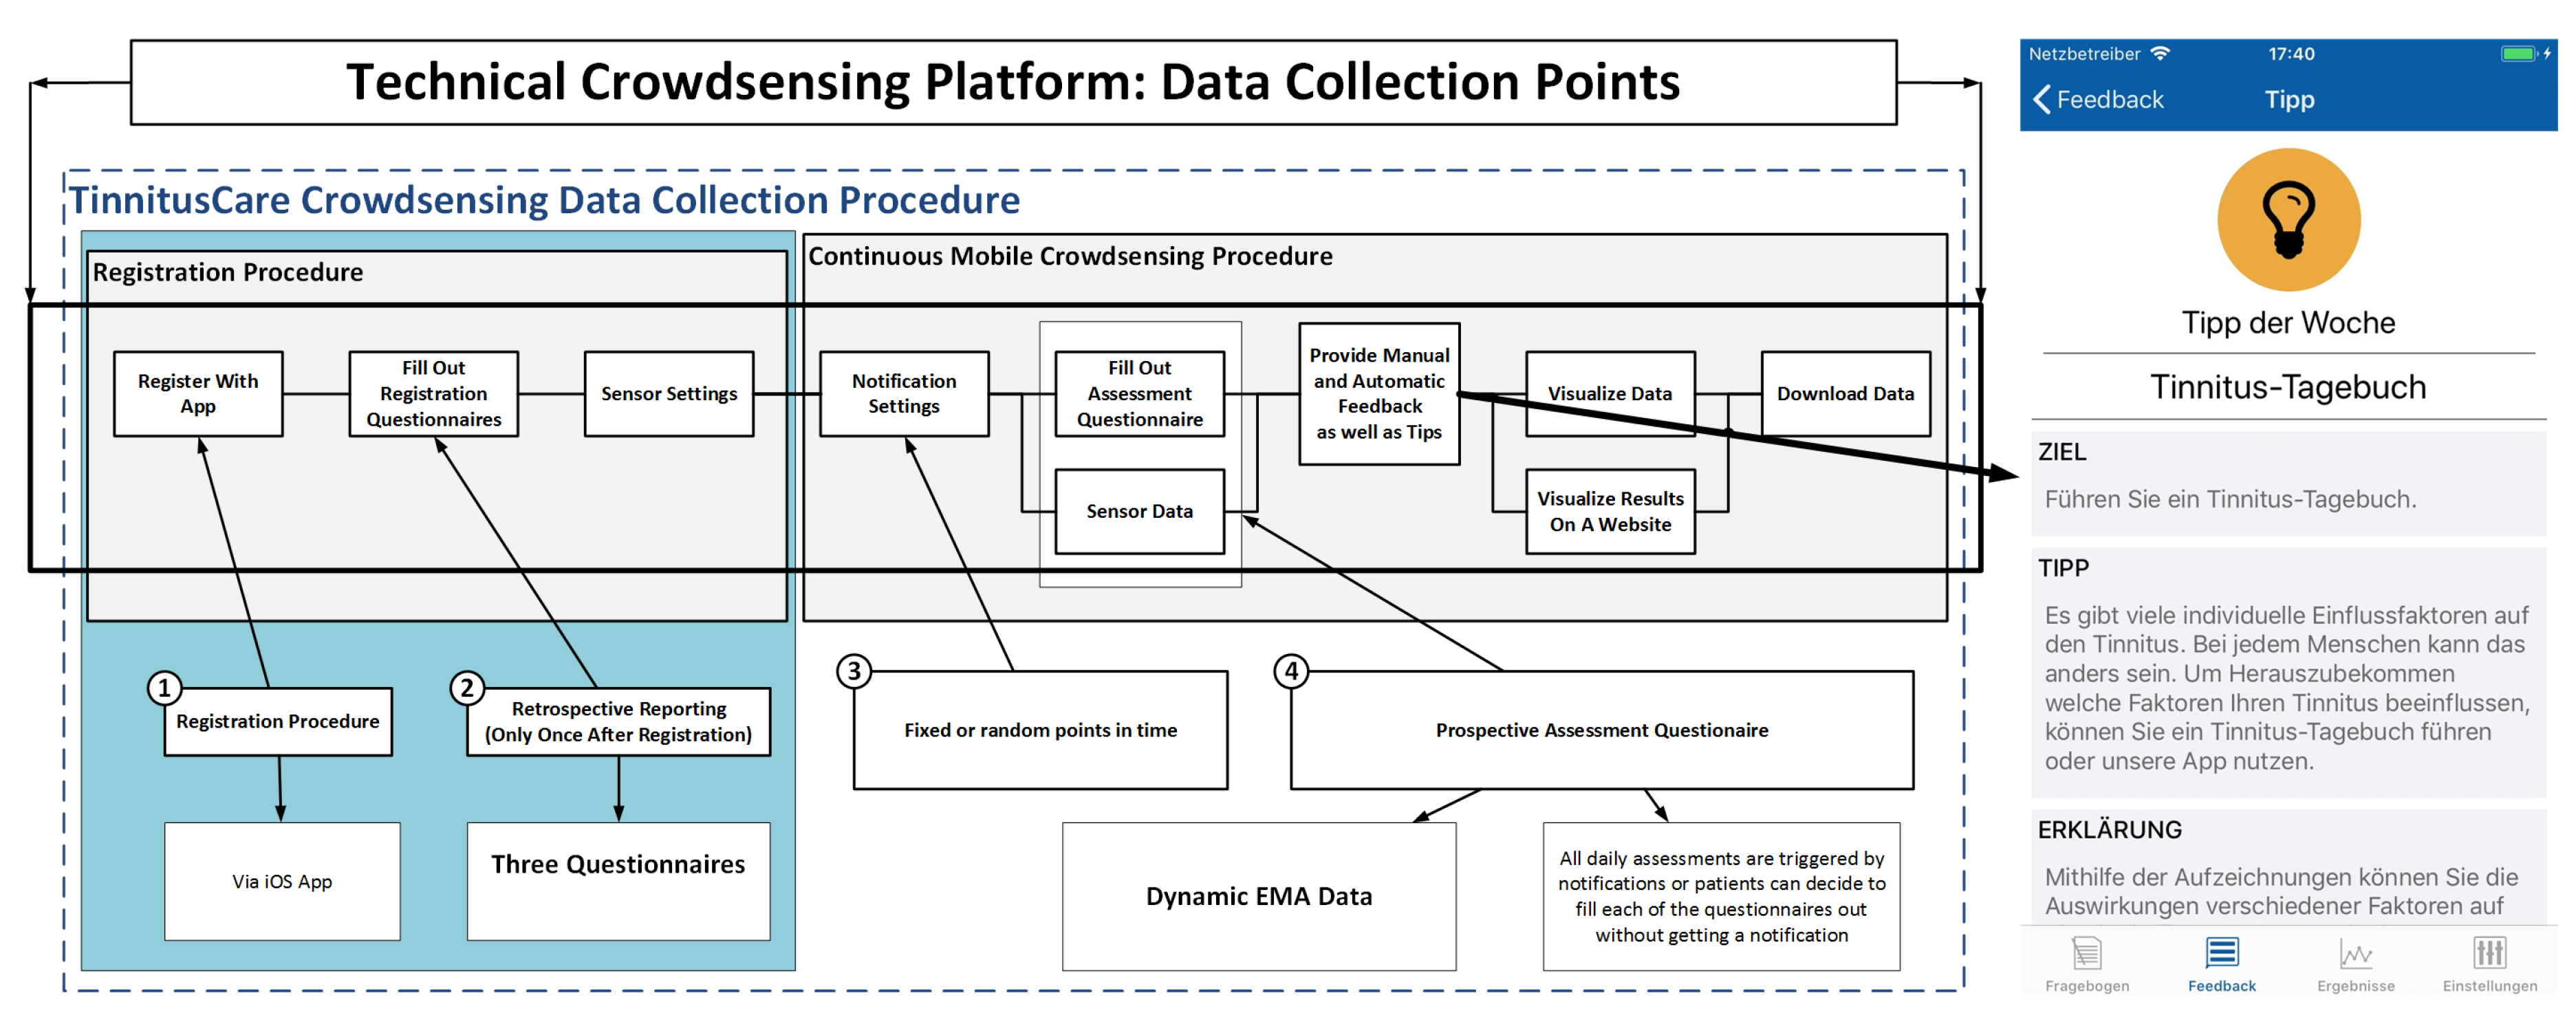
Figure 1 presents an overview of the TinnitusCare mHealth framework, which includes elements of psychoeducation for chronic tinnitus patients along with EMA items to help the patients monitor the fluctuations of their own tinnitus. Technically, the framework encompasses a relational database, a RESTful API, and an iOS mobile application. The latter was developed as a native implementation in the SWIFT programming language. The app is available in English and German.
All participants in the study were patients from the University Clinic at Regensburg, and were randomly selected into the three groups A, B and Y. All participants provided an informed consent regarding the use of the data they enter into the app. Before starting interaction with the app, study participants registered with the platform and filled registration questionnaires. Then, patients have to allow or decline GPS and environmental sound measurements. The psychoeducation component involves tips about dealing with tinnitus. All tips were structured the same way: First, there was the goal of the tip defined (e.g., better falling asleep), then there was a specific tip given on how to reach this goal (e.g., listening to music), and third, an explanation was given as to why the tip helps (e.g., music can mask the tinnitus).
2.2. The Questionnaires of the Intervention
The EMA questionnaires are designed to assess tinnitus and capture the user’s current context with several short questions during everyday life. The daily assessment questionnaires constitute the main part of this EMA study. The smartphone app will notify the user at several time points during the day to fill out the daily assessment questionnaires. The questionnaire comprises 8 questions, and is expected to take less than a minute to complete. The questions are shown in
Table 1, along with the question codes that we refer to them with.
To assess the impact of the intervention, the study encompasses the following registration questionnaires, to be filled at the beginning of the study:
The questionnaire is designed as a part of Ecological Momentary Assessment by handheld devices which has been used for studying persistent diseases with high variability in their symptoms and distress [
11,
12]. This daily questionnaire from TrackYourTinnitus (TYT) smartphone application has been analysed in previous studies [
4,
5,
13]. Two different scales were used for these questions, i.e., a binary scale for questions 1 and 8 with ‘Yes’ and ‘No’ as possible answers, and visual analogue scale for Q2 to Q7, ranging from 0 to 100.
In addition to the data in the app, the patients also filled in the Tinnitus Handicap Inventory (THI) [
14] and the WHO Quality of Life Questionnaires (WHOQOL-BREF) during their screening, mid-study, post-study and follow-up visits to the university clinic at Regensburg. Unlike the in-app questionnaires, there are filled in at the clinic. This helps track patient progress as measured by the EMAs against validated questionnaires as they pass through the study.
2.3. Dataset
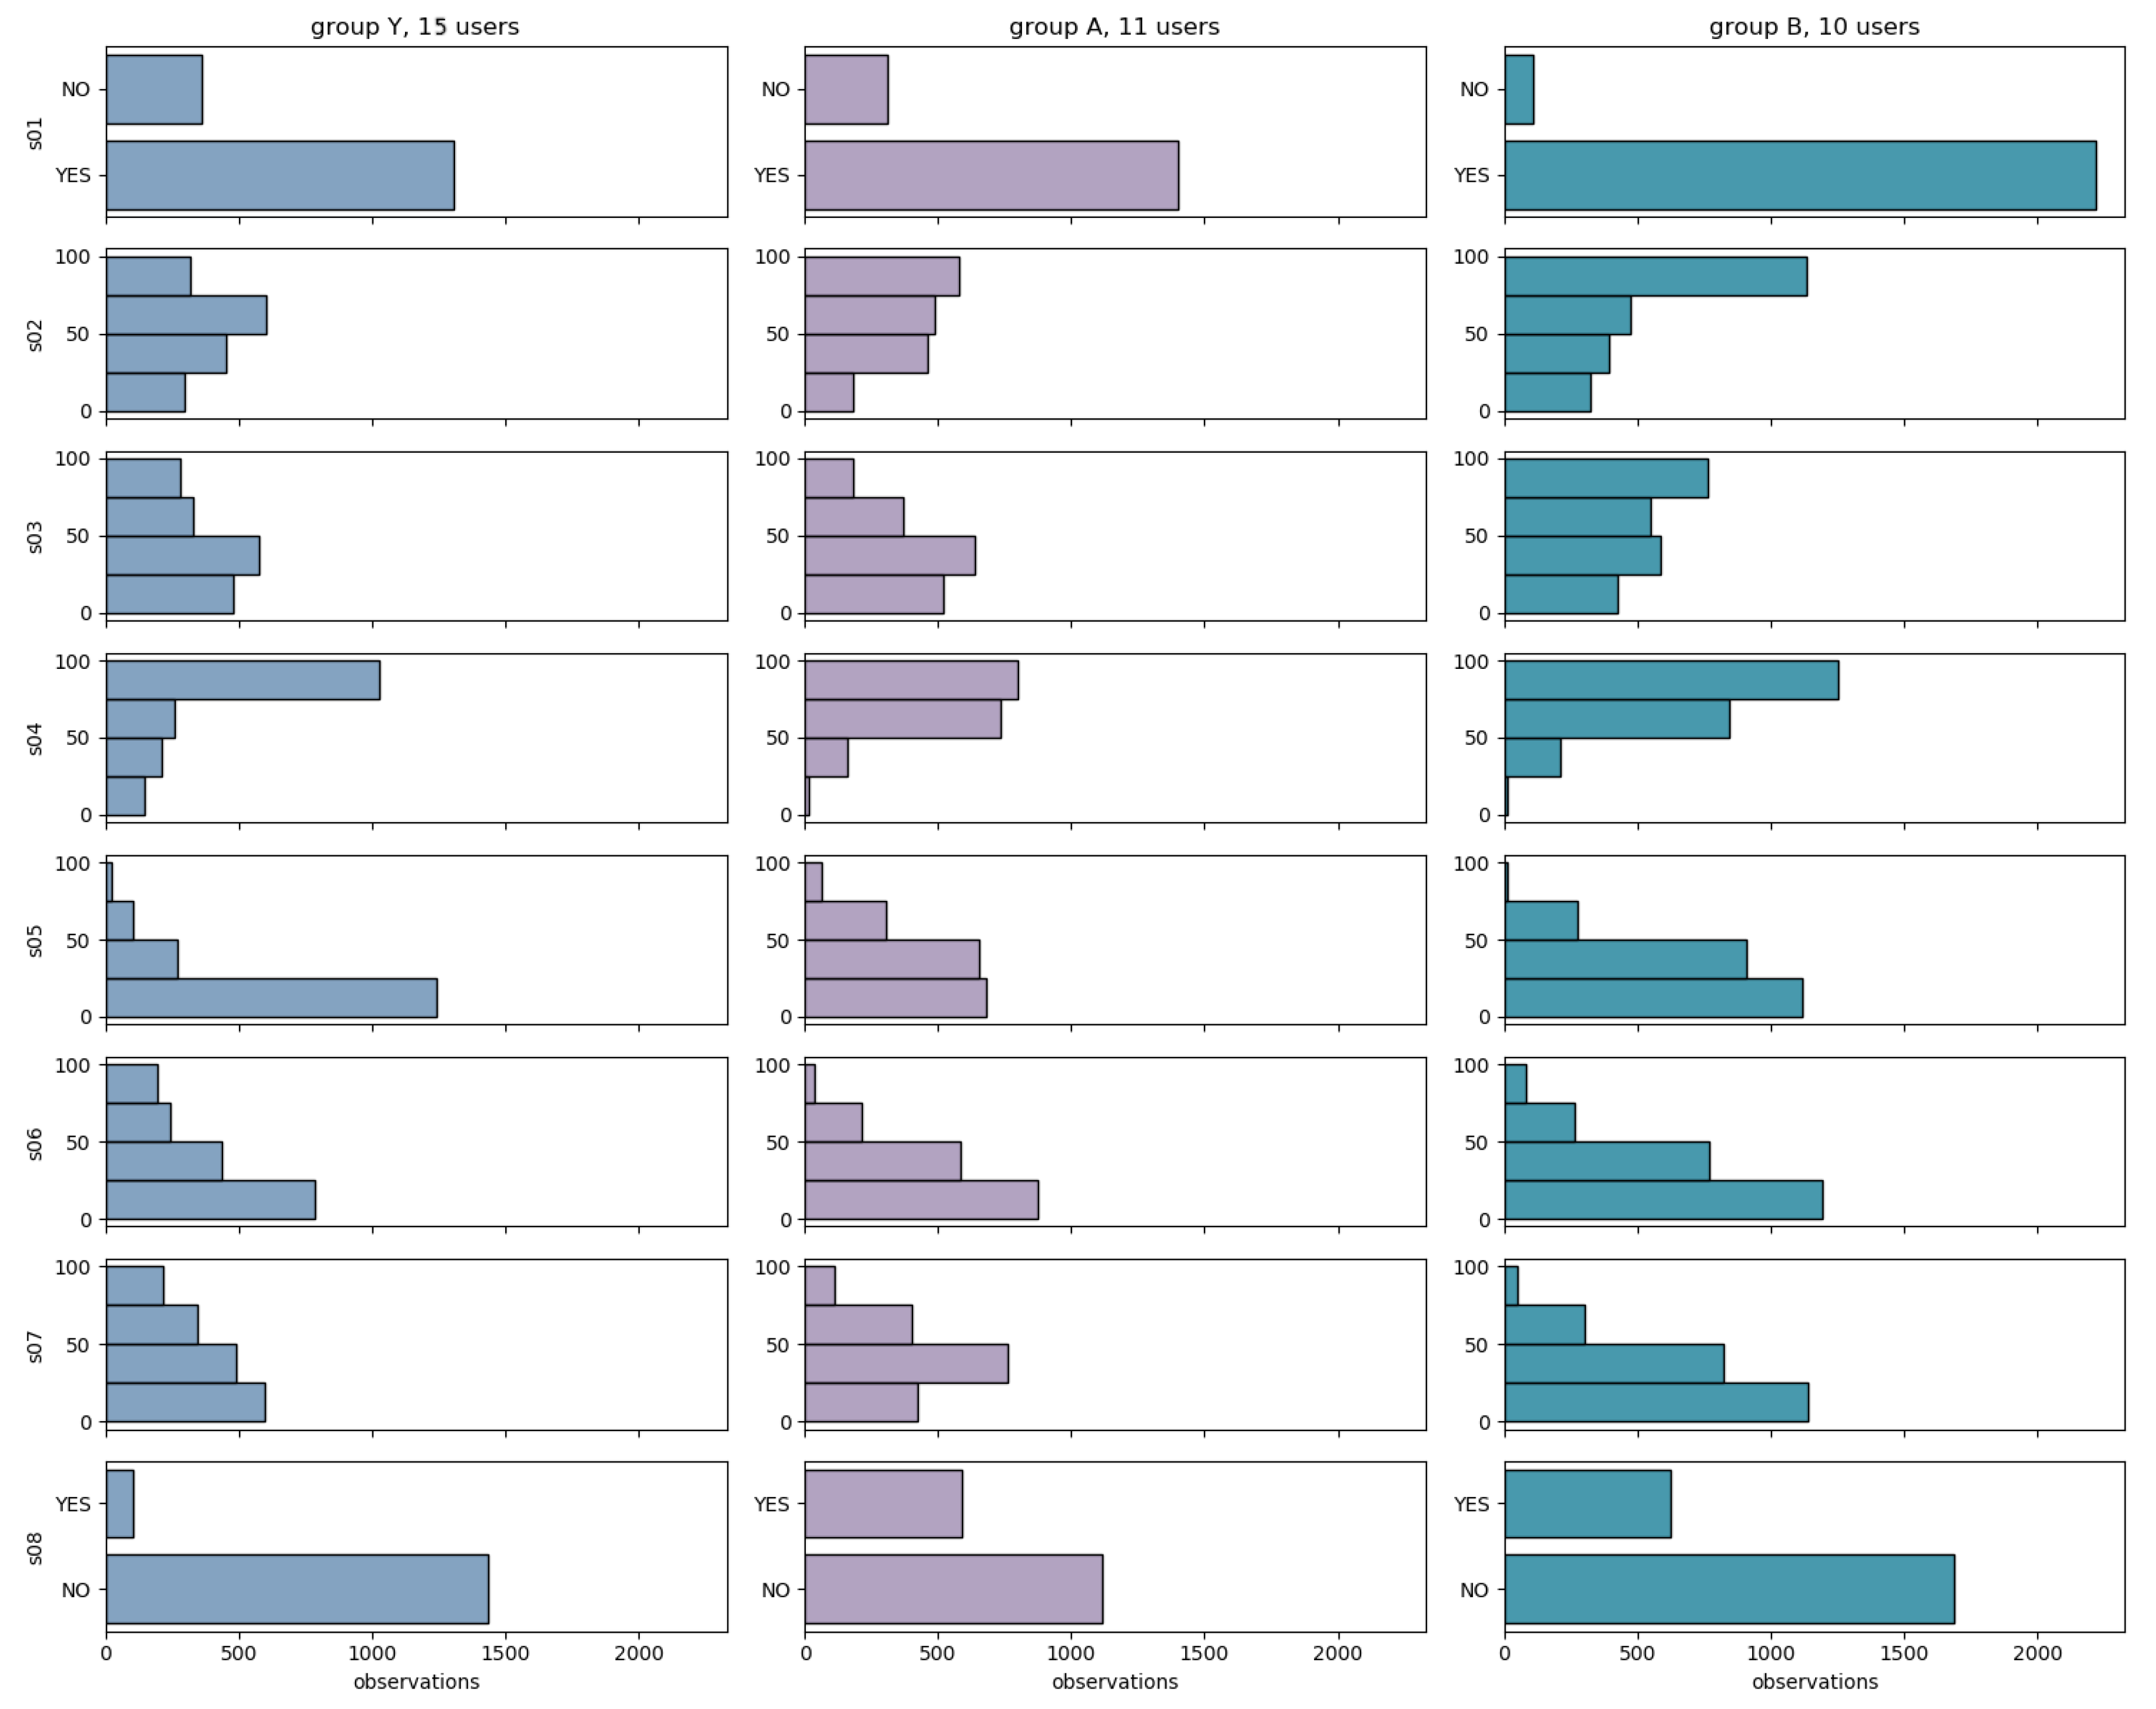
The data generated by the study in question consists of users randomly selected into three groups: A, B, and Y. Users in groups A and Y were both exposed to tips from the beginning of the study, while users in group B did not initially receive tips, and began receiving tips only from their 8th week. Since groups A and Y were both exposed to tips since the beginning, and differ only in supervisor and number of assessments, we focus on comparisons between groups A and B since they are very similar in number of participants (A:
N = 11 and B:
N = 10) compared to group Y (
N = 15). A tabular description of the main features of the dataset is presented below in
Table 2.
The EMA dataset contained a further 1408 observations from 20 users who do not fall into any of the categories above. Since the additional variables regarding the patients are obtained by matching the user-id from the app with a hospital database, the age and gender of these users are not known. These users are excluded from the analysis, and all further references to the dataset refer to the dataset including only the users from groups A, B, and Y.
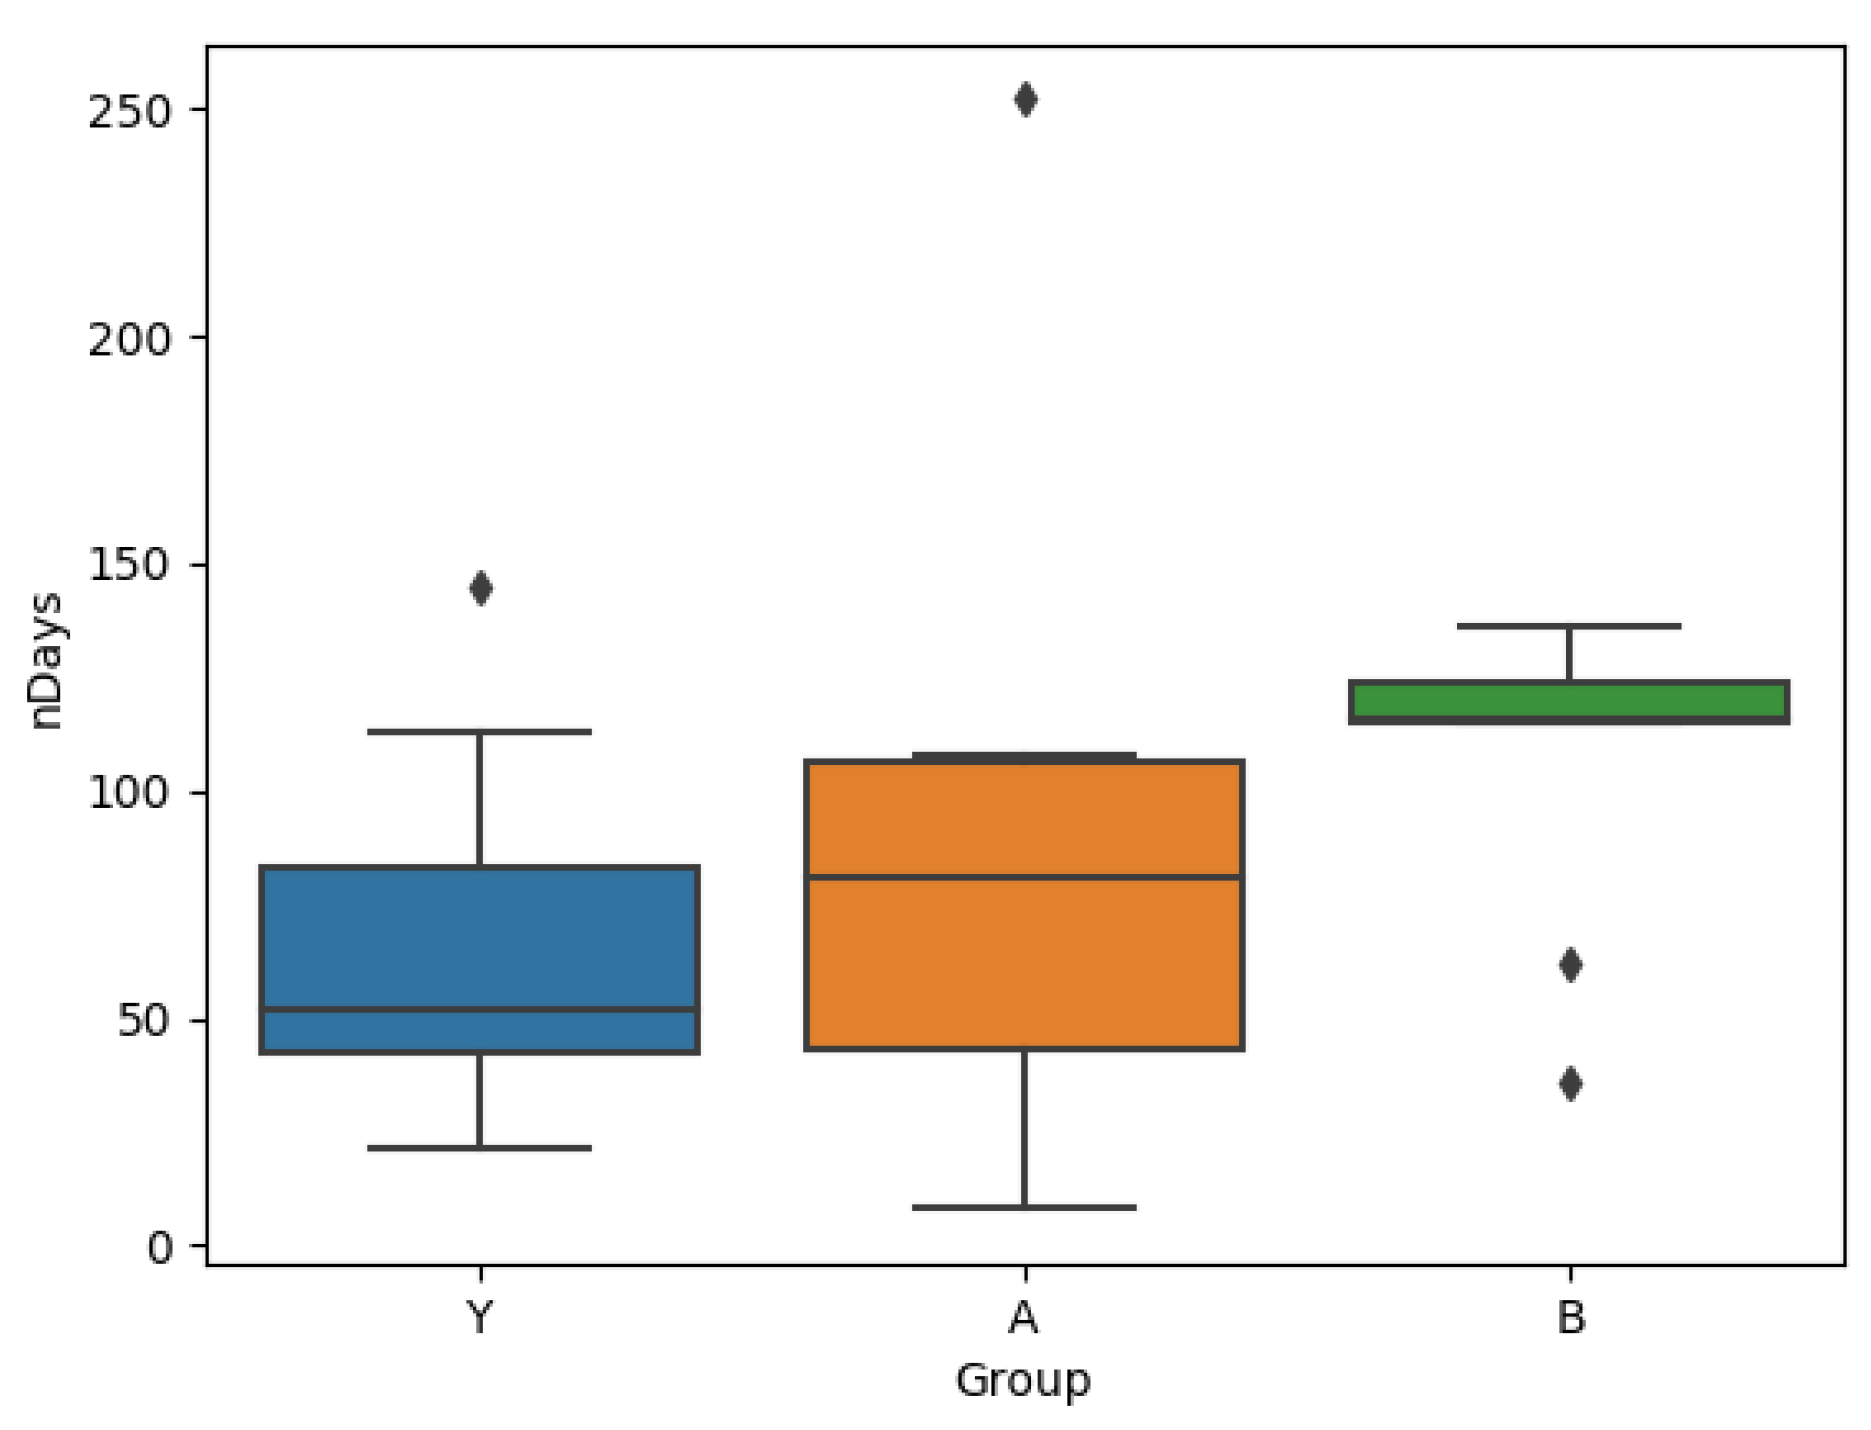
The patients in each of the groups had also filled in the THI questionnaire during their first assessment. The values at the baseline visit for the three groups are as shown in
Figure 2.
2.4. Methods
The multiple answers from a participant to the EMA questionnaire creates an 8-dimensional time series. We refer to each individual response of the participant to the EMA questionnaire as a session. The main variables of interest in this study are listed below:
To address question Q2 from
Section 1, we define variables
User Loyalty,
User Engagement, and
Dropout rate.
User loyalty is the total number of days on which the user logged at least one session, and
user engagement is the total number of days on which the user contributed more than one session. The dropout rate is the number of users who remain active after a given number of weeks. The three variables model the
user behaviour and are expected to reflect the effect of receiving tips.
However, before investigating the effect of the intervention on the participants’ subjective experience of tinnitus as measured by their EMAs, we first investigate the extent to which the EMA data reflects a known relationship between the relationship between tinnitus loudness and tinnitus distress [
8].
2.4.1. Q1: Do EMAs Reflect the Known Relationship between Tinnitus Loudness and Distress?
Although there is a known impact of tinnitus loudness on distress, there is evidence to suggest that there might be participants who have low values for distress in spite of relatively high values for tinnitus loudness [
15]. To investigate the degree to which tinnitus distress is affected by loudness, we cluster the EMA responses to find groups of responses that are similar and then build a linear regressor with distress as the target for the data within each cluster. The parameters of the learned model can show the degree to which the distress depends on loudness. We also maintain a
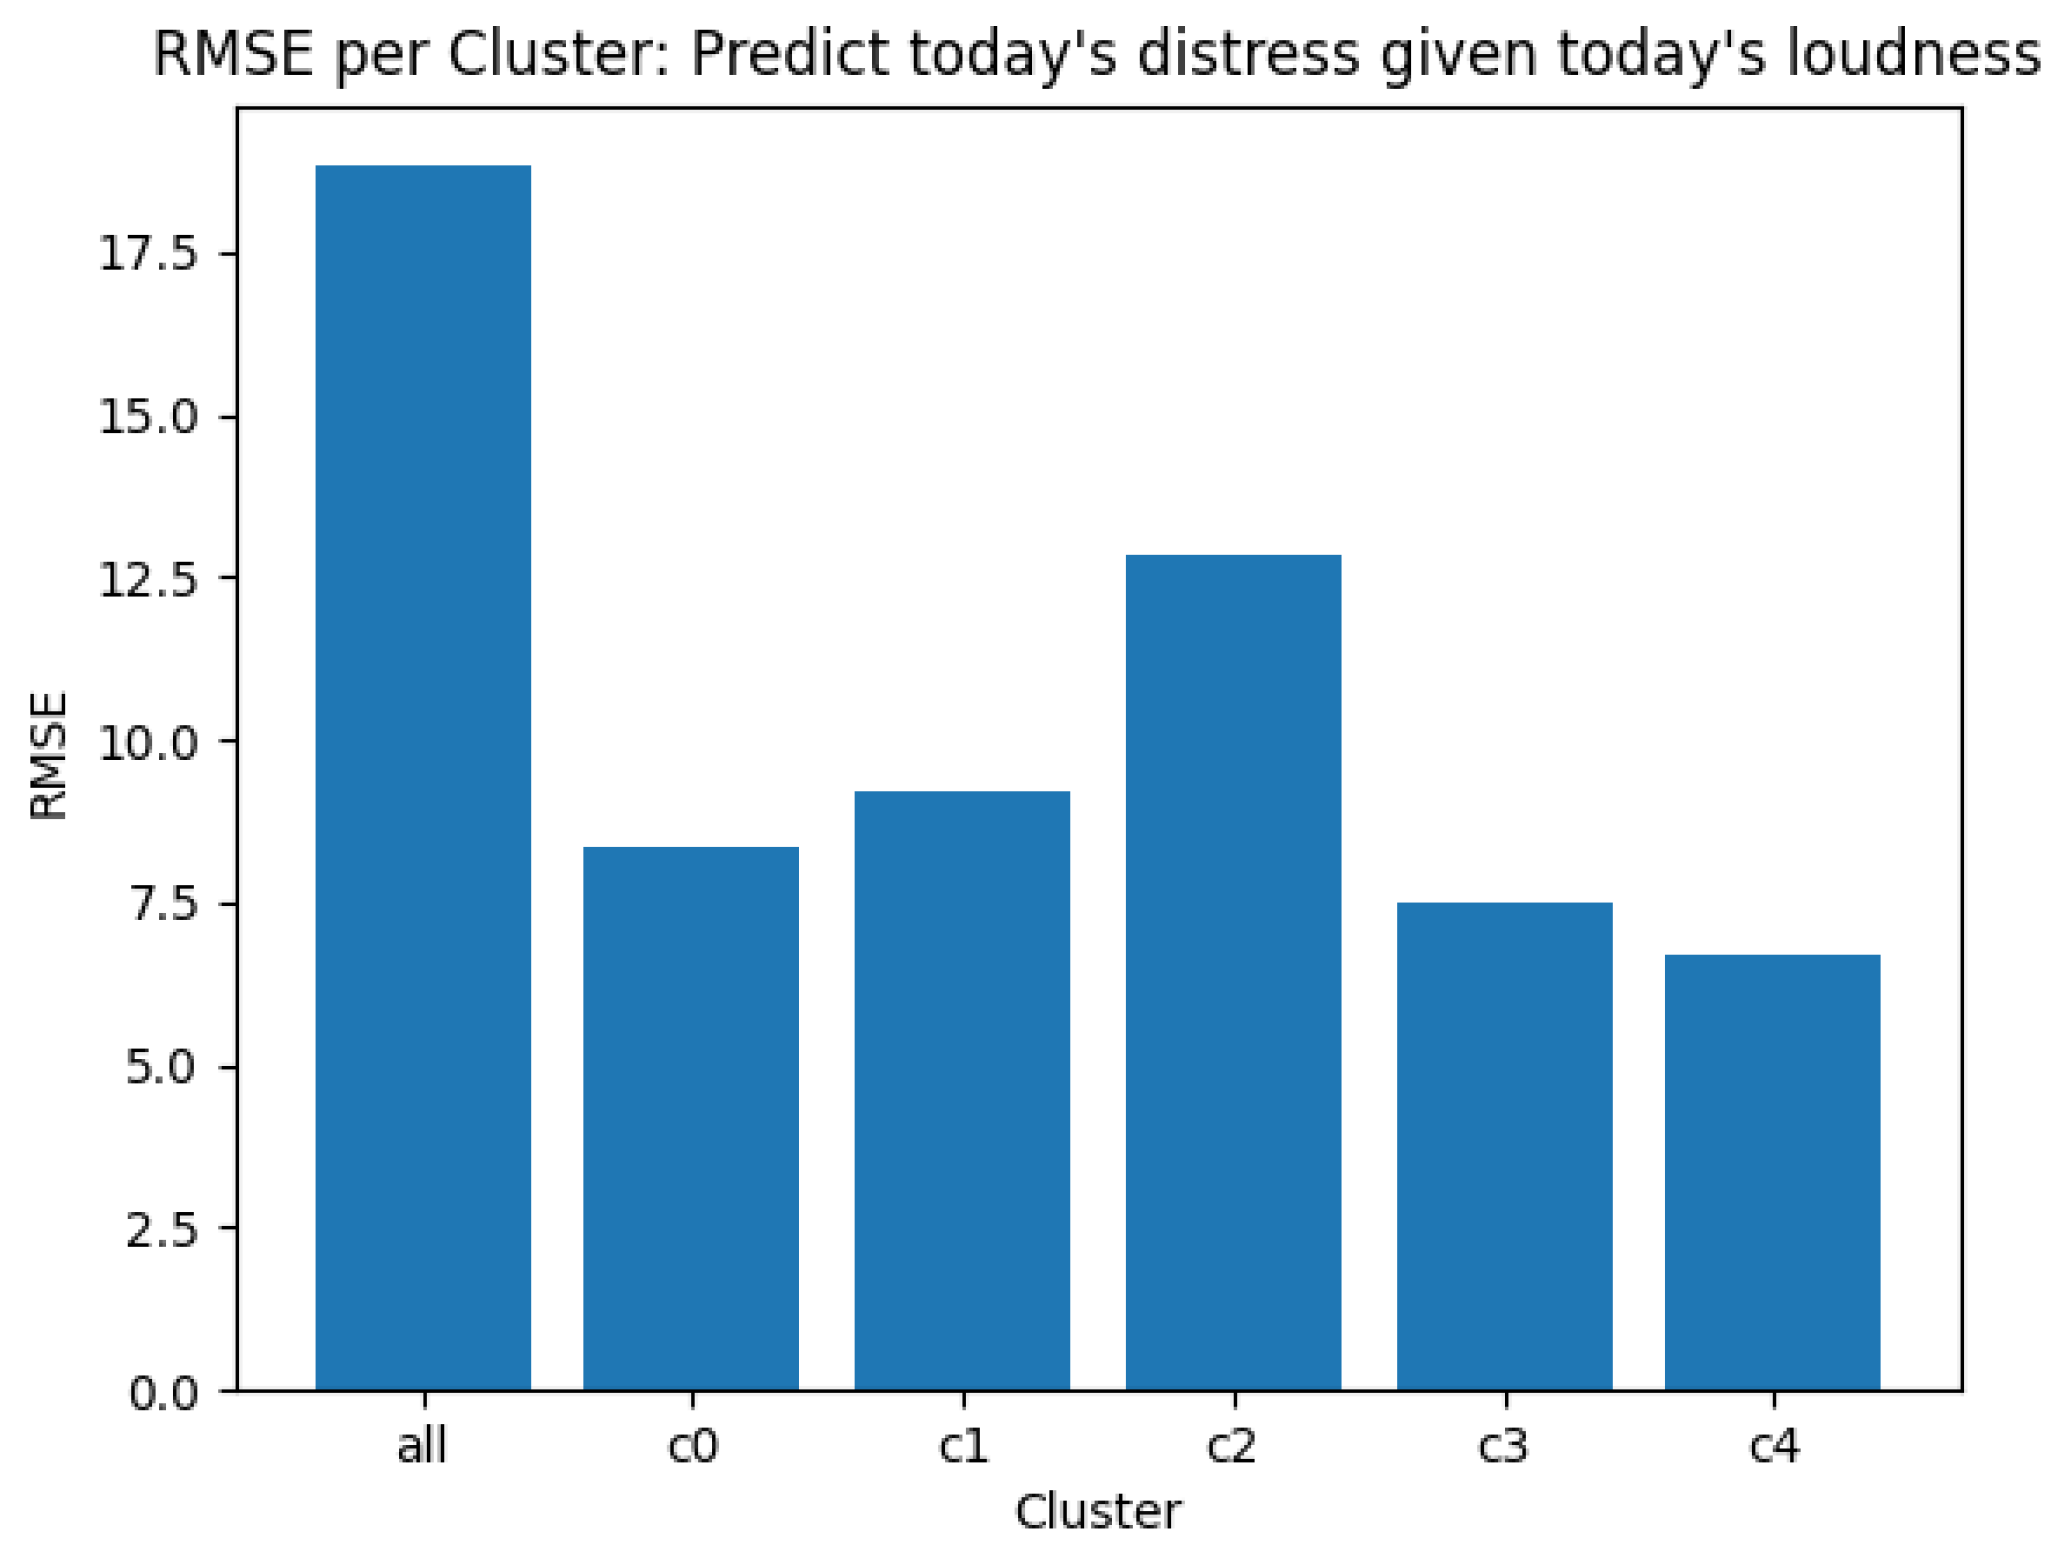
hold-out set of EMA responses, which is a randomly selected subset of all EMA responses to validate the model. This hold-out set has not been used in the clustering process or to train the cluster-level linear regression models.
The model parameters alone (even if they are significant) don’t give a compelling argument for building clusters where the relationship between loudness and distress needs to be modelled separately. As an additional step, we also train a single ‘global model’, trained on the data used to create the clusters, and test how well this global model predicts the data in the hold-out set. This error is compared against the errors from predicting the holdout data from each of the cluster-level models. If the cluster-level models show a better prediction accuracy than the global model, it can further strengthen the argument in favour of the clustering process and the model parameters learned by the cluster-level regression models.
In this work, we cluster the data using K-Means [
16], a popular and mature algorithm for clustering. It works by randomly selecting
k points from the input as
centres of clusters, and assigns each of the rest of the points to the cluster centre nearest to it as measured by the euclidean distance between them. The cluster centre is then updated as the arithmetic average (geometrically, the ‘middle’) of all the points assigned to it. Now that the centre has shifted, points near the border of the cluster may now be closer to another cluster (causing a change in that cluster’s centre, and so on). This process is repeated iteratively for all points and clusters until the points assigned to a cluster do not change. The quality of the clustering process is assessed by computing the total squared distance of each of the points to the centre of the nearest cluster. To mitigate the effects of random initialisation on the final clustering (i.e., so that the whole clustering process is not handicapped by a poor selection of points at the initial step), the entire clustering process is repeated multiple times and only the best result is used. The exact value of
K in K-Means is selected by a human in a way that balances the number of discovered clusters with the number of data points within them, and how well they reveal underlying groups in the data.
2.4.2. Q2: Analysing User Behaviour
To compare the users from the two groups, we select two complementary measurements over which they can be compared: (a) User loyalty: Total number of days the user was active on the app (i.e., number of days on which the user has contributed at least one session), and (b) User engagement: The number of days on which the user has contributed more than one session. This measures interaction intensity.
The user loyalty for users in group B is compared to that of group A by using a box-and-whiskers plot of the number of days of data contributed by a user against the group they belong to. Each day on which a user has answered at least one EMA question is counted as a day on which the user was ‘active’. Since users belonging to each group have a specific ‘length’ to their time series (the number of days on which the user logged at least one session), the two distributions of time series lengths are compared using a Wilcoxon rank sum test to check if they are generated by the same underlying distribution.
The test for user engagement is done similarly, comparing the groups A & B on whether they differ significantly in the number of days on which they answered the EMA questionnaires more than once.
2.4.3. Q3: Analysing Effect of Intervention on Tinnitus Symptoms
We investigate the effect of the tips on loudness and distress using a two-sample Kolmogorov-Smirnov test on the values for loudness before and after the introduction of tips, and similarly for distress. If the test reveals that the data before and after the introduction of tips are not generated by the same underlying distribution, it can be argued that the introduction of tips affects the expression of tinnitus for those patients.
4. Discussion
The results in
Section 3 ask three orthogonal questions—Do the EMAs reflect the known impact of tinnitus loudness on distress, whether the intervention affects the way in which the user interacts with the app, whether the intervention changes the user’s perception of the disease.
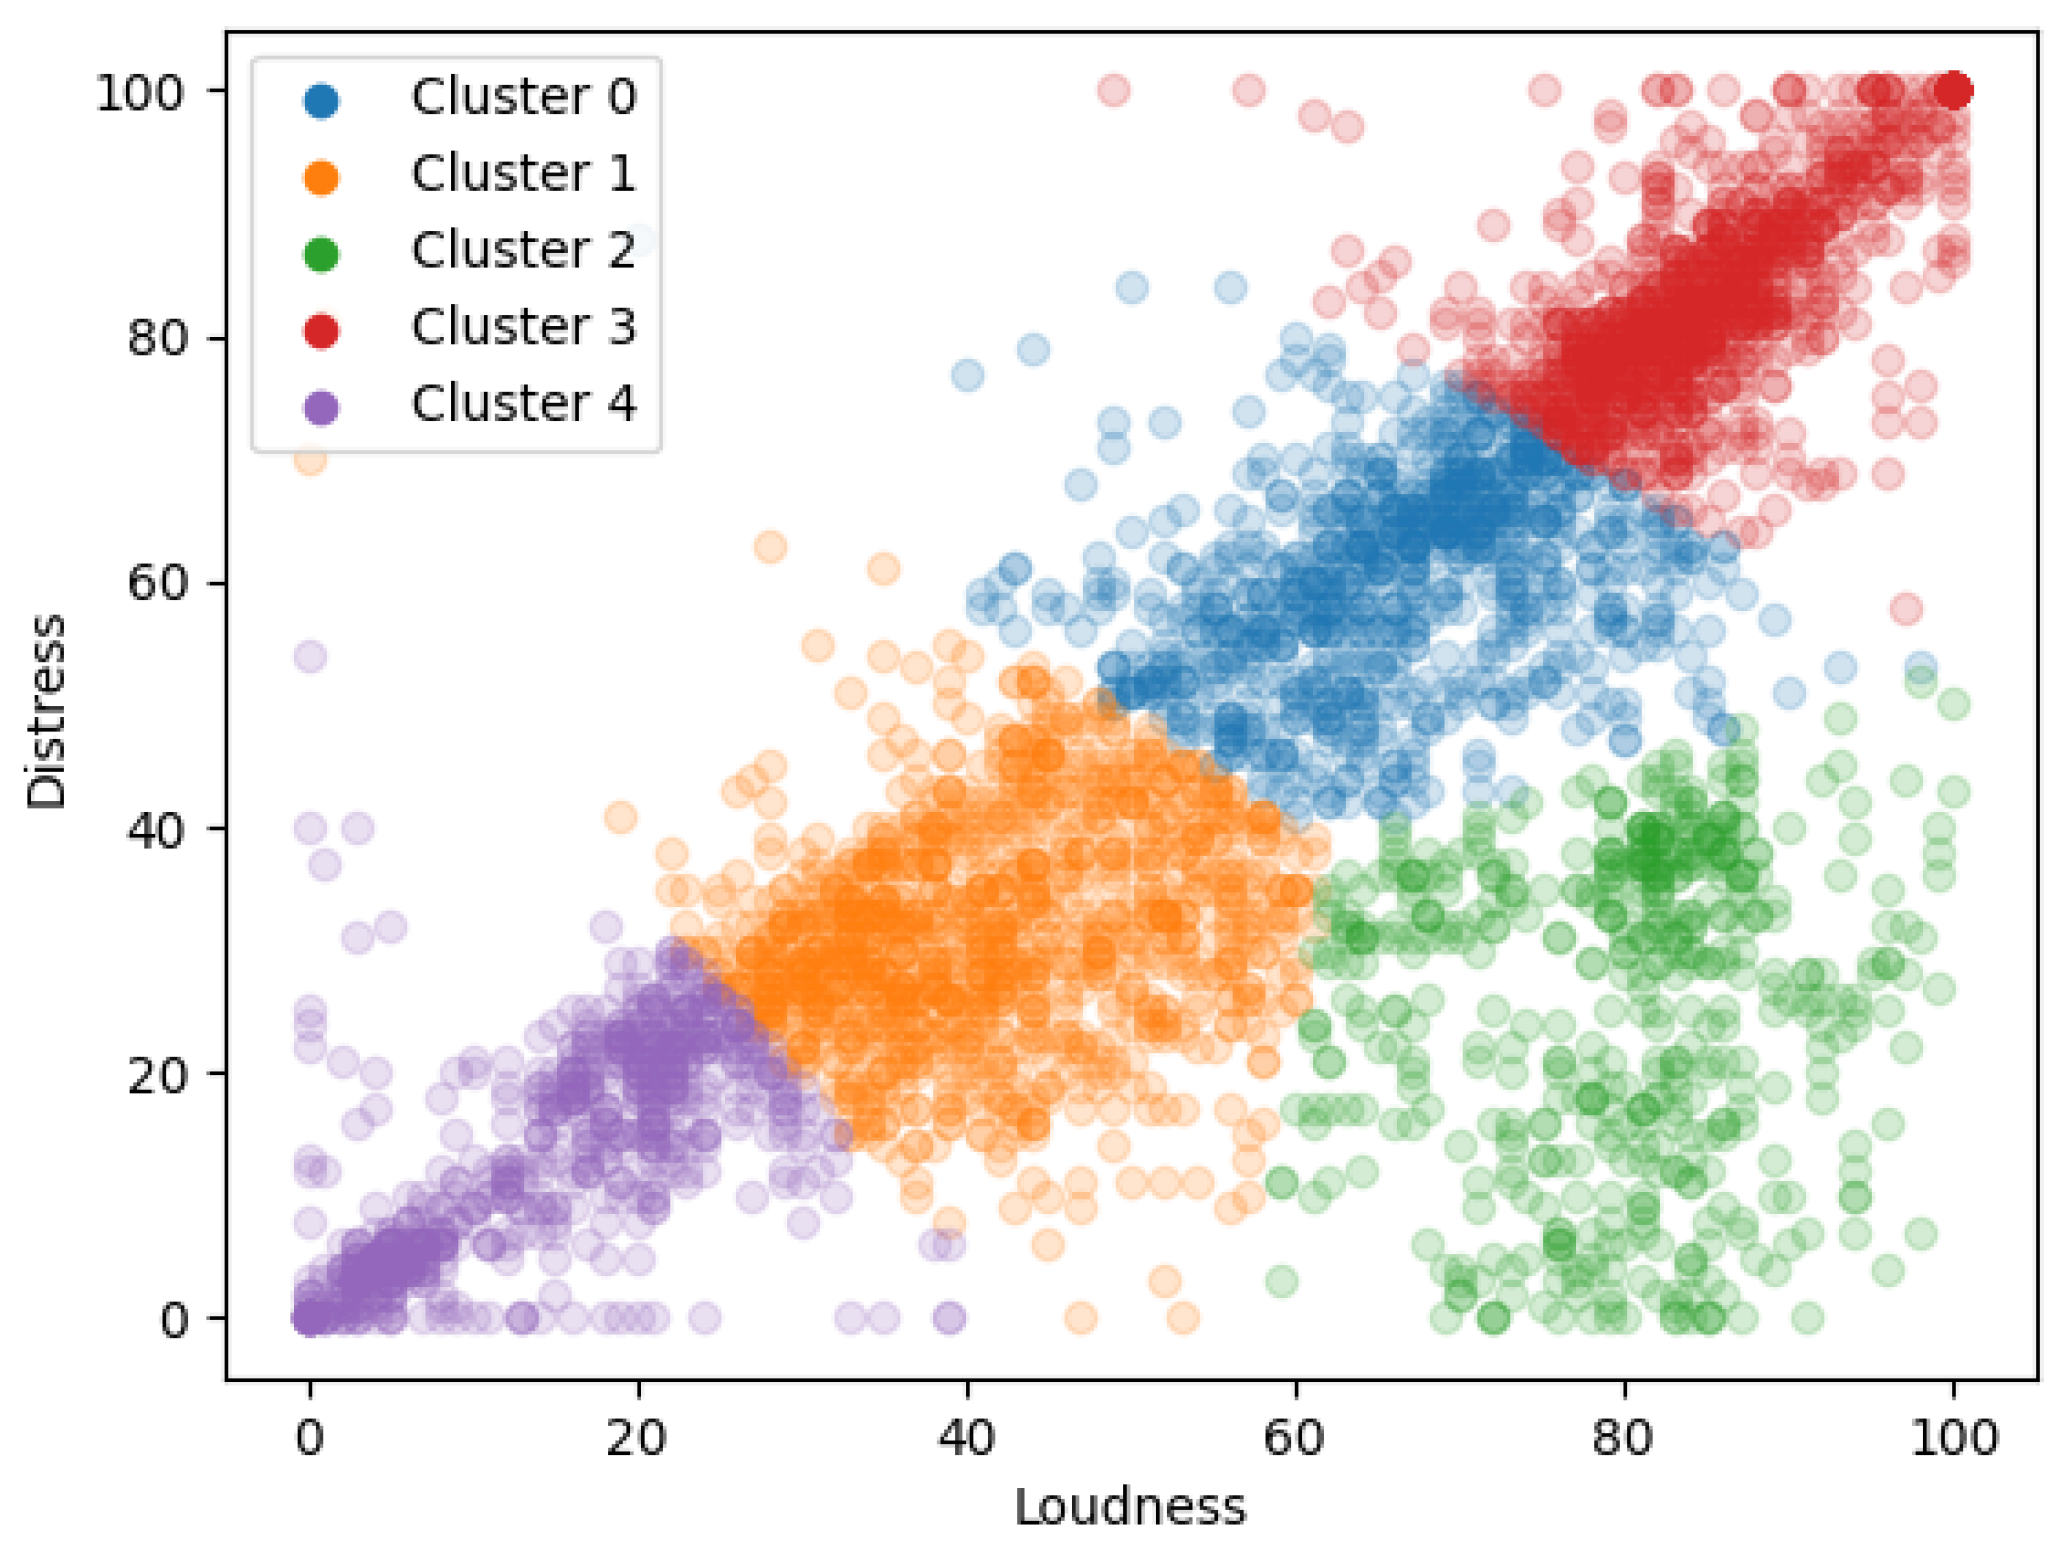
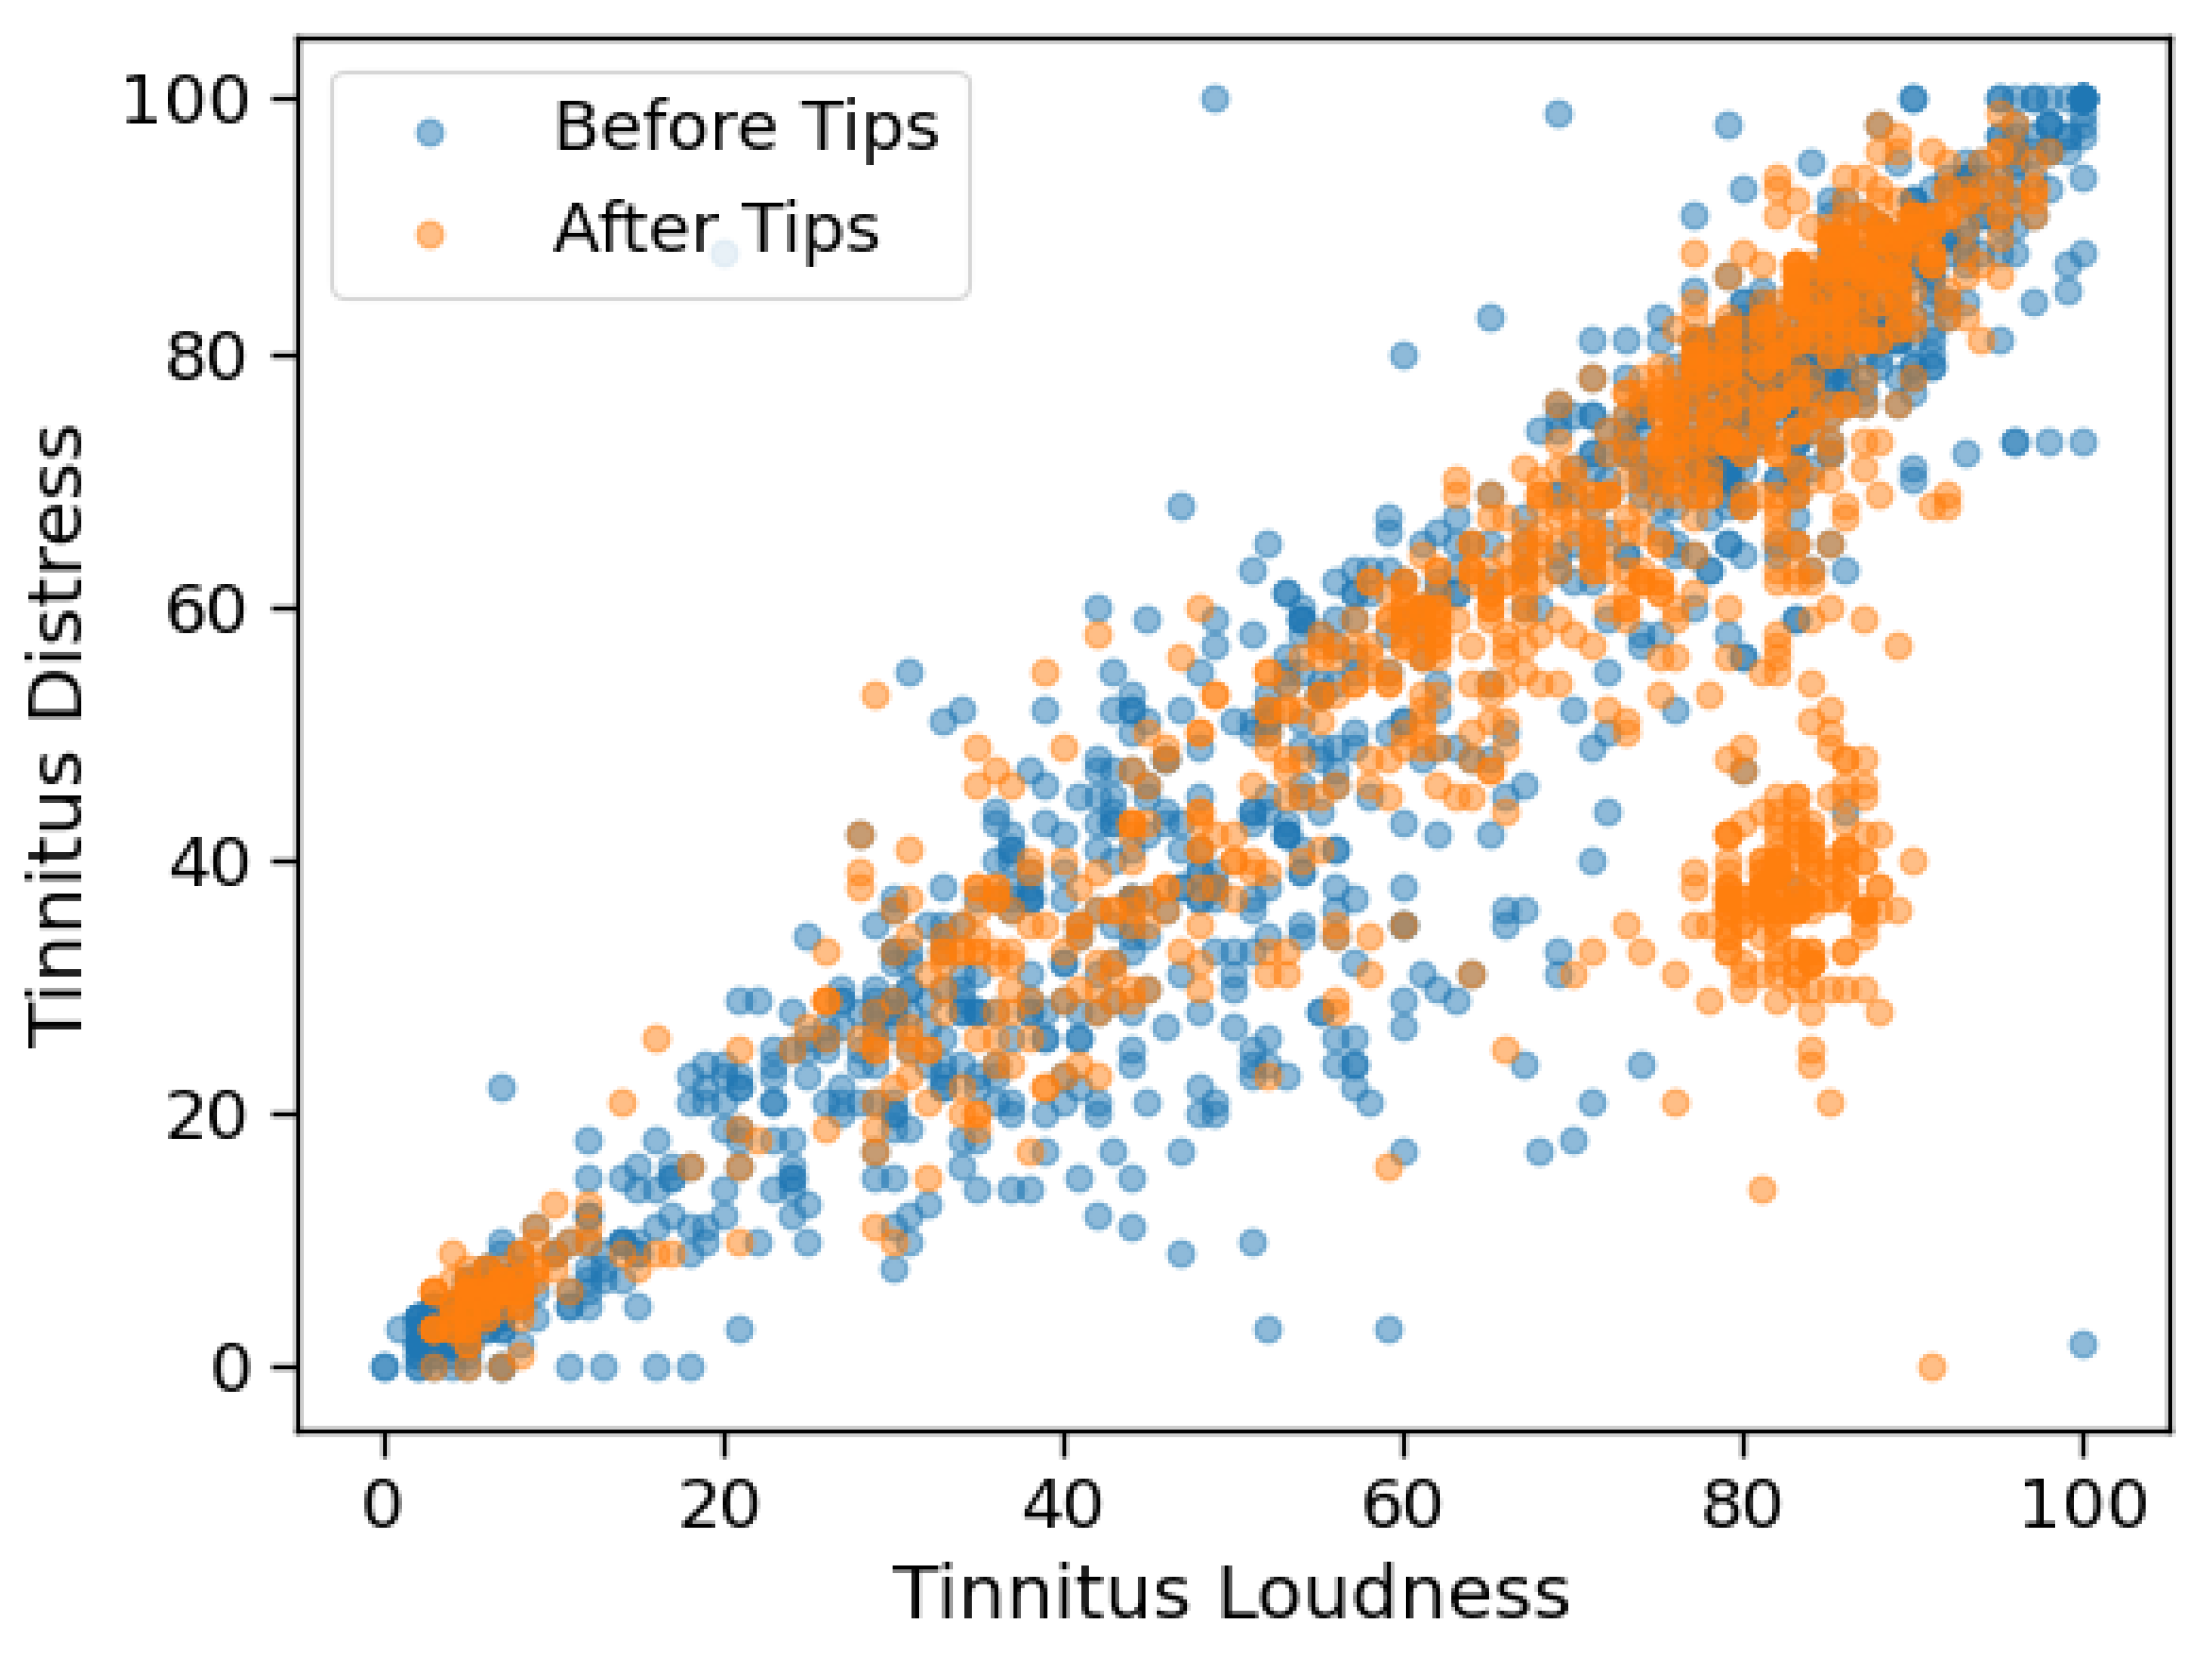
Regarding the impact of tinnitus loudness on distress, the diagonal band in
Figure 4 confirms that loudness and distress are indeed highly correlated variables. However, the cluster of data points (shown in red) in the bottom right corner is especially interesting, since it shows that there are times when the respondents report low tinnitus distress in spite of relatively higher levels of tinnitus loudness. It can also be visually intuited that the data at the low-loudness, low-distress corners are less noisy than those in the middle of the band.
shows that a unit increase in loudness causes a 0.76 unit increase in distress, but the cluster level models
show that the distress-impact of a unit increase in loudness may vary from 0.12 to 0.61, depending on the exact value of the loudness.
It is also seen that observations from the different clusters are not equally easy to predict, i.e., the nature of the interaction between tinnitus loudness and distress is not always the same, and it depends on symptom severity. It is to be noted that even the models with relatively poor R-squared values (for example, the model on cluster 2 which does not show relationships strong enough to reject the null hypothesis) do show better predictive power over unseen data than the single model trained over the combined data from all clusters. This supports the suspicion that the strength of interactions between loudness and distress does depend on the absolute levels of symptom strength, and that while tinnitus loudness does impact distress, the strength of this interaction may not always be the same.
The results in
Figure 6 show that users of group B who were exposed to the intervention were in fact persuaded to continue interacting with the app for longer than the users of group A. The fact that both groups A and Y are similar to each other and different to B supports the fact that it is indeed the intervention that causes the change in behaviour.
While the length of time for which a user engages with the system is an important metric, the user engagement is also relevant.
Figure 7 suggests that not only are users of group B using the app for longer, but also that they are, on average, more active per day (they answer more EMAs). This is also visible over all the data, where the users in Group A log on average 1.79 sessions per day, and those in Group B log 2.40 sessions per day. In addition to changing the intensity of the user’s interaction with the app, the Kolmogorov-Smirnov test on the loudness and distress values before and after the introduction of tips shows that the expression of tinnitus symptoms for users of group B is also affected.
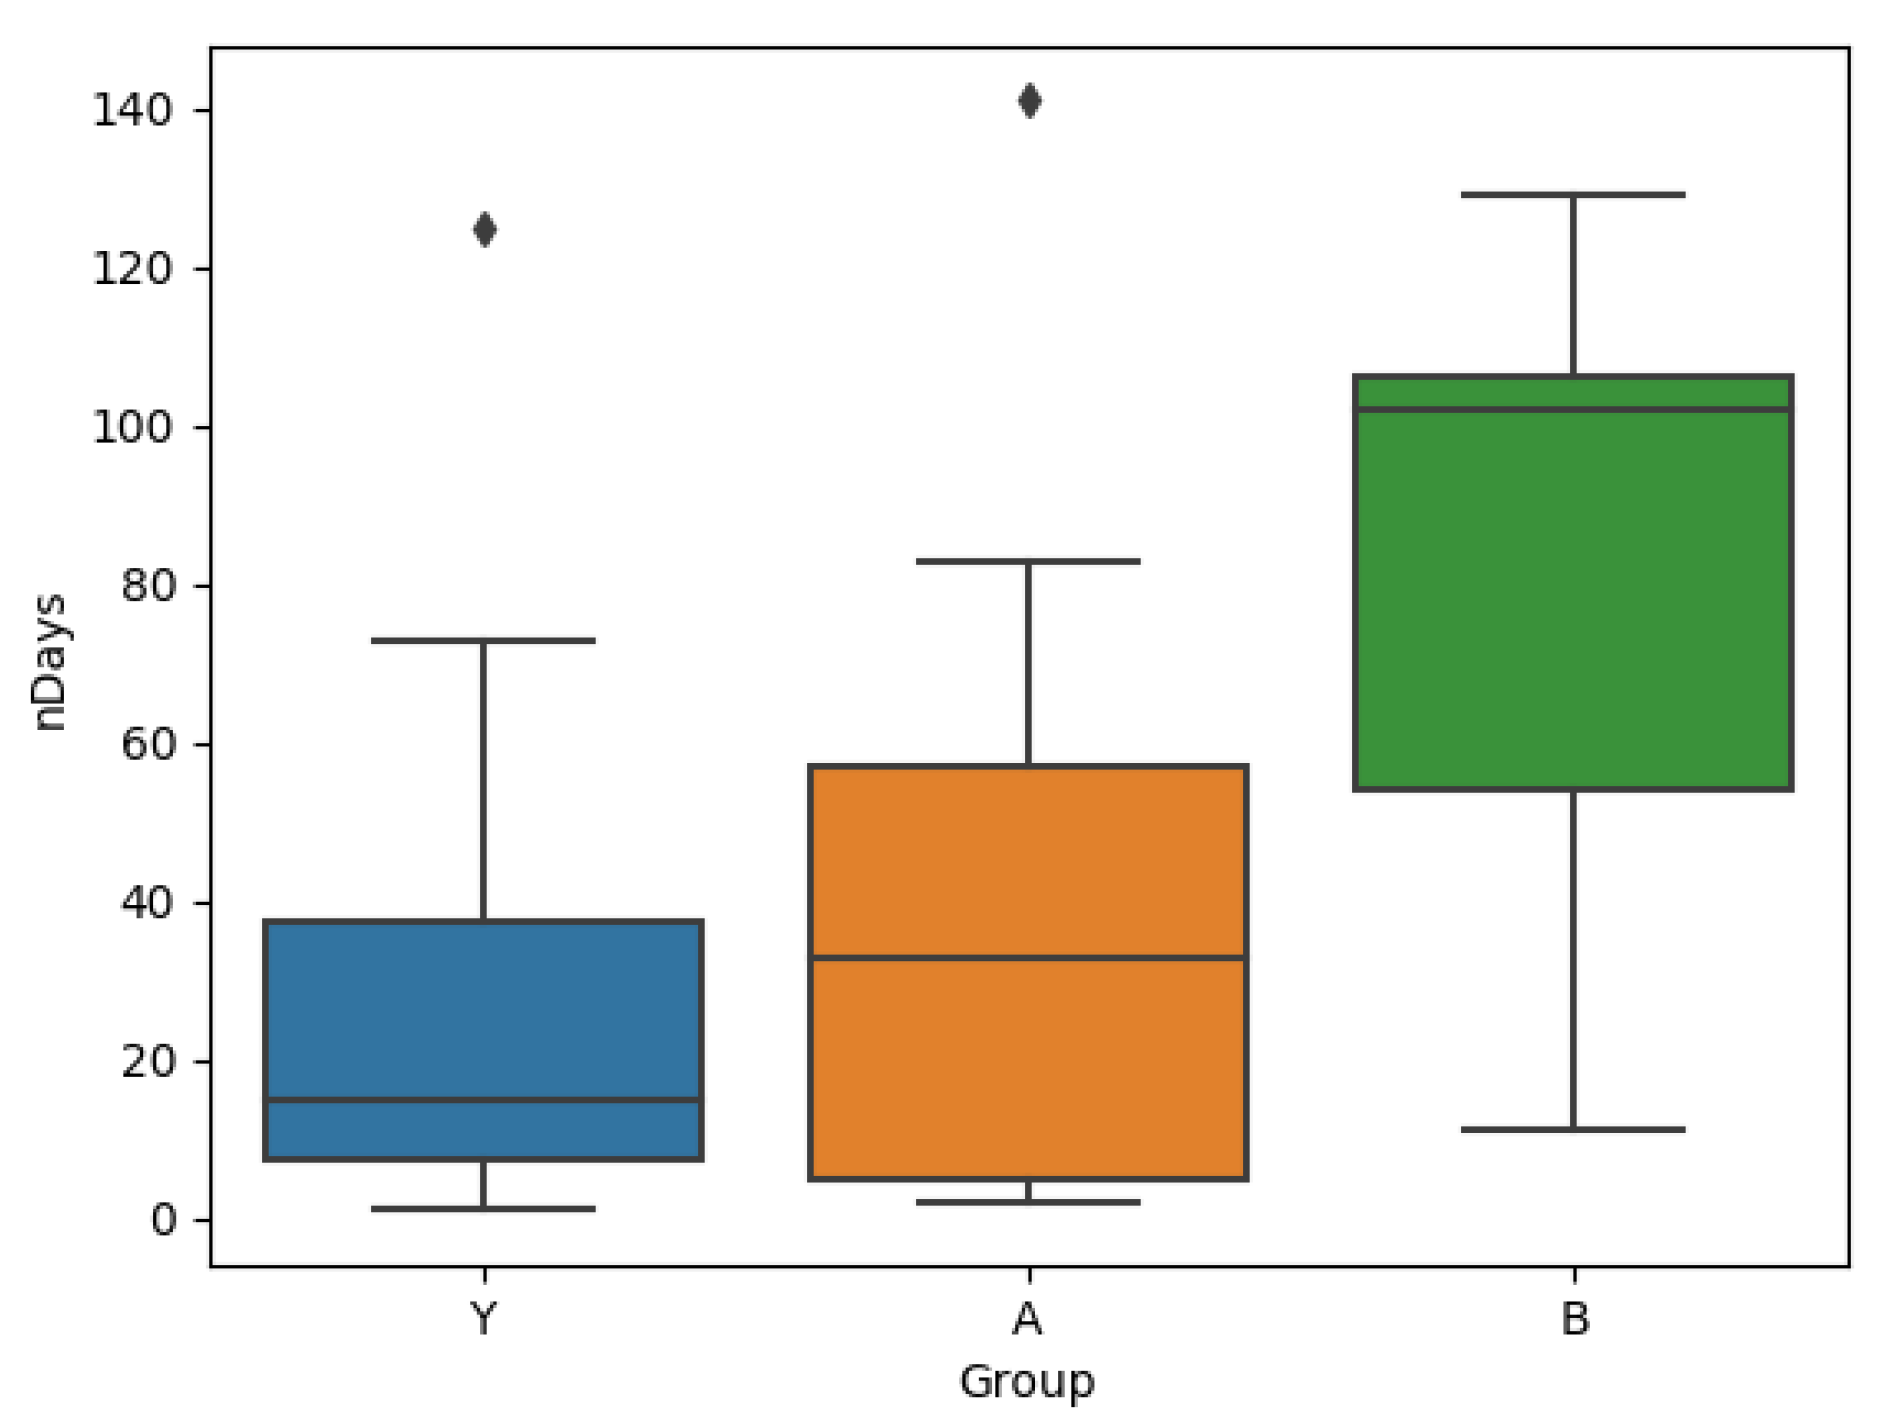
In addition to changing the user behaviour within the app, the introduction of tips is also seen to change the subjective experience of both tinnitus loudness and tinnitus distress. However, comparing this result to
Figure 8 makes it difficult to draw concrete conclusions—though the participants of group B do show lower THI values mid-study, the benefits do not seem to persist later on into the study.
Threats to validity: The current study leaves open several avenues for improvement, the first of which is that there was no group of users who never received tips. To truly assess the impact of tips on the subjective experience of tinnitus, it would be necessary to recruit such a group of participants who use the app with the tips feature disabled. Making some in-app registration questionnaires like the Mini-TQ mandatory would also enable comparison of the app-based EMA data with validated questionnaires. Questionnaires like Mini-TQ can also be requested from the participants multiple times during the study to better assess whether changes to the EMA questionnaire answers are accompanied by clinically relevant changes. This becomes especially important when considering the fact that though we see a significant difference in the loudness and distress after the introduction of tips, the small mid-study improvement in THI-scores for group B reverts at post-study to values similar to baseline. The number of patients can also be increased, and since the participants are recruited at a hospital, adding features like audiological examinations and other tests may provide features that help us identify similarities in the EMAs depending on patient characteristics. Since Tinnitus is a disease that affects older people disproportionately, the use of an app in itself might be a factor that causes some people to drop out, causing a bias in the EMA data that is collected. Another useful addition to the analysis would be to assess the impact of other variables from the EMA on tinnitus distress, not just loudness.
To conclude, it is clear that users who started receiving tips to deal with their tinnitus do indeed stay active on the system for longer. However, since users of group A have also received the tips, it is possible that the introduction of the tips after the user is already acclimatised to the app makes it more beneficial to the user. Another possibility is that the increased user engagement is driven by the introduction of a new feature in the app, which sustains user interest. While this cannot be verified with the available data, it still does not explain why the introduction of tips is accompanied by a significant change in the subjective perception of both tinnitus loudness and distress. Visualisations of the EMA responses like that shown in
Figure 9 further underscore the need for continued efforts in recording EMA data, since other questionnaires, especially those that are answered in a hospital setting, may not capture changes of this nature.

 ,
, 


