Article

Metformin Enhances Excitatory Synaptic Transmission onto Hippocampal CA1 Pyramidal Neurons

1
School of Life Sciences, Nanchang University, Nanchang 330031, China
2
Institute of Life Science, Nanchang University, Nanchang 330031, China
3
School of Basic Medical Sciences, Nanchang University, Nanchang 330031, China
*
Author to whom correspondence should be addressed.
Brain Sci. 2020, 10(10), 706; https://doi.org/10.3390/brainsci10100706
Submission received: 18 August 2020 / Revised: 25 September 2020 / Accepted: 1 October 2020 / Published: 4 October 2020
(This article belongs to the Section Molecular and Cellular Neuroscience)

Abstract

:
Metformin (Met) is a first-line drug for type 2 diabetes mellitus (T2DM). Numerous studies have shown that Met exerts beneficial effects on a variety of neurological disorders, including Alzheimer’s disease (AD), Parkinson’s disease (PD) and Huntington’s disease (HD). However, it is still largely unclear how Met acts on neurons. Here, by treating acute hippocampal slices with Met (1 μM and 10 μM) and recording synaptic transmission as well as neuronal excitability of CA1 pyramidal neurons, we found that Met treatments significantly increased the frequency of miniature excitatory postsynaptic currents (mEPSCs), but not amplitude. Neither frequency nor amplitude of miniature inhibitory postsynaptic currents (mIPSCs) were changed with Met treatments. Analysis of paired-pulse ratios (PPR) demonstrates that enhanced presynaptic glutamate release from terminals innervating CA1 hippocampal pyramidal neurons, while excitability of CA1 pyramidal neurons was not altered. Our results suggest that Met preferentially increases glutamatergic rather than GABAergic transmission in hippocampal CA1, providing a new insight on how Met acts on neurons.

1. Introduction

The biguanide metformin (Met) has long been used as a first-line drug for type 2 diabetes mellitus (T2DM) therapy. Met lowers the plasma glucose level through inhibiting hepatic glucose production and enhancing insulin sensitivity [1]. At the cellular level, Met inhibits the mitochondrial respiratory chain complex I and activates AMP (adenosine monophosphate)-activated protein kinase complex (AMPK) [2,3]. Met can also target other organelles, such as lysosome, or act in an AMPK-independent manner [4,5,6].
Although Met is the mainstay of therapy for T2DM, it has also been indicated that Met may have effects in some neurological disorders, such as neurodevelopmental disorders, neurodegenerative diseases and neuropsychiatric disorders. In a fragile X syndrome (FXS) mouse model, Met treatment ameliorated social deficit, repetitive behavior and abnormal dendritic spine morphology and exaggerated long-term depression (LTD) [7]. Furthermore, improvements in language and cognitive behaviors were observed in a small sample size of Met-treated FXS patients [8,9,10]. In some Alzheimer’s disease (AD) mice models, Met attenuated amyloid plaque deposition and improved learning and memory [11,12,13,14]. Met also showed neuroprotective effects on dopaminergic neurons in 1-methyl-4-phenyl-1,2,3,6-tetrahydropyridine (MPTP)-modeled mice of Parkinson’s disease (PD) [15,16]. Moreover, Met has been found to rescue the early brain changes and abnormal behaviors in Huntington’s disease (HD)-modeled in mice [17]. Furthermore, Met was suggested to benefit depression by studies in both animals [18,19] and T2DM patients with depression [20]. These findings indicate the beneficial effects of Met on brain functions.
It has been shown that Met may exert anti-inflammatory, anti-oxidative and anti-apoptotic effects on neurological disorders [21]. The neuroprotective effects of Met can be achieved by actions on mitochondria, the main target organelle of Met [22]. Met can also regulate brain metabolism and homeostasis for the improvement of brain functions [23,24,25]. Neurons are the primary signaling cells and the functional unit in the brain. The communication between neurons, also called synaptic transmission, is crucial to brain functions. However, it remains unclear how Met acts on the neurons and synapses. To uncover the role of Met on synaptic transmission, here, we examined the effects of Met on glutamatergic and GABAergic neurotransmission in hippocampal slices from mice.

2. Materials and Methods

2.1. Animals

Male C57BJ/6 mice of 5–6 weeks of age were used. The mice were housed in a room of 22 °C in a 12 h light/dark cycle with free access to food and water ad libitum. All experiment procedures were approved by the Institutional Animal Care and Use Committee of Nanchang University.

2.2. Reagents

Met was purchased from Sigma-Aldrich, and 6-cyano-7-nitroquinoxaline-2,3-dione (CNQX), L-2-amino-5-phosphonopentanoic acid (DL-AP5) and bicuculline were purchased from Tocris Bioscience (Bristol, UK). Tetrodotoxin (TTX) was purchased from the Fisheries Research Institute of Hebei province (Hebei, China).

2.3. Slice Preparation

Mice (6–7-week-old) were anesthetized with isoflurane and subjected to cardiac perfusion with an ice-cold oxygenated (95% O2/5% CO2) choline chloride-based cutting solution, containing: 120 mM choline chloride, 2.5 mM KCl, 7 mM MgCl2, 0.5 mM CaCl2, 1.25 mM NaH2PO4, 5 mM sodium ascorbate, 3 mM sodium pyruvate, 26 mM NaHCO3, and 25 mM glucose. The mice were rapidly decapitated and their brains were removed quickly and placed in a cutting solution. Hippocampal slices of 300 µm thickness were prepared with VT1000S Vibratome (Leica Microsystems) [26]. Slices were transferred to storage chamber containing a cutting solution at 34 °C for 15 min, then translocated to the incubator with artificial cerebrospinal fluid (ACSF) (124 mM NaCl, 2.5 mM KCl, 2 mM MgSO4, 2.5 mM CaCl2, 1.25 mM NaH2PO4, 26 mM NaHCO3, and 10 mM glucose) at room temperature (25 ± 1 °C) for at least 1 hr before recording.

2.4. Electrophysiological Recording

Slices were exposed to Met for 1 hr in an individual incubation chamber, then placed in a recording chamber superfused (2 mL/min) with ACSF at 32–34 °C. Pyramidal neurons in CA1 were visualized with infrared optics using an upright fixed microscope equipped with a 40X water-immersion lens (FN1, Nikon) and a CCD (Charge-Coupled Device) monochrome video camera (IR-1000, DAGE-MTI). Patch pipettes (resistance of 3–5 MΩ) were prepared by a horizontal pipette puller (P-1000; Sutter Instruments).
For miniature excitatory postsynaptic current (mEPSC) recording, pyramidal neurons were held at −70 mV in the presence of 20 µM bicuculline and 1 µM TTX, with the pipette solution containing: 125 mM K-gluconate, 5 mM KCl, 10 mM HEPES, 0.2 mM EGTA, 1 mM MgCl2, 4 mM Mg-ATP, 0.3 mM Na-GTP and 10 mM phosphocreatine (pH 7.35, 290 mOsm). For miniature inhibitory postsynaptic current (mIPSC) recording, pyramidal neurons were held at −70 mV in the presence of 20 µM CNQX, 50 µM DL-AP5 and 1 µM TTX, with the pipette solution containing: 130 mM CsCl, 10 mM HEPES, 0.2 mM EGTA, 1 mM MgCl2, 4 mM Mg-ATP, 0.3 mM Na-GTP, mM 10 phosphocreatine and 5 mM QX314 (pH 7.35, 290 mOsm) [27].
For paired-pulse ratio recording, EPSCs were evoked by stimulating the Schaffer collaterals (SC)-CA1 pathway at a holding potential of −70 mV in the presence of 20 µM bicuculline, with the pipette solution containing: 125 mM Cs-methanesulfonate, 5 mM CsCl, 10 mM HEPES, 0.2 mM EGTA, 1 mM MgCl2, 4 mM Mg-ATP, 0.3 mM Na-GTP, 10 mM phosphocreatine and 5 mM QX314 (pH 7.35, 290 mOsm). The first evoked EPSC was adjusted with amplitude between 100 and 150 pA. The ratio was defined as the fraction of EPSC2/EPSC1 amplitudes.
To measure neuronal intrinsic excitability, recording pipettes were filled with internal solutions containing 125 mM K-gluconate, 5 mM KCl, 10 mM HEPES, 0.2 mM EGTA, 1 mM MgCl2, 4 mM Mg-ATP, 0.3 mM Na-GTP and 10 mM phosphocreatine (pH 7.35, 290 mOsm), the current clamp mode was performed and pulsed depolarization currents with increasing amplitude at steps of 50 pA were injected [28]. Furthermore, 20 µM CNQX, 50 µM DL-AP5 and 20 µM bicuculline were added to the perfusion buffer to block excitability and inhibitory neurotransmission.
Data were acquired using the MultiClamp 700B amplifier and 1550A digitizer (Molecular Devices). Series resistance was monitored throughout the experiments and cells included in analysis were of resistance <20 MΩ. Neurons would be rejected if membrane potentials were more positive than −60 mV, if the ratio of Rin to Rs <5 or if series resistance fluctuated >20% of initial values. Data were filtered at 3 kHz and sampled at 10 kHz.

2.5. Statistical Analysis

Data were analyzed with GraphPad Prism software. For comparison between three groups, one-way ANOVA was used, followed by Tukey’s post hoc multiple comparison test. For analysis of three groups at multiple time points, two-way ANOVA was used, followed by Bonferroni’s post hoc multiple comparison test. The mEPSCs and mIPSCs were manually analyzed by Mini Analysis (Synaptosoft). The paired-pulse ratio and action potential numbers were analyzed by clampfit (Molecular Devices). Cumulative probability curves for inter-event interval and amplitude of mEPSC/mIPSC were analyzed using the Kolmogorov–Smirnov test. Data were presented as mean ± SEM. p-value < 0.05 was considered statistically significant.

3. Results

3.1. Met Markedly Enhances Glutamatergic Transmission in the CA1 Pyramidal Neurons

We first investigated the potential role of Met on glutamatergic transmission by performing whole-cell voltage clamp recordings on CA1 pyramidal neurons. Miniature excitatory postsynaptic currents (mEPSCs) were recorded, with the presence of bicuculline (antagonist of GABAA receptors) and tetrodotoxin (TTX, voltage-gated sodium channel blocker) blocking inhibitory neurotransmission and action potential (AP), respectively (Figure 1). mEPSC frequencies were dramatically increased in slices treated with Met at concentrations of 1 μM and 10 μM (F(2,35) = 14.53, p < 0.0001, one-way ANOVA; control (1.51 ± 0.11 Hz) versus 1 μM Met (2.27 ± 0.17 Hz), p = 0.0011; control (1.51 ± 0.11 Hz) versus 10 μM Met (2.53 ± 0.13 Hz), p < 0.0001; n = 12–13 neurons from four mice per group) (Figure 1A,B). In addition, no difference in frequency was observed between the 1 μM Met and 10 μM Met groups (Figure 1A,B). As a result, both 1 μM and 10 μM Met treatment considerably left-shifted the cumulative probability curve of mEPSC inter-event interval (control versus 1 μM Met, p = 0.0324; control versus 10 μM Met, p = 0.0003; Kolmogorov–Smirnov test) (Figure 1C). In contrast, neither the 1 μM nor 10 μM Met treatments showed influence on mEPSC amplitude compared with the control group (F(2,35) = 0.0475, p = 0.9537; one-way ANOVA; control (16.06 ± 0.44 pA) versus 1 μM Met (15.91 ± 0.41 pA), p = 0.9817; control (16.06 ± 0.44 pA) versus 10 μM Met (16.16 ± 0.83 pA), p = 0.9912) (Figure 1D). Accordingly, there was no significant effect of 1 μM or 10 μM Met on the cumulative probability curve of mEPSC amplitude (control versus 1 μM Met, p = 0.7307; control versus 10 μM Met, p = 0.9998; Kolmogorov–Smirnov test) (Figure 1E). Moreover, there was no difference in passive membrane properties, including rest membrane potential (RMP), membrane capacitance and input resistance of pyramidal neurons between the control and the Met treatment groups. Taken together, these results suggest that Met enhances the glutamatergic transmission onto CA1 pyramidal neurons.

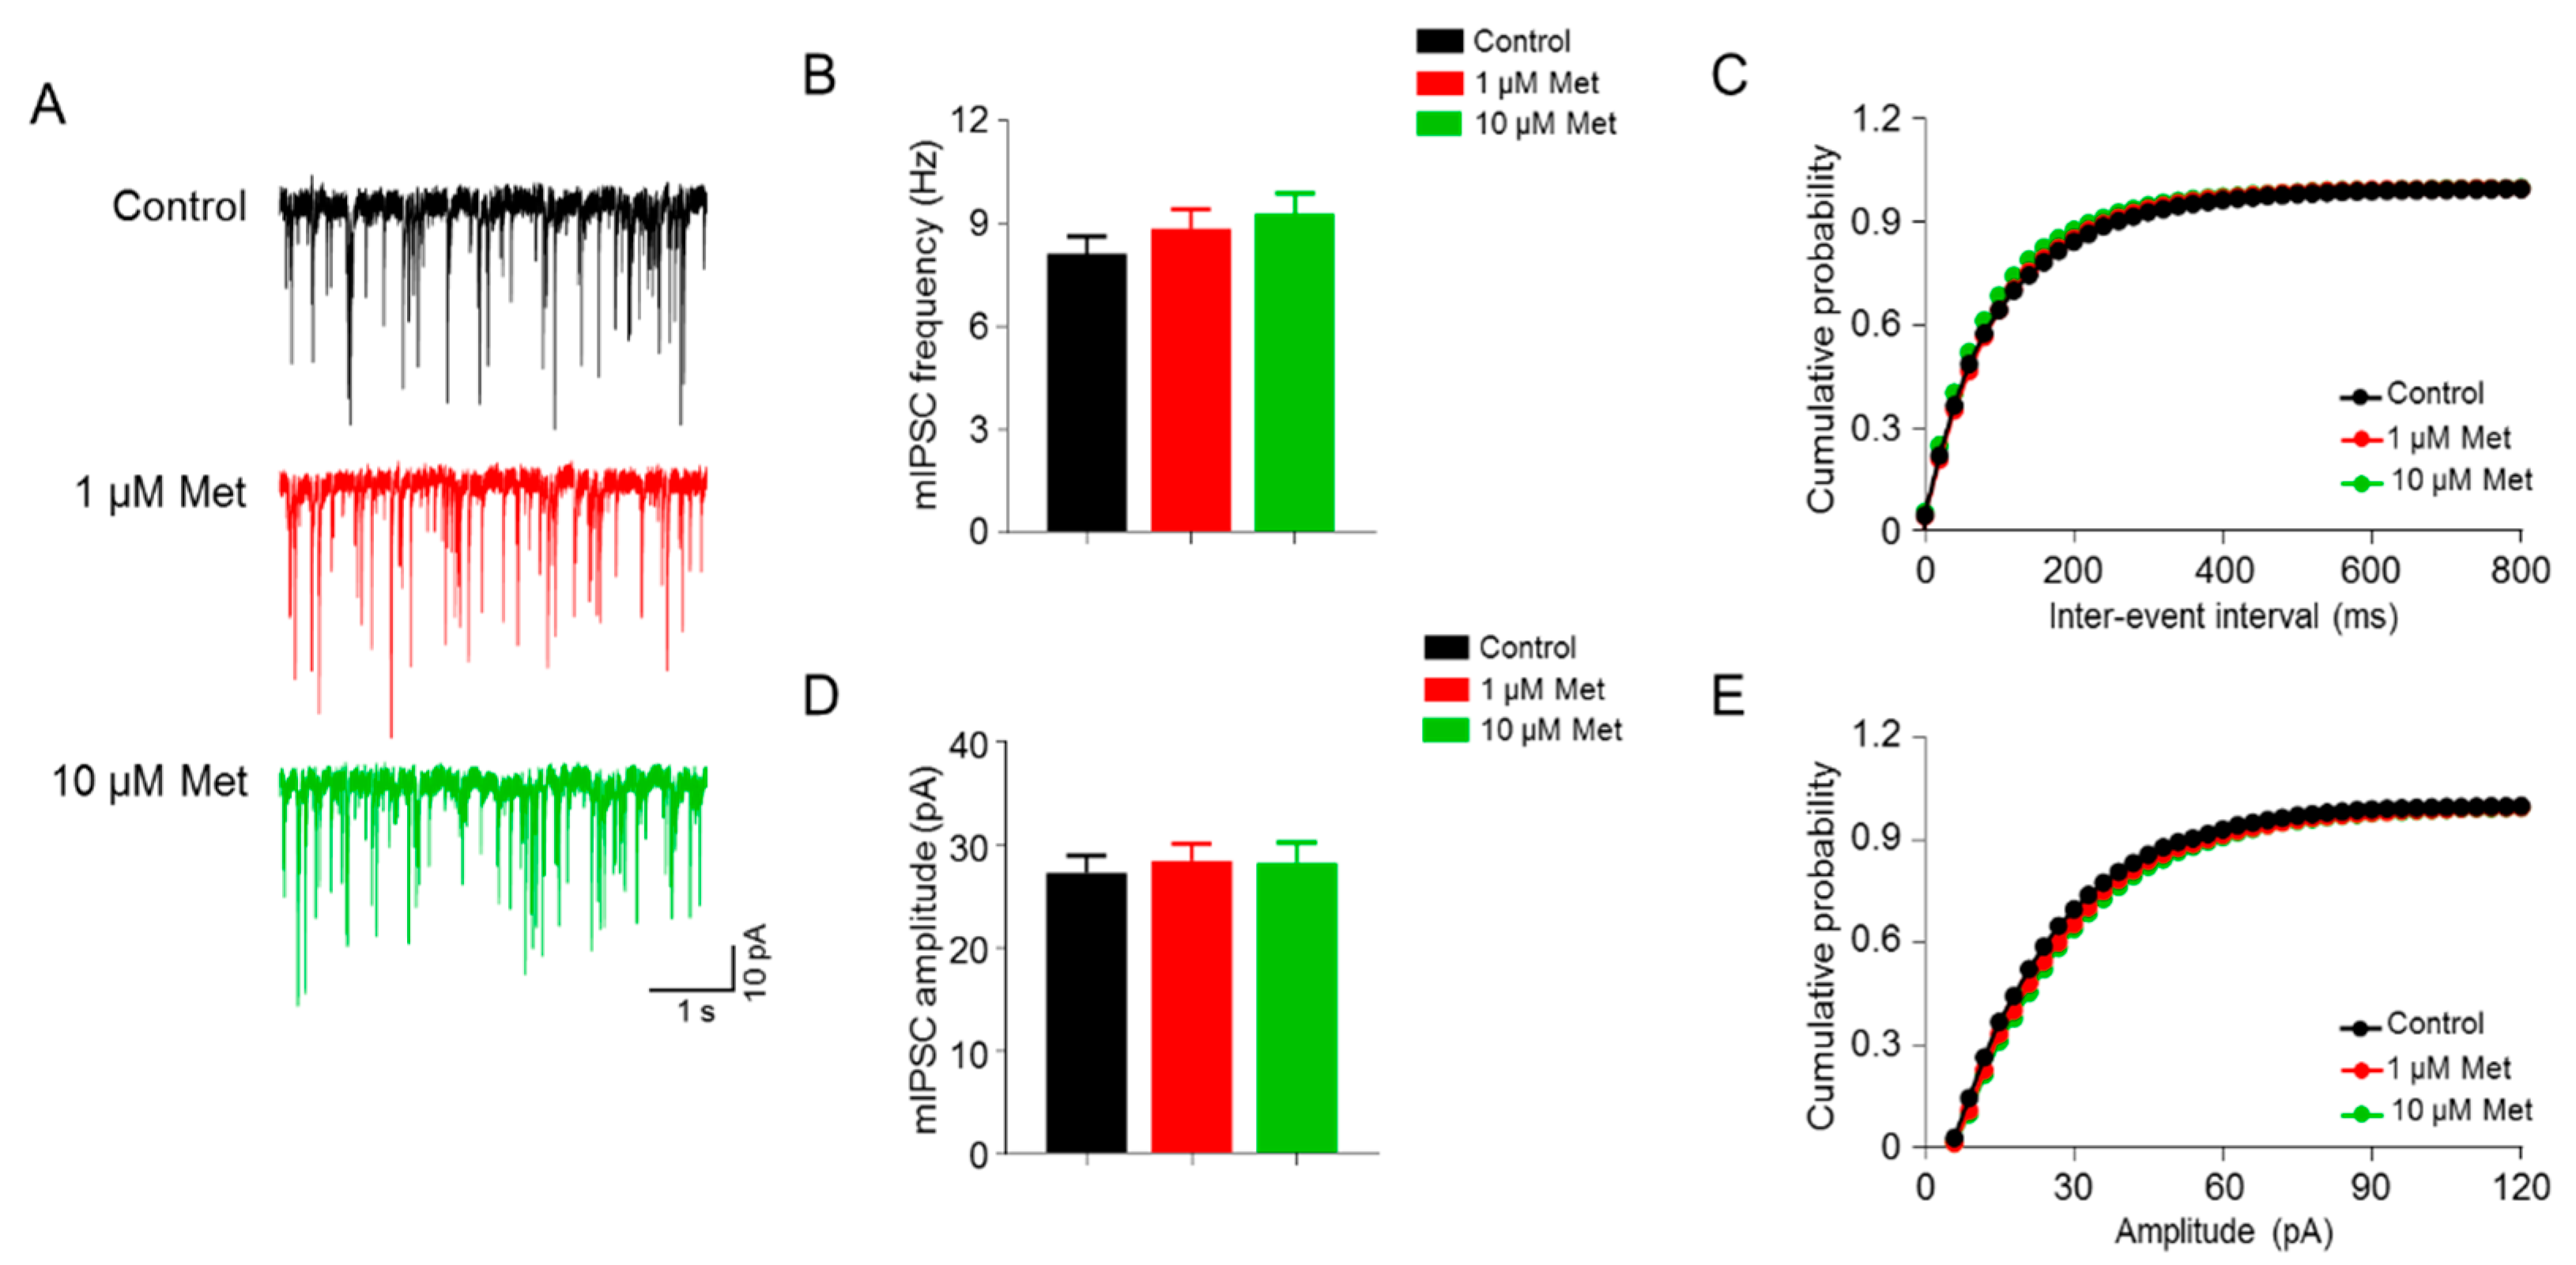
3.2. Met Has No Effect on the GABAergic Transmission in the CA1 Pyramidal Neurons

We next explored the influence of Met on the GABAergic transmission onto CA1 pyramidal neurons. Neurons were clamped at −70 mV and the miniature inhibitory postsynaptic currents (mIPSCs) were recorded in the presence of 20 µM CNQX, 50 µM DL-AP5 (antagonists of α-amino-3-hydroxyl-5-methyl-4-isoxazole-propionate (AMPA) and N-methyl-D-aspartate (NMDA) receptors, respectively) and 1 μM TTX, which blocks excitatory neurotransmission and APs (Figure 2). As shown in Figure 2A,B, neither 1 μM nor 10 μM Met changed mIPSC frequency (F(2,49) = 1.085, p = 0.3458, one-way ANOVA; control (8.12 ± 0.51 Hz) versus 1 μM Met (8.86 ± 0.57 Hz), p = 0.6155; control (8.12 ± 0.51 Hz) versus 10 μM Met (9.28 ± 0.60 Hz), p = 0.3220; n = 17–18 neurons from four mice per group). In line with this, the cumulative probability curves of mEPSC inter-event interval were similar between the control and Met treatment (control versus 1 μM Met, p = 0.9206; control versus 10 μM Met, p = 0.5886; Kolmogorov–Smirnov test) (Figure 2C). Furthermore, no significant changes in the mean value and cumulative probability curve of mIPSC amplitude were found in the Met treatment group compared with control group (mean value: F(2,49) = 0.1204, p = 0.8869, one-way ANOVA; control (27.29 ± 1.70 pA) versus 1 μM Met (28.43 ± 1.67 pA), p = 0.8921; control (27.29 ± 1.70 Hz) versus 10 μM Met (28.28 ± 1.99 pA), p = 0.9206; cumulative probability curve: control versus 1 μM Met, p = 0.7453; control versus 10 μM Met, p = 0.5562; Kolmogorov–Smirnov test) (Figure 2D,E). Altogether, these data suggest that Met has no effect on GABAergic transmission onto CA1 pyramidal neurons.

3.3. Met Increases Glutamate Release from Presynaptic Terminals

The increased frequency of mEPSCs suggests increased glutamatergic transmission but we cannot tell the specific cause (e.g., the increased release probability or the number of presynaptic terminals). To address this question, we measured the paired-pulse responses of evoked EPSCs (eEPSCs) at different intervals in CA1 pyramidal neurons. The electric stimuli were delivered through a bipolar electrode placed in the Schaffer collaterals (SC)-CA1 pathway. Neurons were held at −70 mV in the presence of 20 µM bicuculline to block GABAergic transmission. The paired-pulse ratio (PPR) was calculated by the fraction of EPSC2 by EPSC1 amplitudes. As shown in Figure 3, we found that PPRs were significantly decreased in 1 μM and 10 μM Met treatment groups compared with the control group (control versus 1 μM Met, F(1,51) = 15.54, p = 0.0002; control versus 10 μM Met, F(1,57) = 10.72, p = 0.0018; two-way ANOVA; n = 9–11 neurons from three mice per group), indicating that Met enhances glutamate release probability from presynaptic terminals that innervate hippocampal CA1 pyramidal neurons.

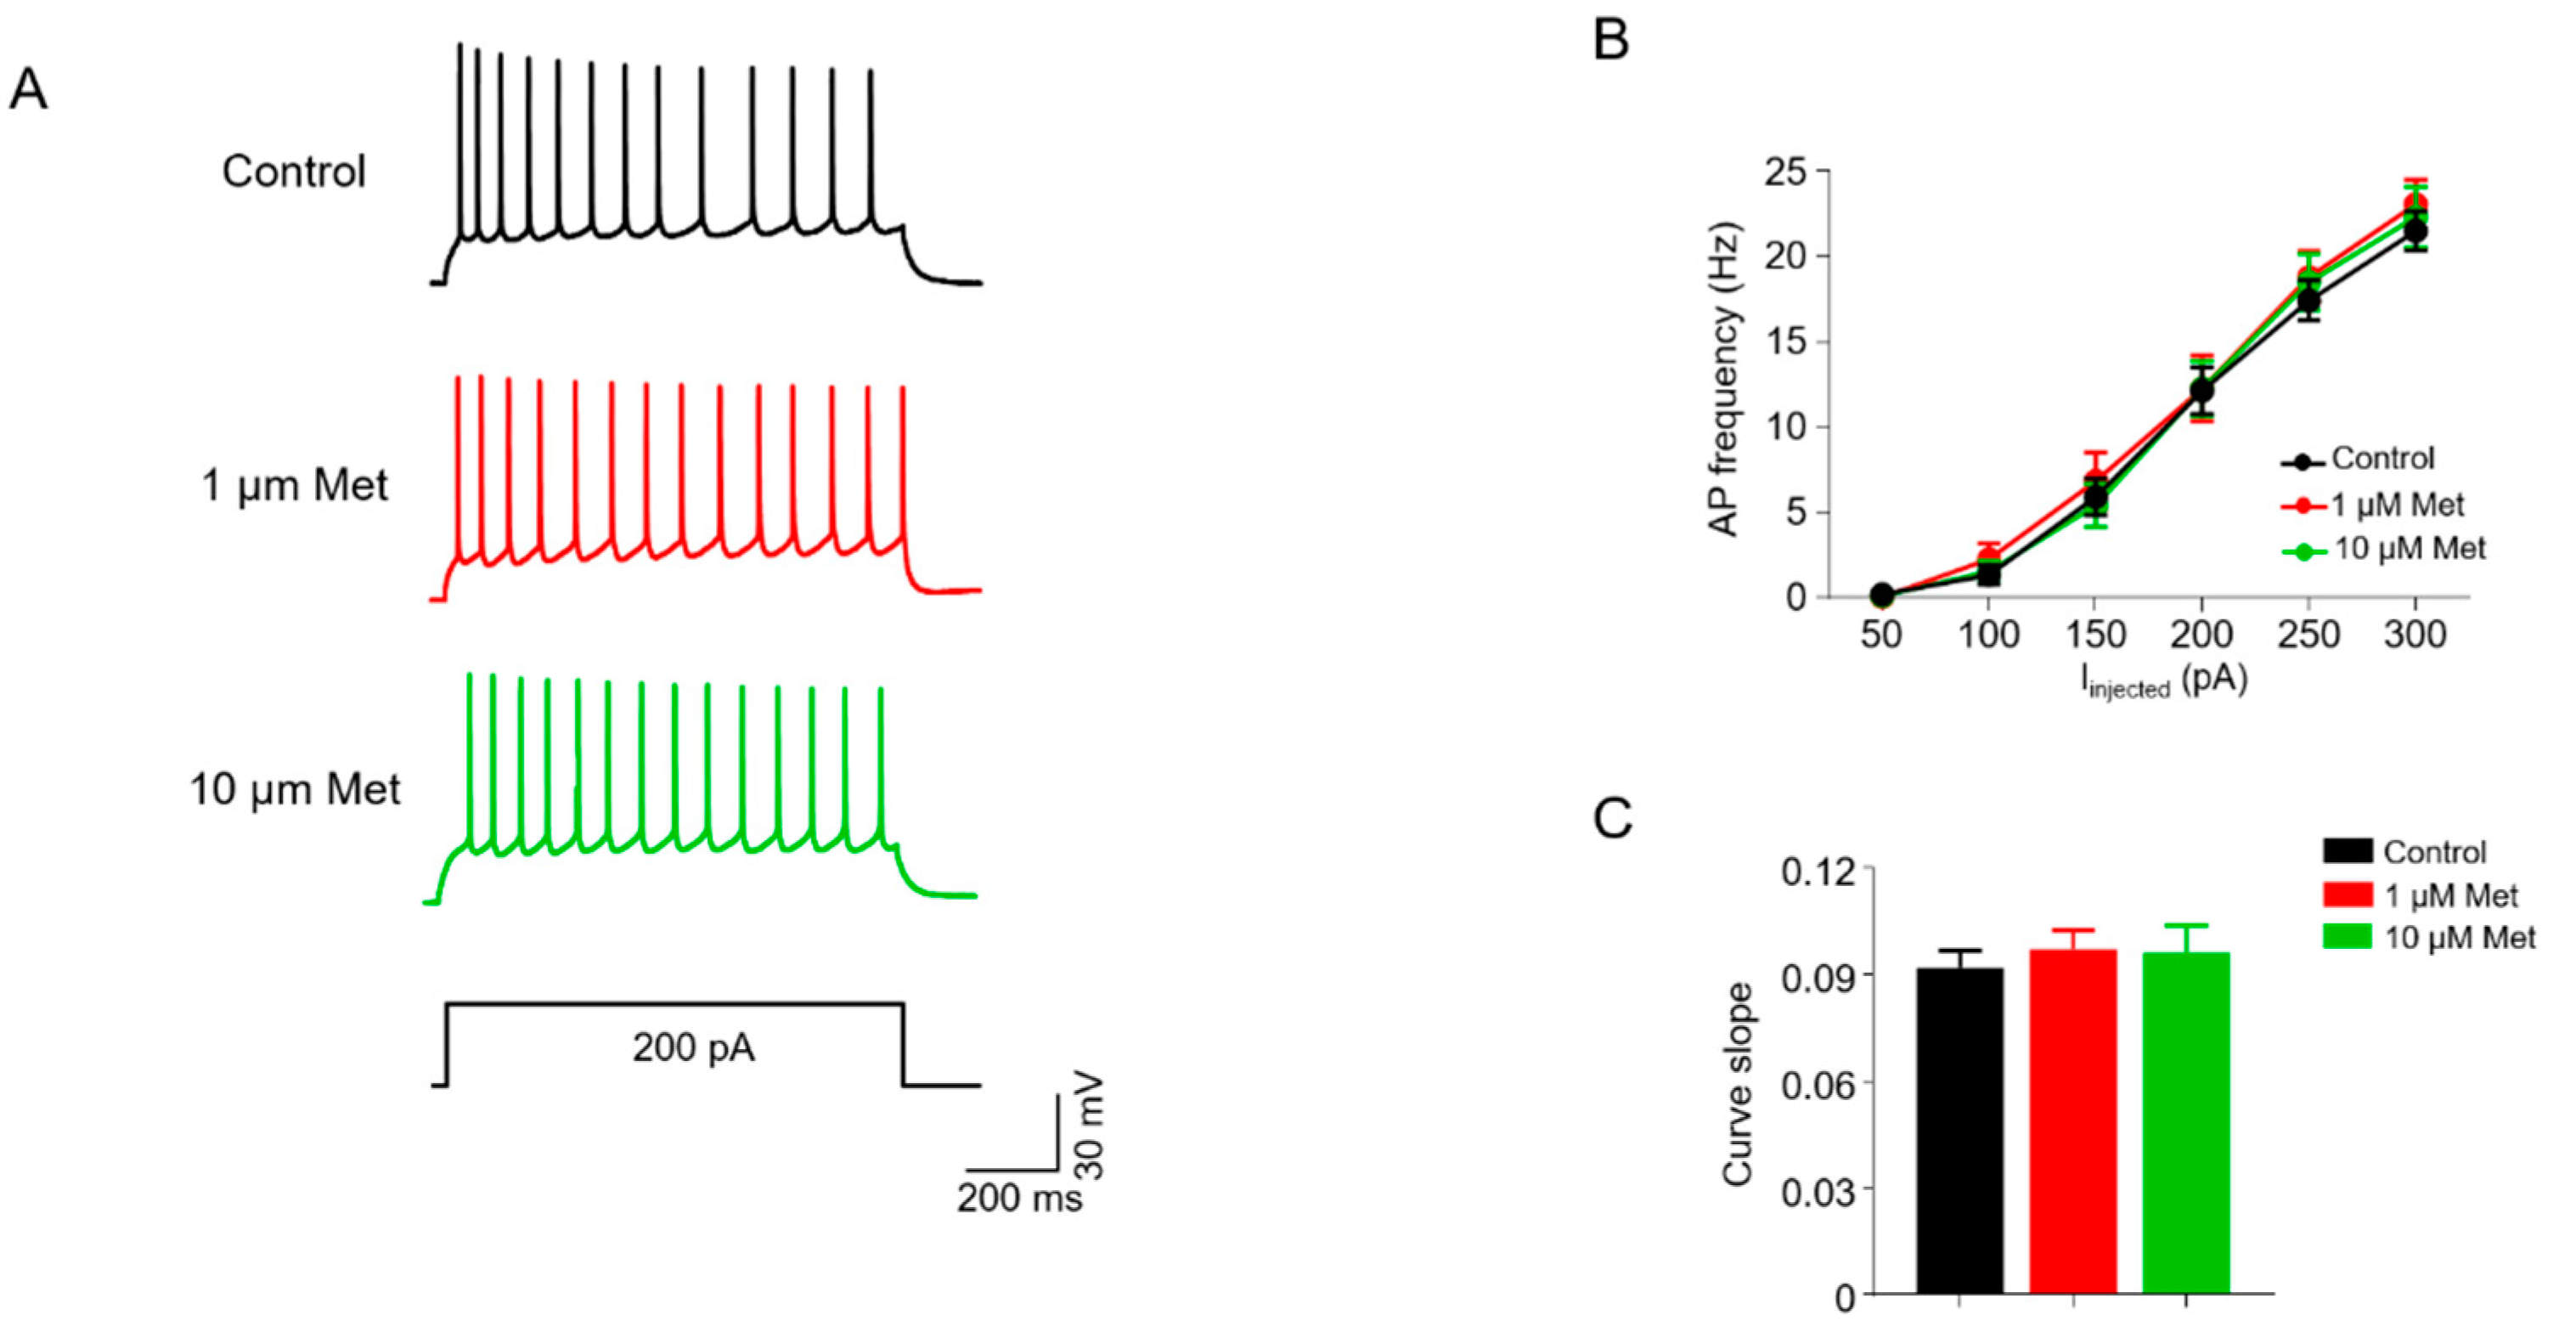
3.4. Met Does Not Alter Intrinsic Excitability in CA1 Pyramidal Neurons

We next examined whether Met affects the neuronal intrinsic excitability of CA1 pyramidal neurons. The APs of pyramidal neurons were recorded in a whole-cell current clamp configuration by injecting depolarization currents. CNQX, DL-AP5 and bicuculline were added into a bath solution to block excitatory and inhibitory neurotransmission. We measured the AP numbers in response to injected currents of incremental levels and the firing frequency curve of pyramidal neurons were similar between the three groups (F(2,252) = 0.5951, p = 0.5523; two-way ANOVA; control, n = 14 neurons/4 mice; 1 μM Met, n = 15 neurons/5 mice; 10 μM Met, n = 16 neurons/5 mice) (Figure 4A,B). Consistently, no differences among groups were observed in the slope of fitted curves plotting the spike number against the current strength (F(2,42) = 0.1984, p = 0.8208, one-way ANOVA; control (0.092 ± 0.005) versus 1 μM Met (0.097 ± 0.005), p = 0.8278; control (0.092 ± 0.005) versus 10 μM Met (0.096 ± 0.008), p = 0.8704) (Figure 4C). These results suggest that the intrinsic excitability of pyramidal neurons is not influenced by Met treatment.

4. Discussion

In the present study, we demonstrated that Met, a first-line drug for T2DM, enhances glutamate release onto hippocampal CA1 pyramidal neurons. We treated acute hippocampal slices with Met at 1 μM or 10 μM concentrations and found that Met treatments at both concentrations increased mEPSC frequency, but not amplitude. Met treatments did not alter mIPSC frequency and amplitude. Moreover, presynaptic glutamate release probability, which was measured by PPRs, was increased upon Met treatment. However, Met treatments did not affect neuronal excitability in hippocampal CA1 pyramidal neurons. These results present evidence that Met enhances glutamatergic transmission, but not GABAergic transmission, onto hippocampal CA1 pyramidal neurons.
Neurotransmission is fundamental for brain functions, and defects in neurotransmission are implicated in many neurological disorders, such as AD, FXS, depression and so on. Met has been suggested to be effective in these disorders [8,9,10,29,30]. Although Met exerts its glucose level-lowering effects in the peripheral system, it has been reported that Met can cross the brain–blood barrier rapidly [31]. The hippocampus is a key brain region for memory and cognition. Neuronal activity and synaptic transmission within the hippocampus are critical for these functions. The hippocampus is also one of the major brain regions affected by AD, in which hippocampal synaptic transmission is impaired [32]. Met has been demonstrated to ameliorate synaptic, memory and cognitive deficits in rodent models of AD [12,33,34,35]. However, there are few reports about Met effects on synaptic transmission. Interestingly, we treated acute hippocampal slices with Met and found that mEPSC frequency, but not mIPSC frequency, was increased upon Met treatment (Figure 1; Figure 2). These data suggest that Met can preferentially increase glutamatergic rather than GABAergic transmission, which may contribute to the beneficial effects of Met on AD and other related disorders of the brain.
Either enhanced glutamate release or increased number of functional synapses could lead to the elevation of mEPSC frequency [36]. Thus, enhanced mEPSC frequency of hippocampal pyramidal neurons upon Met treatment (Figure 1) may be due to the increased presynaptic glutamate release. In support of this notion, the PPR of Met-treated hippocampal pyramidal neurons was indeed decreased (Figure 3). It seems like Met selectively regulates glutamatergic transmission. The frequency and amplitude of mIPSCs were not changed in hippocampal CA1 pyramidal neurons upon Met treatment (Figure 2). In peripheral cells, uptake of Met is mediated by the organic cation transporters OCT1 and OCT3 [37,38,39]. OCT3 is also found to be expressed in neurons [40,41,42]. Little is known about the expression pattern of Met transporters in the brains. There is a possibility that Met transporters are enriched only in excitatory neurons, thus contributing to the preference of Met in glutamatergic transmission. However, this needs further examination. Within cells, there are AMPK-dependent and -independent pathways for the action of Met. During synaptic activation, AMPK is required for maintaining energy levels [43]. It has been reported that food deprivation increases AMPK-dependent presynaptic glutamate release onto Agouti-related protein (AGRP) neurons [44]. AMPK has three subunits (α, β and γ), and AMPKα is abundant in hippocampal neurons [45]. Met treatment activates AMPK in the hippocampus of mice [46]. This pathway of Met on glutamatergic transmission needs further confirmation by treatment of AMPK inhibitors. Alternatively, Met can also act in an AMPK-independent pathway, through which Met may regulate presynaptic glutamate release machinery. Moreover, Met has neuroprotective effects in aging-related neurodegenerative diseases, such as AD and PD, and can improve the cognition of aged mice [47,48]. In the future, the effects of Met on synaptic transmission in aged mice should be investigated.
As mentioned above, functional synapse numbers can also affect mEPSC frequency. Next, spine density and morphology could be examined in primary hippocampal neuronal cultures treated with Met. Besides, silencing of synapses can contribute to the decreased mEPSC frequency and AMPA receptor turnover at the postsynaptic membrane regulates glutamatergic synapse silencing [49]. This raises the possibility that Met may selectively regulate trafficking of the AMPA receptor but not the GABA receptor at the postsynaptic area, which deserves to be examined in the future.

5. Conclusions

Taken together, our study, for the first time, suggested that Met preferentially enhances glutamate transmission onto hippocampal CA1 pyramidal neurons, which provides a new insight into the mechanism of the beneficial effect of Met on neurons.

Author Contributions

Conceptualization, W.-B.C., J.C. and E.-K.F.; methodology, W.-B.C., J.C. and E.-K.F.; formal analysis, W.-B.C. and J.C.; investigation, W.-B.C. and J.C.; resources, W.-B.C., J.C., Z.-Y.L., B.L., T.Z. and E.-K.F.; data curation, W.-B.C. and J.C.; writing—original draft, W.-B.C. and E.-K.F.; writing—review and editing, W.-B.C. and E.-K.F.; supervision, E.-K.F.; funding acquisition, T.Z. and E.-K.F. All authors have read and agreed to the published version of the manuscript.

Funding

This work was supported by grants from the National Natural Science Foundation of China (Grant Nos. 81460215, 31771142 and 31860268).

Conflicts of Interest

The authors declare no conflict of interest.

Availability of Data and Materials

All data generated or analyzed during this study are included in this published article.

Ethics Approval and Consent to Participate

The animal study was reviewed and approved by the Institutional Animal Care and Use Committee of Nanchang University.

References

  1. Pernicova, I.; Korbonits, M. Metformin—Mode of action and clinical implications for diabetes and cancer. Nat. Rev. Endocrinol. 2014, 10, 143–156. [Google Scholar] [CrossRef] [PubMed]
  2. Owen, M.R.; Doran, E.; Halestrap, A.P. Evidence that metformin exerts its anti-diabetic effects through inhibition of complex 1 of the mitochondrial respiratory chain. Biochem. J. 2000, 348, 607–614. [Google Scholar] [CrossRef] [PubMed]
  3. Zhou, G.; Myers, R.; Li, Y.; Chen, Y.; Shen, X.; Fenyk-Melody, J.; Wu, M.; Ventre, J.; Doebber, T.; Fujii, N.; et al. Role of AMP-activated protein kinase in mechanism of metformin action. J. Clin. Invest. 2001, 108, 1167–1174. [Google Scholar] [CrossRef] [PubMed]
  4. Zhang, C.S.; Li, M.; Ma, T.; Zong, Y.; Cui, J.; Feng, J.W.; Wu, Y.Q.; Lin, S.Y.; Lin, S.C. Metformin Activates AMPK through the Lysosomal Pathway. Cell Metab. 2016, 24, 521–522. [Google Scholar] [CrossRef] [PubMed] [Green Version]
  5. Chen, J.; Ou, Y.; Li, Y.; Hu, S.; Shao, L.W.; Liu, Y. Metformin extends C. elegans lifespan through lysosomal pathway. Elife 2017, 6. [Google Scholar] [CrossRef] [PubMed]
  6. Foretz, M.; Hebrard, S.; Leclerc, J.; Zarrinpashneh, E.; Soty, M.; Mithieux, G.; Sakamoto, K.; Andreelli, F.; Viollet, B. Metformin inhibits hepatic gluconeogenesis in mice independently of the LKB1/AMPK pathway via a decrease in hepatic energy state. J. Clin. Investig. 2010, 120, 2355–2369. [Google Scholar] [CrossRef] [Green Version]
  7. Gantois, I.; Khoutorsky, A.; Popic, J.; Aguilar-Valles, A.; Freemantle, E.; Cao, R.; Sharma, V.; Pooters, T.; Nagpal, A.; Skalecka, A.; et al. Metformin ameliorates core deficits in a mouse model of fragile X syndrome. Nat. Med. 2017, 23, 674–677. [Google Scholar] [CrossRef]
  8. Dy, A.B.C.; Tassone, F.; Eldeeb, M.; Salcedo-Arellano, M.J.; Tartaglia, N.; Hagerman, R. Metformin as targeted treatment in fragile X syndrome. Clin. Genet. 2018, 93, 216–222. [Google Scholar] [CrossRef]
  9. Protic, D.; Aydin, E.Y.; Tassone, F.; Tan, M.M.; Hagerman, R.J.; Schneider, A. Cognitive and behavioral improvement in adults with fragile X syndrome treated with metformin-two cases. Mol. Genet. Genomic. Med. 2019, 7, e00745. [Google Scholar] [CrossRef] [Green Version]
  10. Biag, H.M.B.; Potter, L.A.; Wilkins, V.; Afzal, S.; Rosvall, A.; Salcedo-Arellano, M.J.; Rajaratnam, A.; Manzano-Nunez, R.; Schneider, A.; Tassone, F.; et al. Metformin treatment in young children with fragile X syndrome. Mol. Genet. Genomic. Med. 2019, 7, e956. [Google Scholar] [CrossRef]
  11. Ou, Z.; Kong, X.; Sun, X.; He, X.; Zhang, L.; Gong, Z.; Huang, J.; Xu, B.; Long, D.; Li, J.; et al. Metformin treatment prevents amyloid plaque deposition and memory impairment in APP/PS1 mice. Brain Behav. Immun. 2018, 69, 351–363. [Google Scholar] [CrossRef] [PubMed]
  12. Wang, Y.; Zhao, J.; Guo, F.L.; Gao, X.; Xie, X.; Liu, S.; Yang, X.; Yang, X.; Zhang, L.; Ye, Y.; et al. Metformin Ameliorates Synaptic Defects in a Mouse Model of AD by Inhibiting Cdk5 Activity. Front. Cell. Neurosci. 2020, 14, 170. [Google Scholar] [CrossRef] [PubMed]
  13. Lu, X.Y.; Huang, S.; Chen, Q.B.; Zhang, D.; Li, W.; Ao, R.; Leung, F.C.; Zhang, Z.; Huang, J.; Tang, Y.; et al. Metformin Ameliorates Abeta Pathology by Insulin-Degrading Enzyme in a Transgenic Mouse Model of Alzheimer’s Disease. Oxid. Med. Cell. Longev. 2020, 2020, 2315106. [Google Scholar] [CrossRef] [PubMed] [Green Version]
  14. Farr, S.A.; Roesler, E.; Niehoff, M.L.; Roby, D.A.; McKee, A.; Morley, J.E. Metformin Improves Learning and Memory in the SAMP8 Mouse Model of Alzheimer’s Disease. J. Alzheimers Dis. 2019, 68, 1699–1710. [Google Scholar] [CrossRef]
  15. Patil, S.P.; Jain, P.D.; Ghumatkar, P.J.; Tambe, R.; Sathaye, S. Neuroprotective effect of metformin in MPTP-induced Parkinson’s disease in mice. Neuroscience 2014, 277, 747–754. [Google Scholar] [CrossRef]
  16. Lu, M.; Su, C.; Qiao, C.; Bian, Y.; Ding, J.; Hu, G. Metformin Prevents Dopaminergic Neuron Death in MPTP/P-Induced Mouse Model of Parkinson’s Disease via Autophagy and Mitochondrial ROS Clearance. Int. J. Neuropsychopharmacol. 2016, 19. [Google Scholar] [CrossRef]
  17. Arnoux, I.; Willam, M.; Griesche, N.; Krummeich, J.; Watari, H.; Offermann, N.; Weber, S.; Dey, P.N.; Chen, C.W.; Monteiro, O.; et al. Metformin reverses early cortical network dysfunction and behavior changes in Huntington’s disease. Elife 2018, 7. [Google Scholar] [CrossRef]
  18. Fang, W.; Zhang, J.; Hong, L.; Huang, W.; Dai, X.; Ye, Q.; Chen, X. Metformin ameliorates stress-induced depression-like behaviors via enhancing the expression of BDNF by activating AMPK/CREB-mediated histone acetylation. J. Affect. Disord. 2020, 260, 302–313. [Google Scholar] [CrossRef]
  19. Liu, W.; Liu, J.; Huang, Z.; Cui, Z.; Li, L.; Liu, W.; Qi, Z. Possible role of GLP-1 in antidepressant effects of metformin and exercise in CUMS mice. J. Affect. Disord. 2019, 246, 486–497. [Google Scholar] [CrossRef]
  20. Guo, M.; Mi, J.; Jiang, Q.M.; Xu, J.M.; Tang, Y.Y.; Tian, G.; Wang, B. Metformin may produce antidepressant effects through improvement of cognitive function among depressed patients with diabetes mellitus. Clin. Exp. Pharmacol. Physiol. 2014, 41, 650–656. [Google Scholar] [CrossRef]
  21. Nath, N.; Khan, M.; Paintlia, M.K.; Singh, I.; Hoda, M.N.; Giri, S. Metformin attenuated the autoimmune disease of the central nervous system in animal models of multiple sclerosis. J. Immunol. 2009, 182, 8005–8014. [Google Scholar] [CrossRef] [PubMed] [Green Version]
  22. Cheng, H.; Gang, X.; Liu, Y.; Wang, G.; Zhao, X.; Wang, G. Mitochondrial dysfunction plays a key role in the development of neurodegenerative diseases in diabetes. Am. J. Physiol. Endocrinol. Metab. 2020, 318, E750–E764. [Google Scholar] [CrossRef] [PubMed]
  23. Madeo, F.; Carmona-Gutierrez, D.; Hofer, S.J.; Kroemer, G. Caloric Restriction Mimetics against Age-Associated Disease: Targets, Mechanisms, and Therapeutic Potential. Cell Metab. 2019, 29, 592–610. [Google Scholar] [CrossRef] [PubMed] [Green Version]
  24. Vauzour, D.; Camprubi-Robles, M.; Miquel-Kergoat, S.; Andres-Lacueva, C.; Banati, D.; Barberger-Gateau, P.; Bowman, G.L.; Caberlotto, L.; Clarke, R.; Hogervorst, E.; et al. Nutrition for the ageing brain: Towards evidence for an optimal diet. Ageing Res. Rev. 2017, 35, 222–240. [Google Scholar] [CrossRef] [Green Version]
  25. Vaiserman, A.M.; Lushchak, O.V.; Koliada, A.K. Anti-aging pharmacology: Promises and pitfalls. Ageing Res. Rev. 2016, 31, 9–35. [Google Scholar] [CrossRef]
  26. Dong, Z.; Chen, W.; Chen, C.; Wang, H.; Cui, W.; Tan, Z.; Robinson, H.; Gao, N.; Luo, B.; Zhang, L.; et al. CUL3 Deficiency Causes Social Deficits and Anxiety-like Behaviors by Impairing Excitation-Inhibition Balance through the Promotion of Cap-Dependent Translation. Neuron 2020, 105, 475–490. [Google Scholar] [CrossRef]
  27. Wang, H.; Liu, F.; Chen, W.; Sun, X.; Cui, W.; Dong, Z.; Zhao, K.; Zhang, H.; Li, H.; Xing, G.; et al. Genetic recovery of ErbB4 in adulthood partially restores brain functions in null mice. Proc. Natl. Acad. Sci. USA 2018, 115, 13105–13110. [Google Scholar] [CrossRef] [Green Version]
  28. Zhang, W.H.; Liu, W.Z.; He, Y.; You, W.J.; Zhang, J.Y.; Xu, H.; Tian, X.L.; Li, B.M.; Mei, L.; Holmes, A.; et al. Chronic Stress Causes Projection-Specific Adaptation of Amygdala Neurons via Small-Conductance Calcium-Activated Potassium Channel Downregulation. Biol. Psychiatry 2019, 85, 812–828. [Google Scholar] [CrossRef]
  29. Sluggett, J.K.; Koponen, M.; Bell, J.S.; Taipale, H.; Tanskanen, A.; Tiihonen, J.; Uusitupa, M.; Tolppanen, A.M.; Hartikainen, S. Metformin and Risk of Alzheimer’s Disease Among Community-Dwelling People with Diabetes: A National Case-Control Study. J. Clin. Endocrinol. Metab. 2020, 105. [Google Scholar] [CrossRef]
  30. Abdallah, M.S.; Mosalam, E.M.; Zidan, A.A.; Elattar, K.S.; Zaki, S.A.; Ramadan, A.N.; Ebeid, A.M. The Antidiabetic Metformin as an Adjunct to Antidepressants in Patients with Major Depressive Disorder: A Proof-of-Concept, Randomized, Double-Blind, Placebo-Controlled Trial. Neurotherapeutics 2020. [Google Scholar] [CrossRef]
  31. Ying, M.A.; Maruschak, N.; Mansur, R.; Carvalho, A.F.; Cha, D.S.; McIntyre, R.S. Metformin: Repurposing opportunities for cognitive and mood dysfunction. CNS Neurol. Disord. Drug Targets 2014, 13, 1836–1845. [Google Scholar] [CrossRef] [PubMed]
  32. Small, S.A.; Schobel, S.A.; Buxton, R.B.; Witter, M.P.; Barnes, C.A. A pathophysiological framework of hippocampal dysfunction in ageing and disease. Nat. Rev. Neurosci. 2011, 12, 585–601. [Google Scholar] [CrossRef] [PubMed]
  33. Pilipenko, V.; Narbute, K.; Pupure, J.; Langrate, I.K.; Muceniece, R.; Klusa, V. Neuroprotective potential of antihyperglycemic drug metformin in streptozocin-induced rat model of sporadic Alzheimer’s disease. Eur. J. Pharmacol. 2020, 881, 173290. [Google Scholar] [CrossRef]
  34. Saffari, P.M.; Alijanpour, S.; Takzaree, N.; Sahebgharani, M.; Etemad-Moghadam, S.; Noorbakhsh, F.; Partoazar, A. Metformin loaded phosphatidylserine nanoliposomes improve memory deficit and reduce neuroinflammation in streptozotocin-induced Alzheimer’s disease model. Life Sci. 2020, 255, 117861. [Google Scholar] [CrossRef]
  35. Liu, B.; Huang, B.; Liu, J.; Shi, J.S. Dendrobium nobile Lindl alkaloid and metformin ameliorate cognitive dysfunction in senescence-accelerated mice via suppression of endoplasmic reticulum stress. Brain Res. 2020, 1741, 146871. [Google Scholar] [CrossRef] [PubMed]
  36. Yin, D.M.; Chen, Y.J.; Lu, Y.S.; Bean, J.C.; Sathyamurthy, A.; Shen, C.; Liu, X.; Lin, T.W.; Smith, C.A.; Xiong, W.C.; et al. Reversal of behavioral deficits and synaptic dysfunction in mice overexpressing neuregulin 1. Neuron 2013, 78, 644–657. [Google Scholar] [CrossRef] [Green Version]
  37. Oshima, R.; Yamada, M.; Kurogi, E.; Ogino, Y.; Serizawa, Y.; Tsuda, S.; Ma, X.; Egawa, T.; Hayashi, T. Evidence for organic cation transporter-mediated metformin transport and 5’-adenosine monophosphate-activated protein kinase activation in rat skeletal muscles. Metabolism 2015, 64, 296–304. [Google Scholar] [CrossRef] [PubMed] [Green Version]
  38. Chen, E.C.; Liang, X.; Yee, S.W.; Geier, E.G.; Stocker, S.L.; Chen, L.; Giacomini, K.M. Targeted disruption of organic cation transporter 3 attenuates the pharmacologic response to metformin. Mol. Pharmacol. 2015, 88, 75–83. [Google Scholar] [CrossRef] [Green Version]
  39. Segal, E.D.; Yasmeen, A.; Beauchamp, M.C.; Rosenblatt, J.; Pollak, M.; Gotlieb, W.H. Relevance of the OCT1 transporter to the antineoplastic effect of biguanides. Biochem. Biophys. Res. Commun. 2011, 414, 694–699. [Google Scholar] [CrossRef]
  40. Shang, T.; Uihlein, A.V.; Van Asten, J.; Kalyanaraman, B.; Hillard, C.J. 1-Methyl-4-phenylpyridinium accumulates in cerebellar granule neurons via organic cation transporter 3. J. Neurochem. 2003, 85, 358–367. [Google Scholar] [CrossRef]
  41. Mayer, F.P.; Schmid, D.; Owens, W.A.; Gould, G.G.; Apuschkin, M.; Kudlacek, O.; Salzer, I.; Boehm, S.; Chiba, P.; Williams, P.H.; et al. An unsuspected role for organic cation transporter 3 in the actions of amphetamine. Neuropsychopharmacology 2018, 43, 2408–2417. [Google Scholar] [CrossRef] [PubMed]
  42. Gasser, P.J.; Hurley, M.M.; Chan, J.; Pickel, V.M. Organic cation transporter 3 (OCT3) is localized to intracellular and surface membranes in select glial and neuronal cells within the basolateral amygdaloid complex of both rats and mice. Brain Struct. Funct. 2017, 222, 1913–1928. [Google Scholar] [CrossRef] [PubMed]
  43. Marinangeli, C.; Didier, S.; Ahmed, T.; Caillerez, R.; Domise, M.; Laloux, C.; Begard, S.; Carrier, S.; Colin, M.; Marchetti, P.; et al. AMP-Activated Protein Kinase Is Essential for the Maintenance of Energy Levels during Synaptic Activation. iScience 2018, 9, 1–13. [Google Scholar] [CrossRef] [PubMed] [Green Version]
  44. Yang, Y.; Atasoy, D.; Su, H.H.; Sternson, S.M. Hunger states switch a flip-flop memory circuit via a synaptic AMPK-dependent positive feedback loop. Cell 2011, 146, 992–1003. [Google Scholar] [CrossRef] [Green Version]
  45. Han, Y.; Luo, Y.; Sun, J.; Ding, Z.; Liu, J.; Yan, W.; Jian, M.; Xue, Y.; Shi, J.; Wang, J.S.; et al. AMPK Signaling in the Dorsal Hippocampus Negatively Regulates Contextual Fear Memory Formation. Neuropsychopharmacology 2016, 41, 1849–1864. [Google Scholar] [CrossRef] [Green Version]
  46. Li, W.; Chaudhari, K.; Shetty, R.; Winters, A.; Gao, X.; Hu, Z.; Ge, W.P.; Sumien, N.; Forster, M.; Liu, R.; et al. Metformin Alters Locomotor and Cognitive Function and Brain Metabolism in Normoglycemic Mice. Aging Dis. 2019, 10, 949–963. [Google Scholar] [CrossRef] [Green Version]
  47. Cardoso, S.; Moreira, P.I. Antidiabetic drugs for Alzheimer’s and Parkinson’s diseases: Repurposing insulin, metformin, and thiazolidinediones. Int. Rev. Neurobiol. 2020, 155, 37–64. [Google Scholar] [CrossRef]
  48. Zhu, X.; Shen, J.; Feng, S.; Huang, C.; Liu, Z.; Sun, Y.E.; Liu, H. Metformin improves cognition of aged mice by promoting cerebral angiogenesis and neurogenesis. Aging (Albany NY) 2020, 12. [Google Scholar] [CrossRef]
  49. Chen, X.; Levy, J.M.; Hou, A.; Winters, C.; Azzam, R.; Sousa, A.A.; Leapman, R.D.; Nicoll, R.A.; Reese, T.S. PSD-95 family MAGUKs are essential for anchoring AMPA and NMDA receptor complexes at the postsynaptic density. Proc. Natl. Acad. Sci. USA 2015, 112, E6983–E6992. [Google Scholar] [CrossRef] [Green Version]
Figure 1. Increased excitability transmission in metformin (Met)-treated hippocampal slices. (A) Representative traces showing miniature excitatory postsynaptic current (mEPSC) in CA1 pyramidal neurons incubated with 0, 1, 10 μM Met. Scale bar = 5 s, 10 pA. (B) Increased mEPSC frequency of pyramidal neurons in Met-treated hippocampal slices. n = 12–13 neurons from four mice per group. F(2,35) = 14.53, p < 0.0001; control (1.51 ± 0.11 Hz) versus 1 μM Met (2.27 ± 0.17 Hz), p = 0.0011; control (1.51 ± 0.11 Hz) versus 10 μM Met (2.53 ± 0.13 Hz), p < 0.0001; 1 μM Met (2.27 ± 0.17 Hz) versus 10 μM Met (2.53 ± 0.13 Hz), p = 0.4090; one-way ANOVA followed by Tukey’s post hoc test. (C) Cumulative probability curves for mEPSC inter-event interval. Control versus 1 μM Met, p = 0.0324; control versus 10 μM Met, p = 0.0003; 1 μM Met versus 10 μM Met, p = 0.1744; Kolmogorov–Smirnov test. (D) No difference in mEPSC amplitude of pyramidal neurons among groups. n = 12–13 neurons from four mice per group. F(2,35) = 0.0475, p = 0.9537; control (16.06 ± 0.44 pA) versus 1 μM Met (15.91 ± 0.41 pA), p = 0.9817; control (16.06 ± 0.44 pA) versus 10 μM Met (16.16 ± 0.83 pA), p = 0.9912; 1 μM Met (15.91 ± 0.41 pA) versus 10 μM Met (16.16 ± 0.83 pA), p = 0.9499; one-way ANOVA followed by Tukey’s post hoc test. (E) Cumulative probability curves for mEPSC amplitude. Control versus 1 μM Met, p = 0.7307; control versus 10 μM Met, p = 0.9998; 1 μM Met versus 10 μM Met, p = 0.9844; Kolmogorov–Smirnov test. (F) There was no difference in rest membrane potential (RMP), membrane capacitance and input resistance of pyramidal neurons between the control and Met treatment group; n = 12 ~ 13 neurons from three mice per group. Data are presented as mean ± SEM. ** p < 0.01, *** p < 0.001.
Brainsci 10 00706 g001
Figure 2. Inhibitory transmission was not altered in Met-treated hippocampal slices. (A) Representative traces showing miniature inhibitory postsynaptic currents (mIPSCs) in CA1 pyramidal neurons incubated with 0, 1 and 10 μM Met. Scale bar = 1 s, 10 pA. (B) No difference in mIPSC frequency of pyramidal neurons among groups. n = 17–18 neurons from four mice per group. F(2,49) = 1.085, p = 0.3458, control (8.12 ± 0.51 Hz) versus 1 μM Met (8.86 ± 0.57 Hz), p = 0.6155; control (8.12 ± 0.51 Hz) versus 10 μM Met (9.28 ± 0.60 Hz), p =0.3220; 1 μM Met (8.86 ± 0.57 Hz) versus 10 μM Met (9.28 ± 0.60 Hz), p = 0.8569; one-way ANOVA followed by Tukey’s post hoc test. (C) Cumulative probability curves for mIPSC inter-event interval. Control versus 1 μM Met, p = 0.9206; control versus 10 μM Met, p = 0.5886; 1 μM Met versus 10 μM Met, p = 0.9898; Kolmogorov–Smirnov test. (D) No difference in mIPSC amplitude of pyramidal neurons among groups. n = 17–18 neurons from four mice per group. F(2,49) = 0.1204, p = 0.8869, control (27.29 ± 1.70 pA) versus 1 μM Met (28.43 ± 1.67 pA), p = 0.8921; control (27.29 ± 1.70 Hz) versus 10 μM Met (28.28 ± 1.99 pA), p = 0.9206; 1 μM Met (28.43 ± 1.67 pA) versus 10 μM Met (28.28 ± 1.99 pA), p = 0.9978; one-way ANOVA followed by Tukey’s post hoc test. (E) Cumulative probability curves for mIPSC amplitude. Control versus 1 μM Met, p = 0.7453; control versus 10 μM Met, p = 0.5562; 1 μM Met versus 10 μM Met, p > 0.9999; Kolmogorov–Smirnov test. Data are presented as mean ± SEM.
Brainsci 10 00706 g002
Figure 3. Met increases glutamate release in CA1 hippocampal pyramidal neurons. (A) Representative traces of pair-pulse stimulation. Scale bar = 25 ms, 50 pA. (B) Paired-pulse responses (PPRs) plotted against inter-stimulate intervals. n = 9–11 neurons from three mice per group. Drug treatment: control versus 1 μM Met, F(1,51) = 15.54, p = 0.0002; control versus 10 μM Met, F(1,57) = 10.72, p = 0.0018; 1 μM Met versus 10 μM Met, F(1,54) = 0.4391, p = 0.5104; two-way ANOVA followed by Bonferroni’s post hoc test. Data are presented as mean ± SEM, ** p < 0.01, *** p < 0.001.
Brainsci 10 00706 g003
Figure 4. Met does not affect neuronal excitability in CA1 hippocampal pyramidal neurons. (A) Representative traces of spikes evoked by injecting 200 pA depolarizing currents. Scale bar = 200 ms, 30 mV. (B) Firing rate plotted against increasing injected depolarizing currents. Control, n = 14 neurons/4 mice; 1 μM Met, n = 15 neurons/5 mice; 10 μM Met, n = 16 neurons/5 mice; F(2,252) = 0.5951, p = 0.5523; two-way ANOVA. (C) Comparisons of the curve slope in B. F(2,42) = 0.1984, p = 0.8208, control (0.092 ± 0.005) versus 1 μM Met (0.097 ± 0.005), p = 0.8278; control (0.092 ± 0.005) versus 10 μM Met (0.096 ± 0.008), p = 0.8704; 1 μM Met (0.097 ± 0.005) versus 10 μM Met (0.096 ± 0.008), p = 0.9950; one-way ANOVA followed by Tukey’s post hoc test. Data are presented as mean ± SEM.
Brainsci 10 00706 g004

