Article

Towards Bimodal Optical Monitoring of Photodynamic Therapy with Targeted Nanoconstructs: A Phantom Study

1
Institute of Applied Physics of the Russian Academy of Science, 603950 Nizhny Novgorod, Russia
2
Wellman Center for Photomedicine, Massachusetts General Hospital, Harvard Medical School, Boston, MA 02114, USA
3
Department of Biomedical Engineering, Tufts University, Medford, MA 02155, USA
*
Author to whom correspondence should be addressed.
Appl. Sci. 2019, 9(9), 1918; https://doi.org/10.3390/app9091918
Submission received: 4 April 2019 / Revised: 5 May 2019 / Accepted: 7 May 2019 / Published: 10 May 2019

Abstract

:
Increase of the efficiency of photodynamic therapy (PDT) requires the development of advanced protocols employing both novel photosensitizer (PS) carriers and aids for online monitoring. Nanoconstructs may be comprised of a photosensitizer, chemotherapy drugs, or inhibitors of molecular pathways that support cancer growth. In this paper, we analyze the efficiency of a bimodal approach involving fluorescence and optoacoustic imaging in monitoring drug distribution and photobleaching. The study evaluates typical sensitivities of these techniques to the presence of the two key moieties of a nanoconstruct: benzoporphyrin derivatives (BPD) serving as a PS, and IRDye800 acting as a contrast agent. Both imaging modalities employ dual-wavelength probing at the wavelengths corresponding to absorption peaks of BPD and IRDye800, which enables their separate detection. In an experiment on a tissue-mimicking phantom with inclusions containing separate BPD and IRDye800 solutions, fluorescence imaging demonstrated higher contrast as compared to optoacoustic imaging for both components, though strong light scattering in the surrounding media restricted accurate localization of the markers. It was also sensitive to photobleaching, which is a measure of PDT efficiency. Optoacoustic imaging demonstrated sufficient sensitivity to both components, though less than that of fluorescence imaging, however, it enabled depth-resolved detection of an absorber and estimation of its relative content. Employment of the bimodal approach in monitoring of PS photobleaching adds to its potential in intraprocedural PDT monitoring.

1. Introduction

Photodynamic therapy (PDT) is a modern treatment modality based on launching a photodynamic reaction in a tumor with accumulated photosensitizer upon light irradiation [1,2]. PDT has additional benefits when tumor localization does not allow for radical resection, which is usually accompanied by significant damage to the surrounding, functionally important normal tissues. In particular, this aspect is essential for peritumoral areas of glioblastoma, when damage to normal brain areas may lead to a patient disability, while incomplete tumor treatment raises the risk of a tumor recurrence [3].
Increase in the efficiency of PDT treatment requires the development of protocols for a PDT procedure employing aids for both controlling the delivery of a PS to the tumor area, and monitoring the photodynamic reaction during light irradiation.
Optical imaging techniques demonstrate high potential for noninvasive monitoring of PS accumulation and photobleaching in the course of a PDT procedure [4]. Since PSs typically exhibit strong fluorescence, fluorescence imaging techniques are usually employed for non-invasive PS distribution monitoring [5,6,7,8,9], while decrease of fluorescence signal as a result of light irradiation indicates efficient photodynamic reaction [5,10]. Benefits of fluorescence imaging (FL) include high sensitivity due to low far-red autofluorescence, and relative simplicity of hardware implementation. On the other hand, FL does not allow for depth-resolved visualization, while multiple scattering leads to image blurring [11]. In this respect, complementary application of an auxiliary depth-resolving imaging modality can provide additional information on drug localization.
Targeted nanoconstructs are a modern type of PS carrier that combine the drug itself with additional complexes, ensuring targeted delivery, and contrasting agents, providing high sensitivity for monitoring techniques. Employment of benzoporphyrin derivative (BPD), a clinically approved photosensitizer, as a component of a nanoconstruct can significantly enhance the efficiency of photodynamic therapy against cancer cells, due to the red-shifted absorption peak (λex = 690 nm), fast accumulation, and rapid excretion [12,13,14]. However, the excitation spectral band in the visible range and relatively low fluorescence quantum yield of BPD [15] limit the abilities of fluorescence imaging at large depths. This aspect requires the introduction of an additional contrasting agent as a component of a nanoconstruct. Infrared fluorescence marker IRDye800 is a potential candidate for complementary use with BPD in nanoconstructs, owing to its higher fluorescence brightness and the excitation spectrum shifted to the near-IR spectral range [16].
Optoacoustic imaging [17] has high potential as a complementary technique for localizing PS accumulation due to the absorption-based contrast, the in-depth resolution, and relatively high imaging depth [18]. A spectral approach in optoacoustics, allowing for tuning of the probing wavelength to the absorption maxima of the employed contrast agent provides high imaging sensitivity. In the case that the nanoconstruct contains a contrast agent in addition to the PS, dual-wavelength optoacoustic imaging can provide an additional benefit of complementarily localizing both dyes. Moreover, as mentioned above, the absorption band of IRDye800 is shifted to the IR range with respect to the absorption band of BPD, which provides deeper probing of IRDye800–labeled objects compared to those labeled with BPD.
A previous study demonstrated the efficacy of complementary application of FL and OA in monitoring targeted nanoconstructs in frames of numerical Monte Carlo simulations [19]. This paper presents the next step in the study of this bimodal monitoring approach, demonstrating its efficiency in a phantom study where the BPD and IRDye800-containing inclusions embedded in a biotissue mimicking phantom are imaged by both FL and OA modalities and the potentiality of joint use of these techniques is estimated.

2. Materials and Methods

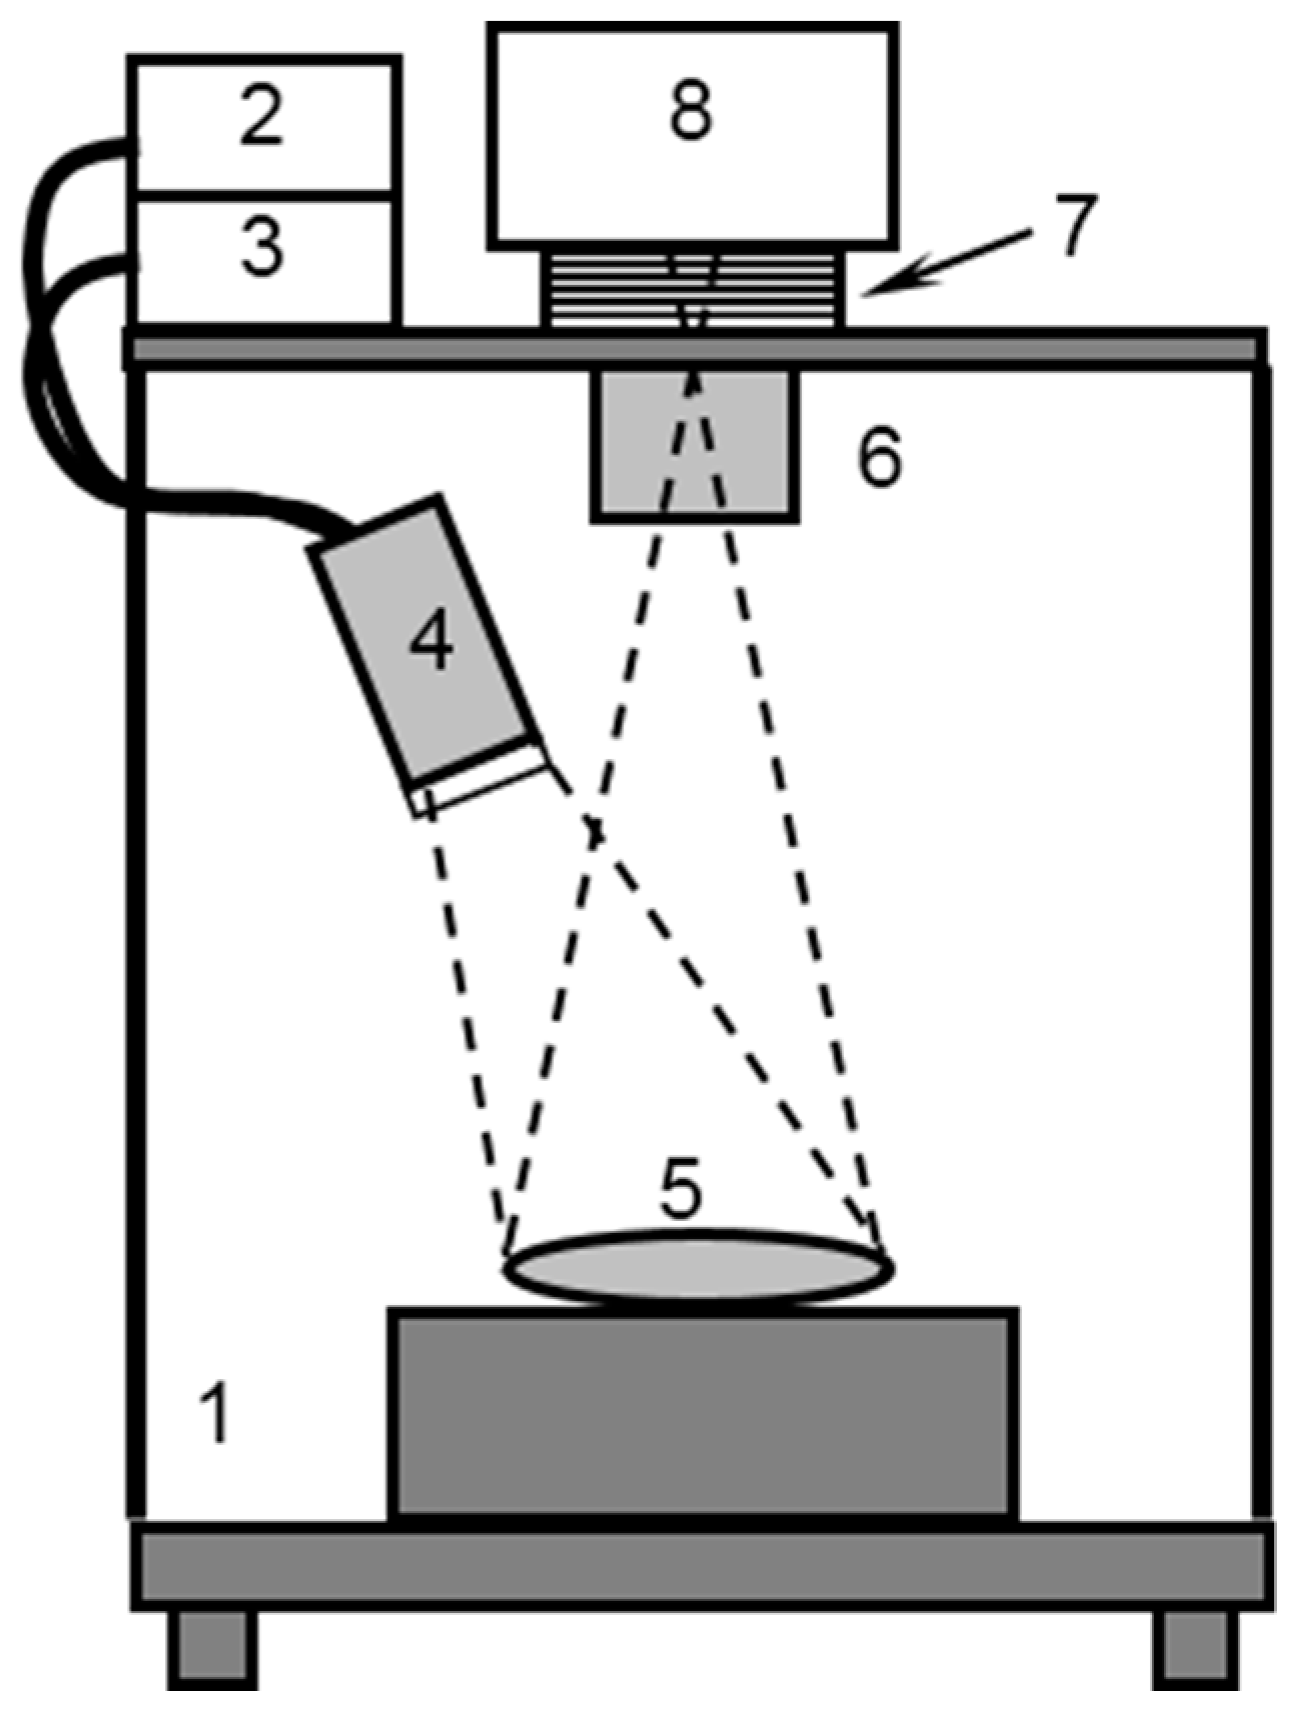
2.1. Fluorescence Imaging Setup Combined with the Irradiation Module

The custom-made fluorescence imaging setup employed in the study (Figure 1) included a CCD camera, a filter wheel, and an illumination system adapted for nanoconstruct components (both IRDye800 and BPD dyes). Normalized absorption and emission spectra of both dyes [19] are presented in Figure 2. The illumination system consisted of two compact diode laser modules with a fiber output (Hicurtec, Russia) at the wavelengths of 690 and 785 nm, corresponding to the absorption bands of BPD and IRDye800, respectively. Due to the possibility of tuning the power of the laser source at λ = 690 nm to a wide range (up to 0.75 W), it could also be employed as a source of irradiation in course of the PDT procedure. Collimating lenses and optical homogenizers (Thorlabs, USA) were used to provide a uniform illumination at the object surface. The cooled CCD camera ATIK314L+ (Artemis CCD Ltd., UK) with the motorized filter wheel FLI (USA) and Sigma lens (focal length: 28 mm; f/1.8) was employed for fluorescence detection. The 725/40 and 835/70 filters (Semrock, USA) were used for emission detection and cutting off the excitation radiation of the laser diodes for BPD and IRDye800 sensing, respectively. The CCD camera, filter wheel, and laser sources were controlled by a PC. A dark frame subtraction was performed prior to fluorescent signal calculations.

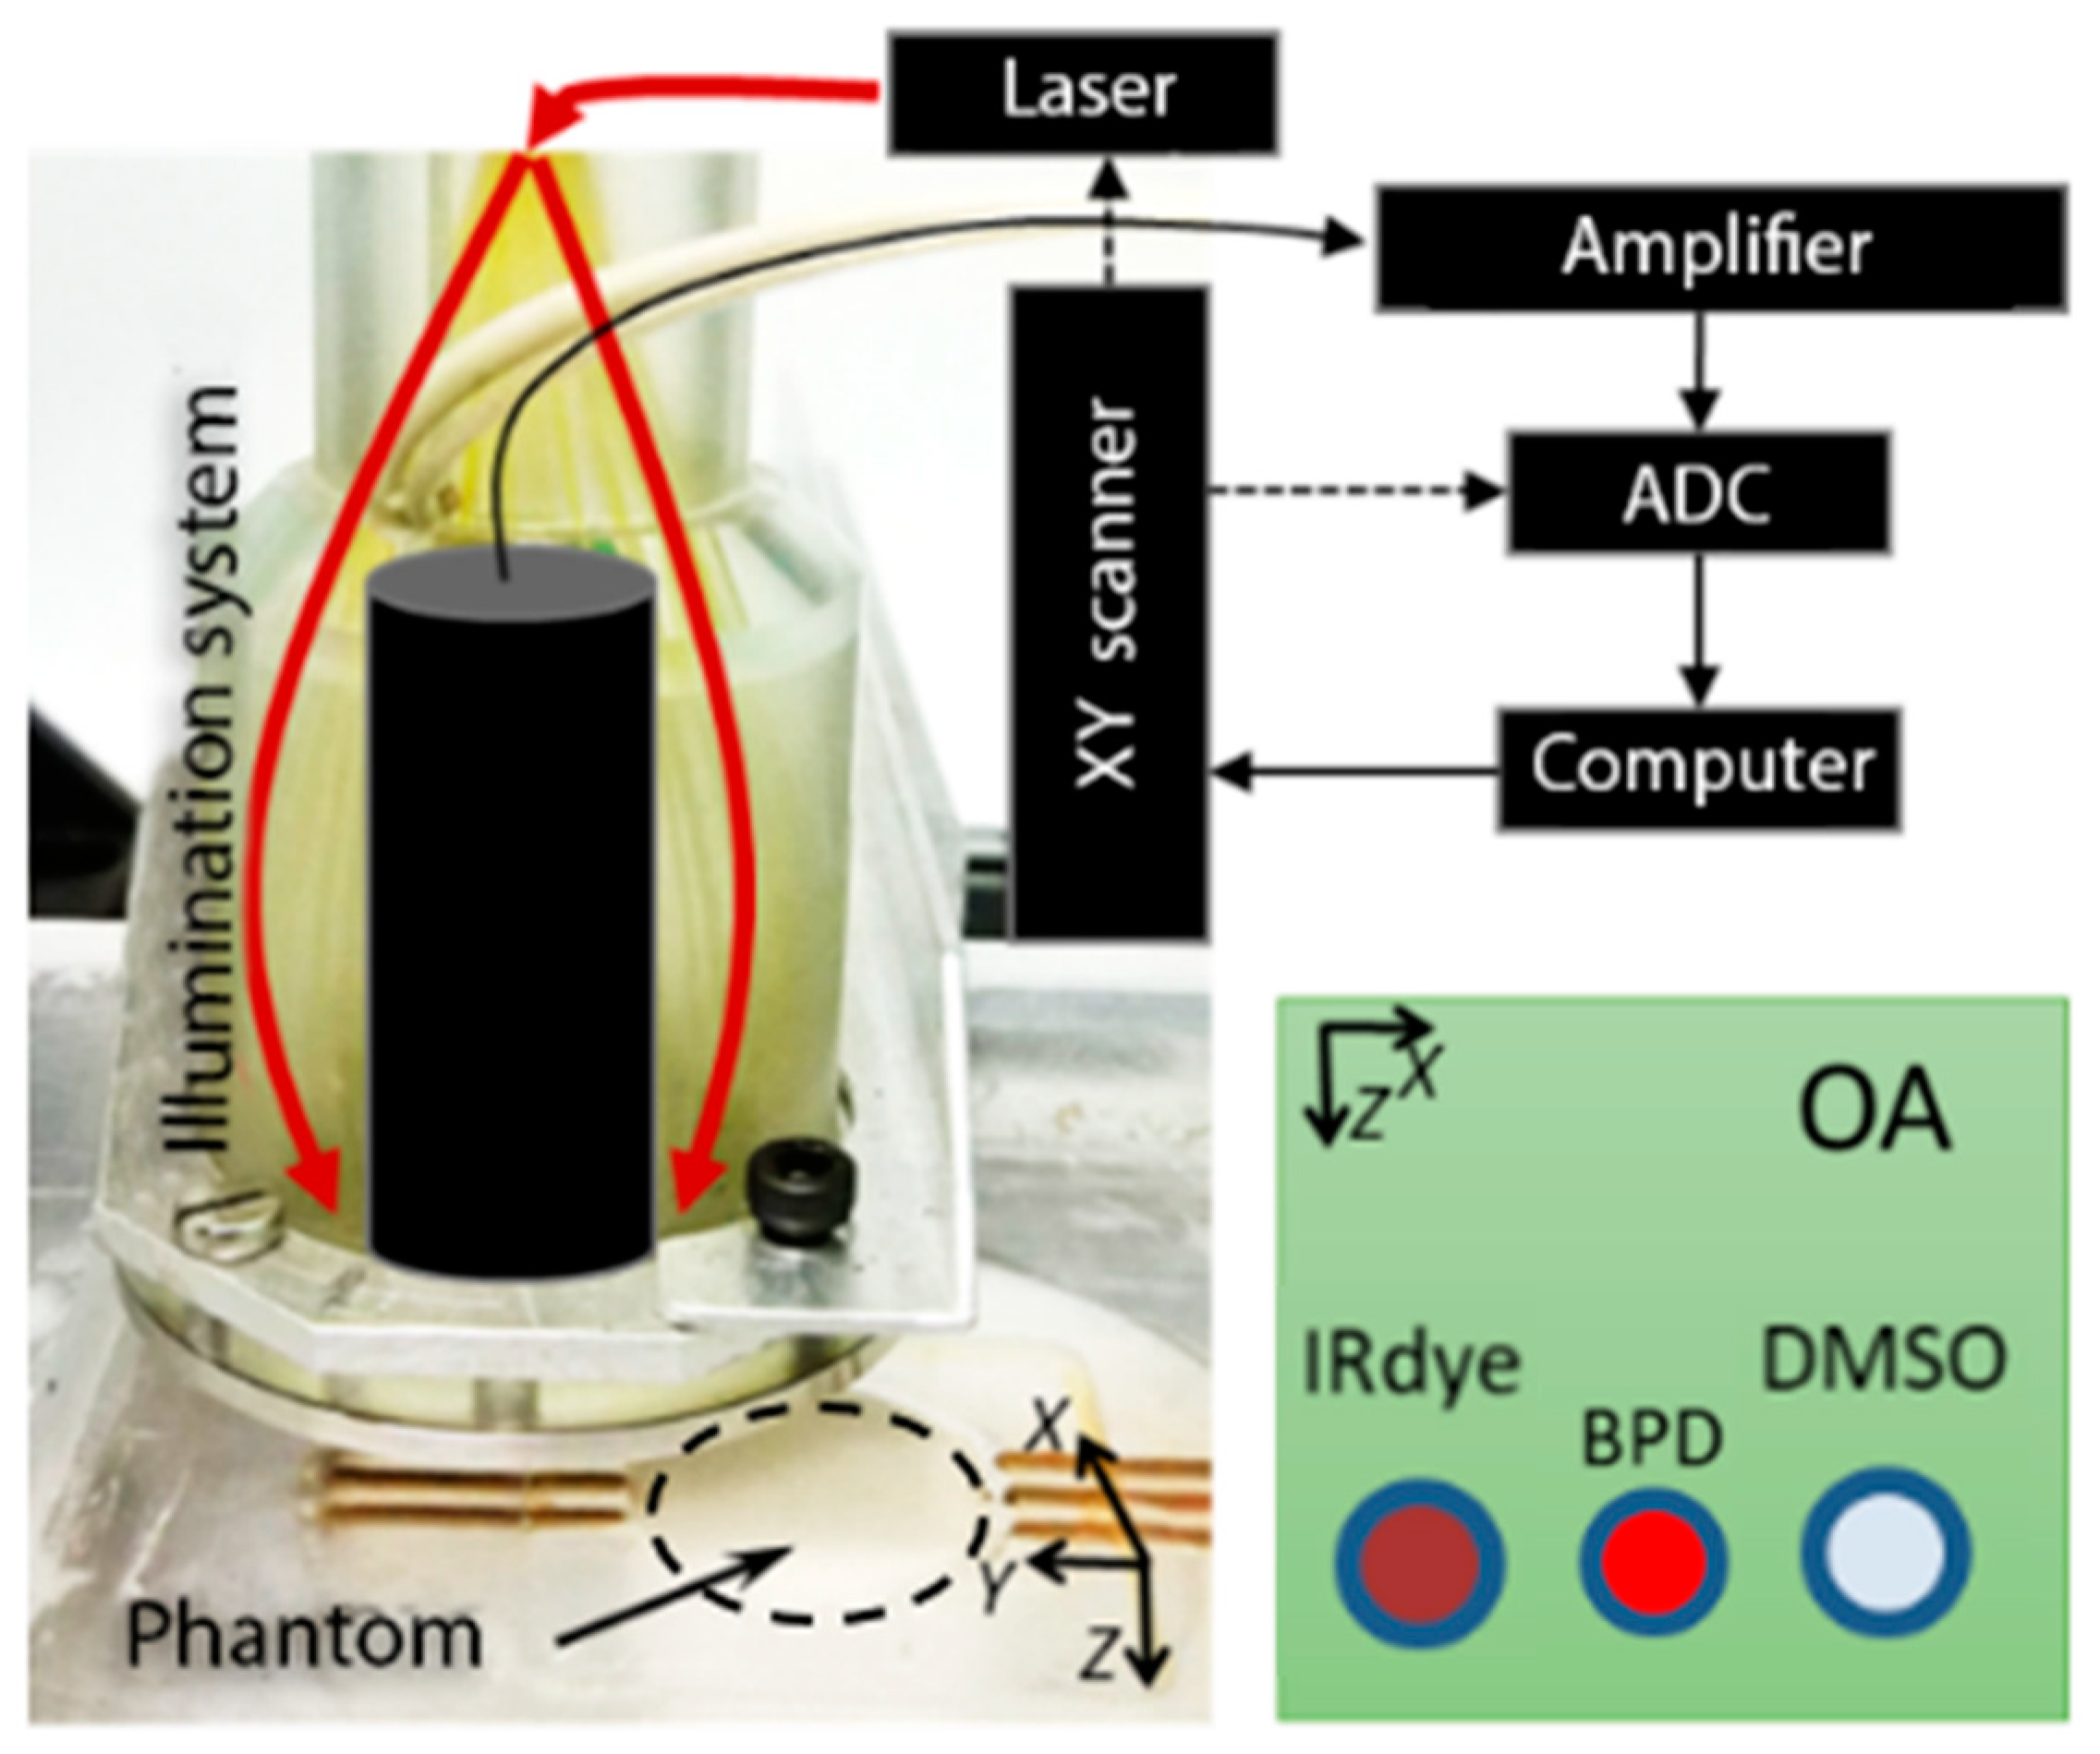
2.2. Optoacoustic (OA) Imaging Setup
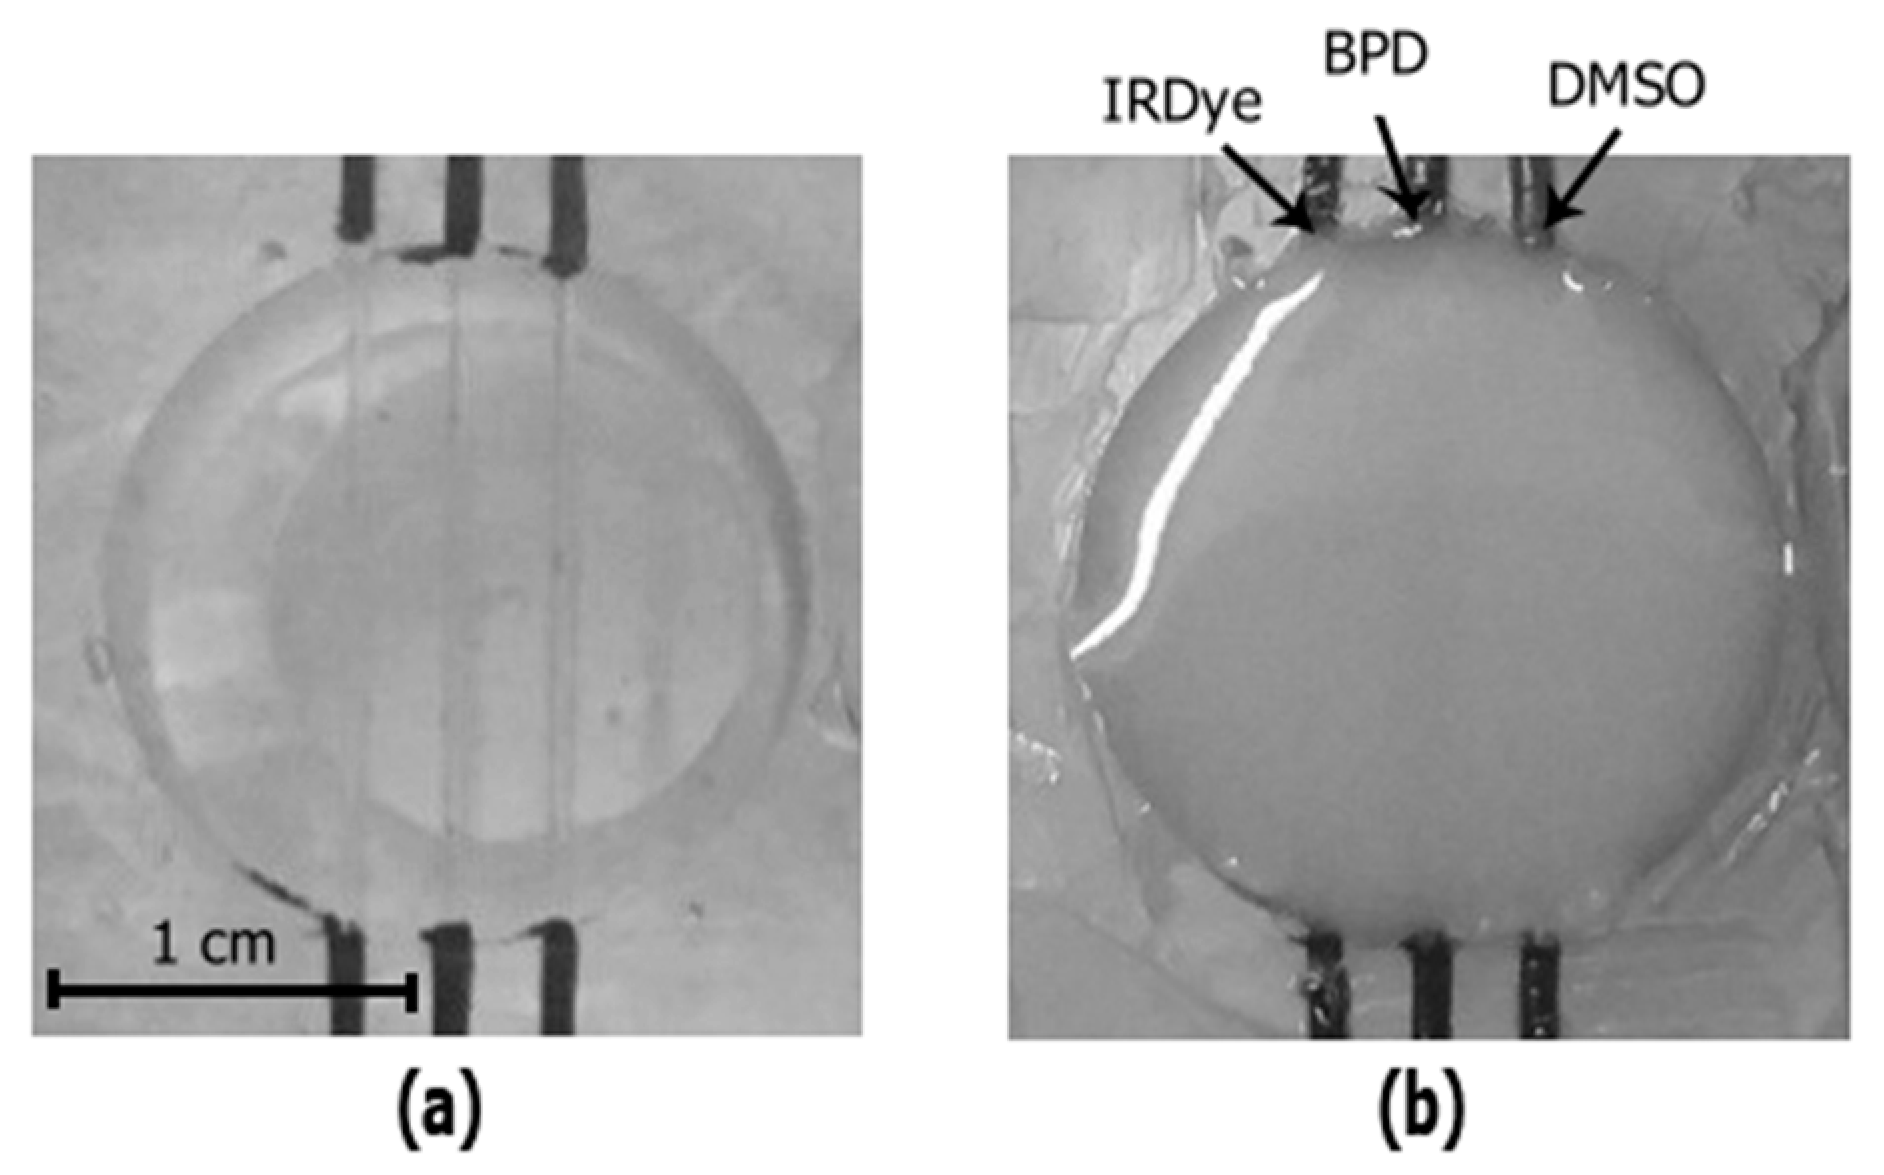
The OA imaging setup (Figure 3) employed the concept of dark-field acoustic resolution photoacoustic microscopy (AR-PAM) [20], where the scanning OA head is represented by a conical fiber-optic illumination system (CeramOptec, Germany) combined with a spherically focused acoustic detector made of a polyvinylidene difluoride (PVDF) piezo film with a 25 μm thickness (IAP RAS, Russia) [21]. The ultrasound antenna with a numerical aperture of 0.6 and a receiving band of 35 MHz provided a spatial resolution of 40 μm at a probing depth of up to 3 mm. For probing, a tunable 2214PC laser (LOTIS-TII, Belarus) with a wavelength range of 410–2100 nm, pulse duration of 18 ns, and pulse repetition rate of 10 Hz was used. OA imaging was performed at the probing wavelengths of 690 nm and 785 nm, corresponding to the optical absorption peaks of BPD and IRDye800. Scanning was performed by two M-664 one dimensional positioning stages (PIMicos, Germany). OA A-scans from individual laser pulses were digitized by a 16 bit ADC Razor 16 (GaGe, USA) with a 200 MHz sampling rate. Raw OA A-scans were processed using a digital 50MHz low-pass filter, and the resulting raw OA B-scans were reconstructed based on the synthetic aperture technique [22].

2.3. Phantom Design

A solid phantom mimicking the optical properties of murine brain tissue at the probing and detection wavelengths (690, 785, 720, and 835 nm) was employed in the study. The bulk of the phantom was designed as a mixture of 2.2 g of agar and 75 ml of water, which was heated up to 70 °C at the first stage. At the next step, the solution was cooled down to 36 °C and was mixed up with 40 ml of 20% Lipofundin MST/LST (Braun, Germany) and 0.5 µL of black ink (Koh-i-Noor, Czech Republic). The agar mixture was poured into the special cuvette with three transparent plastic tubes with an internal diameter of 400 µm (Figure 4), and cooled to the room temperature until solid. The cylinder-shaped cuvette was 20 mm in diameter and 20 mm in the Z-direction. After the mixture hardening, the three tubes within the phantom were filled, correspondingly, with DMSO solution of IRDye800 (LI-COR, USA) at a concentration of 178 µmol/L, DMSO solution of BPD (USP, USA) at a concentration of 634 µmol/L, and pure DMSO (Paneco Ltd., Russia), used as a reference. According to [23,24] the selected concentrations of BPD and IRDye800 were below the toxic threshold in animals.
The tube embedding depth in the phantom was about 1 mm. To localize the position of the tubes with respect to the entire phantom, bimodal imaging of the tubes filled with solutions of IRDye800, BPD, and DMSO was also performed prior to agar mixture pouring. Figure 3 shows the photos of the phantom filled with water (Figure 4a) and with agar mixture (Figure 4b). Preparation of tissue mimicking phantoms, their characterization, and comparison with real biotissues are described in details in previous papers [8,25,26]. Optical properties of the employed agar mixture and their comparison to the values for murine brain ex vivo are summarized in Table 1. Here, µa is the absorption coefficient and µs’ = µs(1−g) is the reduced scattering coefficient, where µs is the scattering coefficient and g is the scattering anisotropy factor.

2.4. Numerical Simulations

The shape of the fluorescence image of an object within a scattering medium registered by a CCD camera is determined by both the lateral size of the fluorescent volume, and its embedding depth. The full width at half maximum (FWHM) of the fluorescence map potentially allows evaluation of these characteristics. Our previous Monte Carlo study [19] considering the spherical shape of a model tumor labeled with nanoconstructs demonstrated that from the FWHM of the fluorescence response, one can estimate the tumor size using the information about tumor localization depth obtained from OA measurements. In this study, previously developed MATLAB-based Monte Carlo code was modified to simulate fluorescence images of the scattering phantom containing cylindrical tubes filled with fluorescence markers.
The Monte Carlo procedure for simulation of a fluorescence image consists of two steps. At the first step, the Monte Carlo technique is employed to produce a map of the probing radiation partial absorption by the fluorophore. A three-dimensional map of the fluorophore distribution in the medium is predefined. In the voxels containing the fluorophore, the local optical properties (absorption and scattering coefficients) are calculated as the sums of the partial optical properties of the bulk medium (phantom) and the fluorophore. At the second step, the fluorophore partial absorption map serves as a distributed source for Monte Carlo simulations of the fluorescence emission at the corresponding wavelength. Emission of fluorescence photons is considered to be spherically isotropic in direction. Distribution of fluorescence intensity at the medium surface represents a fluorescence image recorded by a CCD camera. Typical number of probing radiation photons employed in simulation amounts to 108.
To simulate the OA image of the BPD-containing tube inside the phantom, the Monte Carlo derived absorption map was used for calculating the acoustic response on the basis of K-wave toolbox [27] for MATLAB. In the OA numerical experiment, acoustic signals from BPD serving as an absorber were recorded by the arc detector with a focal distance R = 6.7 mm and numerical aperture NA = 0.6 focused at the object surface. The scanning step Δx = 50 μm was chosen in accordance with the geometry of the OA phantom experiment. The simulations were performed on the spatial–temporal grid Δx = Δz = 50 μm (full area 12 mm × 12.7 mm) and Δt = 5 ns (full time range is 8 μs), corresponding to the maximum supported frequency, 15 MHz.

3. Results

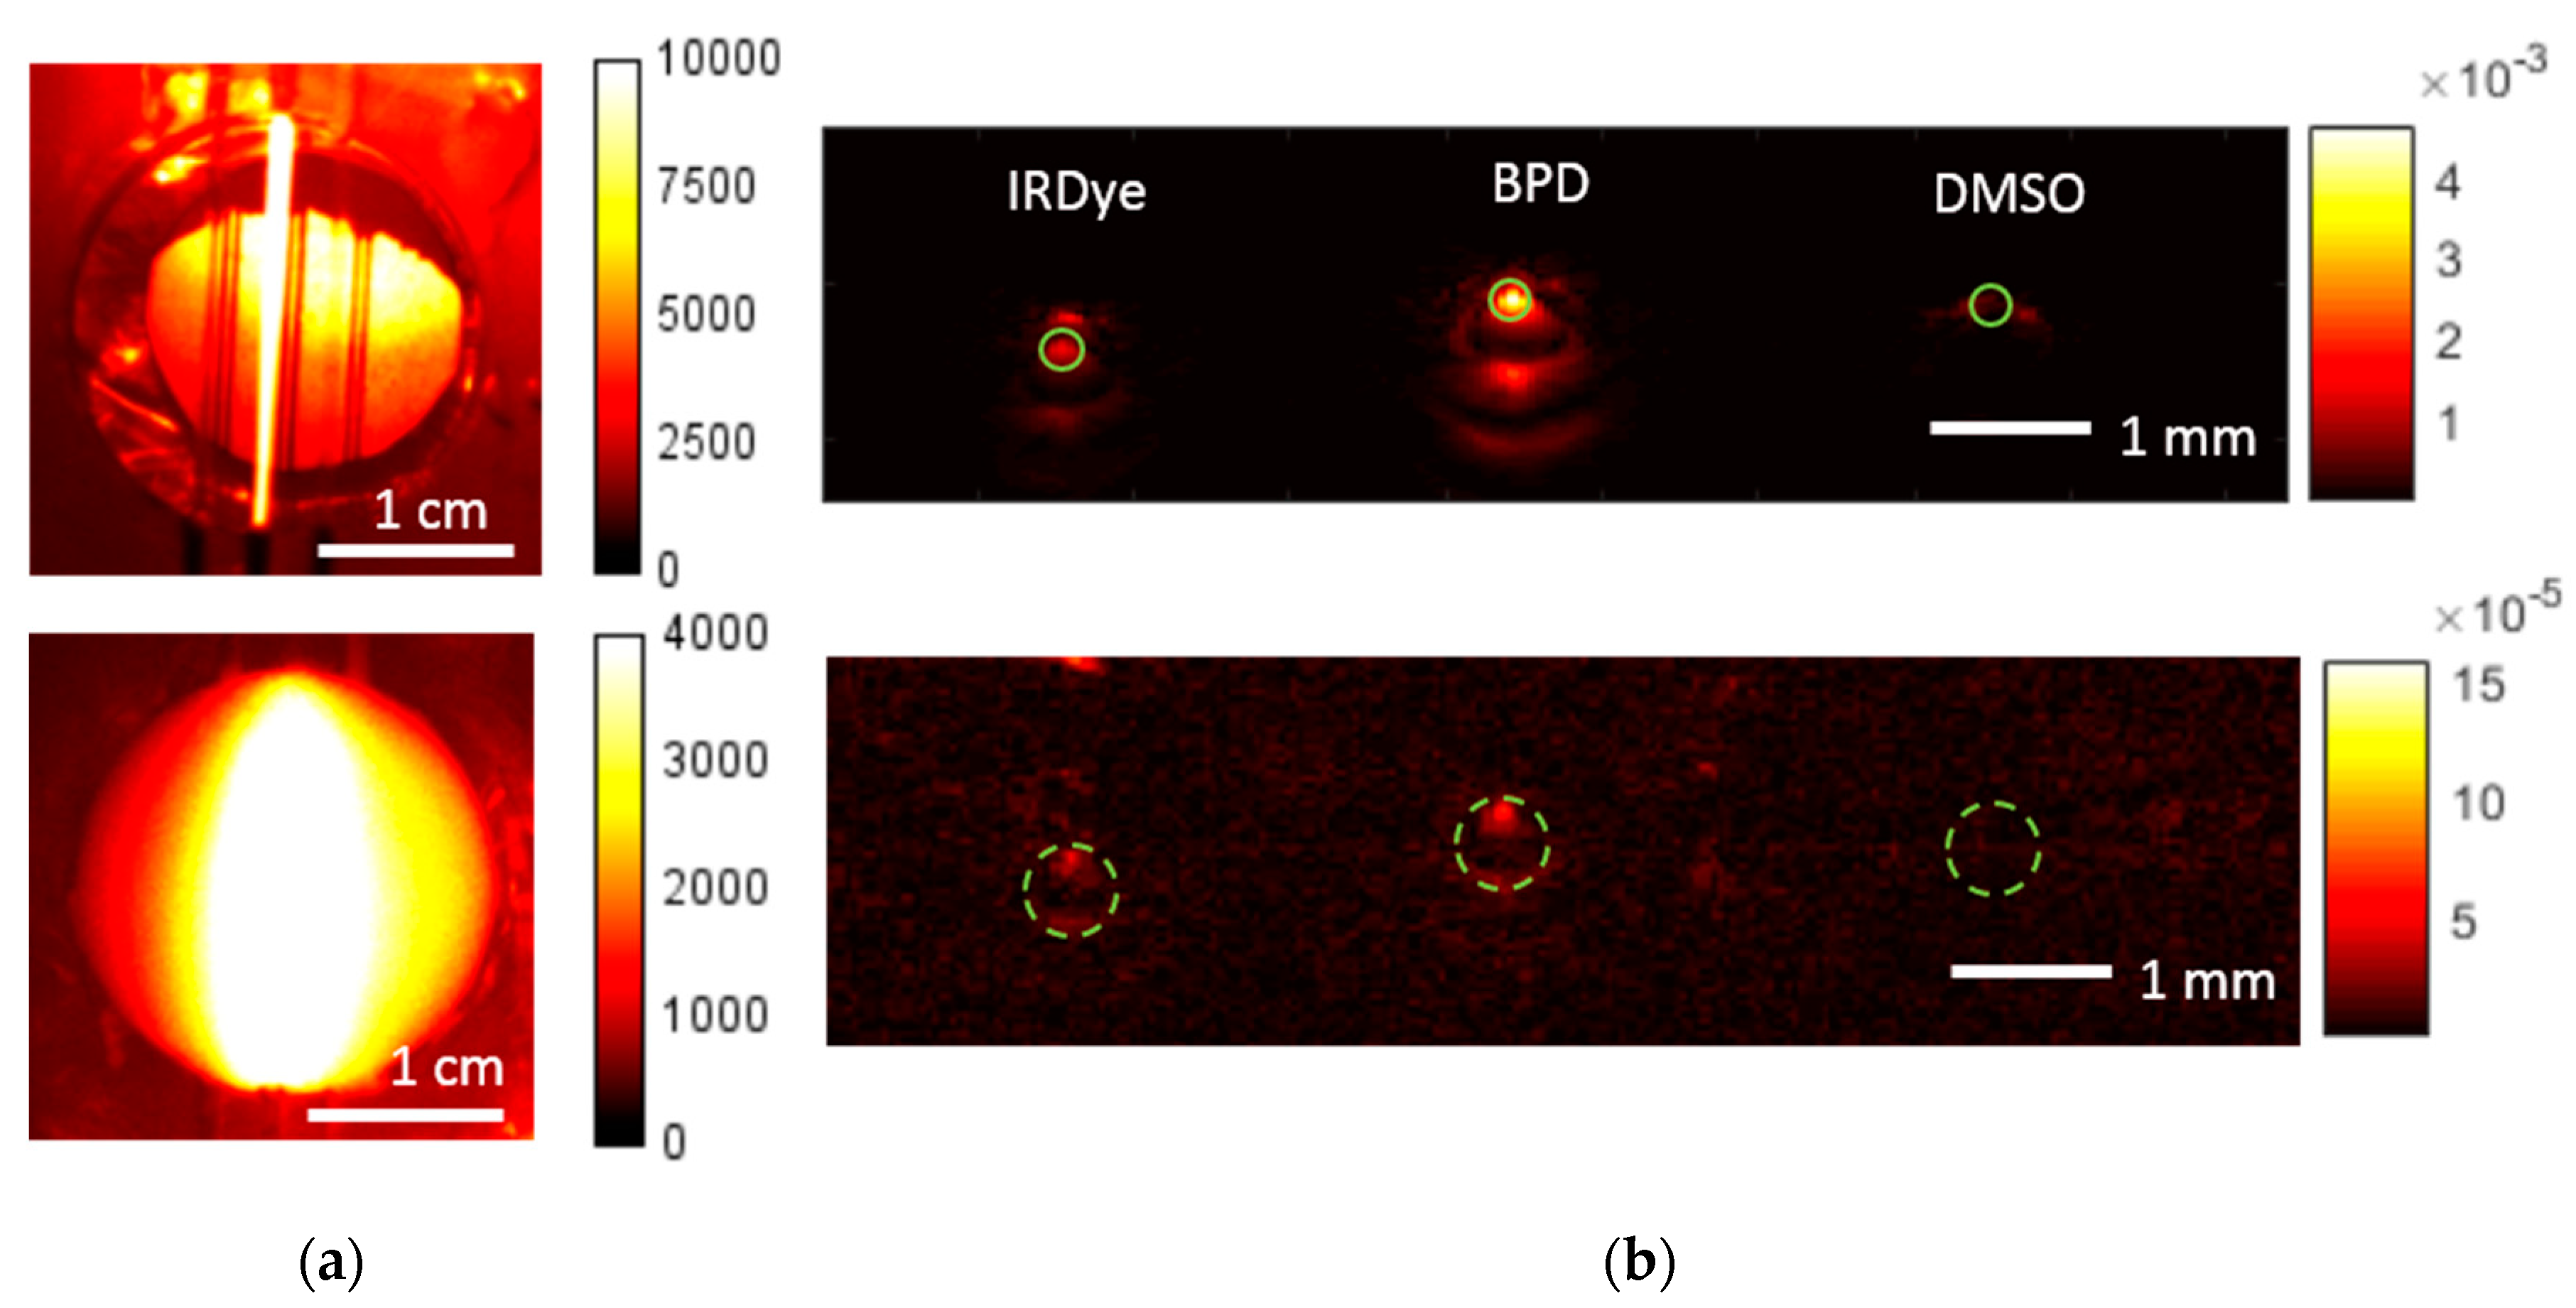
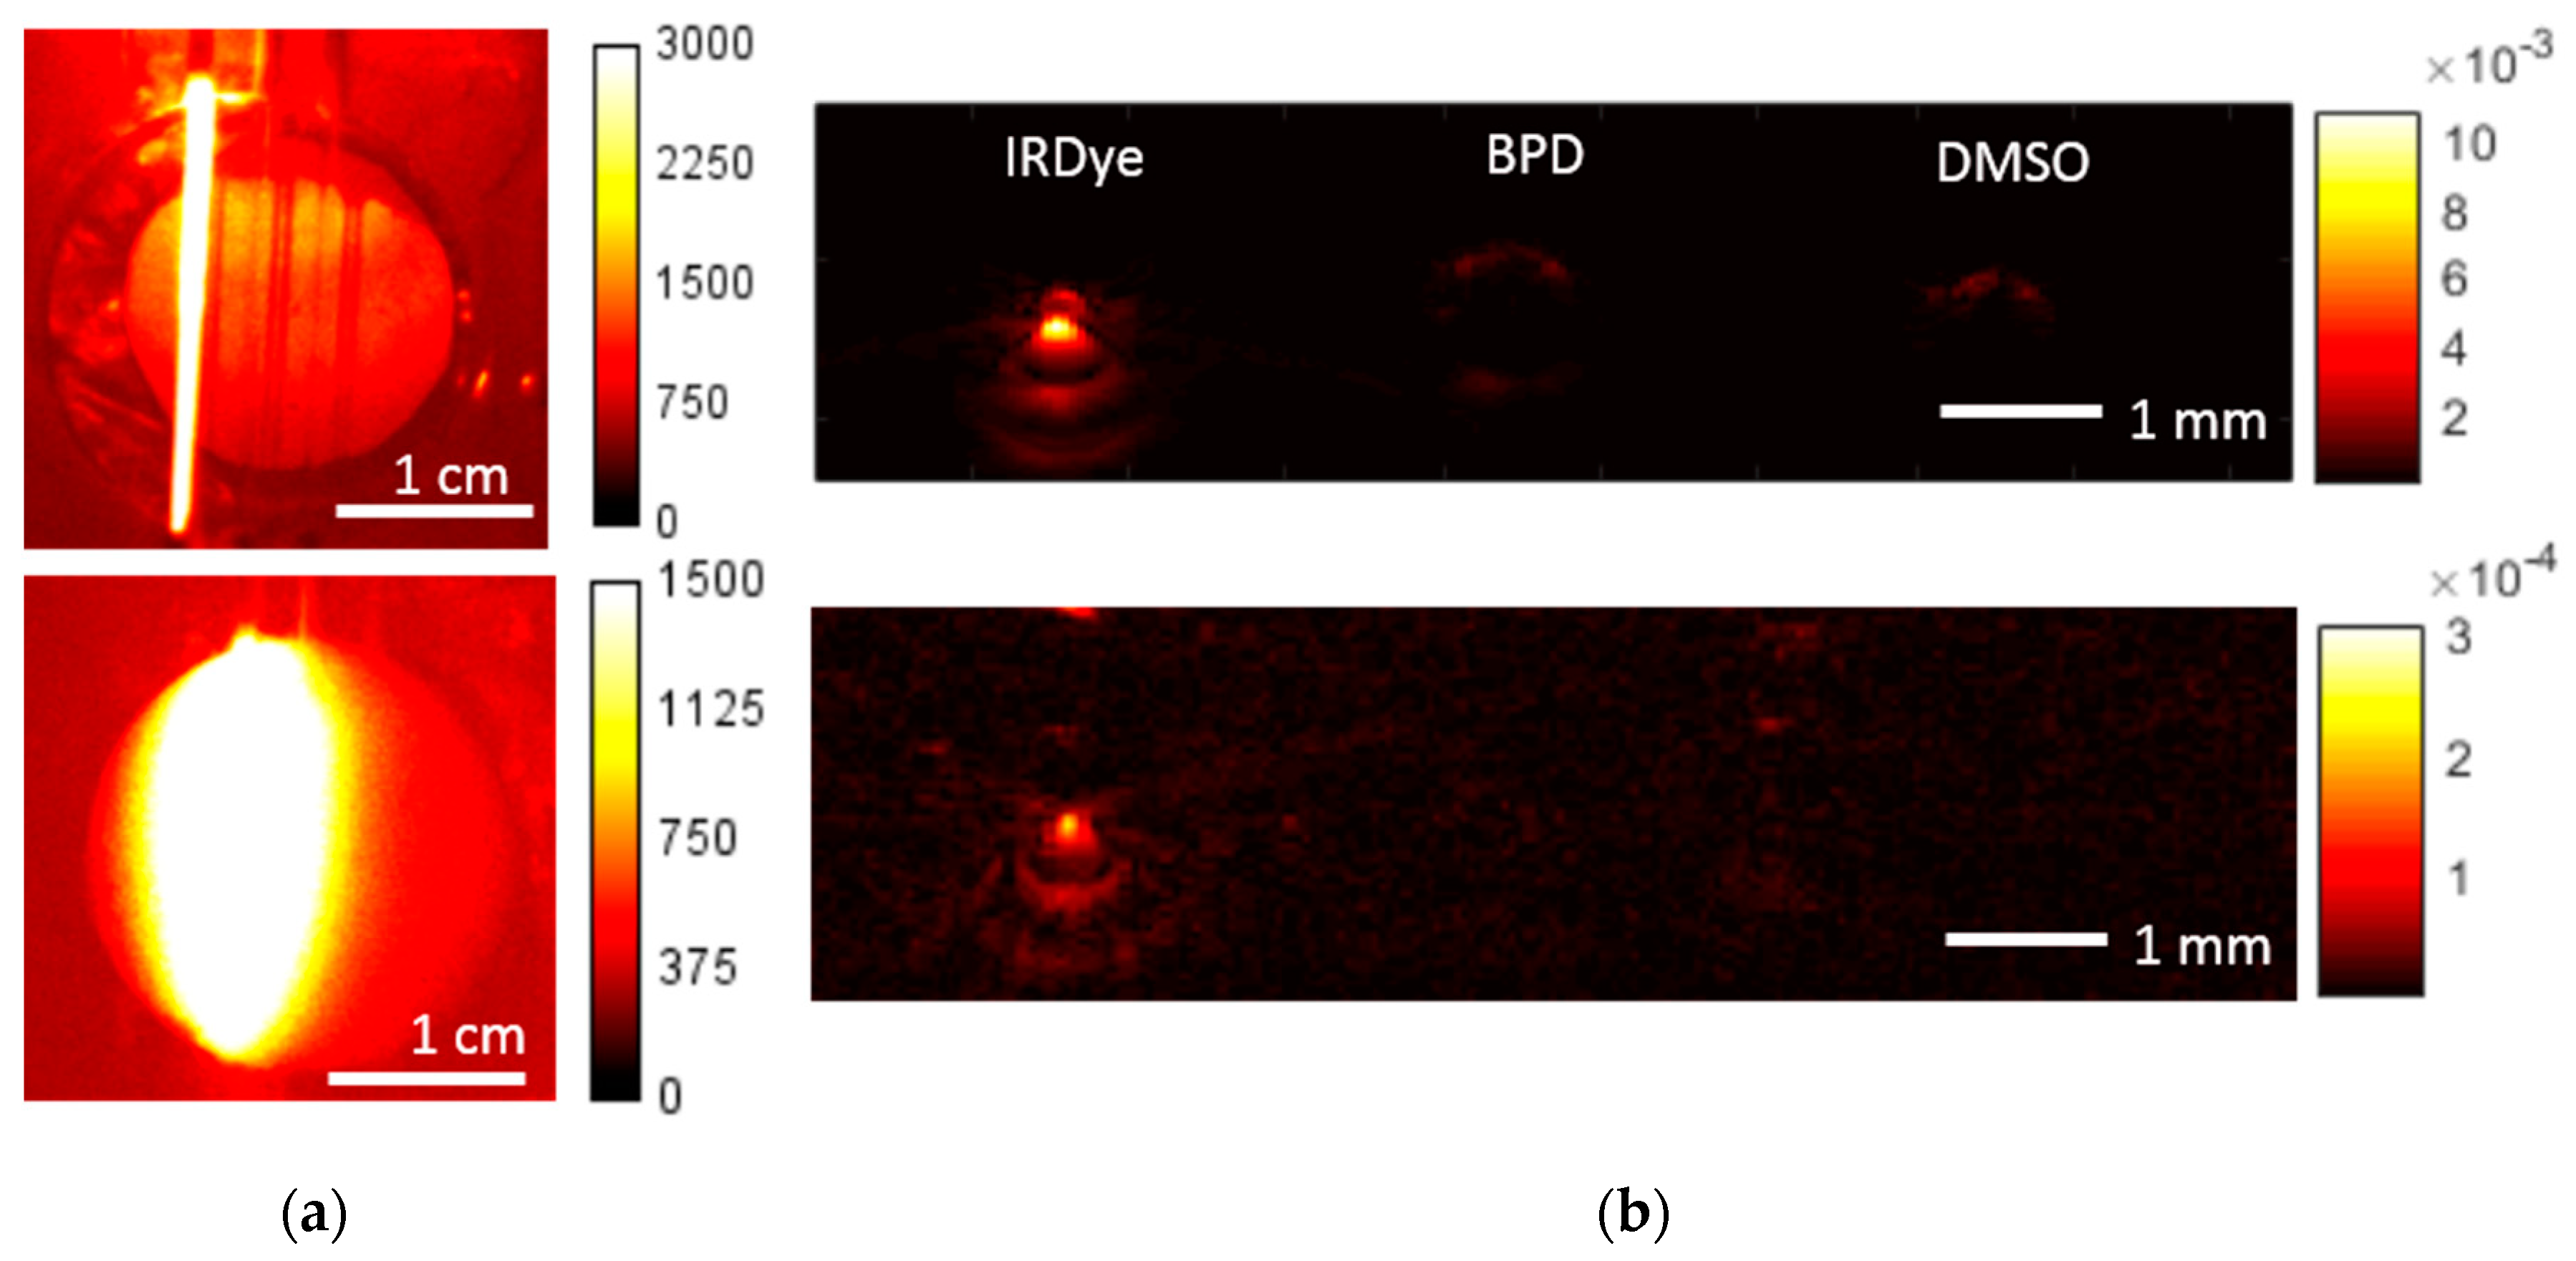
3.1. Fluorescence and Optoacoustic Imaging

Figure 5 demonstrates FL and OA images of the phantom, obtained consequently at the probing wavelength of 690 nm corresponding to the absorption peak of BPD. In the FL modality, the probing power density on the surface was about 30 mW/cm2 and the diameter of illuminated area was about 25 mm. The exposure times of 10 and 30 ms were used for the water phantom (top row) and agar mixture phantom (bottom row), respectively. In the OA modality, the irradiance on the surface was about 7.5 mJ/cm2 and the sample interval between B-scans was 30 s. The OA B-scans of the phantom were acquired by mechanical scanning of the OA head with a step of 50 µm, resulting in a B-scan consisting of 330 A-scans. Figure 5b shows the OA B-scan cross-sections along the Z-direction. In the water phantom, the tube with the BPD solution was easily located and demonstrated a higher signal as compared to the IRDye800 tube. Despite out-of-resonance excitation, the signal from the IRDye800 tube was detected in OA images due to its long tail of absorption spectra in the visible wavelength range (Figure 2). For the agar mixture phantom, the fluorescence image became blurred due to multiple scattering, thus limiting exact localization and detection of the BPD-containing tube, although its presence was evident. The OA signal from both BPD and IRDye800 tubes decayed in this case due to the attenuation of probing radiation in the agar phantom, although both BPD and IRDye800 tubes were still detectable. One can see that the tube cross-sections in the OA images are not represented by uniform circles. This phenomenon is governed by the OA reconstruction artifacts originating from the finite numerical aperture of the focused detector [19]. Complementary information from FL and OA imaging can allow evaluation of the size of the fluorescent object based on both the in-depth information from OA and the fluorescence profile width from FL imaging [19].
Figure 6 demonstrates the FL and OA images of the phantom obtained at the probing wavelength of 785 nm, corresponding to the absorption peak of IRDye800. Similar to the previous case, for each modality the images were obtained for a cuvette filled with water (top), in order to locate the tubes, and with agar mixture (bottom). The signal from the IRDye800 tube was pronounced in both FL and OA images, while there was no signal from both BPD and DMSO tubes, since the probing wavelength was outside the BPD absorption band. Similarly to Figure 5, the presence of agar mixture in the cuvette led to broadening of the fluorescence profile and a decrease in OA signal. However, since the attenuation of probing radiation in the phantom at 785 nm was smaller, the OA signal decay was less than that for the excitation wavelength of 690 nm.
Table 2 summarizes the Weber contrast of FL and OA images calculated by the following formula
C o n t r a s t = m e a n ( I D y e ) m e a n ( I D M S O ) m e a n ( I D M S O )
where mean (IDye) is the intensity of the corresponding (FL or OA) signal averaged over the tube with the dye, and mean (IDMSO) is the intensity of the signal averaged over the tube with DMSO. Averaging was performed over the green solid circles in the OA images (Figure 5b), and over the whole tube for FL imaging.
As seen from Table 2, the fluorescence/absorption contrast in the turbid phantom was significantly reduced as compared to that in water. Generally, IRDye800 provided higher contrast compared to BPD, which proves its potential as an auxiliary contrast agent. Note that at the excitation wavelength of 690 nm, the IRDye800-containing tube provided non-zero contrast in the OA image, while in the FL image its contrast was zero. This is the result of the relatively strong out-of-resonance absorption of IRDye800. Table 2 also demonstrates that FL contrast was higher than OA contrast for both BPD and IRDye800. This conclusion contradicts the results obtained in [18], where it was shown that the OA contrast was higher or comparable to the FL one. However, in the cited paper, the background signal was calculated in the vicinity of the tube with the dye, where the medium is uniformly scattering and absorbing, while in our study, the average signal from the tube with DMSO was taken as the background for mimicking the absorbing inhomogeneity. The OA and FL contrasts become comparable in our study if the background signal is calculated in the same way as in Reference [18].

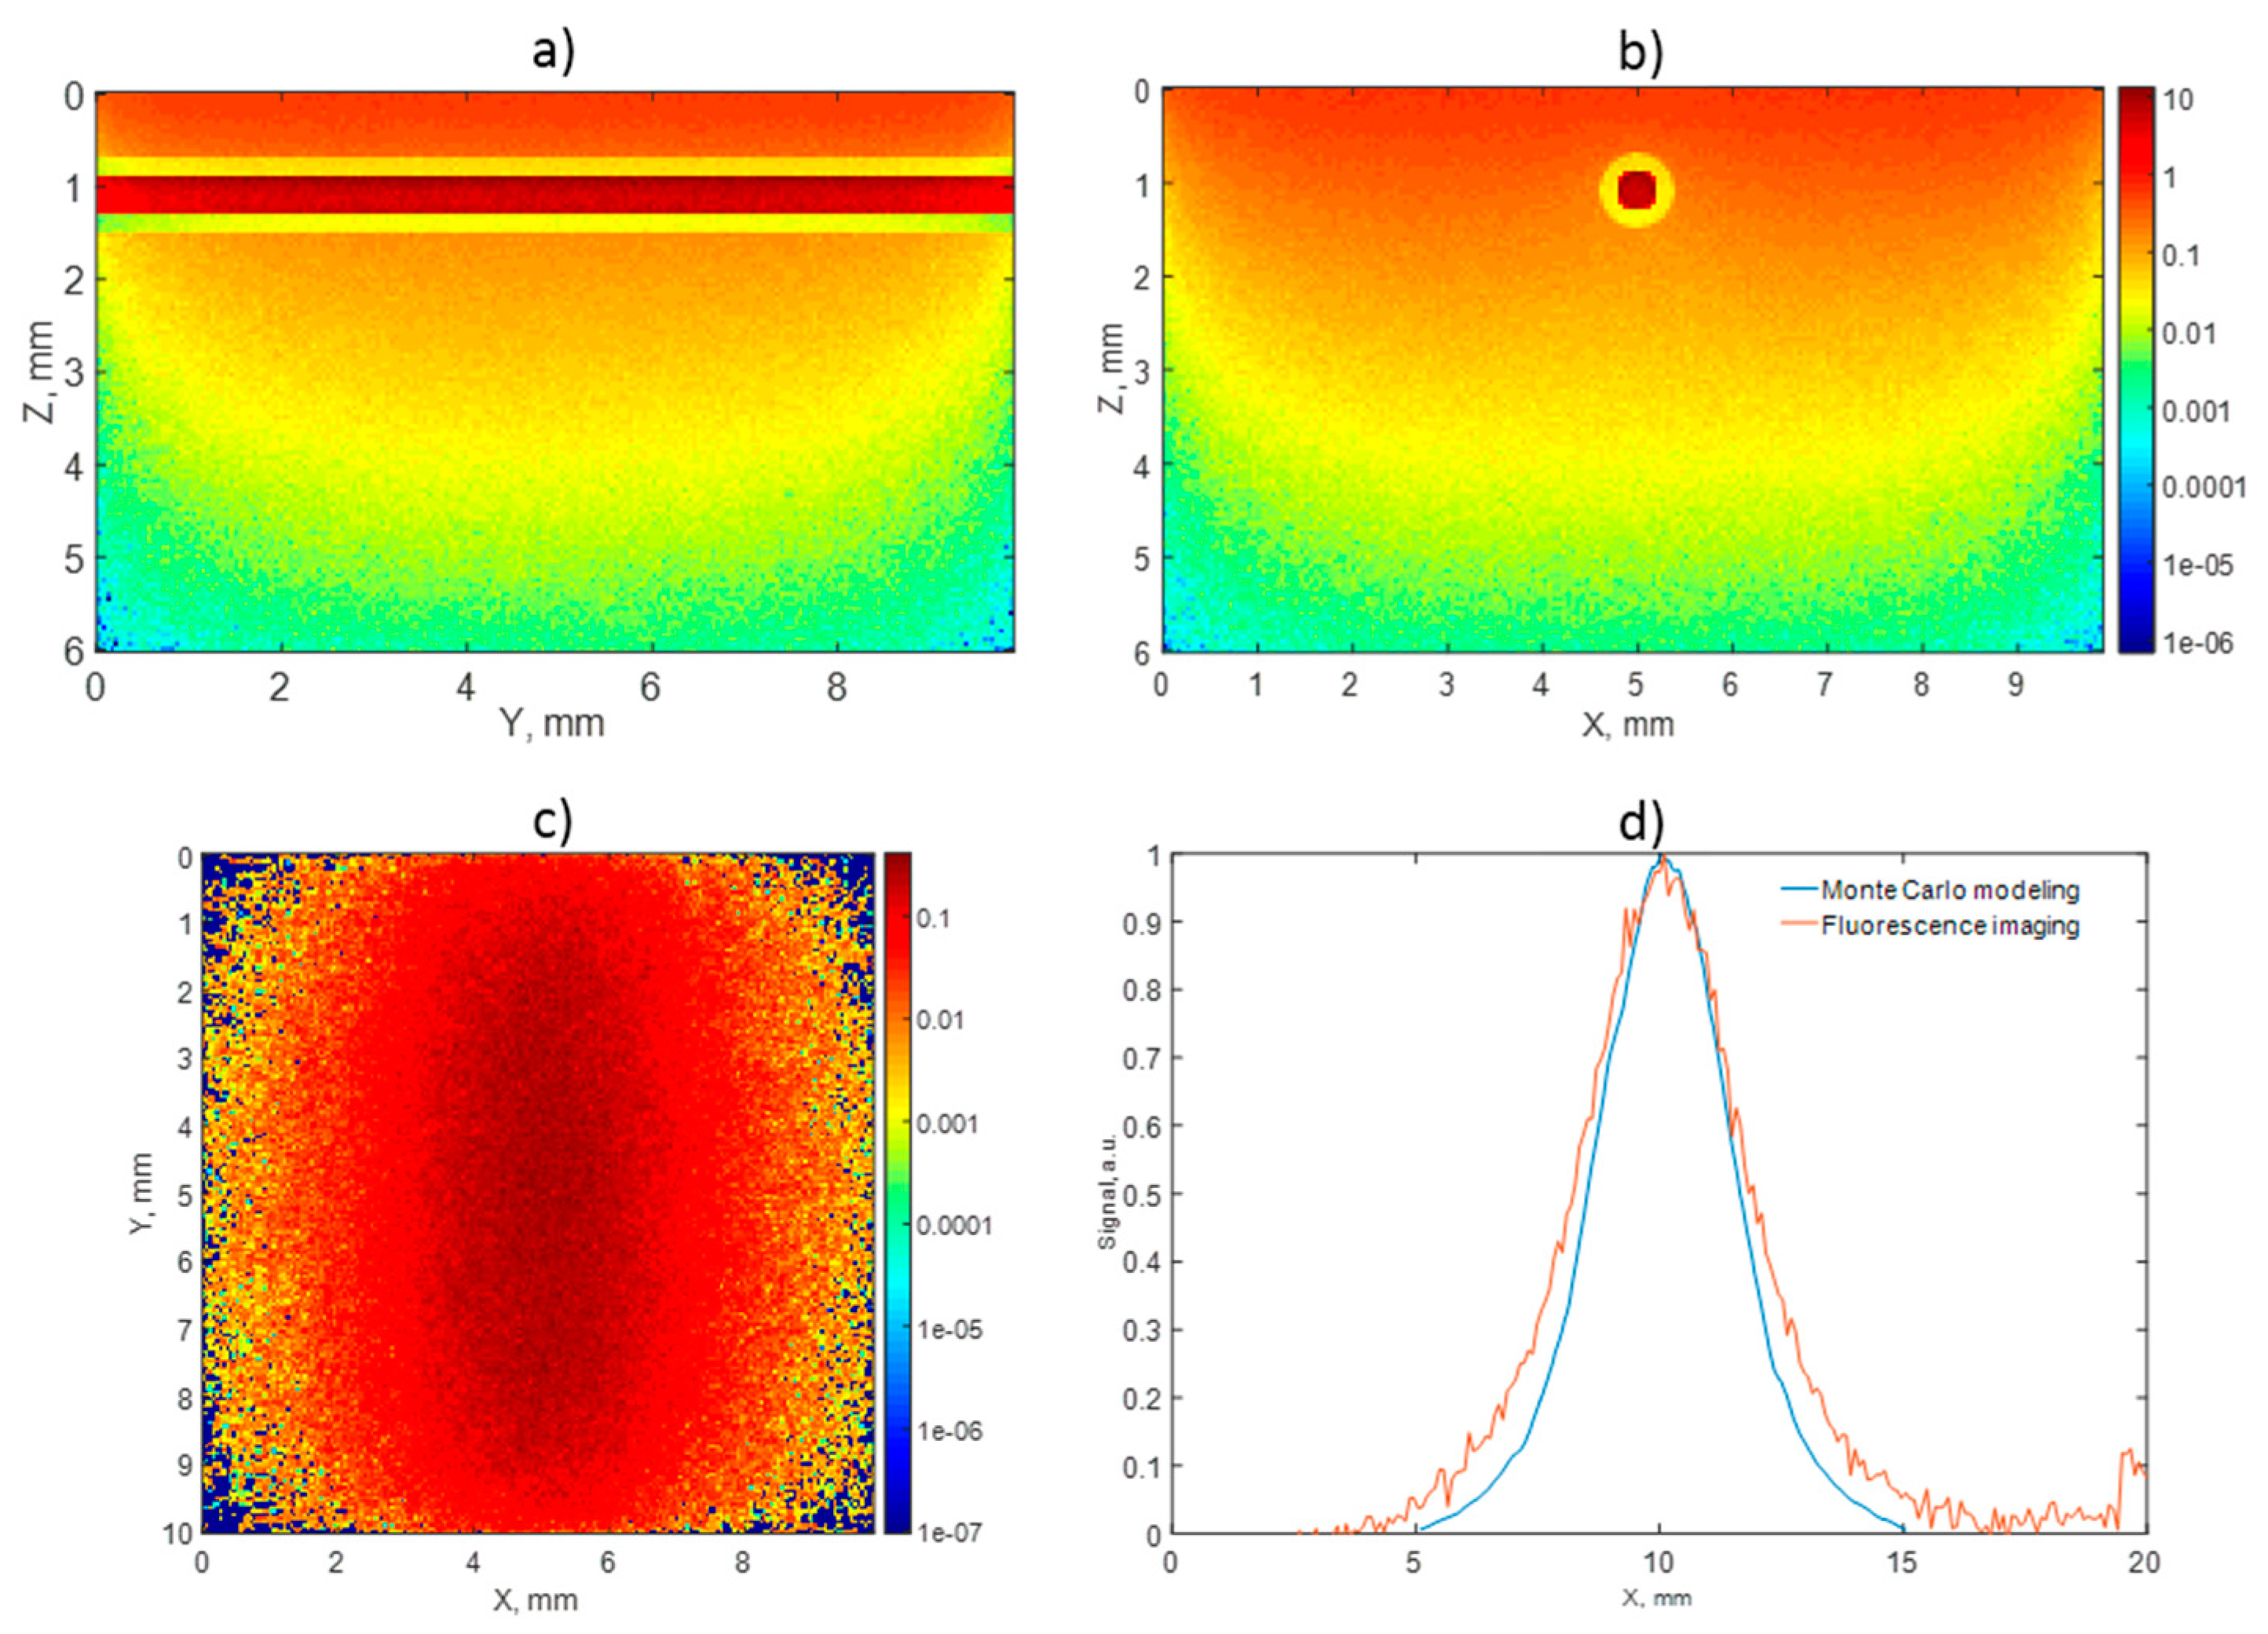
3.2. Monte Carlo Simulations of Fluorescence Imaging

In order to approve the relevance of the obtained fluorescence images, Monte Carlo simulations were performed for the geometry corresponding to that of the agar mixture phantom. Figure 7 depicts the results of the simulations for the phantom with an embedded BPD tube for the probing wavelength of 690 nm. The top row of Figure 7 demonstrates the distribution of the probing radiation absorption within the medium. The maps demonstrate photon fraction absorbed per unit volume, normalized by the number of launched photons per unit area. One can see that the absorption within the BPD tube was quite uniform, confirming that the registered fluorescence response originated from the entire labeled volume. Figure 7c demonstrates the simulated fluorescence image, while Figure 7d shows the simulated and experimentally registered central cross-sections of the fluorescence profile. The calculated fluorescence map shows the ratio of densities of fluorescence photons that reached the top surface of the medium to the number of launched photons; fluorescence quantum yield was taken to be equal to 1. Similar results were obtained for the FL of the phantom with the embedded IRDye800 tube for the probing wavelength of 785 nm (not shown).
Figure 8 demonstrates the widths of the fluorescence profile central cross-sections for different diameters of the labeled tubes. The demonstrated monotonous dependence of FWHM on the tube size confirms that complementary bimodal imaging allows to obtain additional information on the size of the nanoconstruct-containing volume based on a given depth which can be determined from OA measurements. Note that the value of the fluorescence profile FWHM calculated for the tube with the inner diameter of 0.5 mm and located in a turbid phantom at the depth of 1 mm is FWHM = 3.3 mm which completely agrees with the corresponding value given in [18].

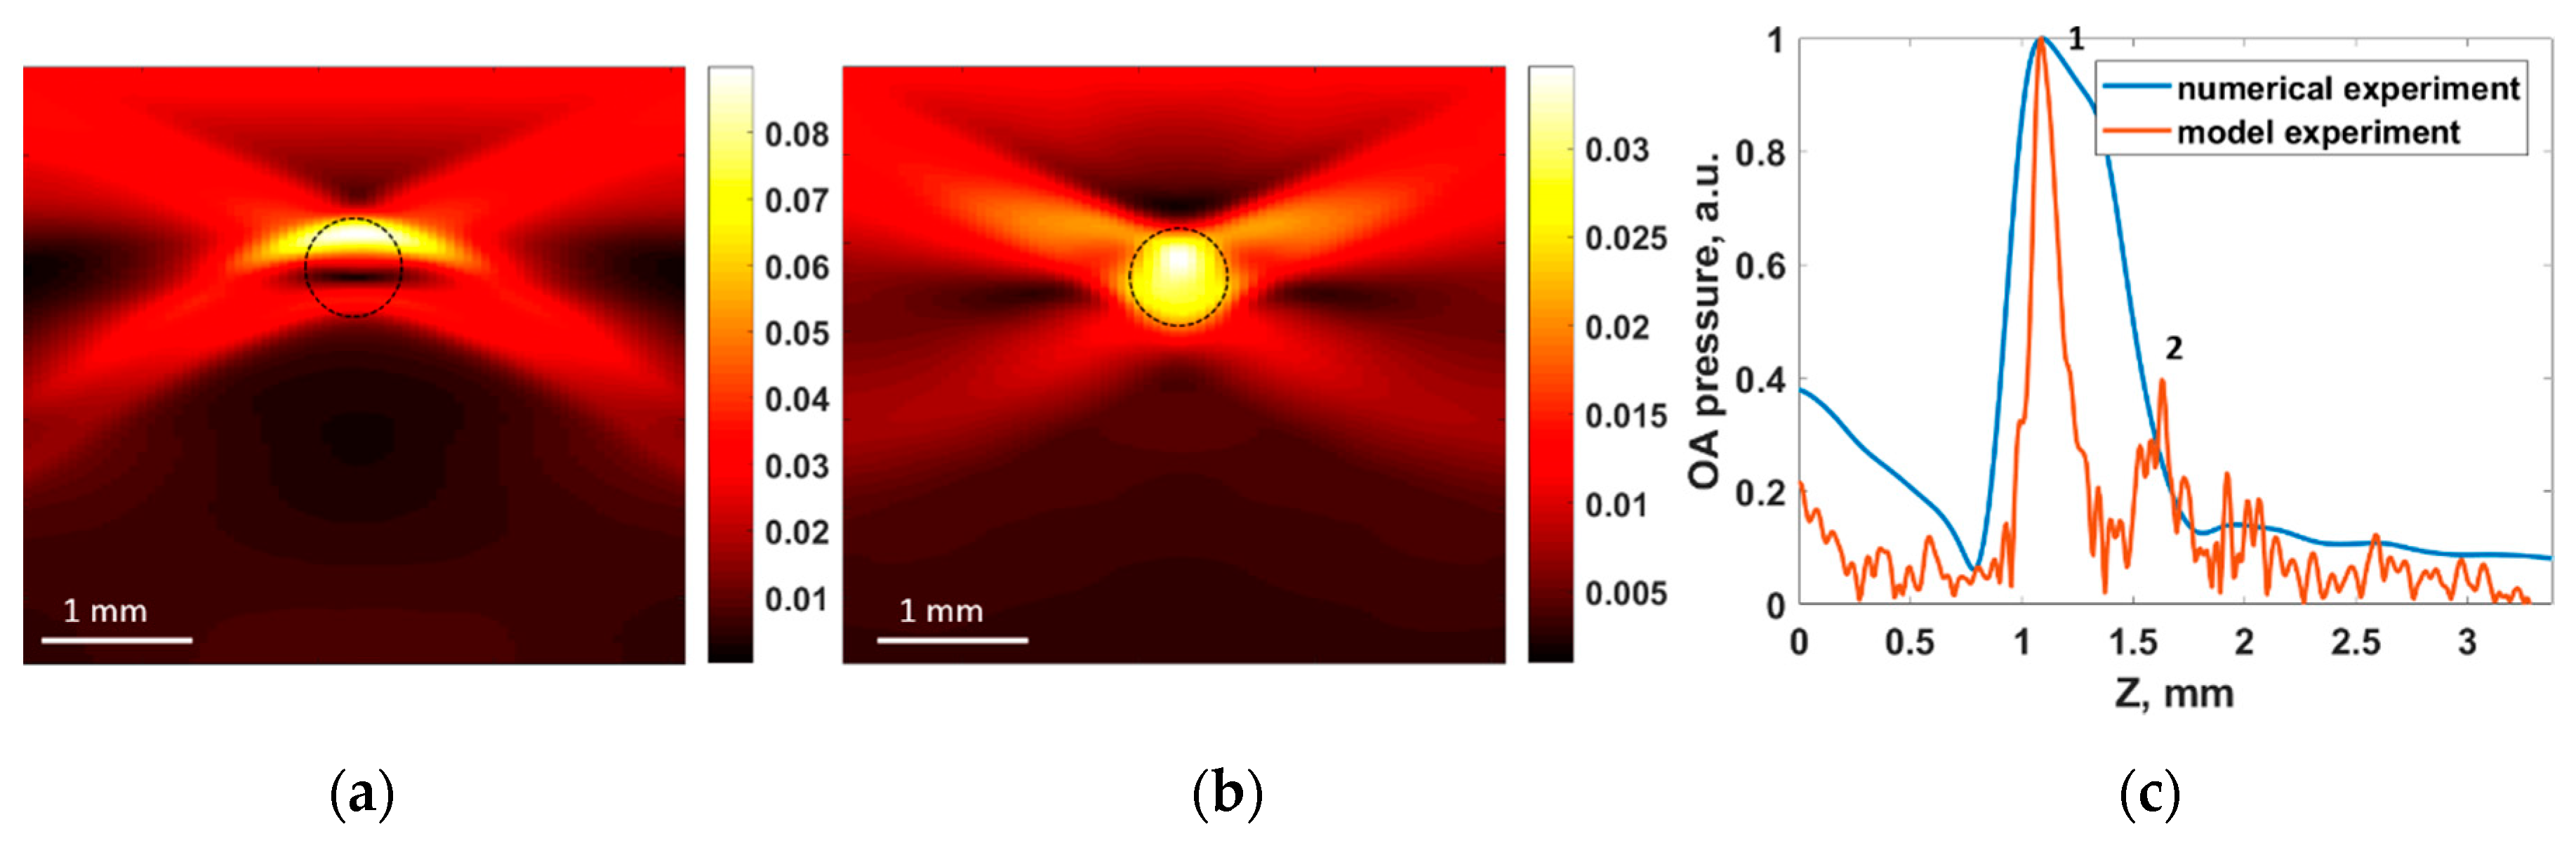
3.3. Numerical Simulations of Optoacoustic Imaging

Figure 9a demonstrates the raw OA B-scan (composed of 89 A-scans) of the cylindrical tube filled with BPD and embedded in the turbid phantom. The B-scan was simulated in k-Wave toolbox based on the Monte Carlo derived absorption map, as in Reference [19]. The raw image demonstrates that absorption in the bulk medium was weaker compared to the BPD-containing tube, therefore one can see a pronounced signal from the fluorophore. However, typical artifacts originating from the employment of a spherical acoustic antenna are present in the image. In this connection, reconstruction of the raw OA image was applied. The reconstructed OA image of the BPD-containing tube (Figure 9b) was in better agreement with the real shape and position of the tube.
Figure 9c shows the comparison of the simulated and experimentally registered A-scans in a central cross-section of the BPD tube. One can see that the shapes of the OA signals replicate each other, and the calculated diameter of the tube matches the measured one. However, in the numerically simulated A-scan, the BPD tube appeared as a solid object, while in the experiment, the tube was visualized by its upper (point 1 in Figure 9c) and lower (point 2 in Figure 9c) boundaries. This can be explained by the reduced spatial resolution in numerical simulations, specified by the maximum detection frequency of the antenna, which was limited (as compared to that of the real antenna) for the sake of reasonable calculation time.

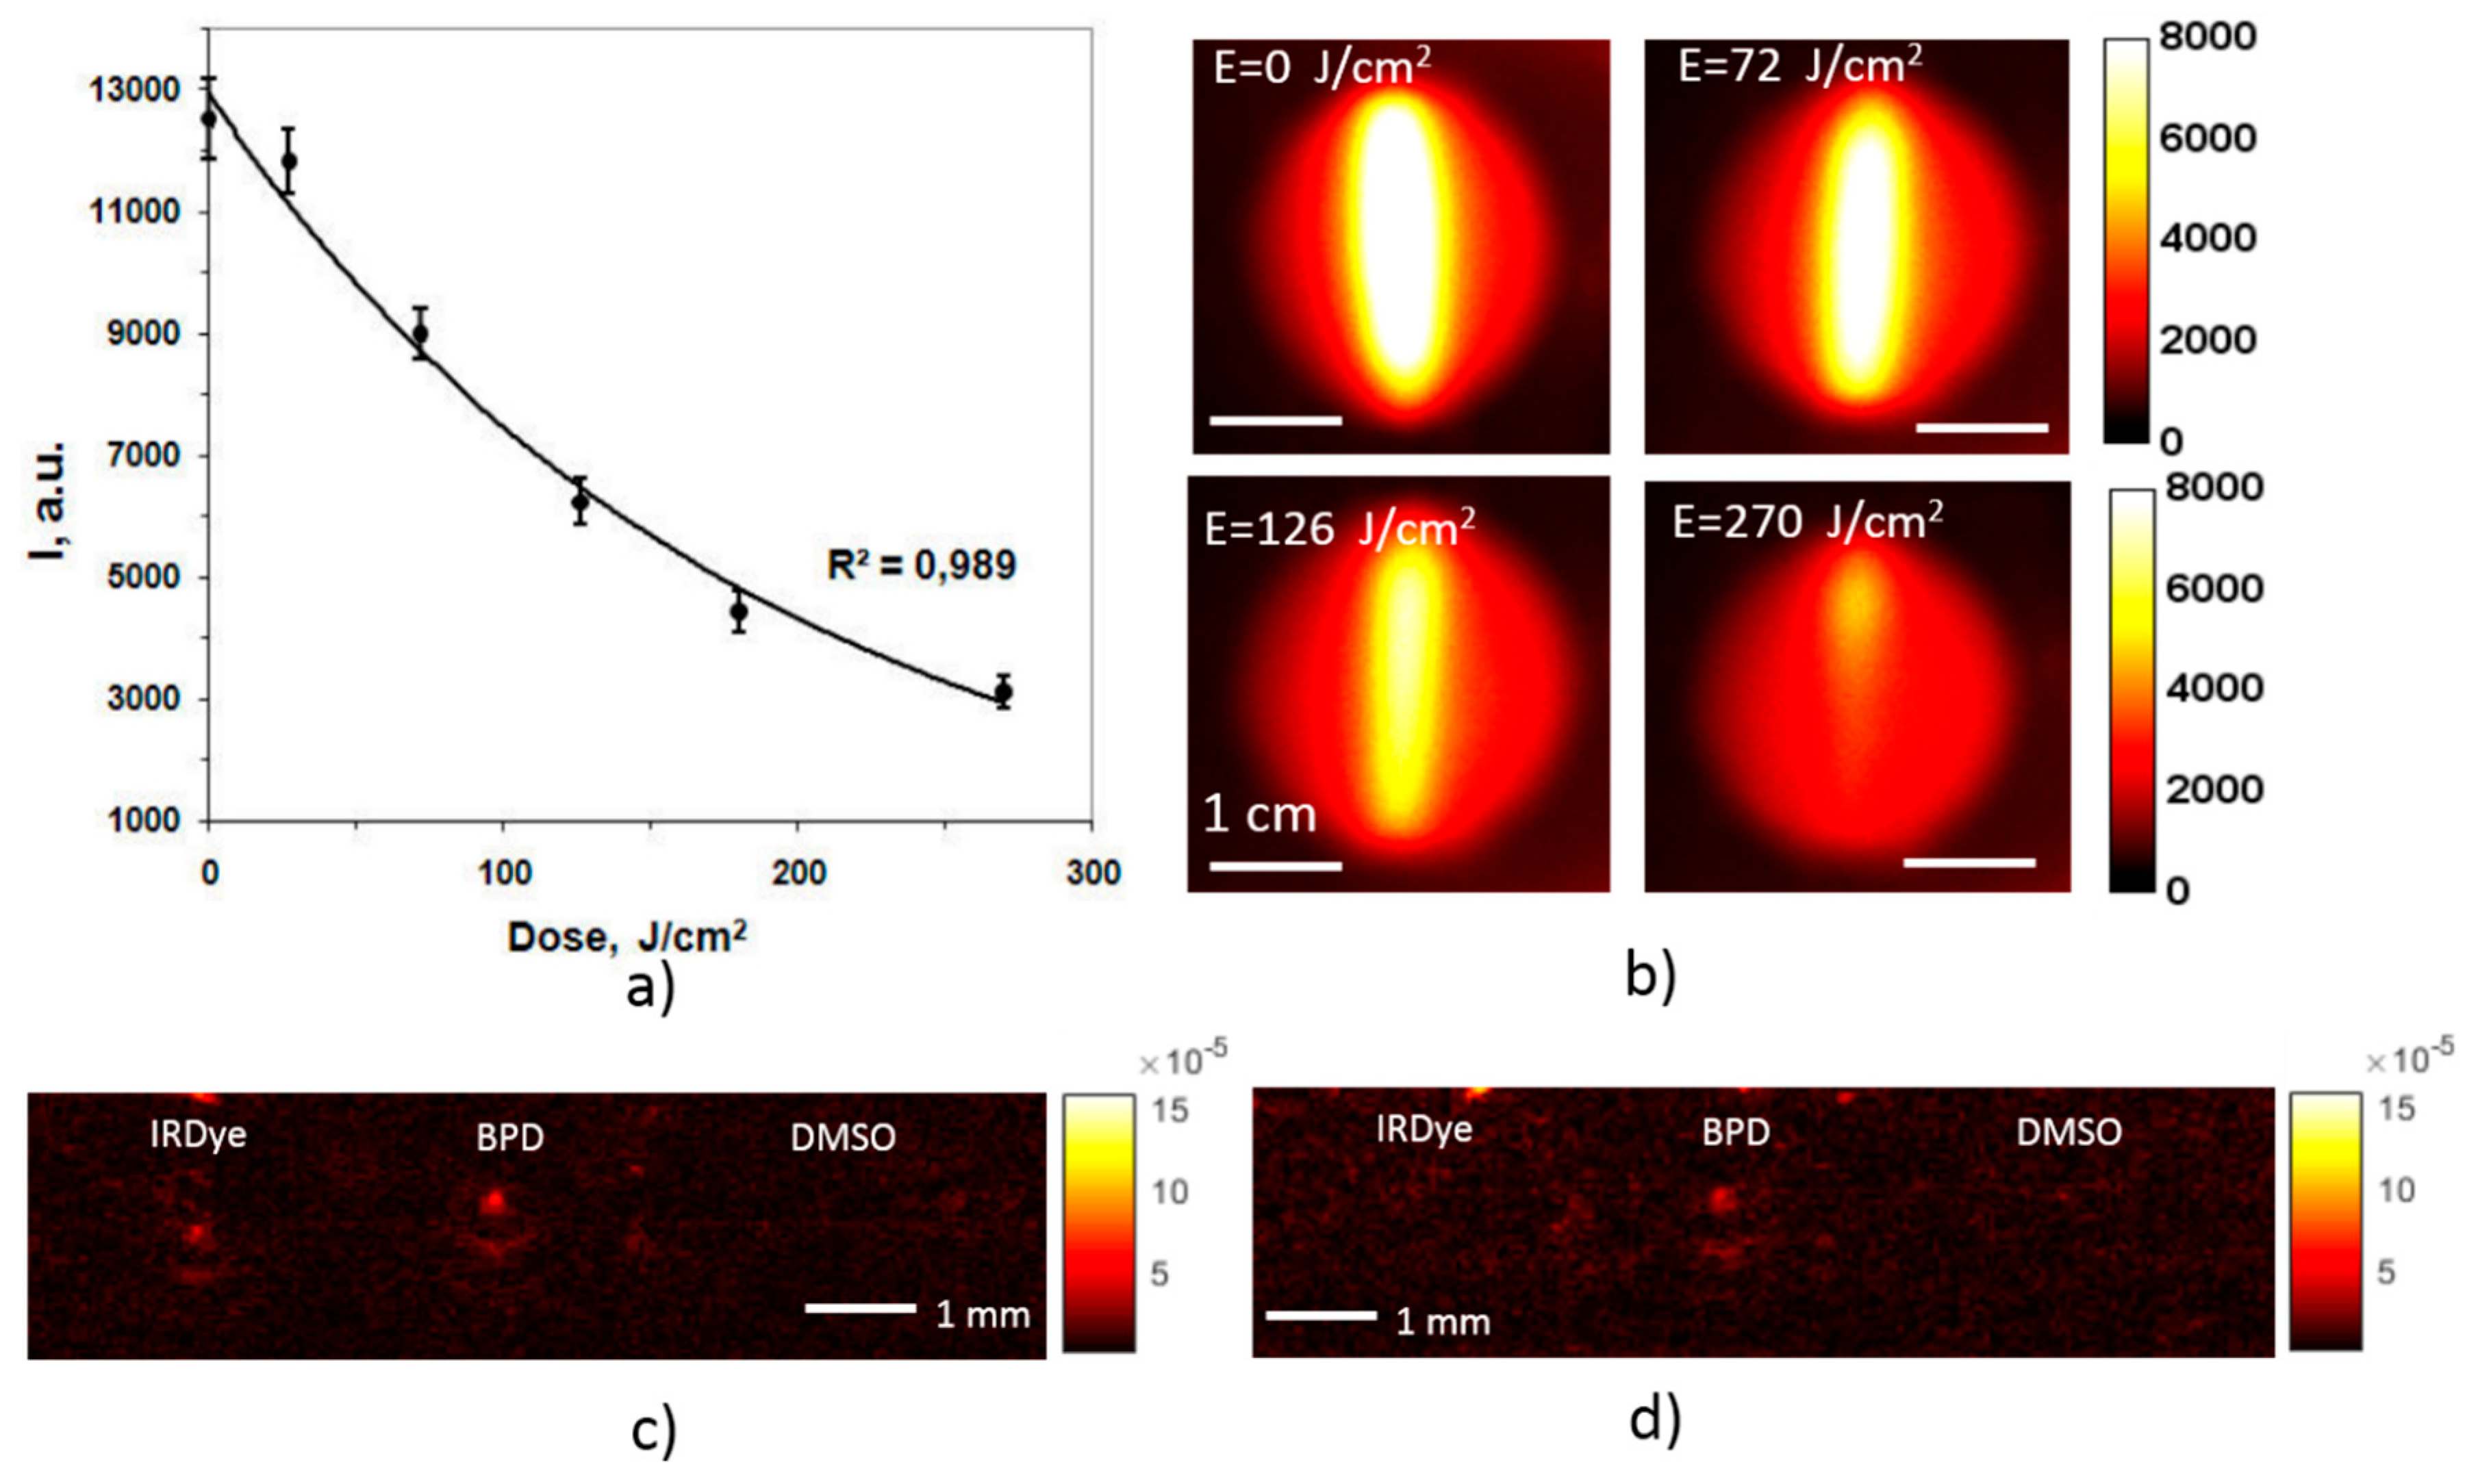
3.4. Monitoring of Photobleaching

Perspectives of the developed approach in monitoring of a PDT procedure were studied in the course of the BPD photobleaching. The phantom was irradiated at the wavelength of 695 nm, with the intensity at the surface amounting 150 mW/cm2, which is typical for an anti-tumor PDT procedure. The irradiation lasted until the delivered dose amounted to 270 J/cm2, typical for antitumor treatment. Fluorescence images acquired at different stages of irradiation are shown in Figure 10b, together with the corresponding delivered doses. Figure 10a shows the decrease of the fluorescence intensity with the increase of the accumulated dose which indicates photobleaching of the PS. One can see that this dependence is accurately (R2 = 0.989) approximated by an exponential decay law. A photobleaching level of 50% was achieved at the dose of 120 J/cm2, and the level of 80% was reached after the full dose of 270 J/cm 2. Figure 10c,d show the OA B-scans of the phantom with agar mixture obtained at 690 nm before (Figure 10c) and after (Figure 10d) the PDT-mimicking procedure. One can observe a decrease of OA signals from BPD, indicating decrease of absorption as a result of photobleaching. The OA image contrast of BPD at 690 nm, calculated using Equation (1), decreased from 1.1 to 0.5 after the procedure and corresponds to the relative signal decrease of 28% due to photobleaching, which was significantly lower than the corresponding FL signal decrease. This fact indicates that fluorescence imaging is more sensitive to detecting photobleaching compared to OA, which is in good agreement with the results of other researchers [28].

4. Conclusions

In this study we demonstrated the abilities of a bimodal approach combining fluorescence and optoacoustic imaging in monitoring the distribution of BPD and IRDye800, two components of the targeted nanoconstructs for photodynamic therapy of gliomas.
Both imaging modalities employ dual-wavelength probing at the wavelengths corresponding to the absorption peaks of the two components enabling their separate detection. Fluorescence imaging demonstrated higher contrast as compared to optoacoustic imaging for both components, suffering, however, from strong light scattering in the bulk media, which restricted accurate localization of the markers. Optoacoustic imaging also demonstrated sufficient sensitivity to both components, enabling their depth-resolved detection in a scattering medium. However, limited aperture of the scanning acoustic detector, along with low repetition rate of laser pulses (and therefore, low acquisition rate) restricted accurate visualization of the absorber shape. Fluorescence imaging, in its turn, is simple in implementation compared to OA, does not require direct contact with the tissue, and is sensitive to photobleaching, which is a measure of PDT efficiency.
Analysis of the marker fluorescence profile combined with the information on the marker depth obtained from OA imaging was shown to be useful in the characterization of the drug-containing volume. Employment of the bimodal approach in monitoring of PS photobleaching indicates its high potential in intraprocedural PDT monitoring.

Author Contributions

Conceptualization, M.K. and I.T; Formal analysis, E.S.; Investigation, D.K., V.P. (Valeriya Perekatova) and V.P. (Vladimir Plekhanov); Methodology, V.P. (Vladimir Plekhanov) and P.S.; Supervision, M.K., I.T. and T.H.; Visualization, V.P. (Valeriya Perekatova); Writing—original draft, D.K.; Writing—review & editing, D.K., M.K., V.P. (Valeriya Perekatova), V.P. (Vladimir Plekhanov), A.O., A.N., E.S., A.K., P.S., S.M., I.T. and T.H.

Funding

The study is supported by RFBR project 17-54-33043 onko-a and NIH grant R21CA220143-02.

Acknowledgments

The authors are grateful to engineers Vladimir Vorobjev, Maxim Prudnikov, and Sergej Pozhidaev for technical assistance, and to Michael Jaeger for provision of the acoustic reconstruction algorithm.

Conflicts of Interest

The authors declare no conflict of interest.

References

  1. Dolmans, D.E.; Fukumura, D.; Jain, R.K. Photodynamic therapy for cancer. Nat. Rev. Cancer 2003, 3, 380–387. [Google Scholar] [CrossRef]
  2. Agostinis, P.; Berg, K.; Cengel, K.A.; Foster, T.H.; Girotti, A.W.; Gollnick, S.O.; Hahn, S.M.; Hamblin, M.R.; Juzeniene, A.; Kessel, D. Photodynamic therapy of cancer: An update. CA Cancer J. Clin. 2011, 61, 250–281. [Google Scholar] [CrossRef] [PubMed]
  3. De Paula, L.B.; Primo, F.L.; Tedesco, A.C. Nanomedicine associated with photodynamic therapy for glioblastoma treatment. Biophys. Rev. 2017, 9, 761–773. [Google Scholar] [CrossRef] [PubMed] [Green Version]
  4. Mallidi, S.; Spring, B.Q.; Hasan, T. Optical imaging, photodynamic therapy and optically-triggered combination treatments. Cancer J. 2015, 21, 194. [Google Scholar] [CrossRef] [PubMed]
  5. Scott, M.; Hopper, C.; Sahota, A.; Springett, R.; McIlroy, B.; Bown, S.; MacRobert, A. Fluorescence photodiagnostics and photobleaching studies of cancerous lesions using ratio imaging and spectroscopic techniques. Lasers Med. Sci. 2000, 15, 63–72. [Google Scholar] [CrossRef] [PubMed]
  6. Stummer, W.; Novotny, A.; Stepp, H.; Goetz, C.; Bise, K.; Reulen, H.J. Fluorescence-guided resection of glioblastoma multiforme utilizing 5-ala-induced porphyrins: A prospective study in 52 consecutive patients. J. Neurosurg. 2000, 93, 1003–1013. [Google Scholar] [CrossRef]
  7. Shirmanova, M.V.; Zagainova, E.V.; Sirotkina, M.A.; Snopova, L.B.; Balalaeva, I.V.; Krutova, I.M.; Lekanova, N.; Turchin, I.V.; Orlova, A.G.; Kleshnin, M.S. In vivo study of photosensitizer pharmacokinetics by fluorescence transillumination imaging. J. Biomed. Opt. 2010, 15, 048004. [Google Scholar] [CrossRef]
  8. Khilov, A.; Kirillin, M.Y.; Loginova, D.; Turchin, I. Estimation of chlorin-based photosensitizer penetration depth prior to photodynamic therapy procedure with dual-wavelength fluorescence imaging. Laser Phys. Lett. 2018, 15, 126202. [Google Scholar] [CrossRef]
  9. Khilov, A.; Kurakina, D.; Turchin, I.V.; Kirillin, M.Y. Monitoring of chlorin-based photosensitiser localisation with dual-wavelength fluorescence imaging: Numerical simulations. Quantum Electron. 2019, 49, 63. [Google Scholar] [CrossRef]
  10. Gamayunov, S.; Turchin, I.; Fiks, I.; Korchagina, K.; Kleshnin, M.; Shakhova, N. Fluorescence imaging for photodynamic therapy of non-melanoma skin malignancies–a retrospective clinical study. Photonics Lasers Med. 2016, 5, 101–111. [Google Scholar] [CrossRef]
  11. Turchin, I.V. Methods of biomedical optical imaging: From subcellular structures to tissues and organs. Physics-Uspekhi 2016, 59, 487. [Google Scholar] [CrossRef]
  12. Rizvi, I.; Nath, S.; Obaid, G.; Ruhi, M.K.; Moore, K.; Bano, S.; Kessel, D.; Hasan, T. A combination of visudyne and a lipid-anchored liposomal formulation of benzoporphyrin derivative enhances photodynamic therapy efficacy in a 3d model for ovarian cancer. Photochem. Photobiol. 2019, 95, 419–429. [Google Scholar] [CrossRef]
  13. Iinuma, S.; Schomacker, K.T.; Wagnieres, G.; Rajadhyaksha, M.; Bamberg, M.; Momma, T.; Hasan, T. In vivo fluence rate and fractionation effects on tumor response and photobleaching: Photodynamic therapy with two photosensitizers in an orthotopic rat tumor model. Cancer Res. 1999, 59, 6164–6170. [Google Scholar]
  14. Glidden, M.D.; Celli, J.P.; Massodi, I.; Rizvi, I.; Pogue, B.W.; Hasan, T. Image-based quantification of benzoporphyrin derivative uptake, localization, and photobleaching in 3d tumor models, for optimization of pdt parameters. Theranostics 2012, 2, 827. [Google Scholar] [CrossRef]
  15. Obaid, G.; Jin, W.; Bano, S.; Kessel, D.; Hasan, T. Nanolipid formulations of benzoporphyrin derivative: Exploring the dependence of nanoconstruct photophysics and photochemistry on their therapeutic index in ovarian cancer cells. Photochem. Photobiol. 2019, 95, 364–377. [Google Scholar] [CrossRef]
  16. Te Velde, E.; Veerman, T.; Subramaniam, V.; Ruers, T. The use of fluorescent dyes and probes in surgical oncology. Eur. J. Surg. Oncol. 2010, 36, 6–15. [Google Scholar] [CrossRef] [Green Version]
  17. Taruttis, A.; Ntziachristos, V. Advances in real-time multispectral optoacoustic imaging and its applications. Nat. Photonics 2015, 9, 219. [Google Scholar] [CrossRef]
  18. Chen, Z.; Deán-Ben, X.L.; Gottschalk, S.; Razansky, D. Performance of optoacoustic and fluorescence imaging in detecting deep-seated fluorescent agents. Biomed. Opt. Express 2018, 9, 2229–2239. [Google Scholar] [CrossRef] [Green Version]
  19. Kirillin, M.Y.; Kurakina, D.; Perekatova, V.; Orlova, A.G.; Sergeeva, E.A.; Khilov, A.; Subochev, P.V.; Turchin, I.V.; Mallidi, S.; Hasan, T. Complementary bimodal approach to monitoring of photodynamic therapy with targeted nanoconstructs: Numerical simulations. Quantum Electron. 2019, 49, 43. [Google Scholar] [CrossRef]
  20. Zhang, H.F.; Maslov, K.; Stoica, G.; Wang, L.V. Functional photoacoustic microscopy for high-resolution and noninvasive in vivo imaging. Nat. Biotechnol. 2006, 24, 848–851. [Google Scholar] [CrossRef] [Green Version]
  21. Subochev, P.; Orlova, A.; Mikhailova, I.; Shilyagina, N.; Turchin, I. Simultaneous in vivo imaging of diffuse optical reflectance, optoacoustic pressure, and ultrasonic scattering. Biomed. Opt. Express 2016, 7, 3951–3957. [Google Scholar] [CrossRef]
  22. Jaeger, M.; Schüpbach, S.; Gertsch, A.; Kitz, M.; Frenz, M. Fourier reconstruction in optoacoustic imaging using truncated regularized inverse k-space interpolation. Inverse Probl. 2007, 23, S51. [Google Scholar] [CrossRef]
  23. Tsoukas, M.M.; Lin, G.C.; Lee, M.S.; Anderson, R.R.; Kollias, N. Predictive dosimetry for threshold phototoxicity in photodynamic therapy on normal skin: Red wavelengths produce more extensive damage than blue at equal threshold doses. J. Investig. Dermatol. 1997, 108, 501–505. [Google Scholar] [CrossRef]
  24. Marshall, M.V.; Draney, D.; Sevick-Muraca, E.M.; Olive, D.M. Single-Dose Intravenous Toxicity Study of IRDye 800CW in Sprague-Dawley Rats. Mol. Imaging Biol. 2010, 12, 583–594. [Google Scholar] [CrossRef] [Green Version]
  25. Loginova, D.A.; Sergeeva, E.A.; Krainov, A.; Agrba, P.D.; Kirillin, M.Y. Liquid optical phantoms mimicking spectral characteristics of laboratory mouse biotissues. Quantum Electron. 2016, 46, 528. [Google Scholar] [CrossRef]
  26. Orlova, A.G.; Maslennikova, A.V.; Golubyatnikov, G.Y.; Suryakova, A.S.; Kirillin, M.Y.; Kurakina, D.A.; Kalganova, T.I.; Volovetsky, A.B.; Turchin, I.V. Diffuse optical spectroscopy assessment of rodent tumor model oxygen state after single-dose irradiation. Biomed. Phys. Eng. Exp. 2019, 5. [Google Scholar] [CrossRef]
  27. Treeby, B.E.; Cox, B.T. K-wave: Matlab toolbox for the simulation and reconstruction of photoacoustic wave fields. J. Biomed. Opt. 2010, 15, 021314. [Google Scholar] [CrossRef]
  28. Ho, C.J.; Balasundaram, G.; Driessen, W.; McLaren, R.; Wong, C.L.; Dinish, U.S.; Attia, A.B.E.; Ntziachristos, V.; Olivo, M. Multifunctional photosensitizer-based contrast agents for photoacoustic imaging. Sci. Rep. 2014, 4, 5342. [Google Scholar] [CrossRef]
Figure 1. Schematic of the experimental setup for fluorescence imaging: 1—dark chamber, 2,3—laser sources 690 and 785 nm, 4—optical diffusor, 5—experimental object, 6—objective lens, 7—filter wheel, 8—CCD.
Applsci 09 01918 g001
Figure 2. Absorption and emission spectra of benzoporphyrin derivative (BPD) and IRDye800.
Applsci 09 01918 g002
Figure 3. The schematic of the optoacoustic (OA) setup and a phantom with three embedded tubes.
Applsci 09 01918 g003
Figure 4. Photography of the tubes containing the phantom filled with water (a) and agar mixture (b).
Applsci 09 01918 g004
Figure 5. Fluorescence images (a) and reconstructed optoacoustic B-scans (b) of the water phantom (top) and agar mixture phantom (bottom) for the excitation wavelength of 690 nm. Solid green circles represent the areas of averaging for the contrast calculation. Dashed green lines depict the position of tubes filled with dyes.
Applsci 09 01918 g005
Figure 6. Fluorescence images (a) and reconstructed optoacoustic B-scans (b) of the water phantom (top) and agar mixture phantom (bottom) for the excitation wavelength of 785 nm.
Applsci 09 01918 g006
Figure 7. Monte Carlo simulations: absorption maps within the agar mixture phantom with embedded BPD tube at the wavelength of 690 nm in two projections (a,b), corresponding fluorescence image (c), and comparison of experimental and simulated fluorescence profiles (d). All maps are normalized for the number of launched photons per unit area. The absorption values in (a,b) are shown in mm−1, fluorescence intensity is dimensionless (c). Color map values in (ac) are shown in logarithmic scale.
Applsci 09 01918 g007
Figure 8. Dependence of the fluorescence profile FWHM on the BPD tube diameter. The tube center is located 1.1 mm under the surface.
Applsci 09 01918 g008
Figure 9. Numerical simulation of OA imaging of the BPD tube within the agar mixture phantom: (a) raw OA B-scan modeled in k-Wave (in kPa) and (b) reconstructed OA B-scan. Dashed black circle represents the actual cross-section of the BPD-containing tube. (c) Comparison of the simulated and experimentally registered OA signals.
Applsci 09 01918 g009
Figure 10. Dependence of the fluorescence signal in the course of BPD photobleaching on the delivered irradiation dose with the confidence bounds (a). Fluorescence images of a BPD-containing tube corresponding to the indicated doses (b), and OA B-scans at 690 nm before (c) and after (d) the PDT-mimicking procedure.
Applsci 09 01918 g010
Table 1. Absorption coefficient µa and reduced scattering coefficient µs’ of murine brain ex vivo and of the phantom at the excitation and emission wavelengths of BPD and IRDye800.
Murine BrainPhantom
λ, nmµa (mm−1)µs’(mm−1)µa (mm−1)µs’(mm−1)
6900.091.960.063.6
7250.0711.890.063.25
7850.061.780.053
8350.051.650.053
Table 2. Weber contrast calculated by the fluorescence imaging (FL) and optoacoustic (OA) images of the phantom for probing wavelengths of 690 and 785 nm.
λ, nm690 nm785 nm
Marker/phantomFLOAFLOA
BPD + DMSO/water4.63.800
IRDye800 + DMSO/water00.729.14.4
BPD + DMSO/agar mixture2.81.100
IRDye800 + DMSO/agar mixture00.6153.8

