Article

Myoelectric Gaming in the Rehabilitation of Patients with C7 Spinal Cord Injury

by
Ramón de la Rosa
1,*,
Albano Carrera
1,
Alonso Alonso
1,
Benito Peñasco-Martín
2,†,
Angel Gil-Agudo
2 and
Evaristo J. Abril
3
1
Laboratory of Electronics and Bioengineering, ETSI de Telecomunicación, Universidad de Valladolid, Paseo Belén, 15, 47011 Valladolid, Spain
2
National Hospital for Paraplegics, Finca de la Peraleda, 45071 Toledo, Spain
3
Optical Communications Group, ETSI de Telecomunicación, Universidad de Valladolid, Paseo Belén, 15, 47011 Valladolid, Spain
*
Author to whom correspondence should be addressed.
Current address: Datapoint Europe, Avenida Manoteras, 6, 28050 Madrid, Spain.
Appl. Sci. 2019, 9(9), 1912; https://doi.org/10.3390/app9091912
Submission received: 31 October 2018 / Revised: 24 March 2019 / Accepted: 6 May 2019 / Published: 9 May 2019
(This article belongs to the Section Applied Biosciences and Bioengineering)

Abstract

:
This paper analyses the role of myoelectric games in the rehabilitation of paraplegic patients. The University of Valladolid neuromuscular training system, UVa-NTS platform, which allows the myoelectric command of computer applications, has been introduced in rehabilitation sessions of a group of paraplegic patients. The experiments took place both at the University of Valladolid and at the National Hospital for Paraplegics of Toledo in Spain. A homogeneous population of five patients with a C7 spinal cord injury was compared with a group of control subjects. The myoelectric control was performed with the flexor carpi radialis and the extensor carpi radialis muscles. The myoelectric routines were timed and the game scores measured. Notwithstanding the reduced mobility of the patients, they achieved fast adaptation and better timings than the control subjects in the first experiment (p < 0.001), although this difference was reduced in further experiments. Both patients and control subjects played satisfactorily with the Myo-Pong game. However, the improvement in the scores was better for the control subjects between sessions (p = 0.009) when compared with the patients (p = 0.978). The results show that patients and control subjects were able to perform and reached similar scores. However, patients’ improvement in further rehabilitation sessions was lesser than when compared with the control subjects.

Graphical Abstract

1. Introduction

One of the most devastating aspects of a spinal cord injury (SCI) at a cervical level is the impairment of arm and hand functions, which has a great impact on one’s level of independence and determines, for the most part, the extent of handicap [1]. Therefore, therapy of the upper extremities is very important in the rehabilitation of persons with tetraplegia. However, quantitative evaluation of rehabilitation therapy still constitutes an open field. Recording muscle activity by means of surface electromyography (EMG) may provide an insight into the development of new motor programmes, and the formation of new muscle coalitions during and after treatment of the aforementioned patients [2]. Furthermore, motivation is an important factor in rehabilitation and it is frequently used as a determinant of the outcome of the rehabilitation. Haptic interfaces and virtual reality (VR) technology can positively influence patient motivation and thus improve exercise adherence [3]. Hence, the combined use of VR and EMG recording, as performed by Van de Meent et al. [4], improves the therapists’ assessment of rehabilitation therapy.
Armagan et al. [5] analysed EMG biofeedback effectiveness as a rehabilitation tool in the treatment of the hemiplegic hand with positive results. Lim and Sherwood [6] assessed the reliability of surface EMG for volitional motor tasks, providing evidence of the potential use of EMG for the evaluation of the central nervous system motor control. By following this insight, Rong Song et al. [7] proposed a system that provides continuous assistance in extension torque, which is proportional to the amplitude of the subject’s EMG signal from the triceps. Hence, performance was analysed by measurements derived from the EMG and torque.
Aimed at merging these strategies and creating a measurement protocol to assess rehabilitation improvement, we designed the UVa-NTS platform [8]. This platform is a human-machine interface that makes real-time EMG signal processing, in order to command a set of interactive rehabilitation applications in a computer. This paper shows that the EMG upper limb training applied to individuals with C7 SCI has benefits as well as its suitability in the rehabilitation program. Results have been measured in terms of time to achieve a predefined task, as well as in terms of performance indexes related to gaming abilities. These performance indexes represent a new strategy to measure the evolution in the rehabilitation process by means of gaming scores, which are straightforward and only dependent on the patient and the human-machine interface.

2. Methods

The experiments were developed both at the University of Valladolid and at the National Hospital for Paraplegics of Toledo (NHPT), Spain, the latter being the centre of reference in the country in terms of SCI active rehabilitation, making it the ideal place to organise a homogeneous group. A set of inclusion criteria was defined in order to select a homogeneous group of patients with SCI who were suitable to perform the trials. Afterwards, the myoelectric tools were applied hierarchically during the rehabilitation sessions, i.e., from the initial testing and calibration procedures towards the Myo-Pong gaming tool. The following subsections describe the organisation of the experiments in the following order: (i) Criteria to select the subjects, (ii) available indexes in the UVa-NTS to measure the performance and the chosen ones, (iii) applied protocol during the trials, and (iv) techniques applied to analyse the obtained data.

2.1. Subjects

Upon discussion and based on the expertise gained by the NHPT medical personnel, the experiments were focused on the patients attending regularly to the NHPT for therapy sessions. An early stage of the treatment and compliance with the following inclusion criteria were required for the patients to be admitted into the study:
  • SCI at C7-level;
  • American Spinal Injury Association Impairment Scale (AIS) [9]: Grade C or D;
  • Flexor and extensor carpi muscles preserved;
  • Patients must be in the rehabilitation period;
  • Admission into the NHPT in the acute phase;
  • Possibility of functional improvement. Sequelae phase not yet reached;
  • The maximum time elapsed since the injury cannot exceed six months;
  • Written informed consent prior to the beginning of the experiment.
The NHPT is the reference hospital in Spain in terms of patients with SCI. Hence, this institution is the most adequate for obtaining the widest possible sample that meets these very specific requirements. Thus, five patients with C7 SCI, whose features are displayed in Table 1, fulfilled the inclusion criteria above. On the other hand, the control group consisted of sixteen able-bodied subjects, as summarised in Table 2. The obtained mean age of the control subjects (CS) was lower than the patients’. However, there is an atypical case, a 66-year-old, that influenced the mean age of the patients. As there are few patients, each contribution is valuable, so he was not discarded. With the assumption that muscular performance would be better in the younger subjects, the myoelectric trials were expected to be more challenging for patients with SCI. However, the results showed that patients with SCI performed better in the initial stages of the experiment.

2.2. Human-Machine Interface

The University of Valladolid neuromuscular training system, UVa-NTS platform [8], was employed for these experiments. This training platform is a custom-designed human-machine interface [10] which makes real-time processing of EMG signals in order to interactively command a set of training tools or games. The platform follows the approach of designing portable devices meant to improve semi-autonomous therapy. It has been reported by Johnson et al. [11] as a benefit in home environments, often characterised by low supervision from clinical experts and low extrinsic motivation.
The platform includes a set of graphical tools to achieve progressive adaptation to the environment. An overview of the implemented tools is shown in Figure 1 and is described in the following list:
  • The signal viewer, where EMG signals are checked in the time domain;
  • The state navigator, allowing two-dimensional movements of a screen pointer depending on the detected EMG amplitude of two muscles and hence their contraction level. x-axis and y-axis displacements are related to the EMG amplitude of each muscle involved. In this way, targets can be located on screen by the user by contracting his or her muscles. These targets are plotted as circles as shown in Figure 1;
  • The virtual arm, a 3D-design arm allowing the simulation of movements for prosthetic training. This tool uses the targets defined in the state navigator. Thus, each movement of the virtual arm can be associated with each of the defined targets. This application is intended to provide an approximation to what would be the real myoelectric prosthesis control. Hence, the application can assess the prosthesis adequation to the patient;
  • Myo-Pong, which is a version of a table tennis video game [12]. In this game, two paddles are meant to maintain the control of a ball. Therefore, each paddle is controlled by the EMG amplitude from a different muscle suitably chosen depending on the type of disability. The paddle displacement downwards is proportional to the muscle contraction level.

2.3. Performance Indexes

The proposed EMG-driven game concept enables the creation of a set of game-related performance indexes that can be used to assess the rehabilitation process. The following paragraphs show the available indexes both for the state navigator and the Myo-Pong tool. The state navigator has a set of targets located by the user. Once the targets are set, the user chooses a target, navigates to it, and sets on it by keeping a steady effort over a given period of time. Afterwards, the user relaxes the muscle and goes back to the rest state. Then, the same sequence repeats for the rest of the targets. This tool enables the evaluation of these performance measurements:
  • Time to reach the target (TRT), the time to achieve a defined effort from the rest state, i.e., the time to reach each target with the pointer from the top left corner of the tool;
  • Time to rest (TR), the time to reach the rest state, i.e., the top left corner;
  • Time on target (ToT), the time the user can maintain the pointer on a given target;
  • Fatigue time (FT), defined as the elapsed time before the user cannot continue to keep lock on the targets. This time is defined since the user starts navigating, although other definitions are possible depending on the task.
The Myo-Pong tool training configuration is set on the basis of two parameters: (i) The speed of the ball: Constant (slow/fast) or incremental, and (ii) the length of the player bar (paddle). The system allows us to evaluate the training efficiency by means of the following scores:
  • Success rate (SR), the ratio of successful hits to unsuccessful hits, the latter being defined as the total amount of collisions against the player’s wall (left or right side of the window). The complementary is the Error Rate (ER), which is the failure ratio related to the total amount of collisions;
  • Admissible speed (AS), measures the maximum ball speed the user can track, without exceeding a given error rate. The AS can be related to the ability to perform rapid actions with a prosthetic limb;
  • Precision control (PC), measures the accuracy in the actions. The measurement is performed by changing the bar length, i.e., the shorter the bar, the more difficult the hits. The bar size setting is suitable for practicing accuracy in proportional control of prosthetic limbs;
  • Fatigue time (FT), measures the time interval that maintains a steady ER once this rate is stabilised. The measure is finished when the ER is increased due to muscle fatigue.
From the aforementioned performance measurements and scores, we defined two performance indexes to evaluate quantitatively the evolution in the rehabilitation process. For the state navigator, the selected performance index was the navigation time (NT), which is a combination of the TRT plus the TR plus a predefined ToT for each target. This index evaluates the capability to perform controlled effort changes using muscle contractions. As on the Myo-Pong, the selected performance index was the SR, which assesses the muscle control in a continuous effort range. These indexes assess the ability to command EMG-driven systems such as a prosthetic robotic arm, whether they work with proportional control or with discrete control, as each target represents a state within a set of discrete states.

2.4. Evaluation Protocol

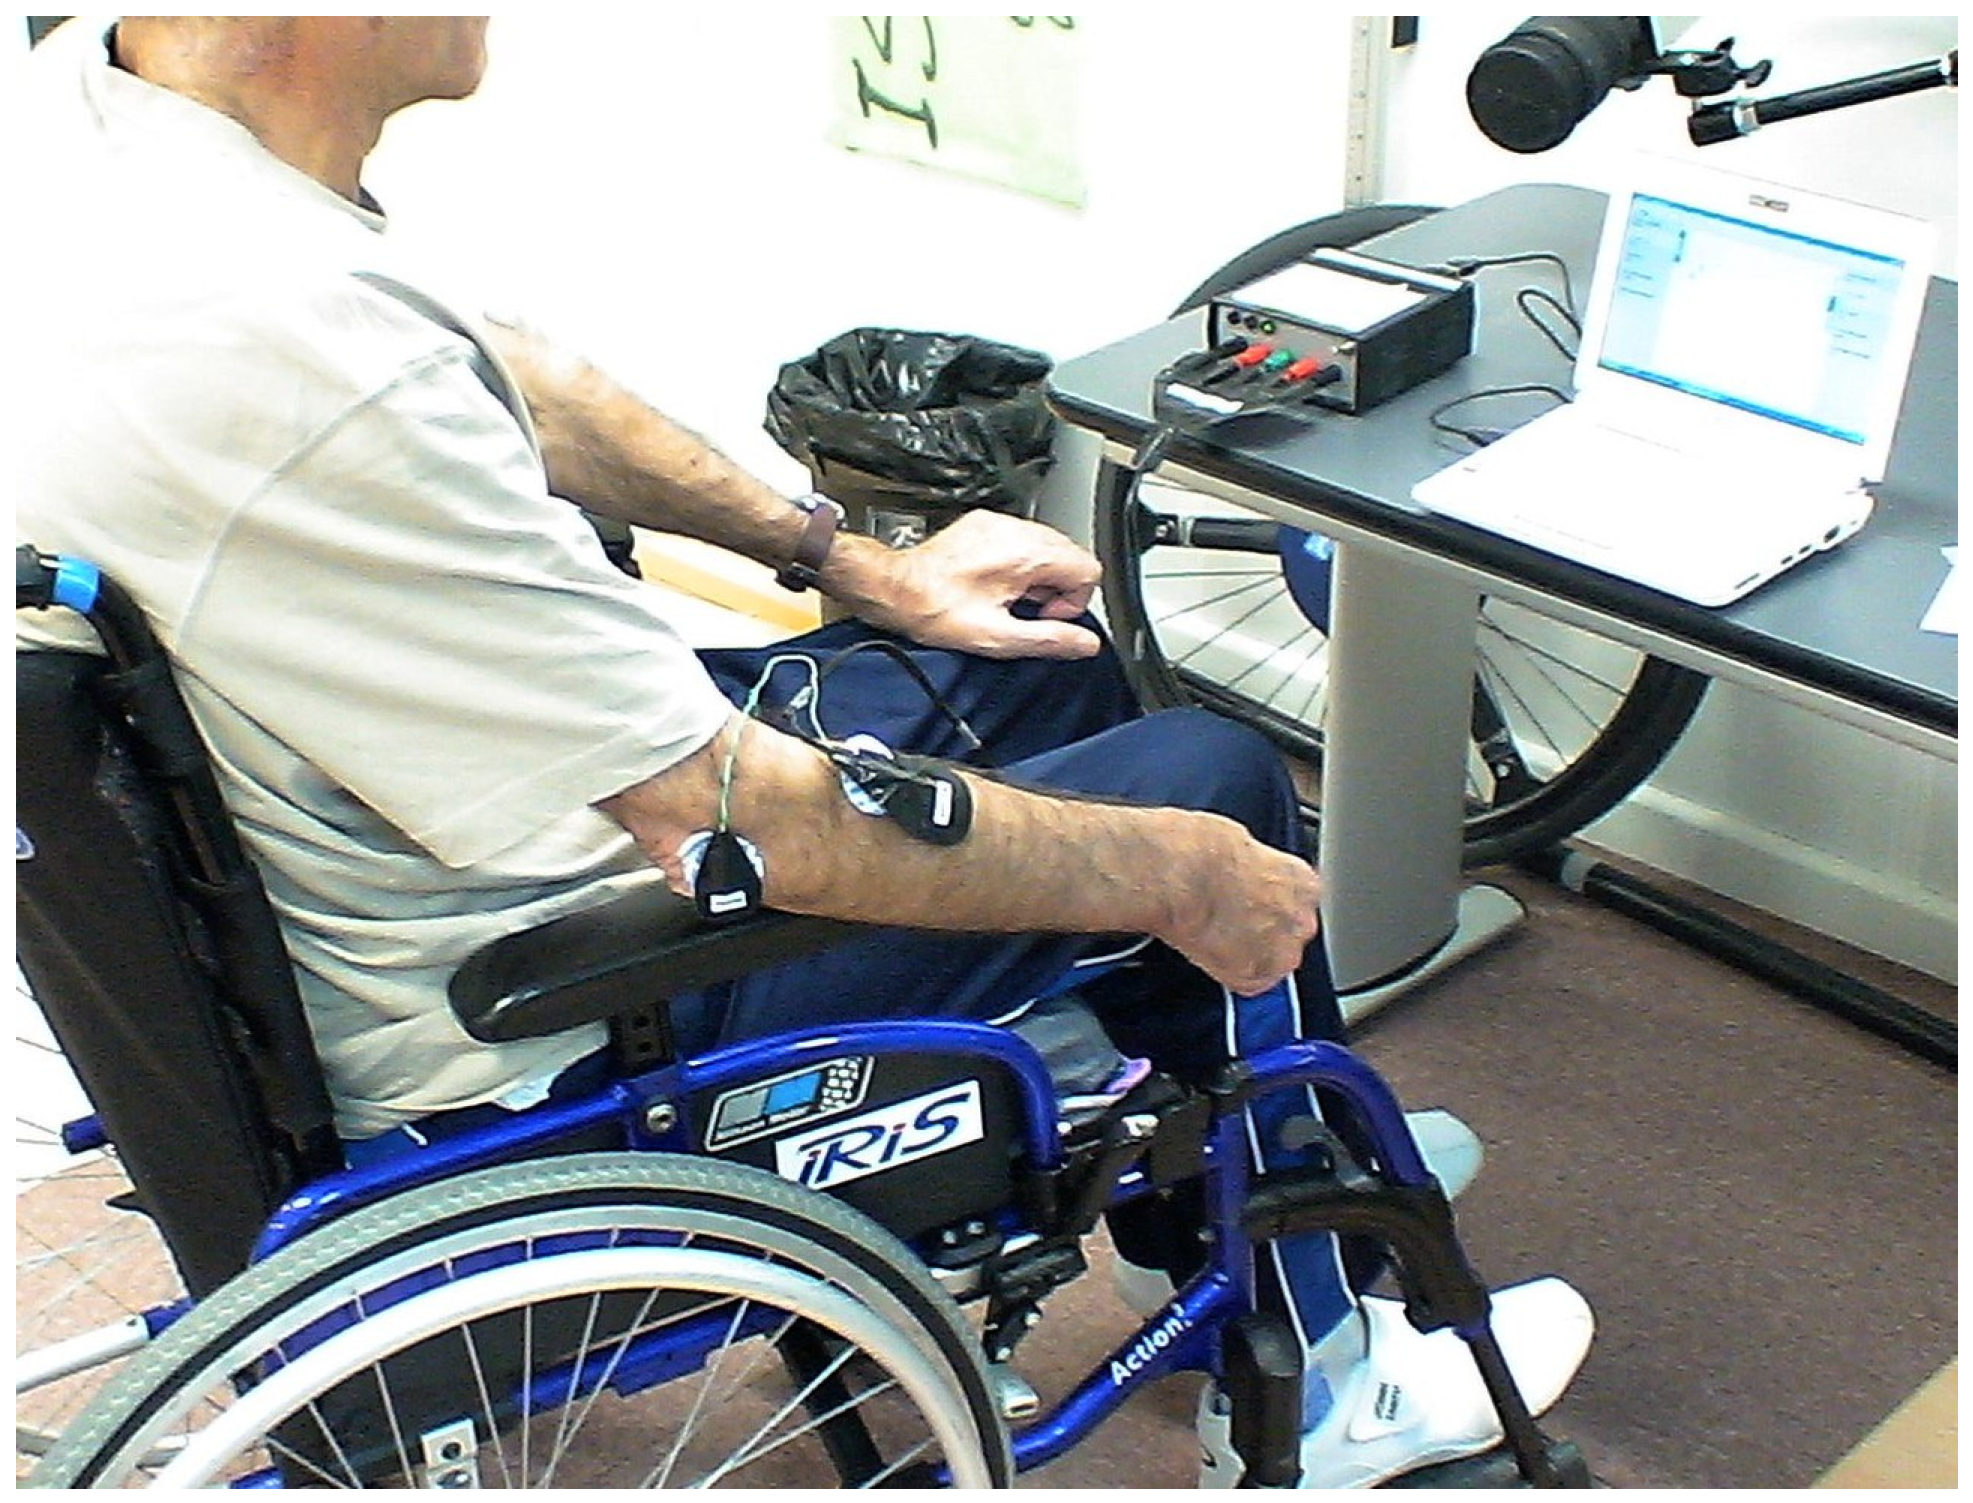
Two antagonistic muscles were selected for the experiment, the flexor and the extensor carpi radialis. Surface myoelectric signals were acquired by the UVa-NTS platform by means of silver/silver chloride recessed electrodes placed over the muscles and a reference electrode on the elbow, as shown in Figure 2. The evaluation protocol was carried out in two different sessions, one week apart each other: The first one aimed at familiarisation, the second one at consolidation.
The system requires a calibration routine aimed at normalising the signal. Thus, in order to check the quality of the EMG, the subject must contract the flexor and the extensor carpi radialis. The EMG strength is checked with the signal viewer and the gain is adjusted if required. Afterwards, a three-step calibration is performed: (i) A baseline calibration with the muscles at rest, (ii) a desired maximum voluntary contraction (DMVC) calibration for the flexor carpi radialis, and (iii) a DMVC calibration for the extensor carpi radialis. Rather than working with a maximal voluntary contraction (MVC), the DMVC is chosen as an isometric sub-maximal MVC close to the MVC, yet comfortable. The MVC is not always a true maximum, it can be fatiguing and uncomfortable [13,14].
The familiarisation session started with the calibration routine. Afterwards, the state navigator was opened so the patient could locate five targets, as shown in Figure 3, by contracting his or her muscles isometrically: One at rest (located on the top left), one at DMVC for flexor (on the right), one at DMVC for extensor (at the bottom), and the remaining two targets were intended for the desired medium contraction (DMC) of the muscles. The patient was given the option to combine both muscles in order to fix the two DMC targets comfortably. Crosstalk was usually detected during the DMVC target location as a deviation from the axes. We define the crosstalk as the interference in the EMG from the antagonistic muscle through the limb tissues. Likewise, a combination of EMG activity from both muscles and crosstalk was also detected during simultaneous flexor and extensor contraction when locating the DMC targets.
Once the targets were located, the patient went through the five targets. This routine started on the rest target. Then, the patient went to the first target where he or she had to achieve a stay of three seconds (ToT). Once the target was achieved, the patient relaxed to the rest target and stayed there again for ToT, i.e., three seconds. This sequence was repeated for the remaining three targets to complete the routine. The routine was performed four times (four rounds) and the whole duration, NT, was timed. After a five-minutes rest interval, the whole exercise was repeated and timed again. NT is defined in Equation (1), so n is the target number and m is the round number.
N T = m = 1 4 n = 1 4 T R T m n + T R m n + 2 · T o T
The familiarisation session ended with the Myo-Pong tool. The game was played for five minutes with a paddle size of 0.25 (1 is the size of the side wall) and a speed of 8.4 bounces per minute on each side. After these five minutes, the achieved success rate was displayed and annotated for each of the two muscles.
The consolidation session repeated the familiarisation session activities one week later and ended with a new task. This task consisted in playing the Myo-Pong game with an increased level of difficulty for five minutes. Thus, the ball speed was 1.3 times faster and the paddle size was decreased 1.25 times, i.e., to a size of 0.20. After the elapsed time, the success rate achieved was also annotated for evaluation.

2.5. Data Analysis

Two performance indexes were studied: Navigation time for the state navigator and the success rate for the Myo-Pong tool. The obtained data was analysed statistically to assess the evolution of the subjects between trials and to compare the patients with the CS. The evolution of the subjects within class was analysed by a t-test, so normality in the distributions was assumed. The interclass comparison, i.e., between CS and patients, required a previous F-test to check the variances of the distributions. From the obtained result, a standard t-test was applied when the F-test satisfied the hypothesis of equal variances. Otherwise, a Welch t-test was applied to compare the populations. For all these tests, it was assumed p = 0.05 as the threshold for the null hypothesis [15]. The populations’ data distributions were displayed in the corresponding box plots below, where the percentile 75, the median, and the percentile 25 were depicted in a box. These box and whisker plots show the range of each distribution and the atypical cases. The atypical cases, marked with asterisks, are located over the percentile 75 plus the box height or under the percentile 25 extended downwards from the box height. These box plots showed that the distributions were approximately symmetrical, so the t-test validity could be assumed [15]. Both for the state navigator and for the Myo-Pong tool, the maximum, minimum, and mean values of the performance indexes, i.e., NT and SR, were also depicted for each trial, both for the patients and for the CS. This permitted a comparison of the populations’ response to the tools.

3. Results

This section analyses the performance of the subjects in terms of the NT index obtained from the state navigator and the SR index from the Myo-Pong tool. The evolution is compared between trials and between populations by means of the statistical analyses described above.

3.1. Evolution with the State Navigator

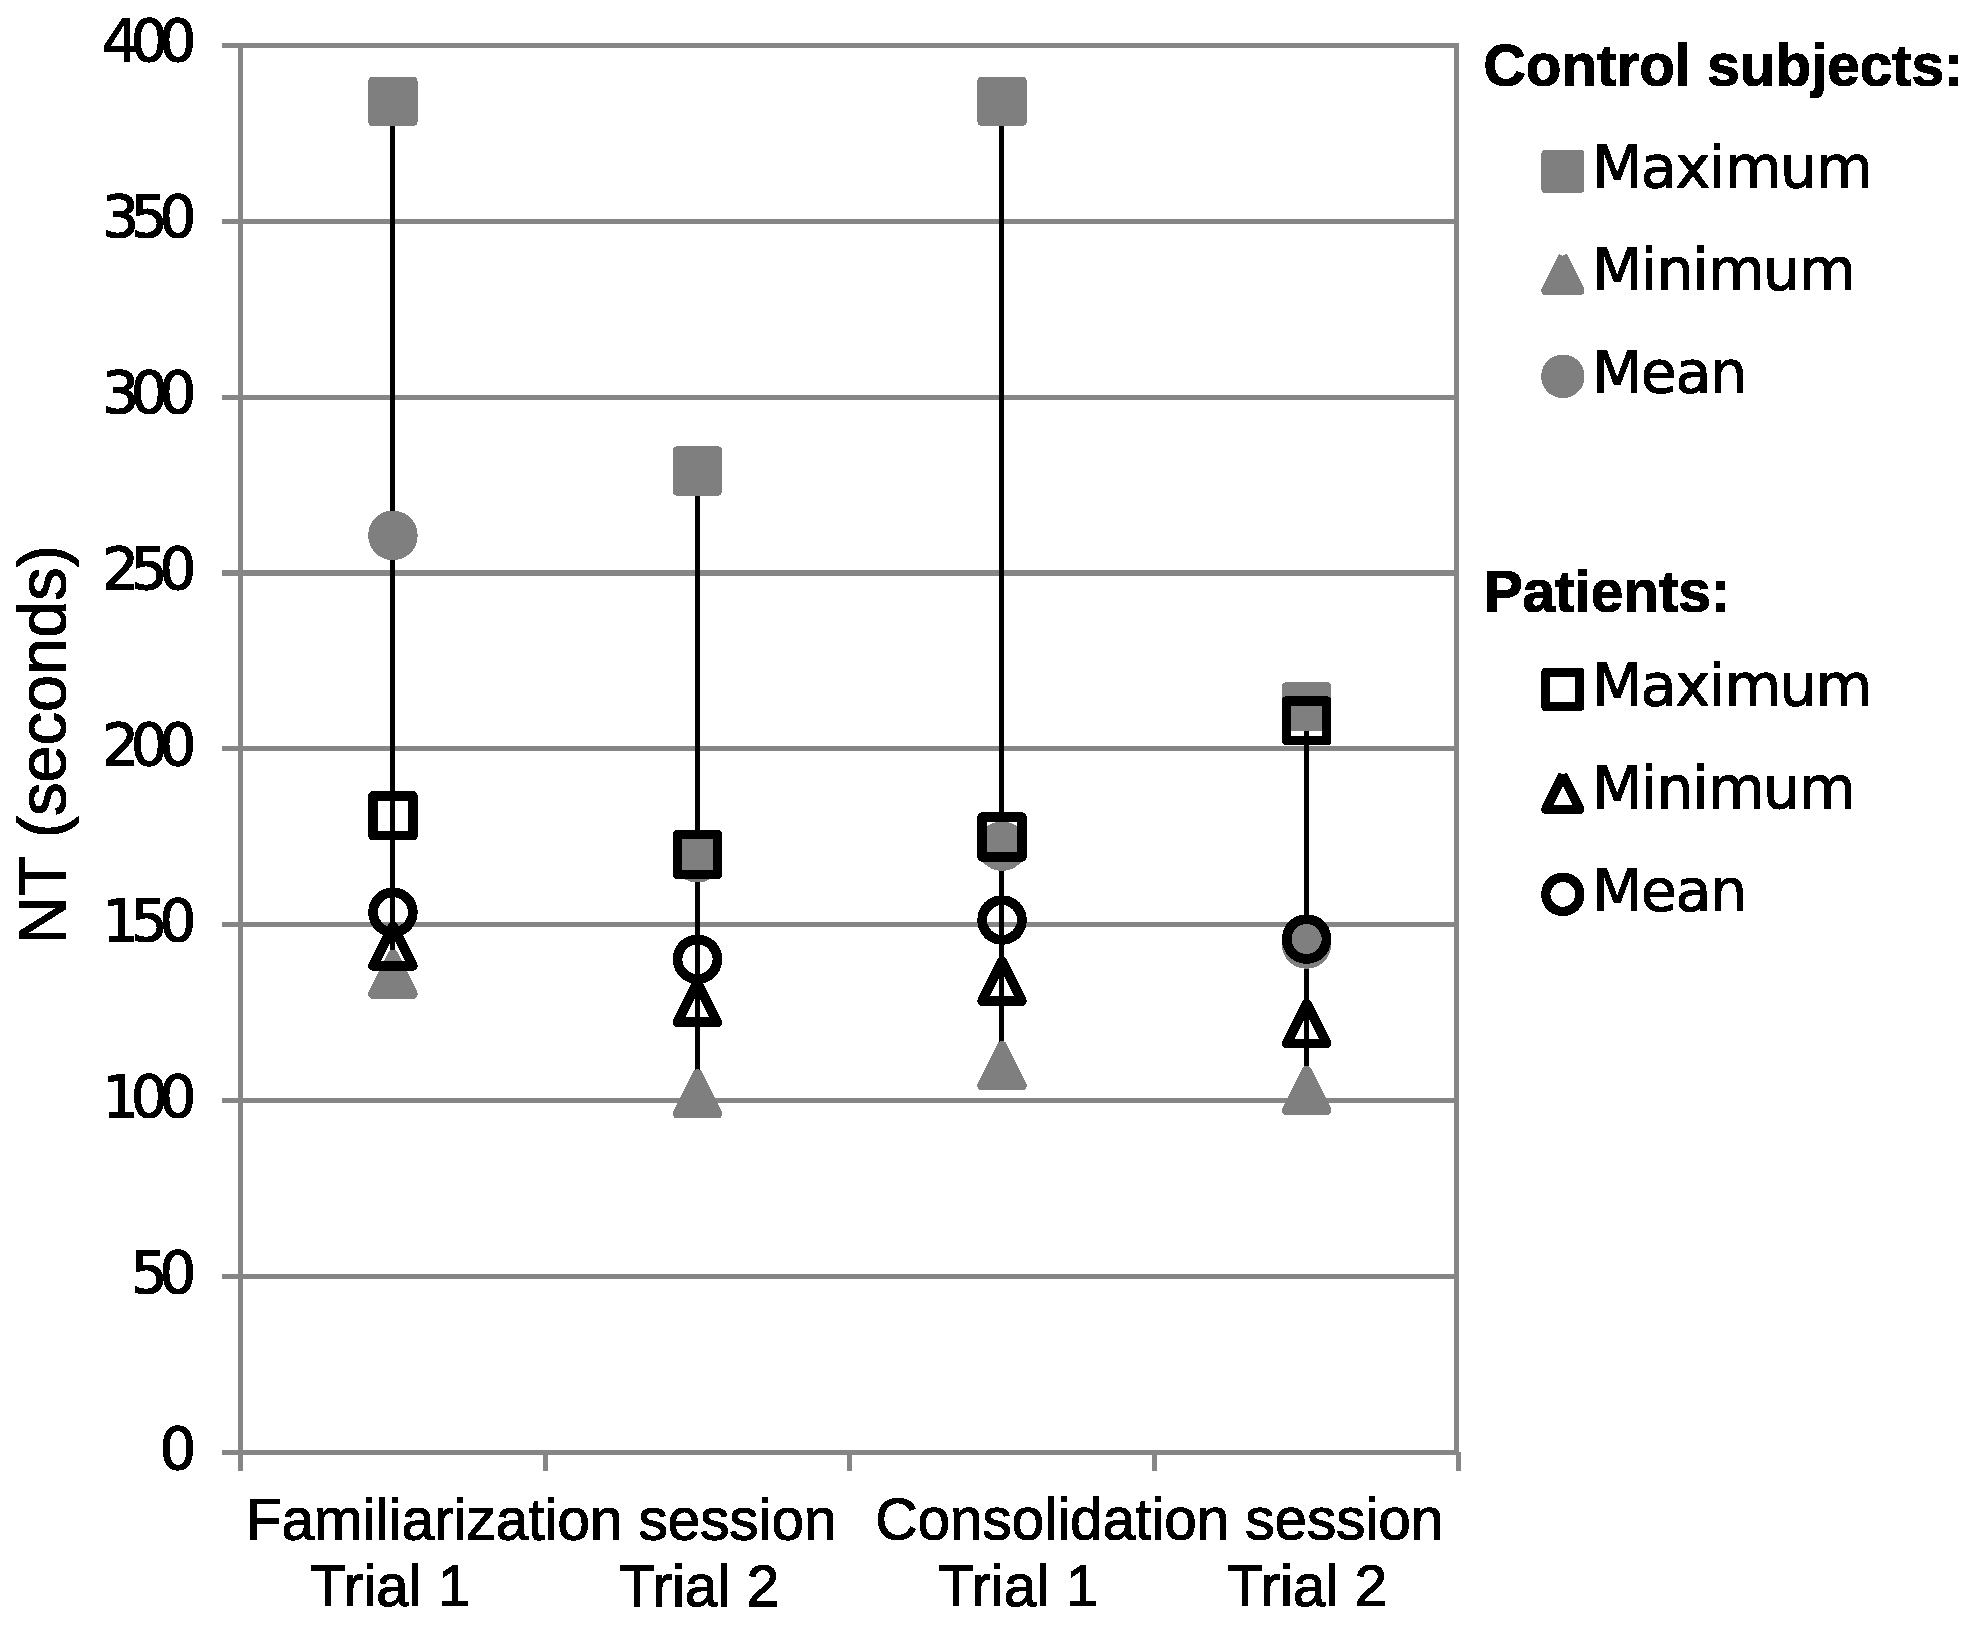
Two trials with the state navigator took place in each session. Figure 4 summarises the evolution in the timings for the four trials, both for the patients and the CS. These timings permit an analysis of the improvement between sessions.
To properly compare the improvement between trials for each population, we performed a statistical analysis. The comparison reveals an improvement in the familiarisation session, i.e., between the first and the second trial, for both patients (p = 0.007) and CS (p < 0.001). However, this improvement is not achieved in the consolidation session, neither for the patients (p = 0.629) nor for the CS (p = 0.066).
The evolution between sessions reveals an improvement in the NT only for the CS for the first trials (p = 0.002), i.e., between trial 1 of session 1 and between trial 1 of session 2. This improvement is not obtained for the patients in the first trials (p = 0.505). The comparison between second trials, i.e., between trial 2 of session 1 and between trial 2 of session 2, does not provide any improvement neither for the CS (p = 0.164) nor for the patients (p = 0.277).

3.2. Adaptation to the State Navigator

The difference between the maximum and minimum NT, displayed in Figure 4, is lower and more homogeneous for the patients than for the CS. Hence, the variances are probably lower for the patients than for the CS.
The state navigator task reveals differences in the performance index NT, shown in Figure 4, between patients and CS in the initial trials. These differences are reduced when going towards the consolidation session.
The patients performed better in the first trial of the familiarisation session (p < 0.001), assuming unequal variances (p = 0.007 F(15,4) = 24.554). This difference between populations is reduced in the second trial (p = 0.284), assuming the same variances (p = 0.151 F(15,3) = 6.399).
There is no observed difference between populations during the consolidation session, with p = 0.297 for the first trial, assuming unequal variances (p = 0.009 F(14,4) = 21.156), and p = 0.93 for the second trial, assuming the same variances (p = 0.538 F(14,4) = 0.689).

3.3. Homogeneity of the Populations

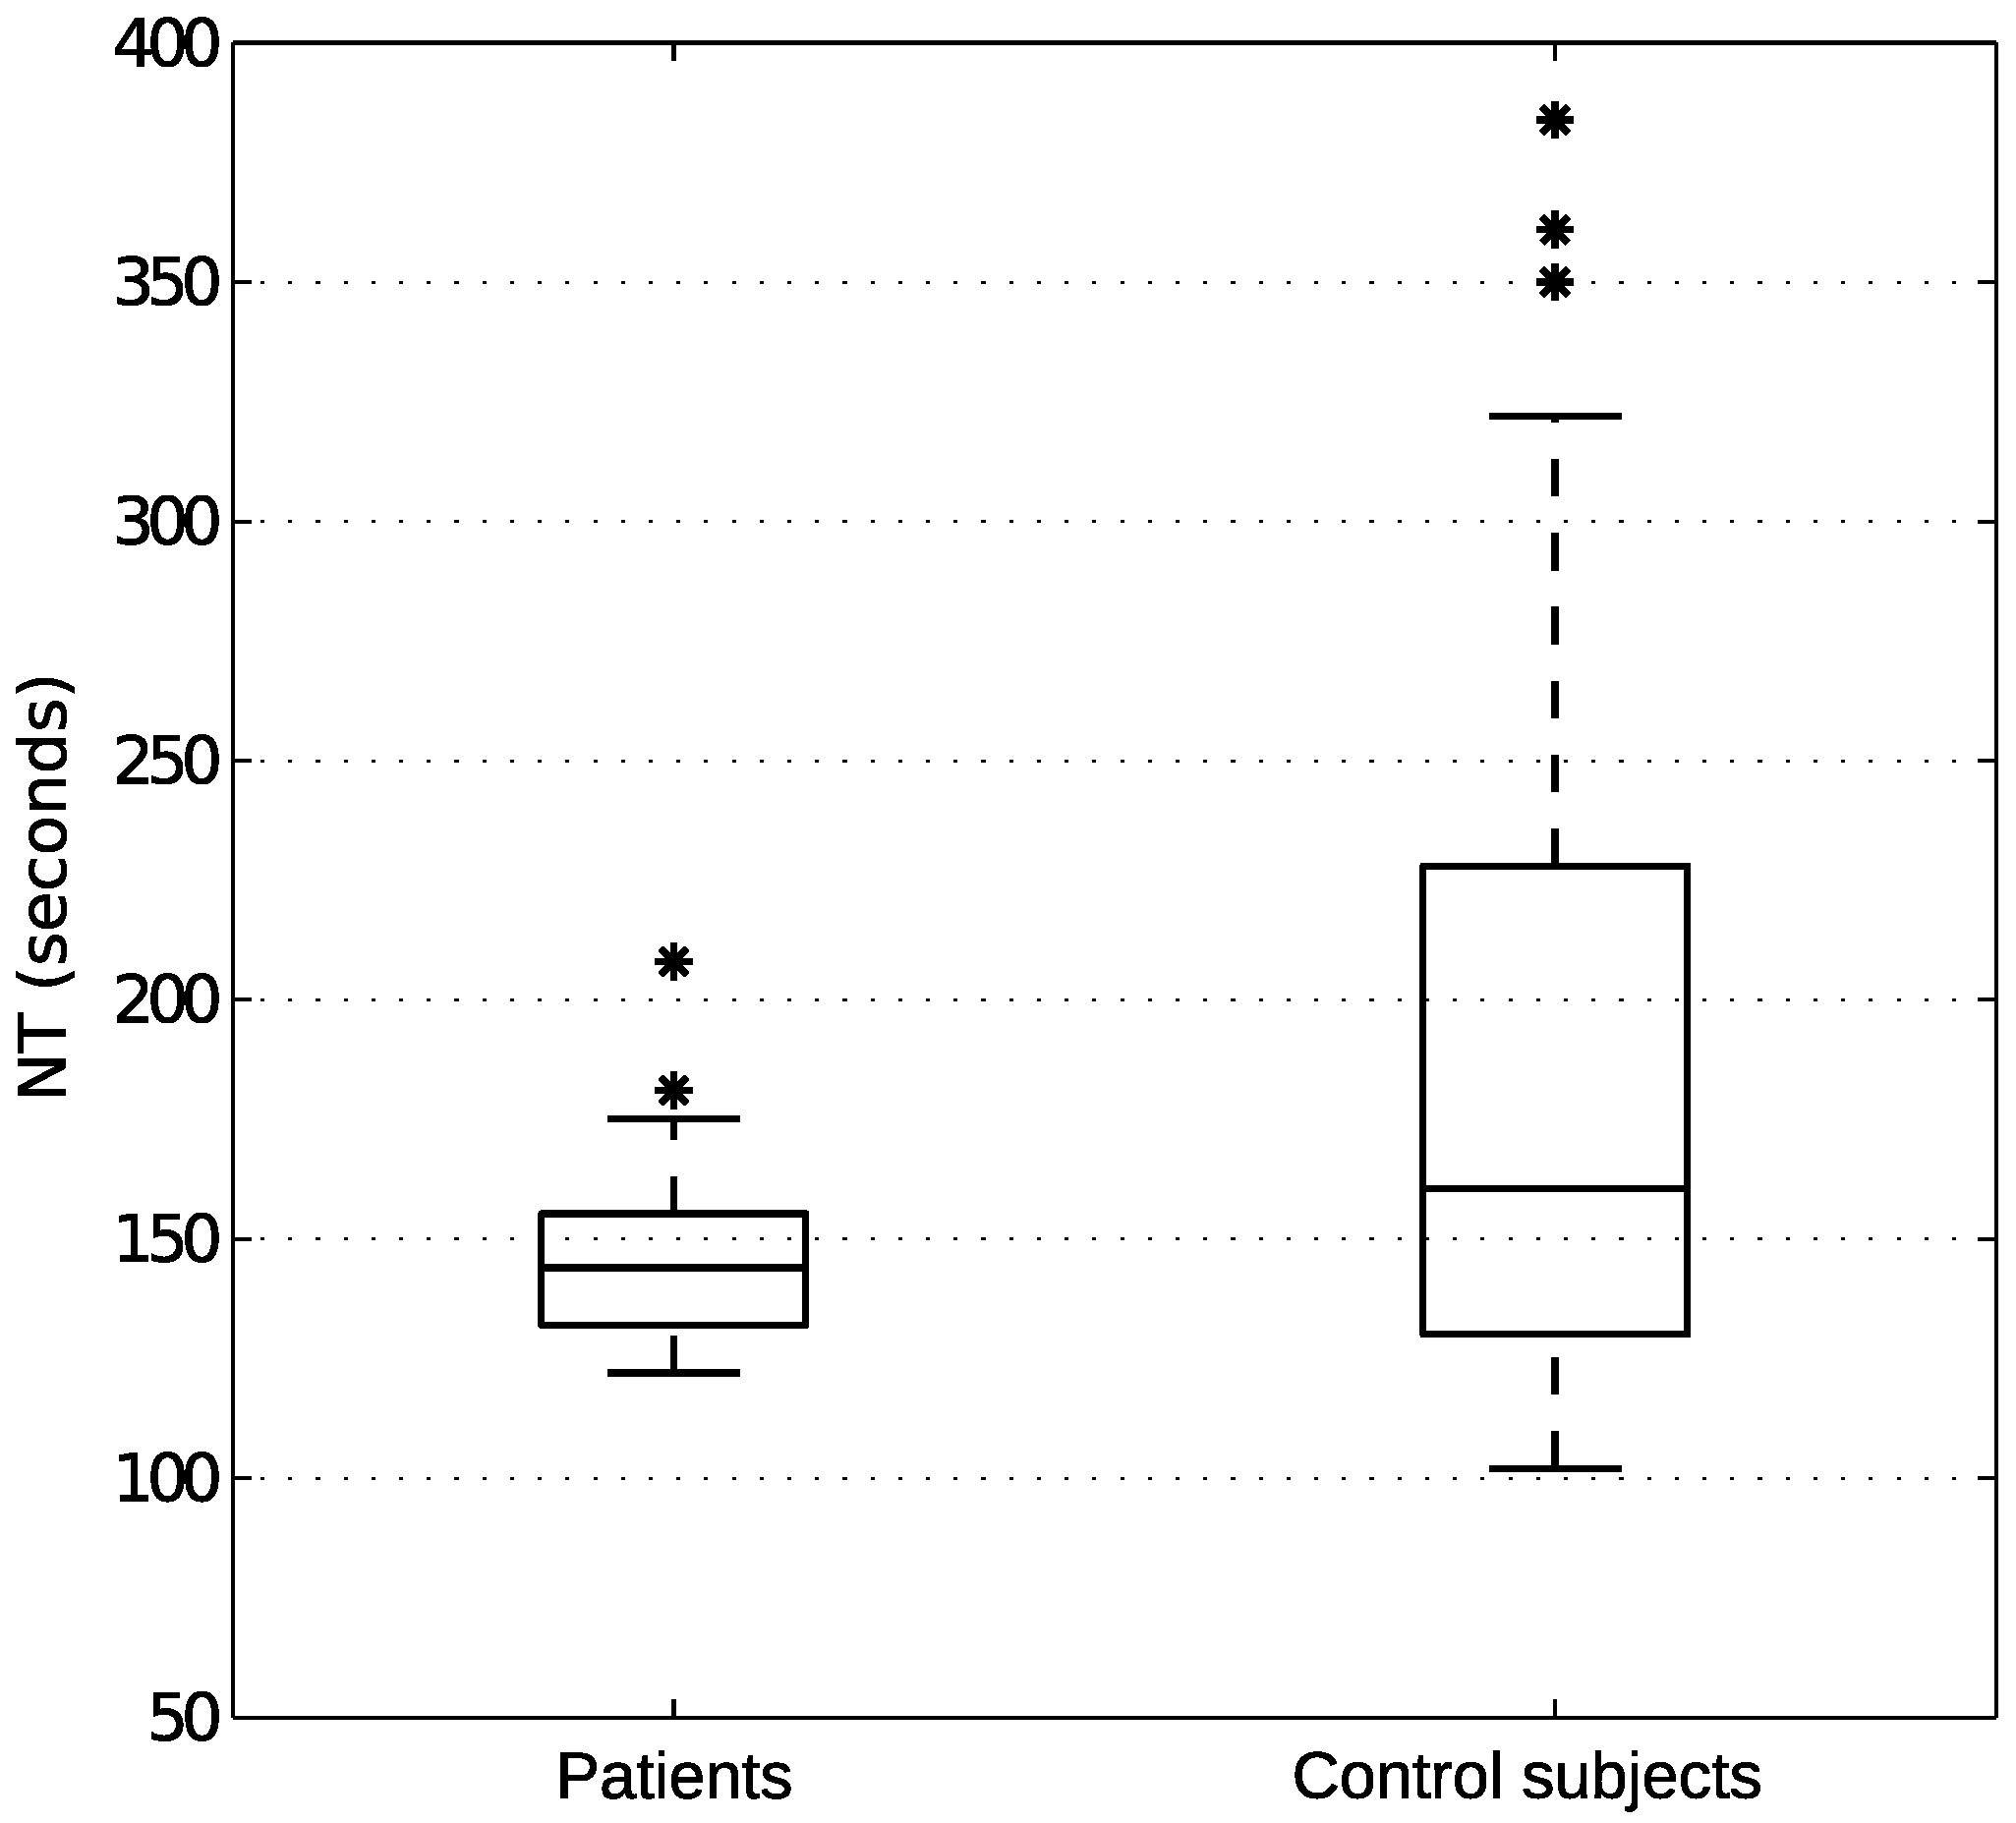
The patients’ group has a more homogeneous behaviour than the control group with the state navigator. This is reinforced in Figure 5, representing the four trials performed by each subject. There is a total of 19 timings for the patients and 62 timings for the CS. Patient number 1 felt tired after the first trial in the familiarisation session so she was not able to perform the second trial.
The range of timings in the patients’ group is 53 s wide. Atypical cases are excluded, i.e., those whose time is over the percentile 75 plus the diagram height. The range of timings in the control group is 216 s wide, with 4 atypical cases on the top. Notwithstanding the range difference between box plots, the medians are similar between patients and CS, i.e., 144 s, and 160.5 s respectively, as shown in Figure 5.

3.4. Evolution with the Myo-Pong Tool

The familiarisation session concluded with the Myo-Pong tool working in low-difficulty mode. The consolidation session concluded with a first trial of Myo-Pong in low-difficulty mode and a second trial in high-difficulty mode. The low-difficulty mode has a lower ball speed than the high-difficulty one, i.e., it takes 3.7 s from wall to wall, as compared with the 2.8 s in high-difficulty. The high-difficulty mode was included in the consolidation session as a new challenge after the previous training in low-difficulty mode.
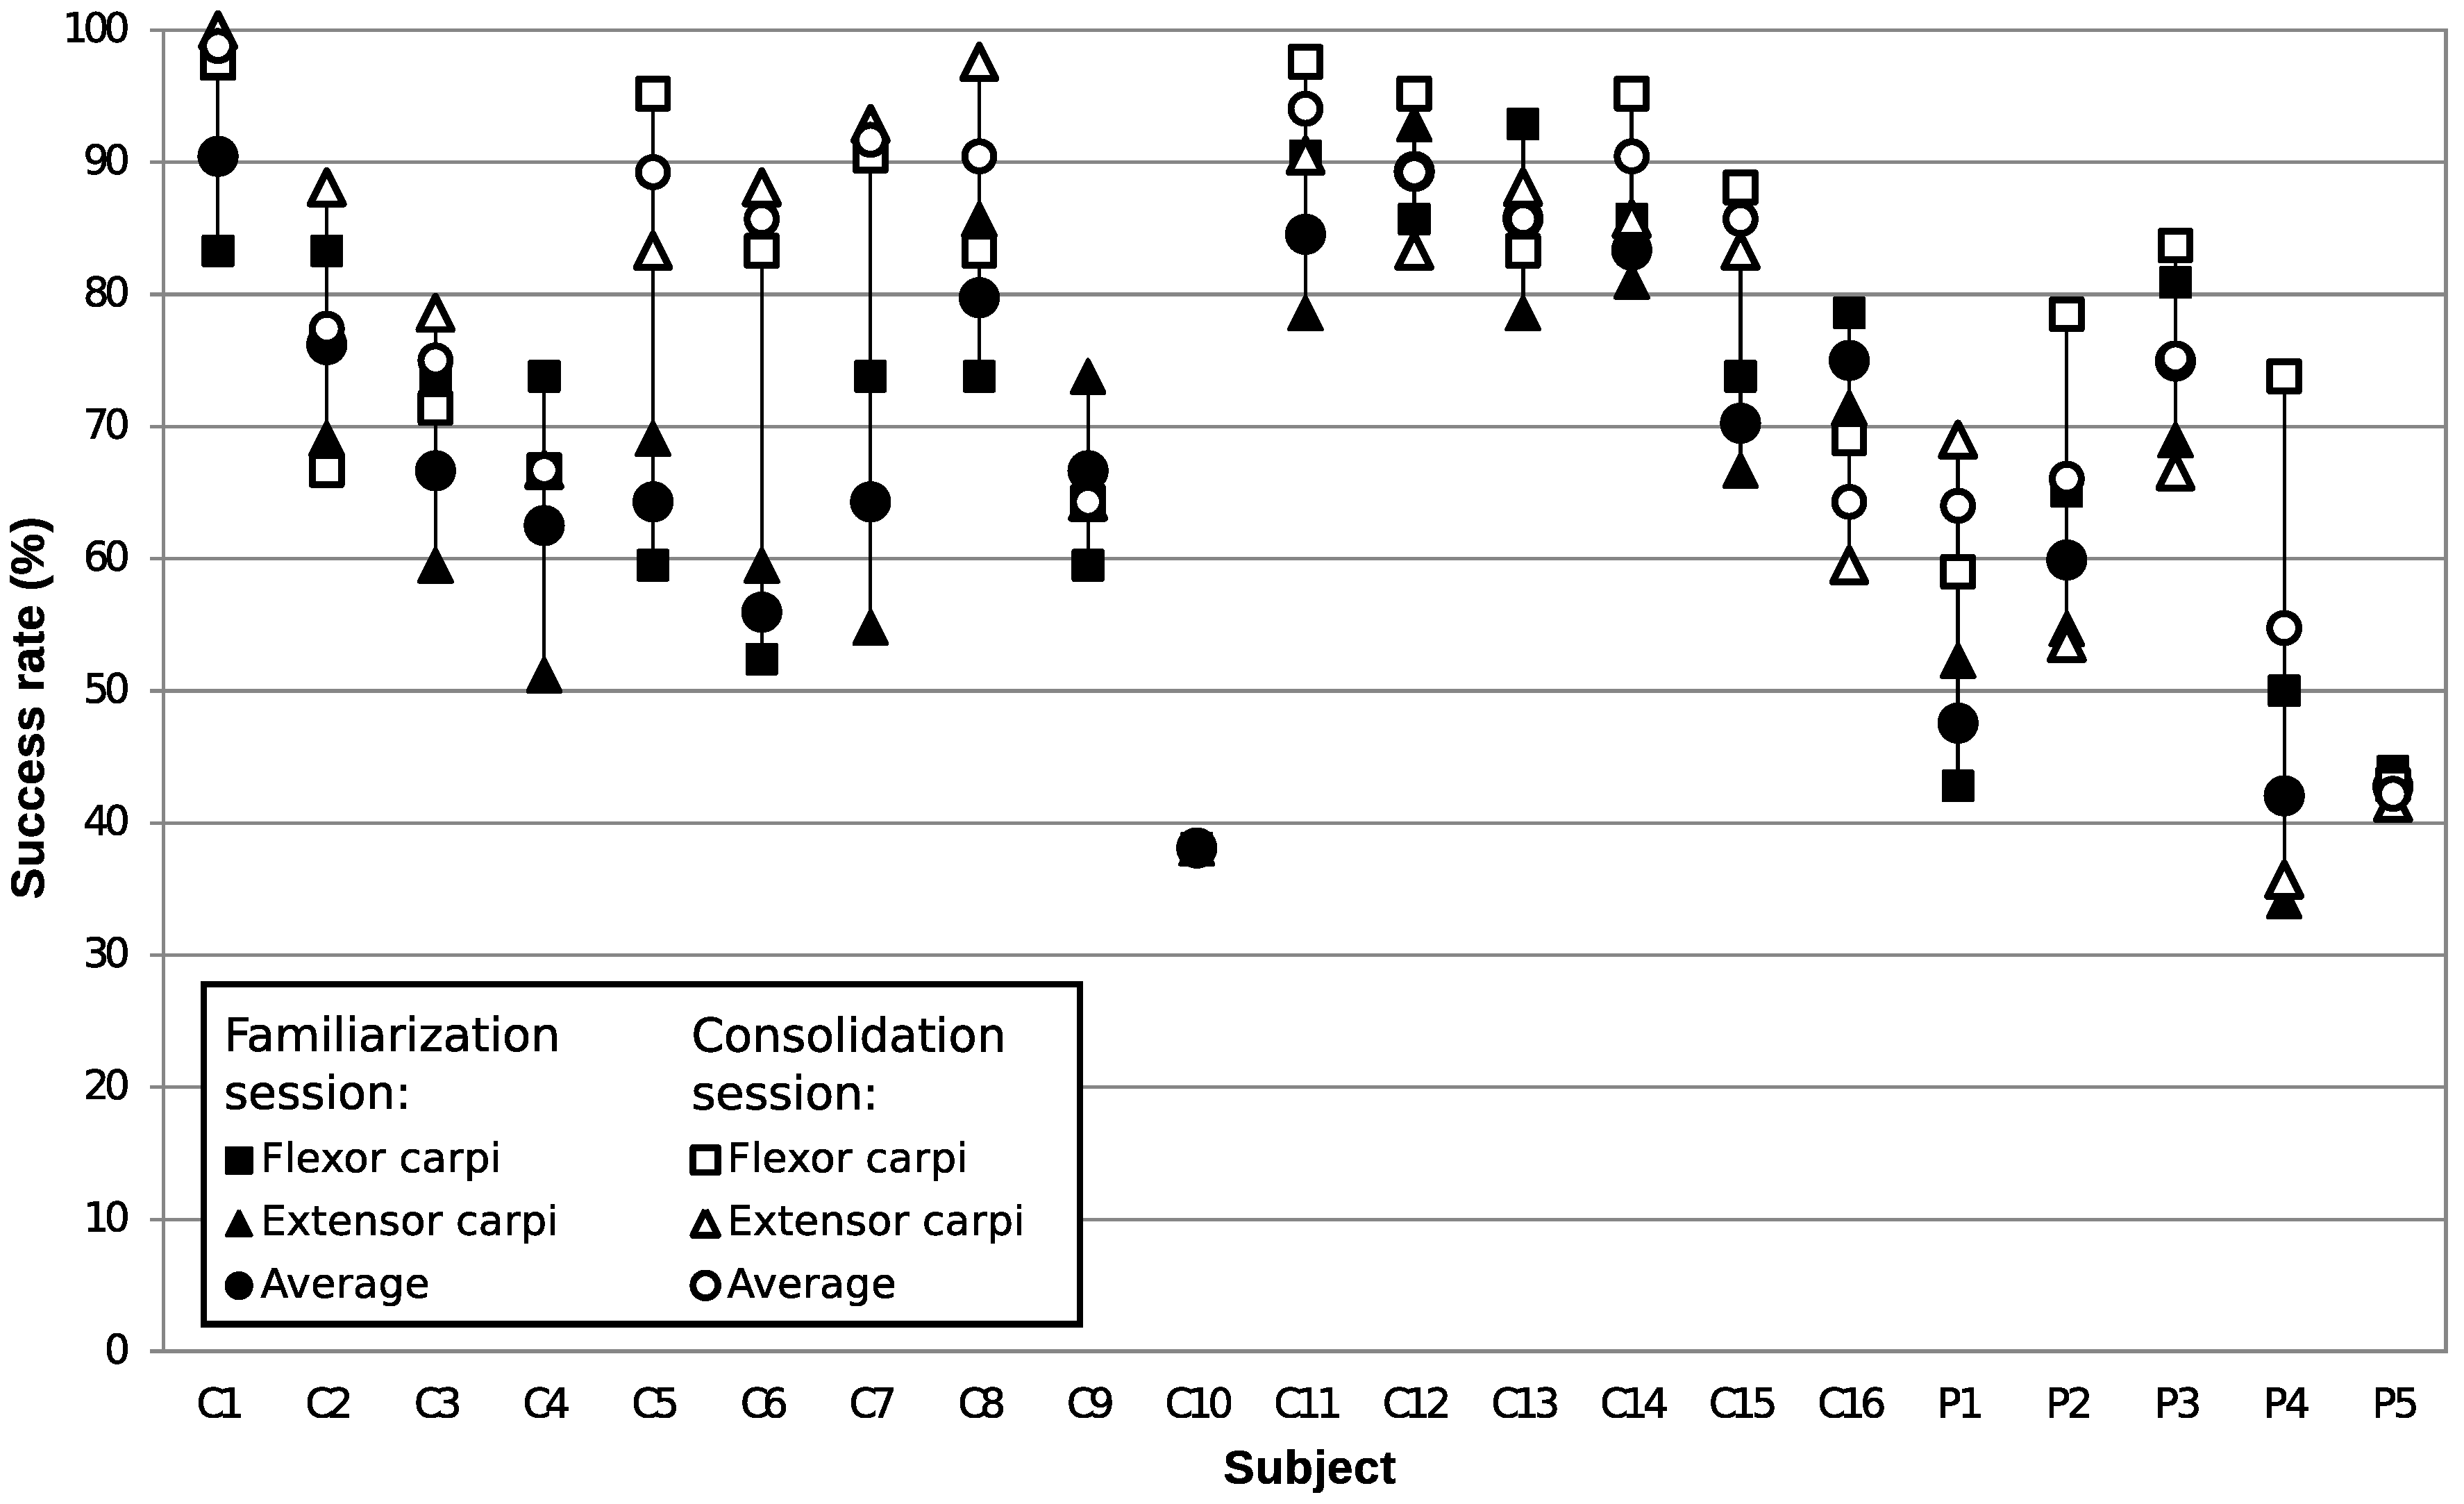
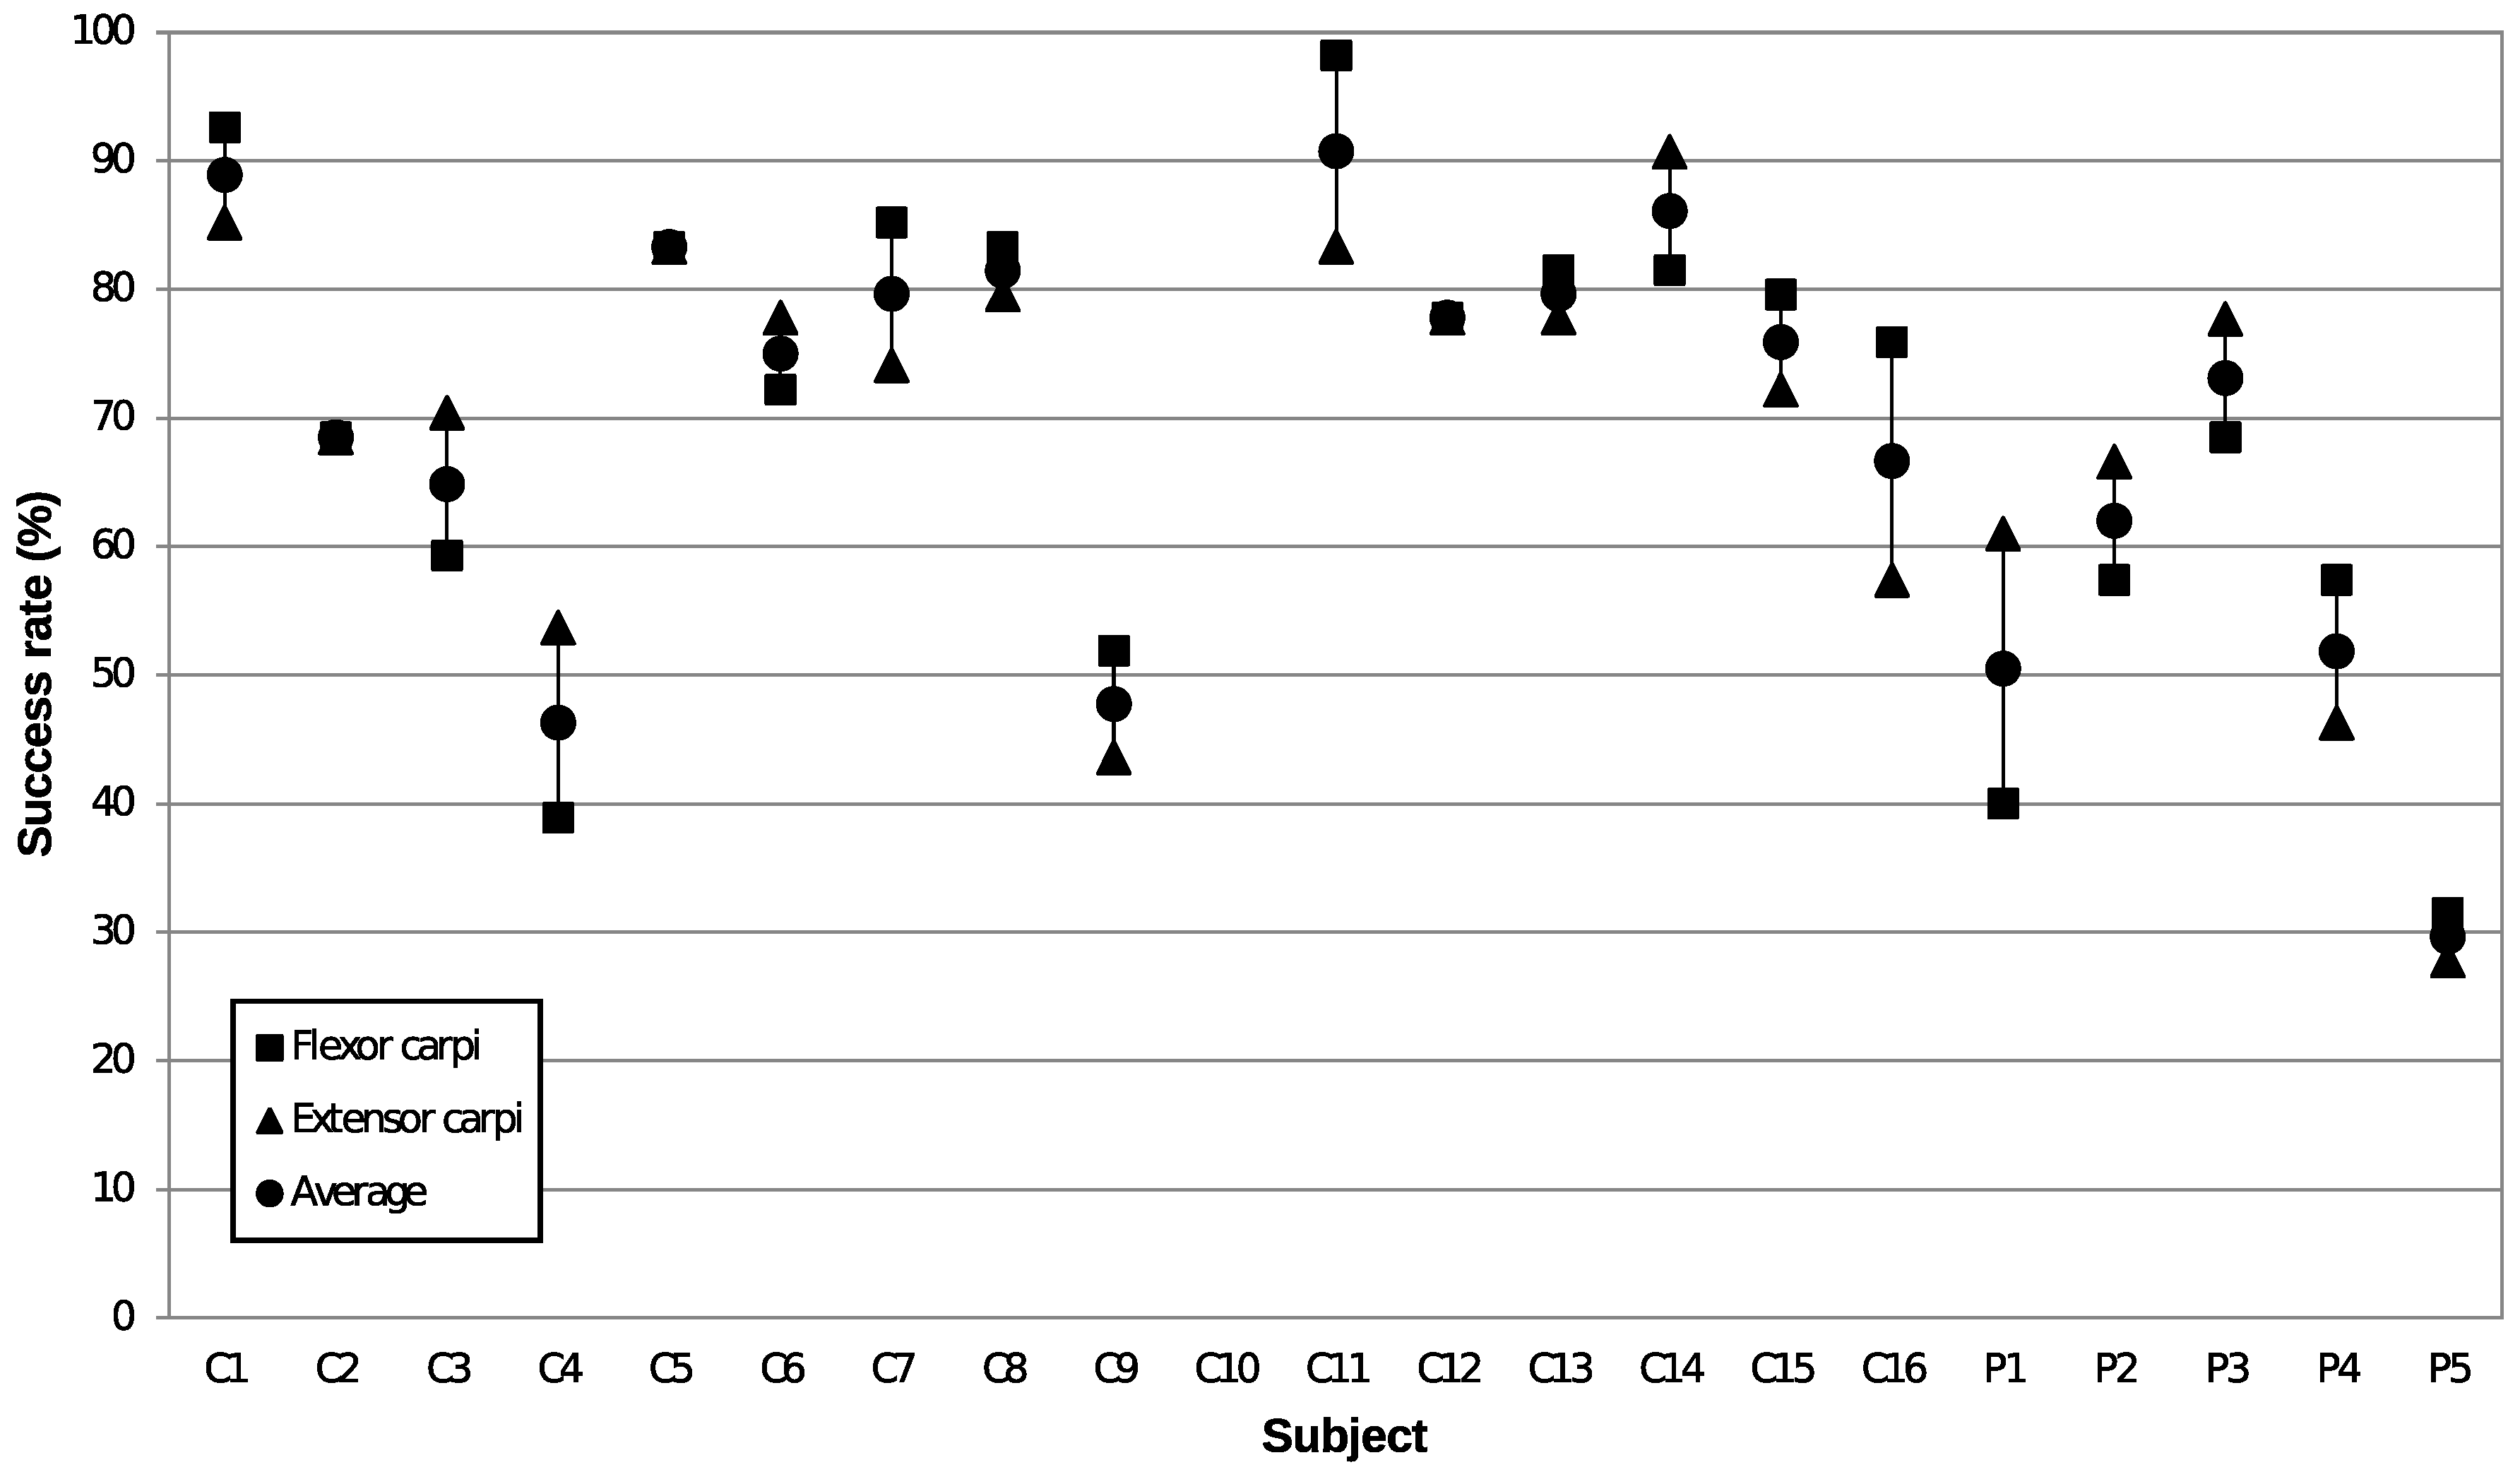
Figure 6 shows the patients and control subjects’ SR for low-difficulty mode. Both muscle groups are represented, flexor carpi radialis and extensor carpi radialis. Maximum, minimum, and mean value are showed for each subject. There is an important improvement in the SR between sessions for the control subjects (p = 0.009). This improvement is not achieved in the patients’ group (p = 0.978).
Figure 7 displays the SR for high-difficulty mode, achieved during the consolidation session. The SR gets worse for the control subjects (p < 0.001) as well as for the patients (p = 0.047). However, when comparing Figure 6 and Figure 7, the SR decrement is slightly smaller for the patients. Both graphs show SR values close to the percentile 100, and the worst cases are around percentile 30. Thus, the Myo-Pong difficulty level was achievable by all the users under trial so the applied settings are adequate. During the tests, one of the CS only performed the first trial of the familiarisation session. She did not enjoy the game and disagreed to participate in further trials. This is reflected under the control subject C10 in Figure 6 and Figure 7.
Two antagonistic muscle groups were employed during the trial. Myo-Pong allows an analysis whether the dexterity is balanced in both muscle groups. The Myo-Pong design is symmetric for both muscles, as both paddles have the same size and run along the same length. The required effort for each paddle to reach the full span is adapted to the DMVC of each muscle group. This adaptation was done in the calibration procedure prior to playing. Table 3 shows the statistical data obtained when comparing both muscle groups in terms of the SR. From these data, both muscle groups show similar means and variances. Thus, the performance between muscles is balanced, i.e., there are no highlights between muscle groups.

3.5. Myo-Pong between Populations

The analysis of the SR in the familiarisation session shows that the control subjects achieved better results than the patients (p = 0.017) for the same variances (p = 0.856, F(15,4) = 0.98). During the consolidation session, in the low-difficulty trial, the CS clearly obtain better results (p = 0.001) with a remarkable difference between populations for the same variances (p = 0.653 F(14,4) = 0.785). In the high-difficulty trial, again, the CS achieved better results (p = 0.010) for the same variances (p = 0.537 F(14,4) = 0.688). In this case, the performance became closer between populations. Hence, the trend is confirmed again: The patients worsened less when increasing the difficulty level. Figure 8 compares the results obtained by CS and patients during the three trials. The first diagram on the left displays a population of 16 CS and 5 patients. The second and third on the right represent 15 CS and 5 patients. These diagrams show that the control subjects’ SR overpass the patients’ SR in the three trials. As expected, the SR decreases when the trial difficulty increases.

4. Discussion

Two set of data have been obtained in these experiments, from the state navigator and from the Myo-Pong game. The DMVC normalisation of the myoelectric signal proved effective to properly command both tools. Hence, the required muscular effort was adapted to the capabilities of each user and a fine control was achieved.
The interactivity of the UVa-NTS platform caused a mayor influence in the training. There is a biofeedback when the user commands myoelectrically the platform, as the outcome is immediately noticed on screen. This allowed a real-time adaptation of the user’s actions to the training platform. Hence, the obtained results are enriched when compared with an off-line analysis, as this feedback is embedded in the results. To our knowledge, there is no relevant literature about applying myoelectric control to gaming, specifically in the rehabilitation of patients with C7 SCI.
There are interactive analyses with myoelectric prostheses in healthy subjects [16]. However, care must be taken with the patients with SCI or even with children, as muscle capabilities are reduced and the prosthesis can be harmful when it is not properly commanded. The myoelectric gaming approach looks very suitable for these cases and research papers can be found describing real-time myoelectric systems with feedback [17]. However, the effectiveness of myoelectric training for adaptation to robotic prostheses can take time and is still under study [18].

4.1. State Navigator

The effectiveness of the normalisation with the DMVC is reflected in state navigator behaviour. The length run by the pointer ranges the full dimensions of the window, and a middle effort locates the pointer in the middle of the specific window dimension, i.e., length or width, as expected.
Each axis of the state navigator is linked to a muscle group. As the muscle groups under trial are antagonistic, the pointer is expected to follow the horizontal or the vertical axis. However, a crosstalk is observed as a deviation from these axes. Thus, the EMG displayed when one muscle is at rest comes mostly from the other near antagonistic muscle. This crosstalk combined with simultaneous flexor and extensor activation is observed in Figure 1, on the top-right window, as the pointer is located in the middle of the window instead of tracking one axis. In addition, Figure 3 shows the target location defined by one of the subjects under trial. The crosstalk and the simultaneous muscle activation is present as the target location is spread over the whole window and not only on the axes. This behaviour was observed in several subjects and can be related to the activation of antagonistic muscles detected in patients with SCI by Cremoux et al. [19]. However, results are not conclusive and require further investigation.
The results obtained with the state navigator, as expected, show that both the control subjects and the patients with SCI can achieve specific efforts repeatedly. Patients achieved better NT timings when they performed specific efforts in successive trials. They have reduced mobility, so they have a limited range of movements and efforts. This fact can make it easier to reproduce each of the required actions. However, this fact limits their evolution and the possible improvement in the timings. Although there is a remarkable difference in the NT of the familiarisation session, the rest of the timings are already too small to expect further improvements, as shown in Figure 4. Conversely, the control subjects are able to reach predefined efforts, although in some cases it is difficult for them to repeat the locking on certain states. However, there is a high degree of adaptation in terms of remarkable improvements in the timings during trials.
The minimum timings reached by both populations are similar. They are slightly higher in the patients’ group due to the reduced mobility and thus, the difficulty to change the muscle efforts. The average timing is higher in the control group in all cases and equal for both groups in the last trial, as shown in Figure 4.

4.2. The Myo-Pong Tool

The crosstalk and the simultaneous muscle activation is also noticed in the Myo-Pong tool. Each paddle is controlled by a muscle group. Then, when one paddle is controlled, the other paddle moves involuntarily due to the crosstalk or the simultaneous isometric muscle contraction. However, the player focuses on the paddle that receives the ball, so the other paddle does not interfere greatly in the game.
The real-time interaction and the visual feedback close the learning loop stimuli-response. This closed loop is not present in non-interactive and a posteriori signal-processing analyses, as the subject does not know immediately the outcome of the performed actions. Thus, an additional factor is incorporated in the rehabilitation procedure [17].
The Myo-Pong tool shows opposing results when compared with the state navigator. The control subjects perform better as this tool assesses the ability to change dynamically the muscle effort, i.e., the muscle responsiveness. However, when the difficulty level is increased, the success rate decreased in both populations.
The comparison between populations shows again that the control subjects have a better evolution. Thus, the mobility restrictions prevent remarkable improvements in the patients with SCI.

5. Conclusions

There is recent research that analyses myoelectric games to facilitate the transfer to a robotic prosthesis [16,18]. However, we were not able to find the literature where myoelectric games are tested with a homogeneous group of patients with SCI with no limb amputation. The performance indexes obtained in this paper are dynamic values influenced by the user’s feedback while operating the myoelectric platform. The user sees in real-time the direct effects of his or her myoelectric activity with a minimum of intermediary systems in the human-machine interface. Furthermore, the value of these indexes is their embedded biofeedback when compared with a posteriori analyses with no real-time myoelectric feedback.
Patients showed fast adaptation to the state navigator in the first trial. The improvement was less remarkable in further trials when compared with the CS, so both populations reached a similar performance. Results depended on the tool: Patients gained a faster adaptation to the state navigator and CS perform better with a more dynamic tool like the Myo-Pong game. Despite these differences, the range of timings and scores was not markedly dissimilar between patients and CS. For most of the users, myoelectric gaming was motivating, which is crucial to keeping a regular, yet occasionally burdensome rehabilitation routine. Hence, it can be a complementary aid during rehabilitation sessions or an amusing inclusion in the daily activities of the user with SCI.

Author Contributions

This investigation was conducted by two teams: One from the UVa and one from the NHPT. The contributions to this research paper were: conceptualization, R.d.l.R. and A.C.; methodology, R.d.l.R., A.A. and A.G.-A.; software, R.d.l.R.; formal analysis, A.C.; investigation, A.C. and B.P.-M.; resources, A.G.-A. and A.C.; writing—original draft preparation, R.d.l.R. and A.C.; writing—review and editing, R.d.l.R., A.C., A.A., A.G.-A. and E.J.A.; visualization, A.C. and R.d.l.R.; supervision, A.A. and E.J.A.

Funding

This research received no external funding.

Conflicts of Interest

The authors declare no conflict of interest.

Abbreviations

The following abbreviations are used in this manuscript:
UVaUniversity of Valladolid (Universidad de Valladolid)
UVa-NTSUVa neuromuscular training system
CSControl subjects
SCISpinal cord injury
EMGElectromyography
VRVirtual reality
NHPTNational Hospital for Paraplegics of Toledo
TRTTime to reach the target
TRTime to rest
ToTTime on target
FTFatigue time
SRSuccess rate
ASAdmissible speed
PCPrecision control
NTNavigation time
DMVCDesired maximum voluntary contraction
MVCMaximal voluntary contraction
DMCDesired medium contraction

References

  1. Snoek, G.J.; IJzerman, M.J.; Hermens, H.J.; Maxwell, D.; Biering-Sorensen, F. Survey of the needs of patients with spinal cord injury: Impact and priority for improvement in hand function in tetraplegics. Spinal Cord 2004, 42, 526–532. [Google Scholar] [CrossRef] [PubMed]
  2. Janssen-Potten, Y.; Seelen, H.; Bongers-Janssen, H.; van der Woude, L. Assessment of upper extremity muscle function in persons with tetraplegia. J. Electromyogr. Kinesiol. 2008, 18, 516–526. [Google Scholar] [CrossRef] [PubMed]
  3. Colombo, R.; Pisano, F.; Mazzone, A.; Delconte, C.; Micera, S.; Carrozza, M.C.; Dario, P.; Minuco, G. Design strategies to improve patient motivation during robot-aided rehabilitation. J. NeuroEng. Rehabil. 2007, 4, 3. [Google Scholar] [CrossRef] [PubMed]
  4. Van de Meent, H.; Baken, B.; Van Opstal, S.; Hogendoorn, P. Critical illness VR rehabilitation device (X-VR-D): Evaluation of the potential use for early clinical rehabilitation. J. Electromyogr. Kinesiol. 2008, 18, 480–486. [Google Scholar] [CrossRef] [PubMed]
  5. Armagan, O.; Tascioglu, F.; Oner, C. Electromyographic Biofeedback in the Treatment of the Hemiplegic Hand. Am. J. Phys. Med. Rehabil. 2003, 82, 856–861. [Google Scholar] [CrossRef] [PubMed]
  6. Lim, H.K.; Sherwood, A.M. Reliability of surface electromyographic measurements from subjects with spinal cord injury during voluntary motor tasks. J. Rehabil. Res. Dev. 2005, 42, 413. [Google Scholar] [CrossRef] [PubMed]
  7. Song, R.; Tong, K.-Y.; Hu, X.; Li, L. Assistive Control System Using Continuous Myoelectric Signal in Robot-Aided Arm Training for Patients After Stroke. IEEE Trans. Neural Syst. Rehabil. Eng. 2008, 16, 371–379. [Google Scholar] [CrossRef] [PubMed] [Green Version]
  8. De la Rosa, R.; Alonso, A.; Carrera, A.; Durán, R.; Fernández, P. Man-machine interface system for neuromuscular training and evaluation based on EMG and MMG signals. Sensors 2010, 10, 11100–11125. [Google Scholar] [CrossRef] [PubMed]
  9. Maynard, F.M., Jr.; Bracken, M.B.; Creasey, G.; Ditunno, J.F., Jr.; Donovan, W.H.; Ducker, T.B.; Garber, S.L.; Marino, R.J.; Stover, S.L.; Tator, C.H.; et al. International Standards for Neurological and Functional Classification of Spinal Cord Injury. Spinal Cord 1997, 35, 266–274. [Google Scholar] [CrossRef] [PubMed] [Green Version]
  10. Carrera, A.; de la Rosa, R.; Alonso, A. Programmable gain amplifiers with DC suppression and low output offset for bioelectric sensors. Sensors 2013, 13, 13123–13142. [Google Scholar] [CrossRef] [PubMed]
  11. Johnson, M.J.; Feng, X.; Johnson, L.M.; Winters, J.M. Potential of a suite of robot/computer-assisted motivating systems for personalized, home-based, stroke rehabilitation. J. NeuroEng. Rehabil. 2007, 4, 6. [Google Scholar] [CrossRef] [PubMed]
  12. De la Rosa, R.; Alonso, A.; de la Rosa, S.; Abasolo, D. Myo-Pong: A neuromuscular game for the UVa-neuromuscular training system platform. In Proceedings of the 2008 Virtual Rehabilitation, Vancouver, BC, Canada, 25–27 August 2008; p. 61. [Google Scholar] [CrossRef]
  13. Yang, J.F.; Winter, D.A. Electromyography reliability in maximal and submaximal isometric contractions. Arch. Phys. Med. Rehabil. 1983, 64, 417–420. [Google Scholar] [PubMed]
  14. Yang, J.F.; Winter, D.A. Electromyographic amplitude normalization methods: Improving their sensitivity as diagnostic tools in gait analysis. Arch. Phys. Med. Rehabil. 1984, 65, 517–521. [Google Scholar] [PubMed]
  15. Dowdy, S.; Weardon, S.; Chilko, D. Statistics for Research, 3rd ed.; Wiley Series in Probability and Statistics; John Wiley & Sons, Inc.: Hoboken, NJ, USA, 2004; p. 627. [Google Scholar]
  16. Van Dijk, L.; van der Sluis, C.K.; van Dijk, H.W.; Bongers, R.M. Learning an EMG Controlled Game: Task-Specific Adaptations and Transfer. PLoS ONE 2016, 11, e0160817. [Google Scholar] [CrossRef] [PubMed]
  17. Karlsson, S.; Erlandson, B.E.; Gerdle, B. A Personal Computer-based System for Real-time Analysis of Surface EMG Signals during Static and Dynamic Contractions. J. Electromyogr. Kinesiol. 1994, 4, 170–180. [Google Scholar] [CrossRef]
  18. Tabor, A.; Bateman, S.; Scheme, E. Evaluation of Myoelectric Control Learning Using Multi-Session Game-Based Training. IEEE Trans. Neural Syst. Rehabil. Eng. 2018, 26, 1680–1689. [Google Scholar] [CrossRef] [PubMed]
  19. Cremoux, S.; Amarantini, D.; Tallet, J.; Dal Maso, F.; Berton, E. Increased antagonist muscle activity in cervical SCI patients suggests altered reciprocal inhibition during elbow contractions. Clin. Neurophysiol. 2016, 127, 629–634. [Google Scholar] [CrossRef] [PubMed]
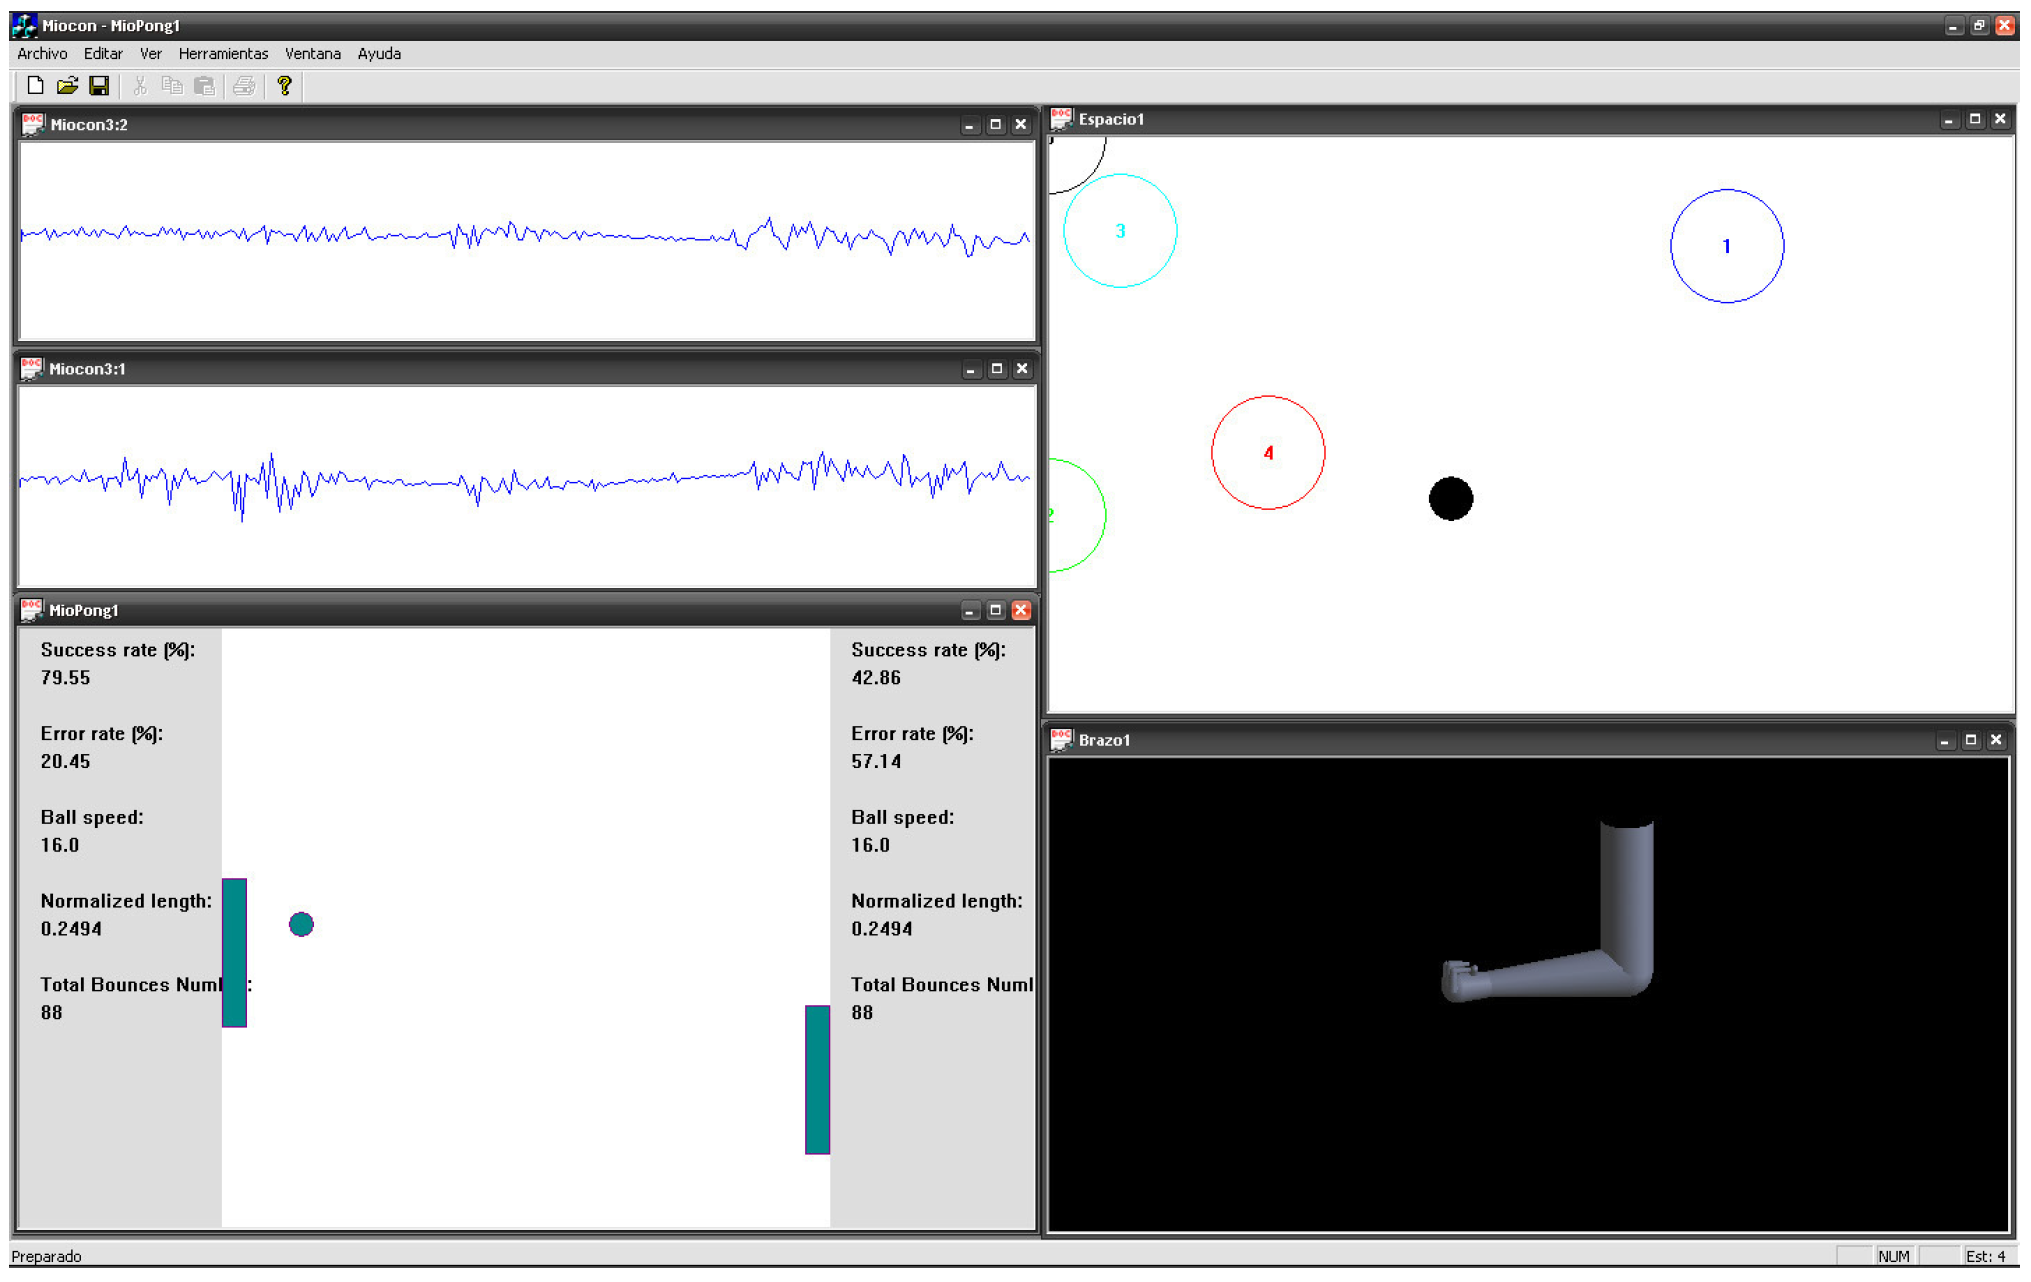
Figure 1. Tools in the UVa-NTS. Top left: signal viewer split in two graphs displaying the electromyography (EMG) signals from two muscles; top right: state navigator, where the rest point is the upper left corner and the pointer is centred due to the muscles effort; bottom right: virtual arm that moves when the state navigator pointer reaches a target; bottom left: Myo-Pong where the two paddles, due to the muscles’ activity, are displaced from the rest sites located at the top of each side.
Applsci 09 01912 g001
Figure 2. Patient working with the UVa-NTS platform. Surface EMG electrodes were located on the forearm: On the flexor carpi radialis, on the extensor carpi radialis, and the reference electrode was on the elbow.
Applsci 09 01912 g002
Figure 3. Target location on the state navigator tool: ’0’ (top left corner) is the rest state, ’1’ is the desired maximum voluntary contraction (DMVC) for the flexor carpi radialis, ’2’ is near the DMVC for the extensor carpi radialis, ’3’ is the desired medium contraction (DMC) for the flexor carpi radialis, and ’4’ is the DMC for a combination of flexor and extensor. Crosstalk can be noticed in ’1’, ’2’, and ’3’ as a deviation from the axes and simultaneous muscle activation in ’4’. The residual EMG activity slightly displaces the pointer downwards from the rest state.
Applsci 09 01912 g003
Figure 4. Performance index navigation time (NT) for the four trials with the state navigator tool for both the control subjects and the patients. Maximum, minimum, and mean of the NT values are displayed.
Applsci 09 01912 g004
Figure 5. Box plot that summarises the four trials performed by each subject. A total of 19 patients’ timings and 62 control subjects’ timings is represented. Atypical cases, marked with asterisk, are excluded.
Applsci 09 01912 g005
Figure 6. Success rate (SR) for the Myo-Pong at low difficulty. C is for the control subjects. P is for the patients. C10 played in the familiarisation session for just a short time.
Applsci 09 01912 g006
Figure 7. SR for the Myo-Pong at high difficulty during the consolidation session. C10 did not play in this session.
Applsci 09 01912 g007
Figure 8. Box plot that summarises the performance between patients and control subjects (CS) with the Myo-Pong tool in each trial. Atypical cases, marked with asterisk, are excluded.
Applsci 09 01912 g008
Table 1. Set of patients with spinal cord injury (SCI).
PatientAgeGender
134Female
238Male
341Male
466Male
537Male
Table 2. Control group: Set of 16 subjects.
GenderAgeMean AgeNumber
Male24–4631.310
Female23–3828.86
Table 3. SR comparison between flexor and extensor carpi radialis in the familiarisation session and in the consolidation session, with two levels of difficulty: Low and high.
Session,Control SubjectsPatients
LevelpVariancepVariance
familiarisation,0.558p = 0.8350.528p = 0.709
low F(15,15) = 0.896 F(4,4) = 1.488
consolidation,0.970p = 0.8310.188p = 0.709
low F(14,14) = 0.831 F(4,4) = 1.261
consolidation,0.662p = 0.4930.664p = 0.626
high F(14,14) = 1.453 F(4,4) = 0.594