1. Introduction
Ultra-smooth and high-damage-threshold optics is largely demanded in high power laser systems (such as NIF in the U.S., or the SG-III Facility in China) [
1,
2]. However, researches indicate that the subsurface damage (SSD) generated during grinding and polishing plays a key role in reducing the laser-induced damage threshold (LIDT) [
3,
4,
5,
6]. It leads to having the service life of optical elements to decrease notably. Lawrence Livermore National Laboratory adopts an optics recycling loop strategy to maintain NIF operation. They have developed the capability to sustain UV-fused silica optic recycling rate of 40 optics per week [
7]. In order to control and eliminate SSD, a variety of methods have been put forward to measure and evaluate this SSD. Generally, these methods are classified into two categories: Destructive and non-destructive measurement.
Destructive measurement methods mainly include ball dimpling [
8], magnetorheological finishing (MRF) wedge or MRF spot technique [
9,
10,
11], and HF etching [
12,
13]. The first two ways involve exposing the SSD by a supposed non-invasive polishing process. Cracks are opened by acid etching. Then, an optical microscope is applied to measure the SSD depth by scanning the wedge surface or spot. In HF etching techniques, there are also two kinds. One method is that the peak-to-valley (PV) roughness and root-mean-square (RMS) roughness of the surface are measured at each etching stage. The surface roughness increases initially and reaches its peak value, then subsequently drops smoothly. The first peak position is the SSD’s depth. The other way is that a small amount of barium is added inside the grinder coolant fluid. After grinding, the sample is etched progressively with controlled quantities. The barium concentration of etchant solution after each etching is analyzed by an Inductively Coupled Plasma-Atomic Emission Spectrometer. Then the relation curve between SSD depth and barium concentration is built. These destructive measurements are more explicit and reliable. However, the element surface is destroyed irreversibly. The depth by polishing or etching is much larger than that of the SSD, therefore more processing time may be needed. In addition, to ensure measurement accuracy, the polishing or etching process, influenced by many factors, must be carefully controlled.
In view of this, non-destructive measurement techniques are widely studied, such as predictive methods [
14,
15], confocal fluorescence microscopy [
16,
17], optical coherence tomography (OCT) [
18,
19], and total internal reflection microscopy (TIRM) [
20,
21,
22], etc. Considering the formation of SSD in optical glasses based on the indentation fracture mechanics, Lambropoulos et al. proposed an explicit equation to predict SSD depth. Furthermore, they also put forward a relationship between SSD depth and the size of abrasive grains through many experiments on glasses and ceramics. With an excitation at the wavelength of 405 nm, subsurface features of grinded or polished fused silica glasses are observed in fluorescence confocal mode, and not observed in the reflection mode. OCT is applied to detect subsurface defects in ceramics. As is reported in Ref.18, its depth and lateral resolutions are 10 μm and 4 μm, respectively. Equipment for these two methods is always expensive, and the mechanism is complicated. Compared with the former two means, TIRM, proposed firstly by Temple, takes advantages of simple apparatus and low cost. However, because of surface and subsurface defects imaged simultaneously, it is difficult to differentiate SSD from surface flaws. Liao et al. [
23] obtained the surface image (A) using differential interference contrast lighting and a TIRM image (B) at the same site. The surface image is inverted and superimposed on top of the TIRM image (i.e., B-A). Surface information could not be removed completely, due to blooming of the saturated CCD and misalignment of the images caused by vibration and air turbulence. In addition, the depth of SSD cannot be assessed quantitatively by former TIRM setups.
This study presents an improved TIRM combined with a digital image processing technique for SSD quantitative inspection. In the second part, the principle of TIRM is briefly introduced. The micro-focusing control technique, definition evaluation function, and some simulation results, showing how to achieve SSD depth through a definition curve, are described in detail. The influencing factor is also considered. In the third part, the improved TIRM setup is shown, and information about fused silica samples are described. Finally, the experimental results are presented.
2. Theories and Simulation Analysis
Traditional TIRM is designed based on the principle of total reflection. As shown in Ref. [
20], the upper surface of an optical element under test is illuminated from within by a collimated laser, which has an incident angle that is equal to or slightly greater than the critical angle. If both the surface and subsurface of the illuminated area are defect-free, all incident light will reflect off the glass/air interface, and no light will scatter into the microscope. A camera captures a dark-field image called a background. On the contrary, incident laser will be scattered by surface defect or subsurface damage. A portion of scattering light transmits through the surface under test, and is collected by the microscope. An image composed of bright defects and dark background is obtained.
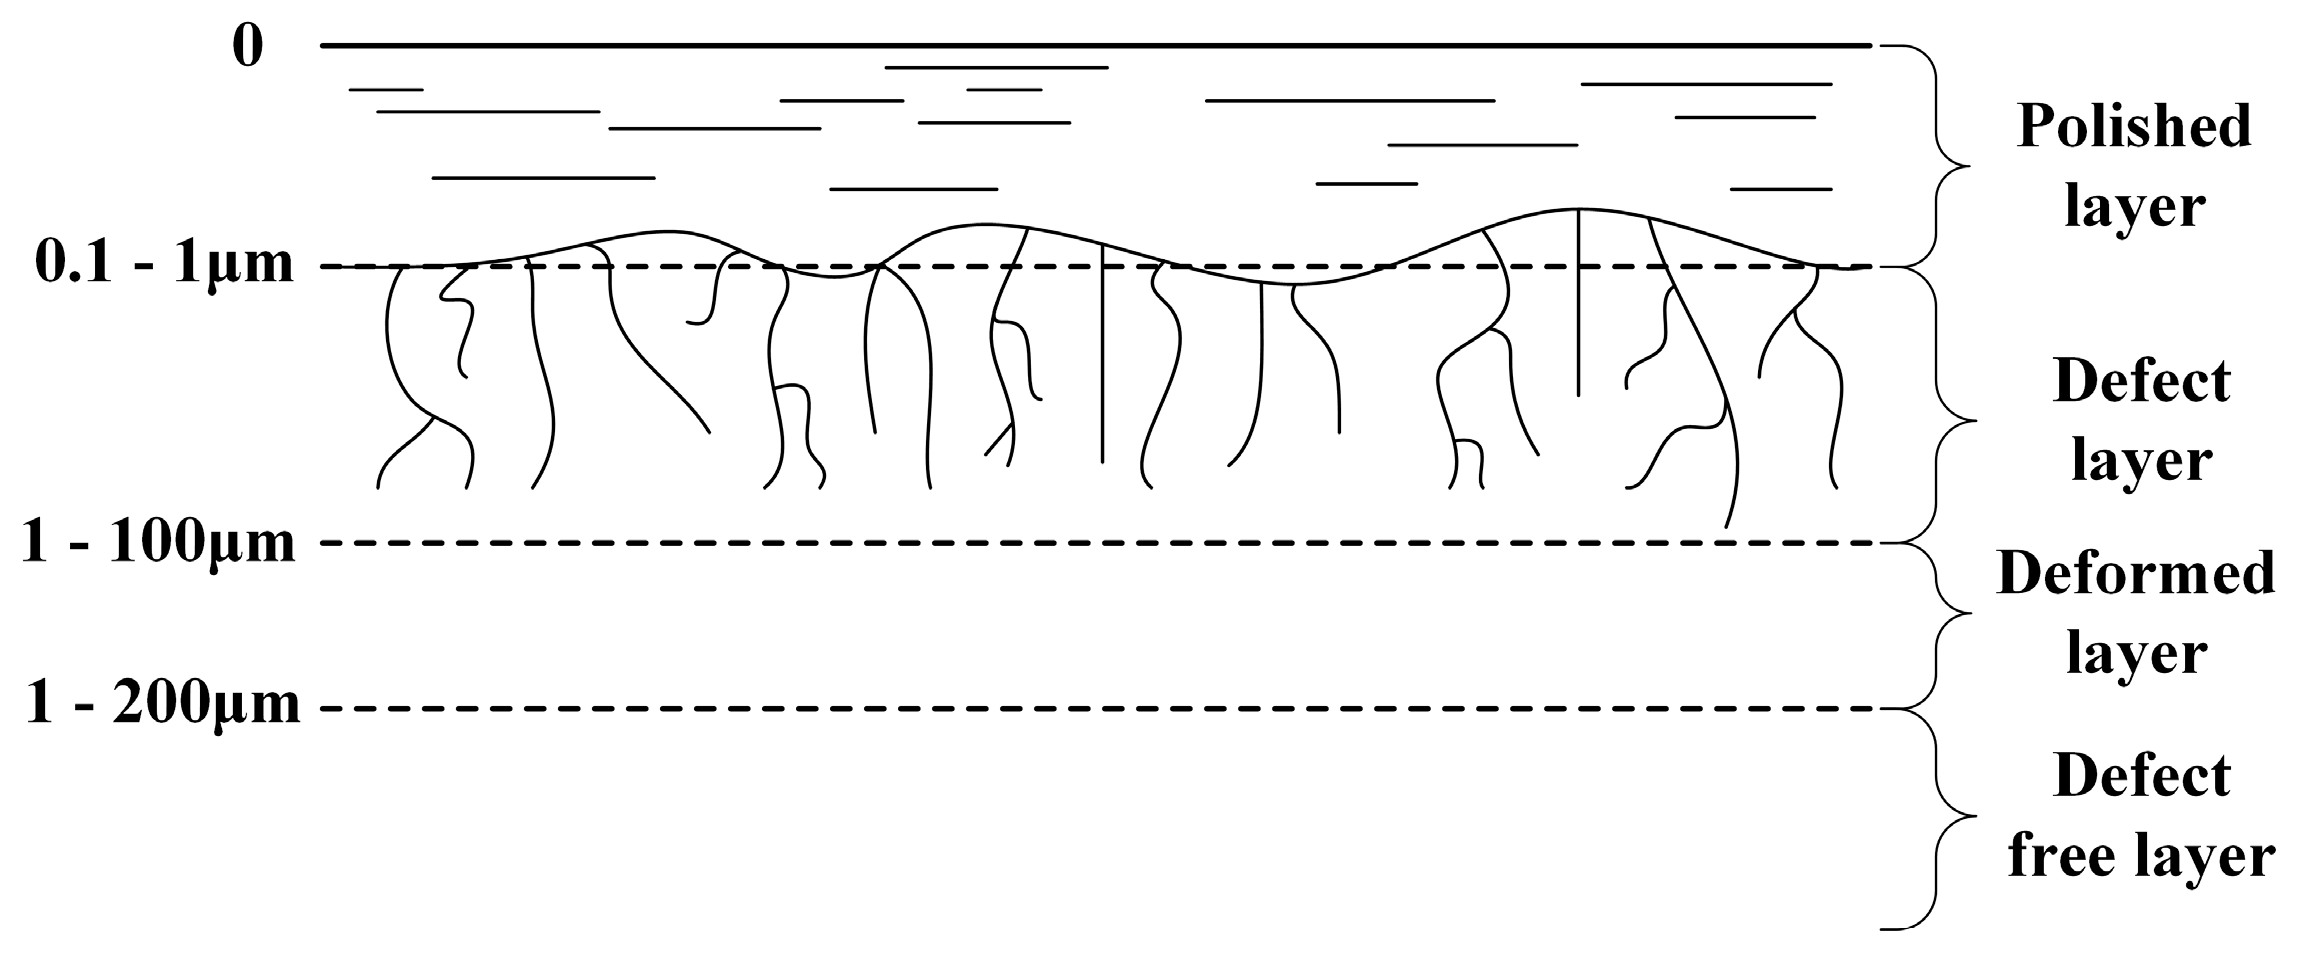
Figure 1 is the conceptual illustration of subsurface damage [
6]. SSD locates in the defect layer, and is hidden by the polished layer. It has a certain depth, ranging from 1 μm to 100 μm in the longitudinal direction. However, according to common sense, an objective lens in a microscope has a limited depth of field (DOF). Generally, along with the magnification of the objective lens increasing, the DOF dramatically decreases. The DOF of a high-magnification objective whose magnification no less than 50× is not greater than 1 μm. This means the greater part of the SSD is out of focus and blurred in the image, when the objective is focused on the top of the defect layer. Nevertheless, this feature is just right for our purpose in evaluating SSD depth. The micro-focusing control technique is adopted. High-magnification objective with small DOF is controlled by a one-dimensional precision translation stage to move longitudinally and can be focused on different depths under the surface. At each depth position, the microscope collects scattering light emitted from the SSD. Only the part located in the range of DOF could be imaged clearly, since other parts are out of focus and blurred. Accordingly, a series of images of different parts of the SSD are obtained.
Since the TIRM image is composed of a relatively simple dark background and bright defects, a definition evaluation function is designed based on single-level wavelet transformation [
24,
25], with a good balance between image processing speed and accuracy to calculate the definition of these images. The original image is divided into four sub-bands after wavelet transformation: One low-frequency sub-band and three high-frequency sub-bands. The low-frequency component is the outline of the original image, its approximation coefficients matrix is
, while the three high-frequency sub-bands represent the image details in three orientations (horizontal, vertical, and diagonal), and their details coefficients matrices are
,
, and
, respectively. The image is clearer, the summation of the absolute values of the three details coefficients matrices (
,
, and
) is larger. Based on this, the definition evaluation function
E is expressed as:
The clearer the image, the larger the value of E.
The simplified structure of the video microscope is shown in
Figure 2. SSD is sliced in the depth direction. Through the micro-focusing operation, different slices of the SSD are generally located on the object plane. Scattered light emitted by SSD is collected by the objective lens, and passes through the projection eyepiece. The SSD slice in focus is imaged clearly on the camera, and other slices out of focus are blurred. The imaging process is simulated in the former paper [
26]. The numerical aperture of the objective lens is N.A. = 0.80 (magnification is 50×). The wavelength of incident light in vacuum is λ = 532 nm. Two types of SSD are used in simulation: Point defect and crack.
Figure 3 shows two point defects at different depth under surface. The size in depth direction of the point defect is smaller than the DOF of the objective lens. Both of the two are a single slice, and have undergone a process of ‘defocus-focus-defocus’. The definition of all images achieved through the system are calculated using Equation (1). Right graph of
Figure 3 is the definition curve of the two point defects. Horizontal axis represents images’ sequence corresponding to depth position. Vertical axis represents the normalized E. Two peaks are shown in the curve. The image position of the two peaks are exactly the corresponding defects on the objective plane. When the point defect is out of focus, the value of normalized E is decreased sharply. Since the lateral size of the first point defect is larger than the second point defect, its normalized E is greater than the second point defect.
Subsurface cracks are usually V-shaped [
27,
28], as shown in
Figure 4a. Its width is always on the order of microns or sub-micron. The width and depth of cracks are initially 4 μm and 13 μm, respectively. The crack is divided into 13 slices by a step of 1 μm along the depth direction. With a micro-focusing operation, the microscope is focused on different depths. The image captured by the camera is the integral of all 13 slices imaged through the microscopic system. Its definition curve is shown in
Figure 4b, where there are two obvious turning points. Between the two turning points, the normalized E drops slowly due to the V-shaped crack becoming narrow. On the contrary, the normalized E rises or falls rapidly before or after the turning points. There are 12 points including the turning points, which means that the depth is about 12 μm. It is close to the presupposed depth. As a comparison, the crack definition curves of 1 μm wide and 13 μm deep, 4 μm wide and 18 μm deep, are also given in
Figure 4c,d, respectively. The two definition curves are similar to the curve in
Figure 4b. There are 11 points between the two turning points in
Figure 4c. The crack depth obtained from the definition curve is 13 μm, which is consistent with the presupposed depth. The normalized E fluctuation of the definition curve in
Figure 4c is smaller than the normalized E fluctuation of the definition curve in
Figure 4b. It may be caused by a smaller change in the crack width of the adjacent slice. In
Figure 4d, 15 points exist between the two turning points. The crack depth obtained from the definition curve is 17 μm, which is also close to the presupposed depth.
The condition of total internal reflection illumination is ignored in the simulations. In the total internal reflection illumination, the incident field and reflected field are superimposed on the illumination region to form a standing wave field [
21]. The standing wave field period Γ, independent of the polarization of the incident light, is expressed as:
where,
n is refractive index;
θ is incident angle.
n = 1.46 and
θ = 45° are chosen, Γ = 0.258 μm. Γ is smaller than the DOF, 0.84 μm. The intensity of a standing wave field for s-polarized light is shown in
Figure 5. When performing a micro-focusing operation, there are the same number of cycles within the DOF. This means the illumination intensity is identical in each micro-focusing operation. Therefore, total internal reflection illumination doesn’t affect the effectiveness of the simulation results.
3. Experimental Setup and Sample Preparation
The schematic diagram of the improved TIRM setup is shown in
Figure 6. The incident light emitted from a diode-pumped solid-state laser operating at a wavelength of 532 nm passes through half-wave plate 1, the polarization beam splitter PBS, and half-wave plate 2. Half-wave plate 1 is rotated to maximize the power of p-polarized light output from the PBS. Rotating half-wave plate 2, s-polarized light is obtained. The s-polarized beam is directed into the face of the inverted prism by two turning mirrors: Mirror 1 and Mirror 2. Its incident angle is adjusted by tilting and positioning the Mirror 2 vertically. The material of the 90° prism is consistent with that of the sample. Index matching fluid is filled between the backside of the sample and the prism surface. In order to implement a micro-focusing operation, the optical microscope (HUVITZ-HRM 3000), driven by a motor, could move exactly along the z-axis with a step of 1 μm. The microscope is equipped with five objective lenses of different magnifications (5×, 10×, 20×, 50×, 100×). Its eyepiece magnification is 10×. The resolution of the CCD is 2448 × 2048. The pixel size is 3.45 μm. The sample and prism are placed on the X-Y translation stage. The upper surface of the sample is raster-scanned. The incident light spot on the upper surface of the sample has a diameter of 3 mm.
Figure 7 shows our improved TIRM setup. The image in the upper right corner is the prism and the sample under test.
In order to quickly locate SSD and quantitative measurement, the 10× and 50× objective lenses are frequently used in our experiments. Because of the relatively wide field of view and large DOF (5.9 μm), the 10× objective is employed to scan the surface and subsurface of the sample, and locate the region which includes the SSD. The 50× objective is applied to obtain the SSD images at a different depth, and measure the depth of SSD with its smaller DOF (0.84 μm). The microscope has bright field illumination. The image captured under bright-field illumination is used to distinguish surface defects from any SSD. The SSD does not appear in the bright-field image, and surface defects can be imaged.
Two pieces of fused silica glass are tested in our experiments. Their size is 50 mm in diameter, and 5 mm in thickness. The two samples are grinded firstly with loose abrasive emery #280 (the particle size is about 40~50 μm). They then both have extra loose abrasive grinding with both emery W28 and W14 in sequence. The particle sizes of W28 and W14 are 20~28 μm and 10~14 μm, respectively. The amount of removal in the latter step is 2 to 3 times the particle size of the abrasive particles used in the previous step. The subsurface damage generated in the former step is removed. Finally, the two samples are polished with cerium oxide polishing solution. Under the same processing conditions, the polishing time of sample #1 is shorter than the polishing time of sample #2.
4. Experimental Results and Discussion
Under the total internal reflection illumination, the upper surface of the sample #1 is scanned rapidly by the 10× objective lens. The regions containing severe subsurface damage are located. Typical images of SSD with magnification of 50× are shown in
Figure 8. The imaging areas of
Figure 8a,b are identical. There are several linear features in
Figure 8b under total internal reflection illumination on the top of SSD. However, they have disappeared in
Figure 8a, having been taken under bright field illumination of the microscope system. This indicates that these linear features are subsurface damage. By the micro-focusing operation, 65 images of SSD are captured by the CCD. The definition curves of the subsurface damage within the red ellipses are calculated using equation (1).
Figure 8c is the definition curve of the short crack in
Figure 8b. The normalized E rises or falls rapidly before or after the turning points, as shown in
Figure 4b. There are 7 points between the two turning points. The microscope moves in the z direction with a step of 1 μm. The refractive index of fused silica glass is 1.46 at 532 nm. Due to the refraction effect during total internal reflection imaging, the distance between the two turning points needs to be multiplied by the material refractive index n when calculating the SSD depth. Therefore, the depth of the short crack is about 13.14 μm under the polished layer. The normalized E of points between the two turning points float up and down significantly. This phenomenon may be caused by the crack structure or the environmental vibration. The definition curve of the long crack within the red ellipse is shown in
Figure 8d. There are 3 points between the two turning points. The depth is about 7.3 μm. The depth of the long crack is smaller than that of the short one. The normalized E of points between the two points drop quickly, and we can also verify this.
Figure 9 is the result of sample #2 under 50× magnification. The total internal reflection image shown in
Figure 9b indicates that much fewer SSD has remained after longer periods of polishing. The linear feature shown in
Figure 9b is not shown in
Figure 9a, captured under the bright field illumination. Therefore, the linear feature is subsurface damage. The definition curve of the most obvious region of the crack is shown in
Figure 9c. There are 4 points between the turning points. Its depth is about 8.76 μm, and that is much shallower than the short crack’s depth in
Figure 8b.
The depth resolution of the improved TIRM is mainly decided by two factors: The objective’s DOF, and the positioning accuracy of the translation stage for the microscope motion along the depth direction. If the SSD depth is smaller than the DOF, and the step of the microscope is close to DOF, the definition curve will be a unimodal structure as shown in
Figure 3, and it couldn’t be resolved effectively. Generally, a higher magnification objective is accompanied with a larger N.A., while the DOF is much smaller. The 100× objective of the optical microscope has a DOF of 0.66 μm (N.A. = 0.90). When the 100× objective is used, the depth resolution could be improved. However, environmental vibrations will prevent the microscope from maintaining stable imaging under higher magnification. Images will be blurred and misplaced. A very good vibration isolation platform is required. The SSD’s depth is calculated from the TIRM images’ position, and the positioning accuracy of the translation stage is related to each image’s position. The positioning accuracy of the translation stage in our TIRM is 0.2 μm, which is much smaller than the DOF of the 50× objective. When the 100× objective is used, a translation stage with higher positioning accuracy is needed. The lateral resolution of the improved TIRM is determined by the microscope. The crack’s length can be calculated from the image of the first turning point. If the crack exceeds the single image, a complete crack image can be obtained by the image stitching technique. The X-Y translation stage in the experiment setup is manually controlled. To realize image stitching, an electric X-Y moving stage is needed. The crack’s width is typically on the order of microns or sub-microns. It couldn’t be accurately measured due to a scattering or diffraction effect under total internal reflection illumination. The measured width is always greater than the actual width [
26]. Nevertheless, the most important information is the crack’s depth. It determines how much thickness of the glass has to be removed in subsequent processes. The SSD depth measured by our improved TIRM setup can also be utilized to compare the effects of different processing steps, as well as different processing parameters (such as abrasive particle size, grinding speed and grinding force, etc.), on the generation of subsurface damage. Through a number of experiments and analyses [
29,
30,
31], the processing steps and parameters may be determined reversely.
5. Conclusions
The improved total internal reflection microscopy (TIRM) has been proposed to non-destructively and quantitatively inspect the subsurface damage (SSD). The characteristic of small depth of field (≤1 μm) at high magnification (such as 50×) and micro-focusing control techniques are utilized in this method. A definition evaluation function based on the single-level wavelet transformation is built. The definition curve of SSD is calculated using the definition evaluation function. The definition curve of the point defect is a unimodal configuration.
The definition curve of the V-shaped crack has two turning points that corresponding to the top and bottom of the crack, respectively. The depth of the SSD is easily achieved from the positions of the two turning points. The SSD of two fused silica glasses with different polishing time are tested. The experimental definition curves are similar to those of the simulation. They have the same characteristics. The depth resolution of the improved TIRM is determined by the depth of field (DOF) of the objective, and the positioning accuracy of the one-dimensional precision translation stage applied to control the microscope’s movement. By these two means, the depth resolution can be promoted. However, the environmental vibrations will seriously affect the quality of SSD imaging and the calculation of the normalized E, especially in the condition of higher magnification (such as 100×). With the help of our improved TIRM, the thickness of the sample needing to be removed in subsequent processes is determined. The manufacture efficiency will be increased. The SSD depth measured by our improved TIRM setup also can be utilized to compare the effects of different processing steps, different processing parameters on the generation of subsurface damage. The processing steps and parameters could be optimized.

 ,
, 