3.1. Road Pavements Evaluation Methods Comparison
The first step of the analysis concerns the study of the correspondence of the results provided by all the three methods previously described (IRI by ASTM E1926, PSD by ISO 8608 and awz by ISO 2631).
In order to compare the results obtained using the different pavement assessment methods, four different ride quality levels were defined, identifying specific threshold limits for each index.
The IRI thresholds taken in account were the limit values proposed by Yu et al. [
15] for speed equal to 80 km/h; which is also the speed at which the vertical weighted acceleration (named
awz,80) was calculated for this comparison. These IRI thresholds are very close to those proposed for the same speed by Cantisani e Loprencipe [
17]. The choice of this speed is based on the velocity range characterizing the examined roads (i.e., 60–90 km/h) and on the fact that IRI is frequently used for the evaluation of roads having legal speed limit equal or higher than 80 km/h.
In
Table 3 it can be noted that, in order to compensate the absence of specific limitations between the comfort levels provided by ISO 2631, it was chosen to consider the mean value of each overlapping zone as the limit between two adjacent comfort levels (for example 0.565 is the mean of 0.63 and 0.5 m/s
2).
Finally, for the ISO 8608 approach the ride quality levels correspond to the road profiles classes defined in the same standard, as shown in
Table 3.
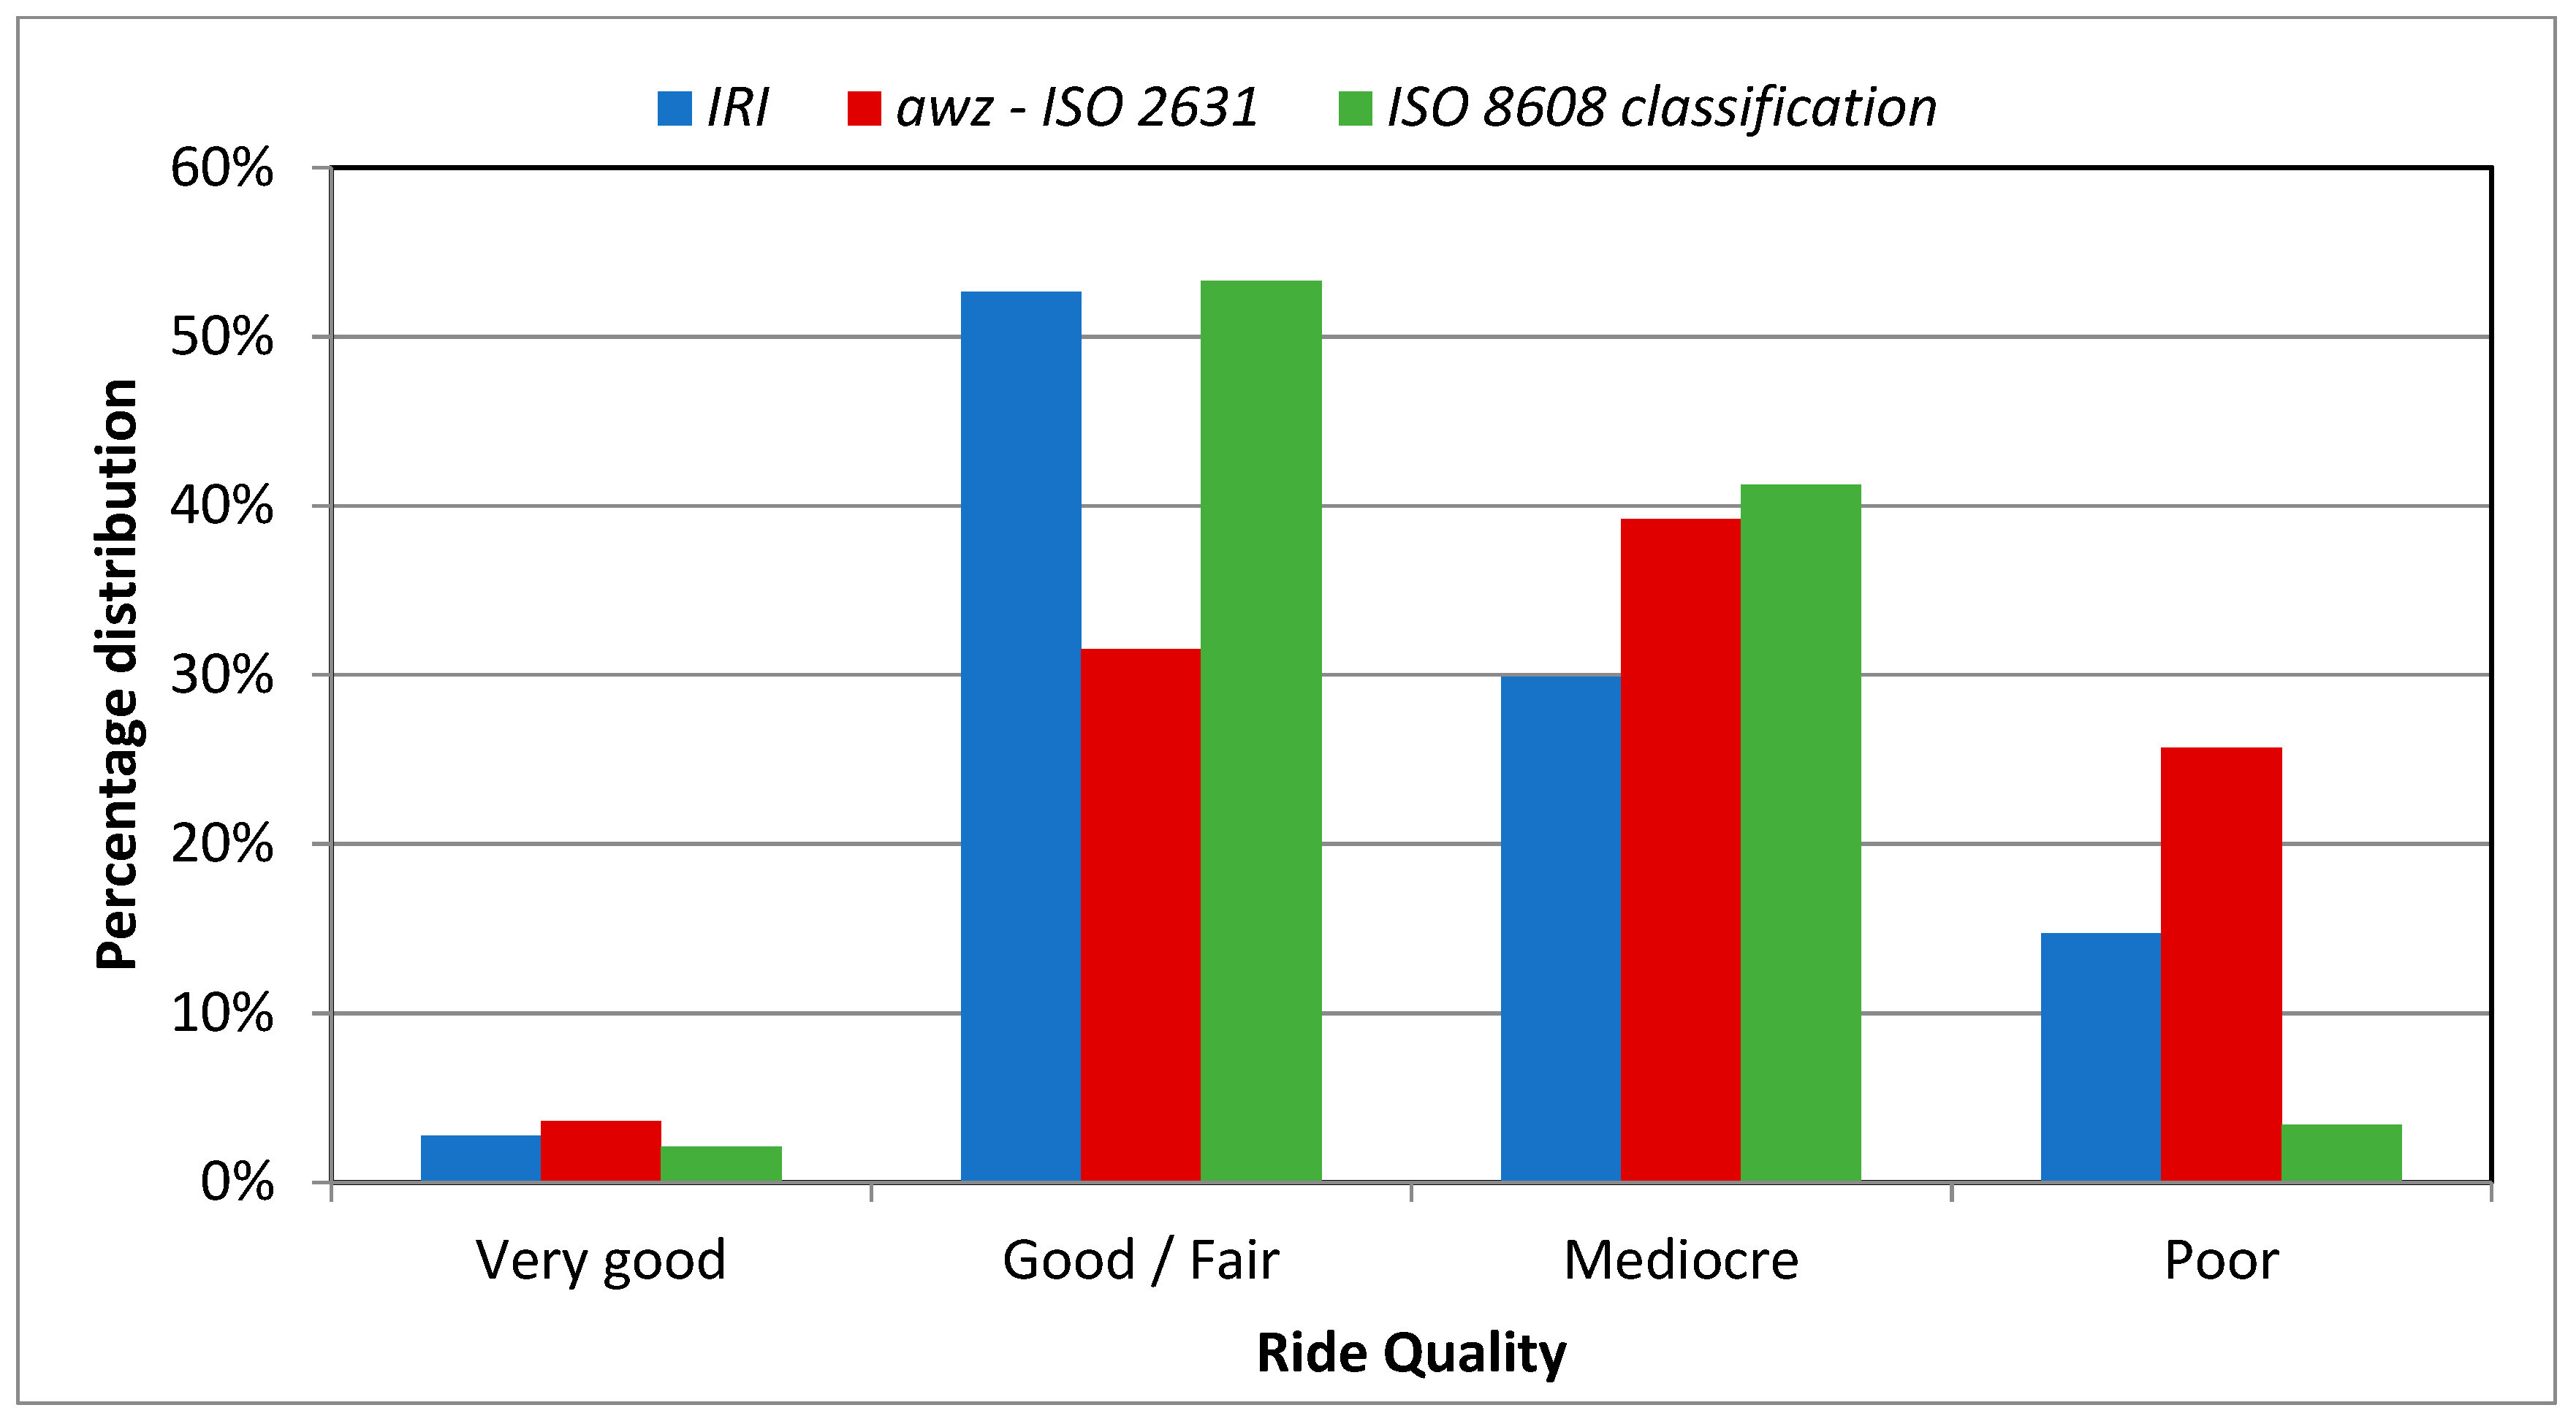
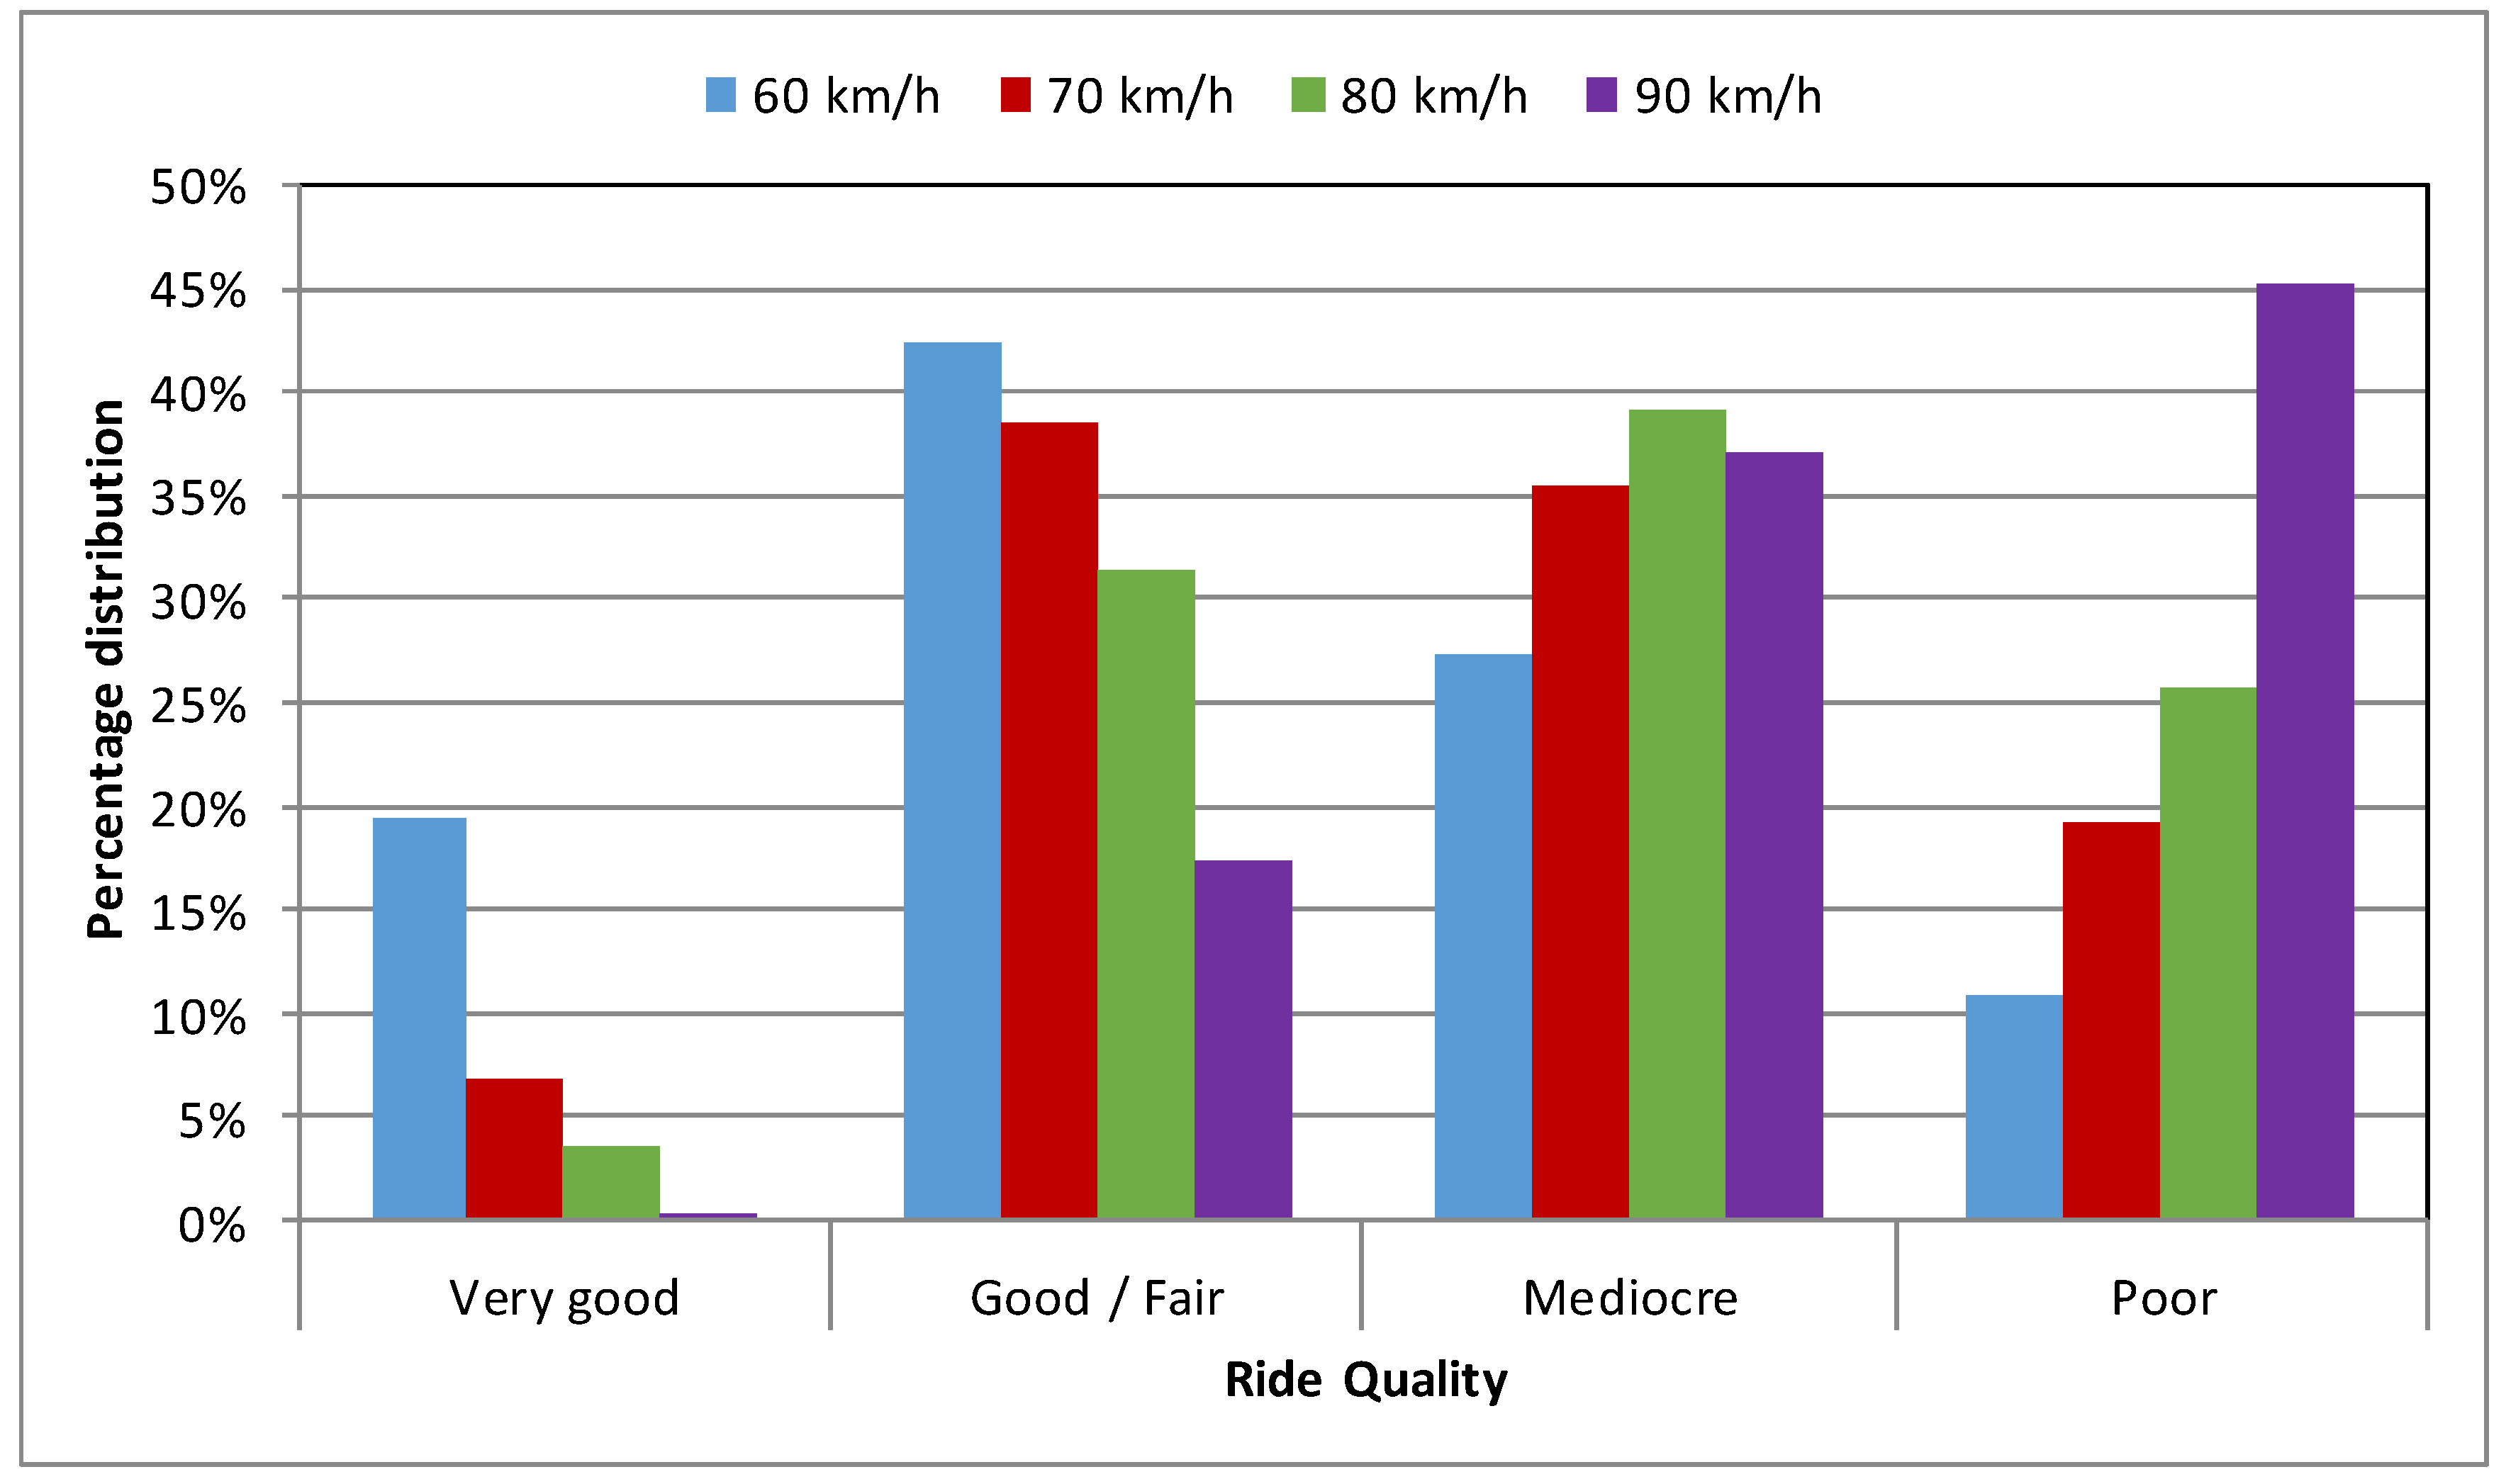
A first comparison between the abovementioned pavement evaluation methods concerns the analysis of the percentage distribution of all the analyzed pavement sections (621) among the four ride quality levels defined in
Table 3. The results are shown in
Figure 3, where it can be noted that except for the ride quality level “
Very Good” there is a significant variability in the assessment of the pavement sections. For example, the percentage of sections judged as “
Poor” varies from 3% to 27% depending on the evaluation method used. Similar differences can be also observed for the other classes “
Good/Fair” and “
Mediocre”.
In particular it can be seen that adopting IRI or ISO 8608 approaches more than 50% of the total sections belongs to “Very Good” and “Good/Fair” classes, while using the awz,80 index as the evaluation method more than 60% of the sections are rated as “Mediocre” and “Poor”.
This great variability found in terms of profile classes distribution highlights how the choice of the evaluation criterion is very important and significantly affects the road maintenance plan.
The main differences found between the three assessment methods depend on the contribution provided by each kind of discontinuity to the global comfort level perceived by users. In particular, in ISO 8608 classification, there is not an evaluation of the various wavelengths contribution to the vibration level perceived by users. IRI, instead, was developed with the aim to represent the effects of roughness related to both drivers comfort and forces transmitted from wheels to road pavements. In IRI calculation, however, mechanical parameters that do not represent real vehicles are used. On the contrary, the introduction of frequency weighting coefficients in the calculation of the awz index reflects the perception of vibration by human beings.
Furthermore, the presence of punctual discontinuities along each pavement profile affects in a different way the correspondent value of the three indices. In particular, the IRI is designed for the assessment of distributed irregularities, while it is not suitable to properly evaluate punctual ones. In the calculation of the other two indices, which are both based on the use of the Fast Fourier Transform, the presence of this kind of discontinuities affects the trend and the magnitude of the Power Spectral Density.
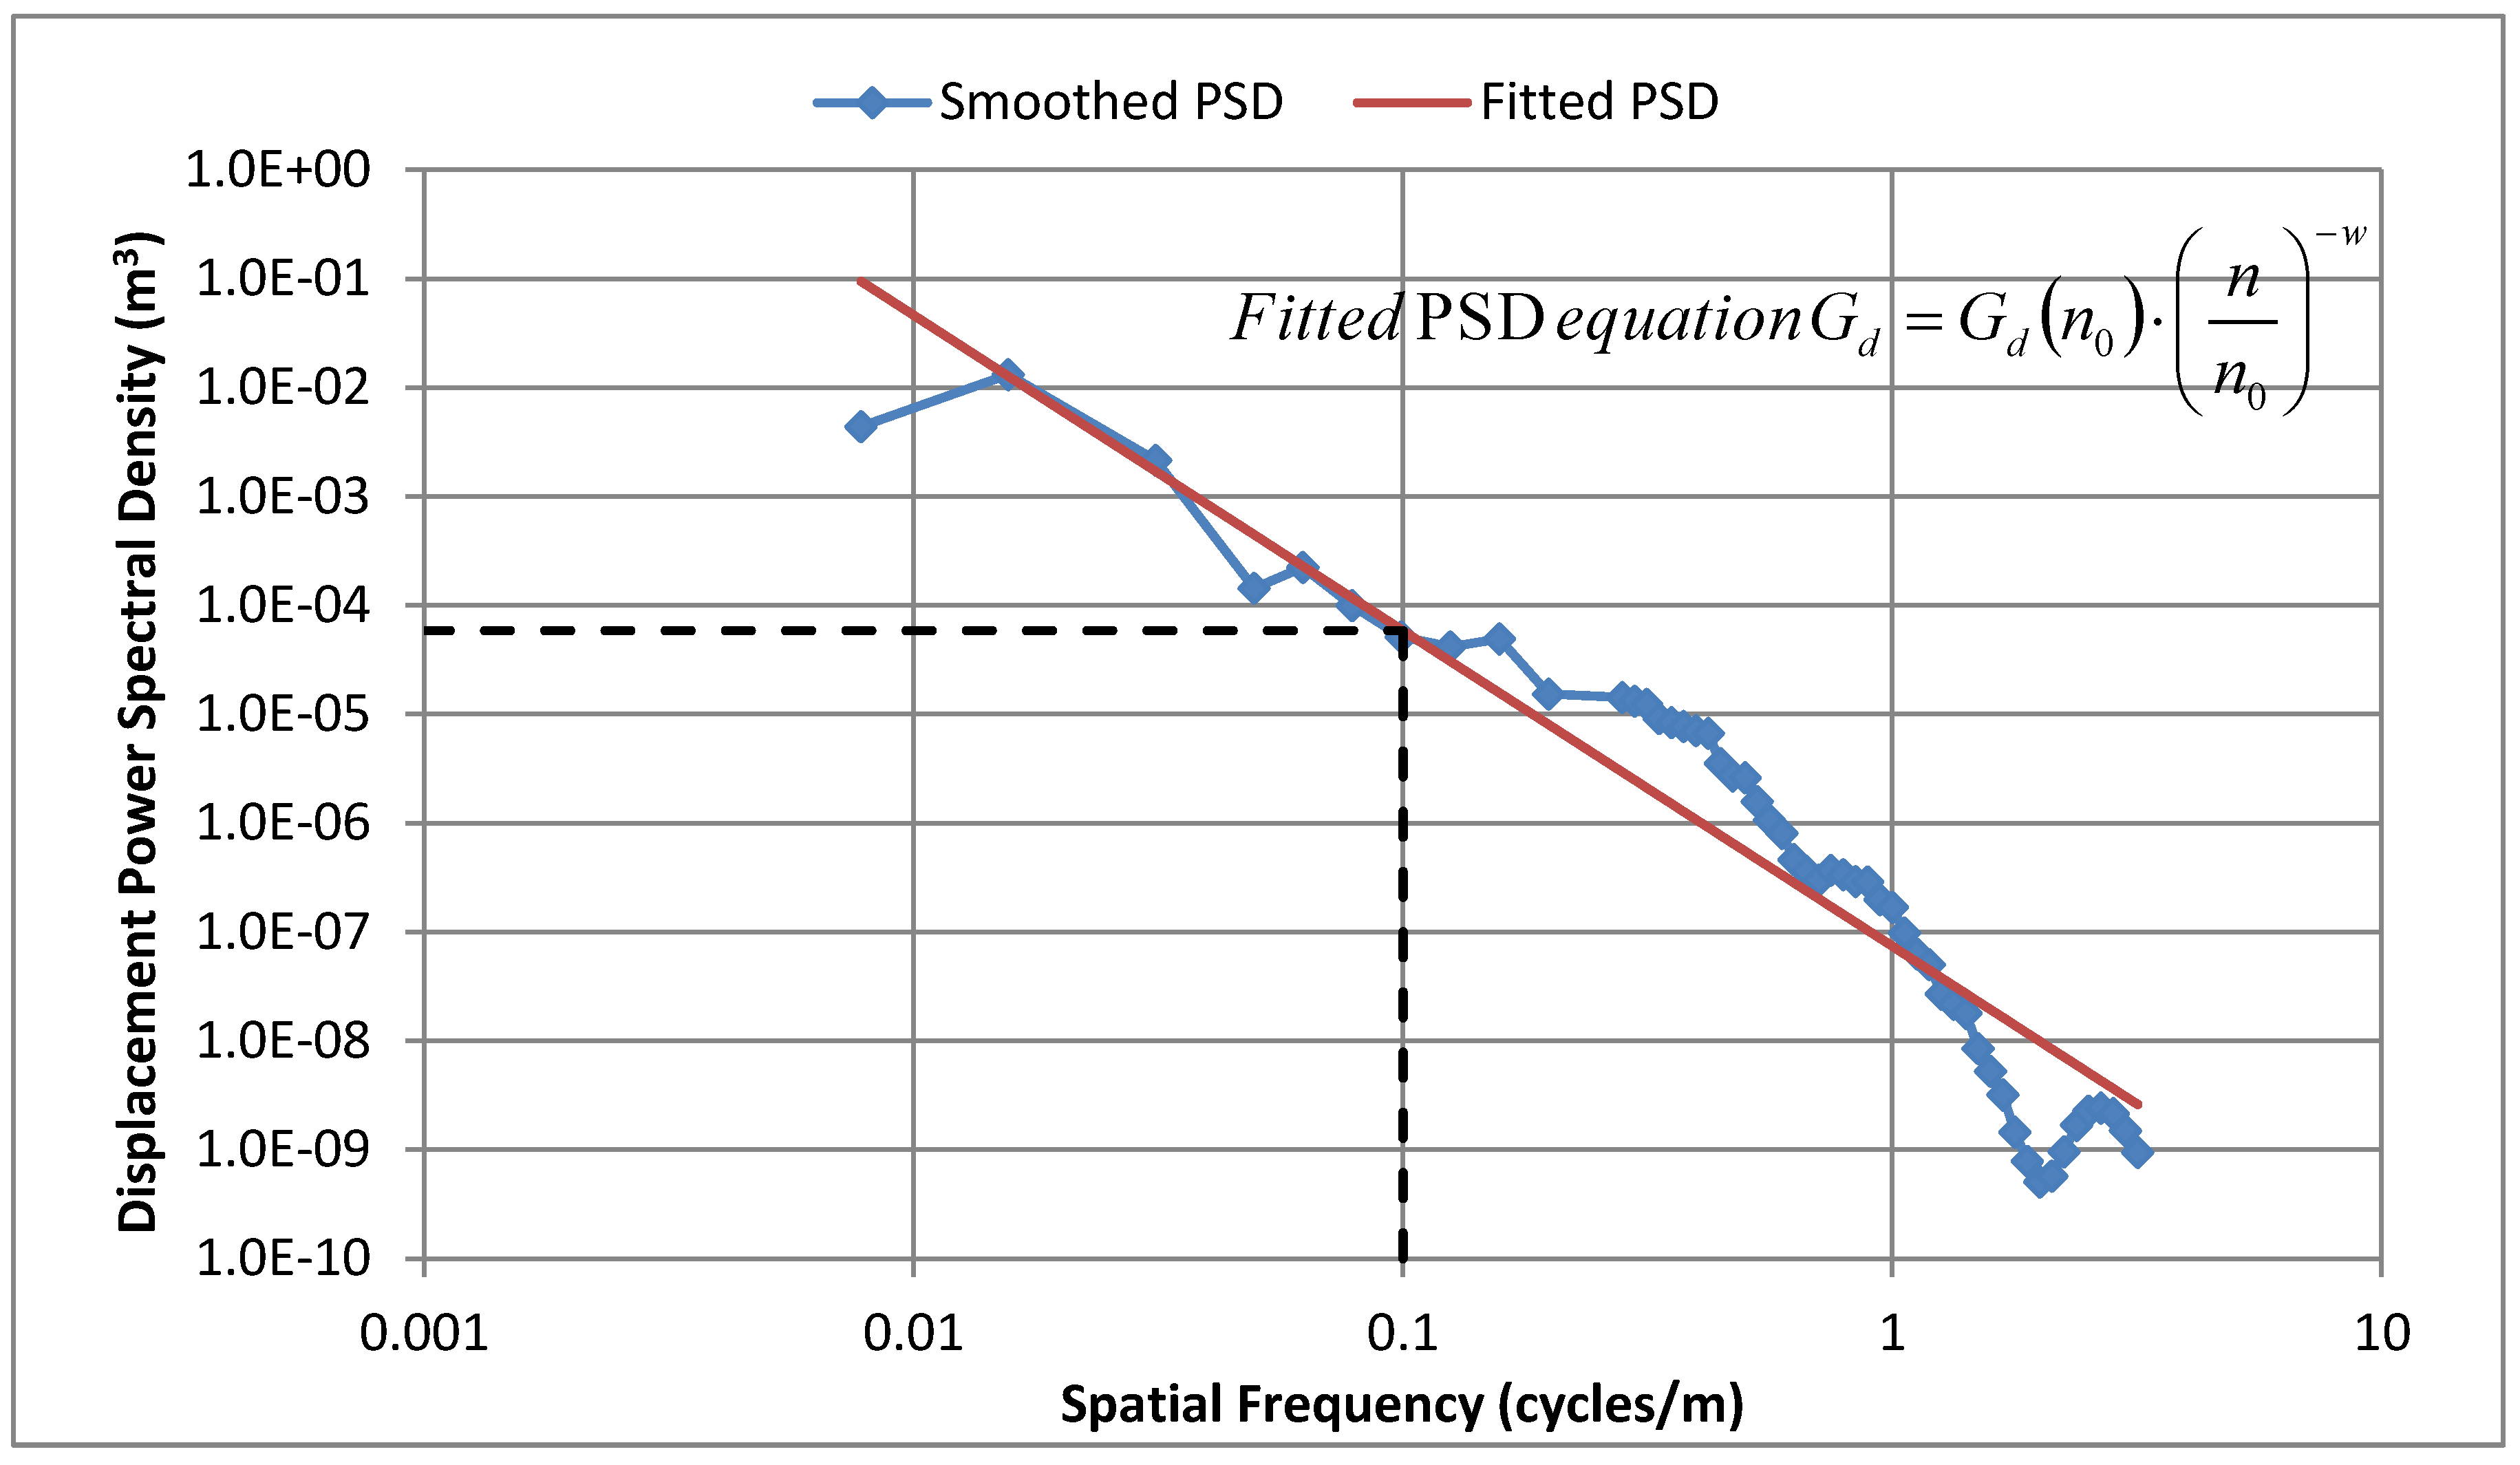
Regarding the classification method provided by ISO 8608, it is necessary to specify that the straight line fit (in bilogarithmic plane, see
Figure 1) suggested in the standard, does not always provide a good representation of the longitudinal PSD of real road profiles. For this reason, other fitting approximations (like two-and three-wave bands) have been proposed in literature [
27].
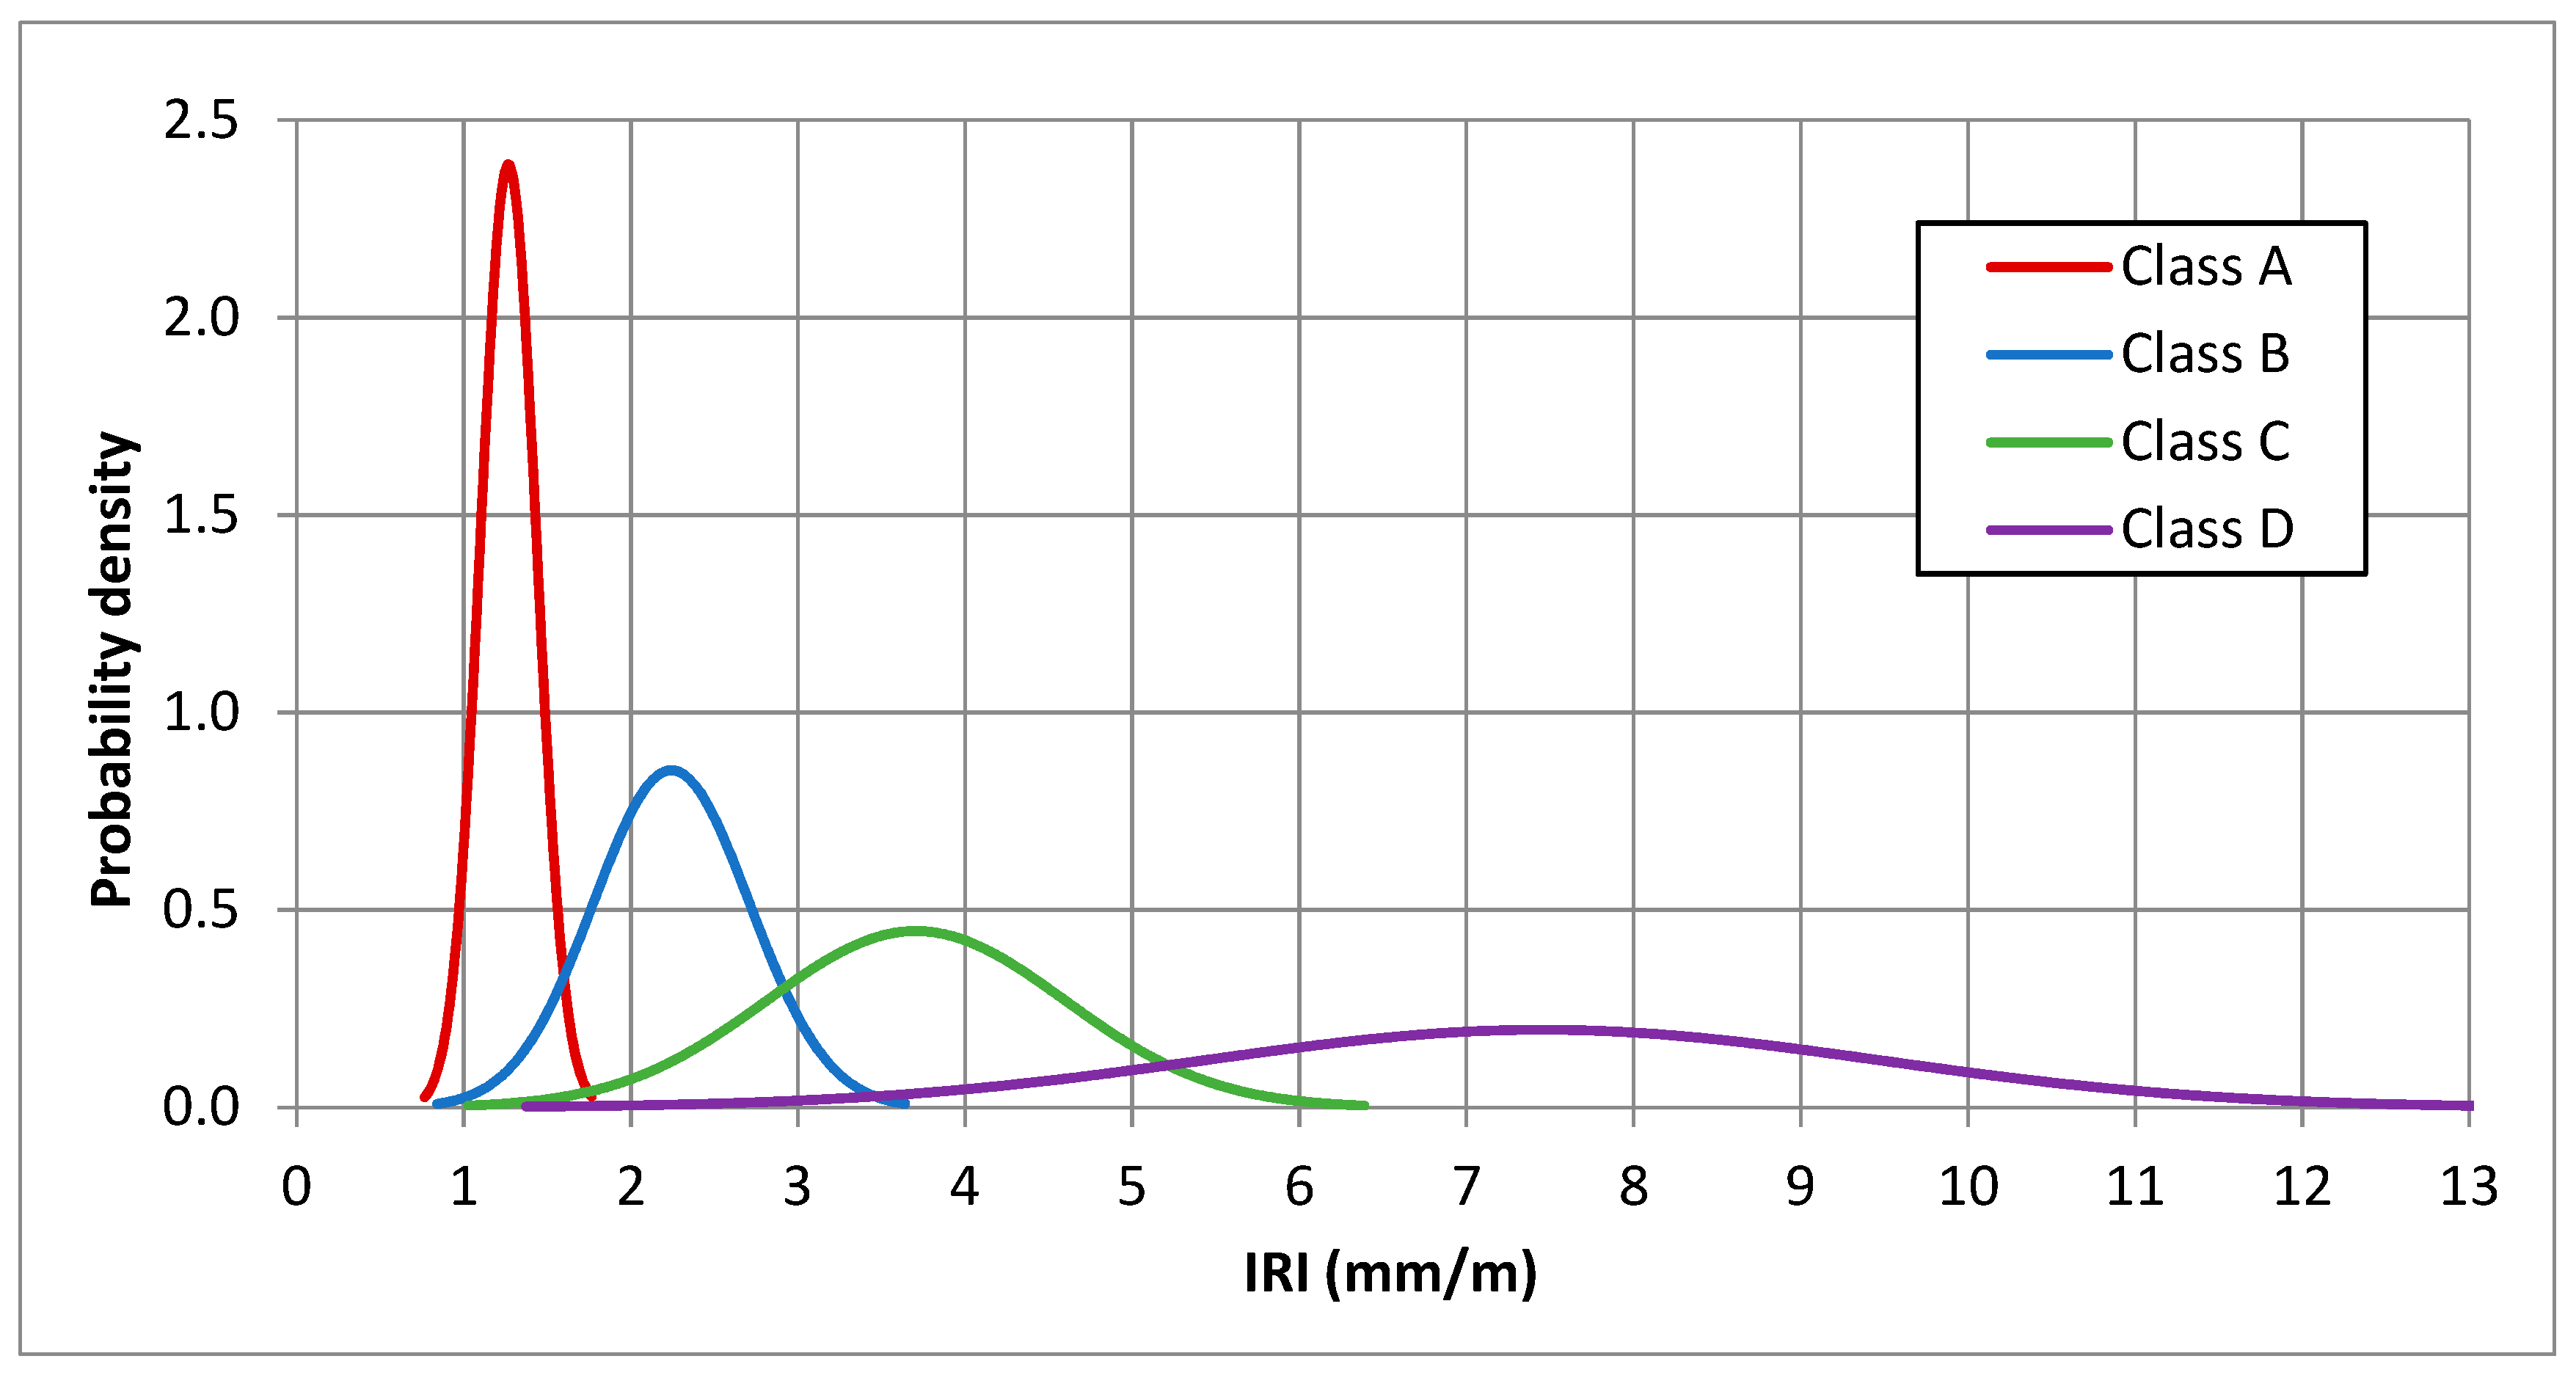
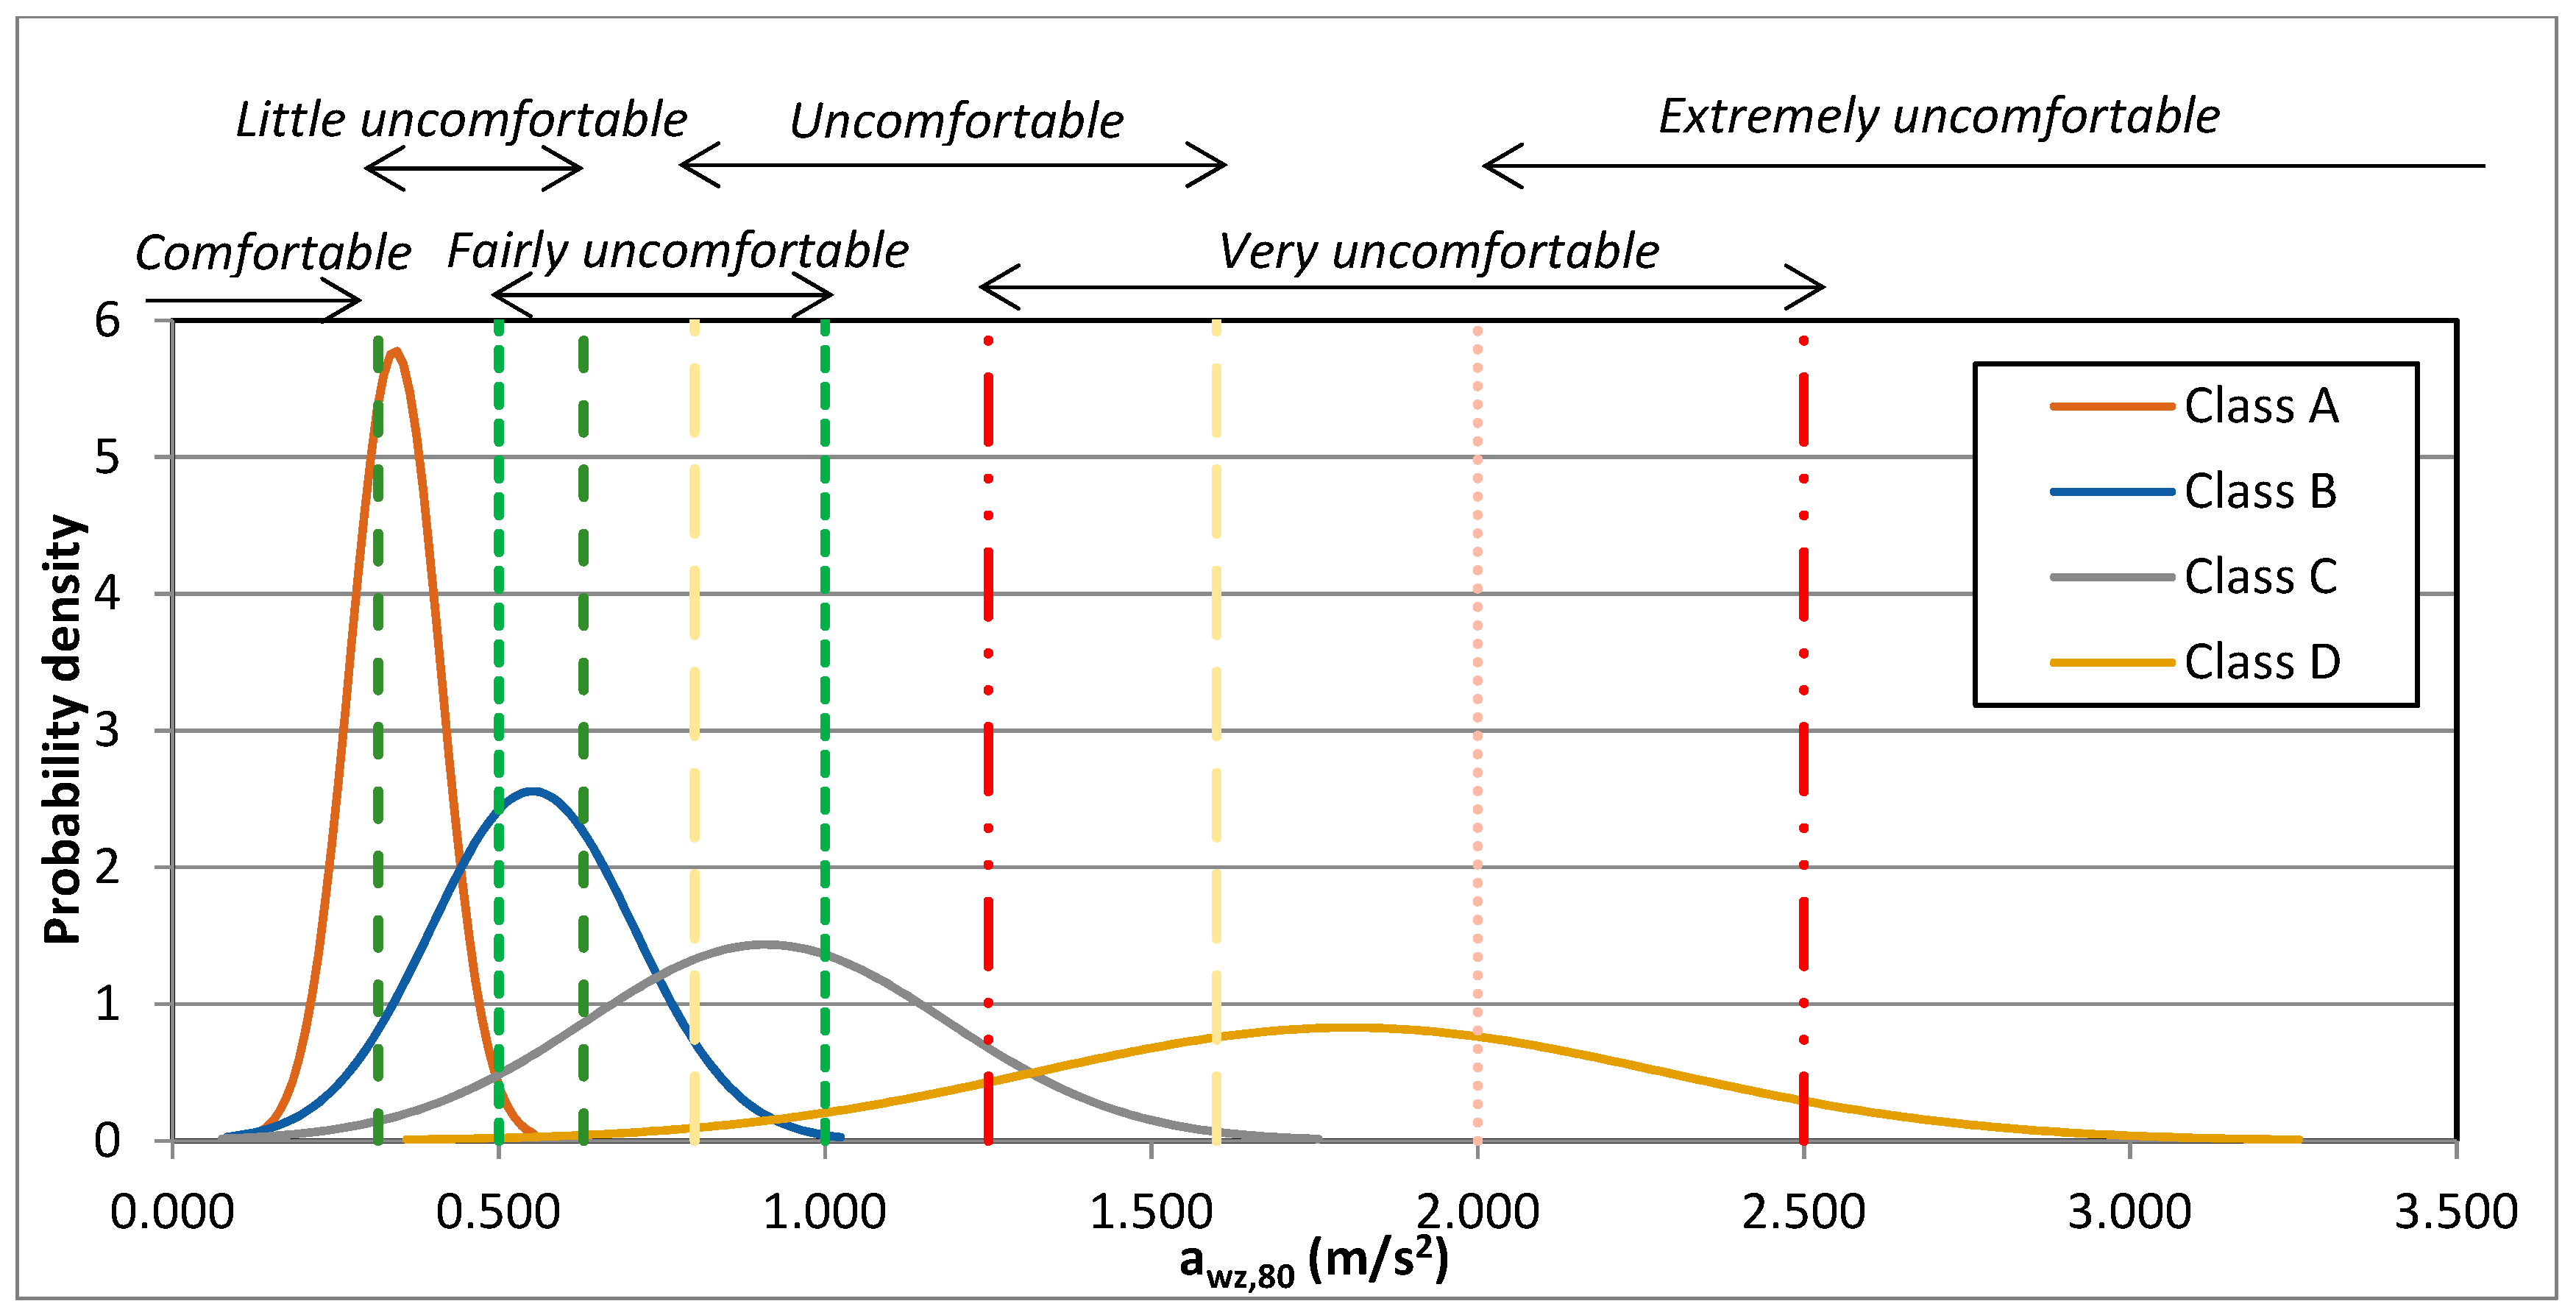
The ISO 8608 classification is based only on geometrical characteristics of the road profiles. For this reason, it is interesting to evaluate IRI and
awz values dispersion for each of the four analysed classes. Thus, starting from the ISO classes which the 200 km of measured profiles belong to (class A to class D), IRI and
awz,80 normal distributions were calculated for each of them and reported in
Figure 4 and
Figure 5. As it is possible to note in both above-mentioned figures, moving to worst profiles classes, the probability density curve assumes wider shapes and various overlapping zones can be observed. This means that considering, for example, two profiles having similar IRI values, the use of the ISO 8608 approach can lead to define them as belonging to different ISO classes.
3.2. Analysis of Speed Influence
As stated before, the
awz,80 distribution reported in
Figure 5 was calculated for a traveling speed equal to 80 km/h, which is the fixed velocity considered for the IRI quarter-car model. Assessing the ride quality using the ISO 2631 approach calculated by means of a full car simulation model, it is possible to evaluate the effects of different speeds on the comfort perceived by road users. Then, analyzing the vertical weighted acceleration
awz within the speed range characterizing the examined roads (i.e., 60–90 km/h), it was possible to study the ride quality as a function of the velocity parameter. This type of analysis can be useful to assess the possible effect of roads unevenness on traffic flows also identifying the most critical sections. As it is shown in
Figure 6 when vehicles travel at lower speeds the number of sections judged as belonging to “
Very Good” and “
Good” ride quality levels increases. In particular, compared to the results obtained with the maximum legal speed allowed for the examined roads (i.e., 90 km/h) a consistent reduction of perceived poor sections was obtained just traveling at 80 km/h (a speed very close to the maximum allowed for this kind of road). This speed could be reasonably accepted considering the actual speed diagrams that can be obtained for the analyzed roads as a function of their geometric and technical characteristics.
As expected, for speeds below 80 km/h (i.e., 60 and 70 km/h), there is an increase in the percentage of sections falling in the categories of good ride quality (Very Good and Good/Fair) and a decrease in the categories of poor ride quality (Mediocre and Poor). On the contrary, the results obtained at a speed of 90 km/h decrease in the percentage of sections in the categories of good and mediocre ride quality (Very Good, Good/Fair, and Mediocre) and an increase in the category of Poor ride quality were found.
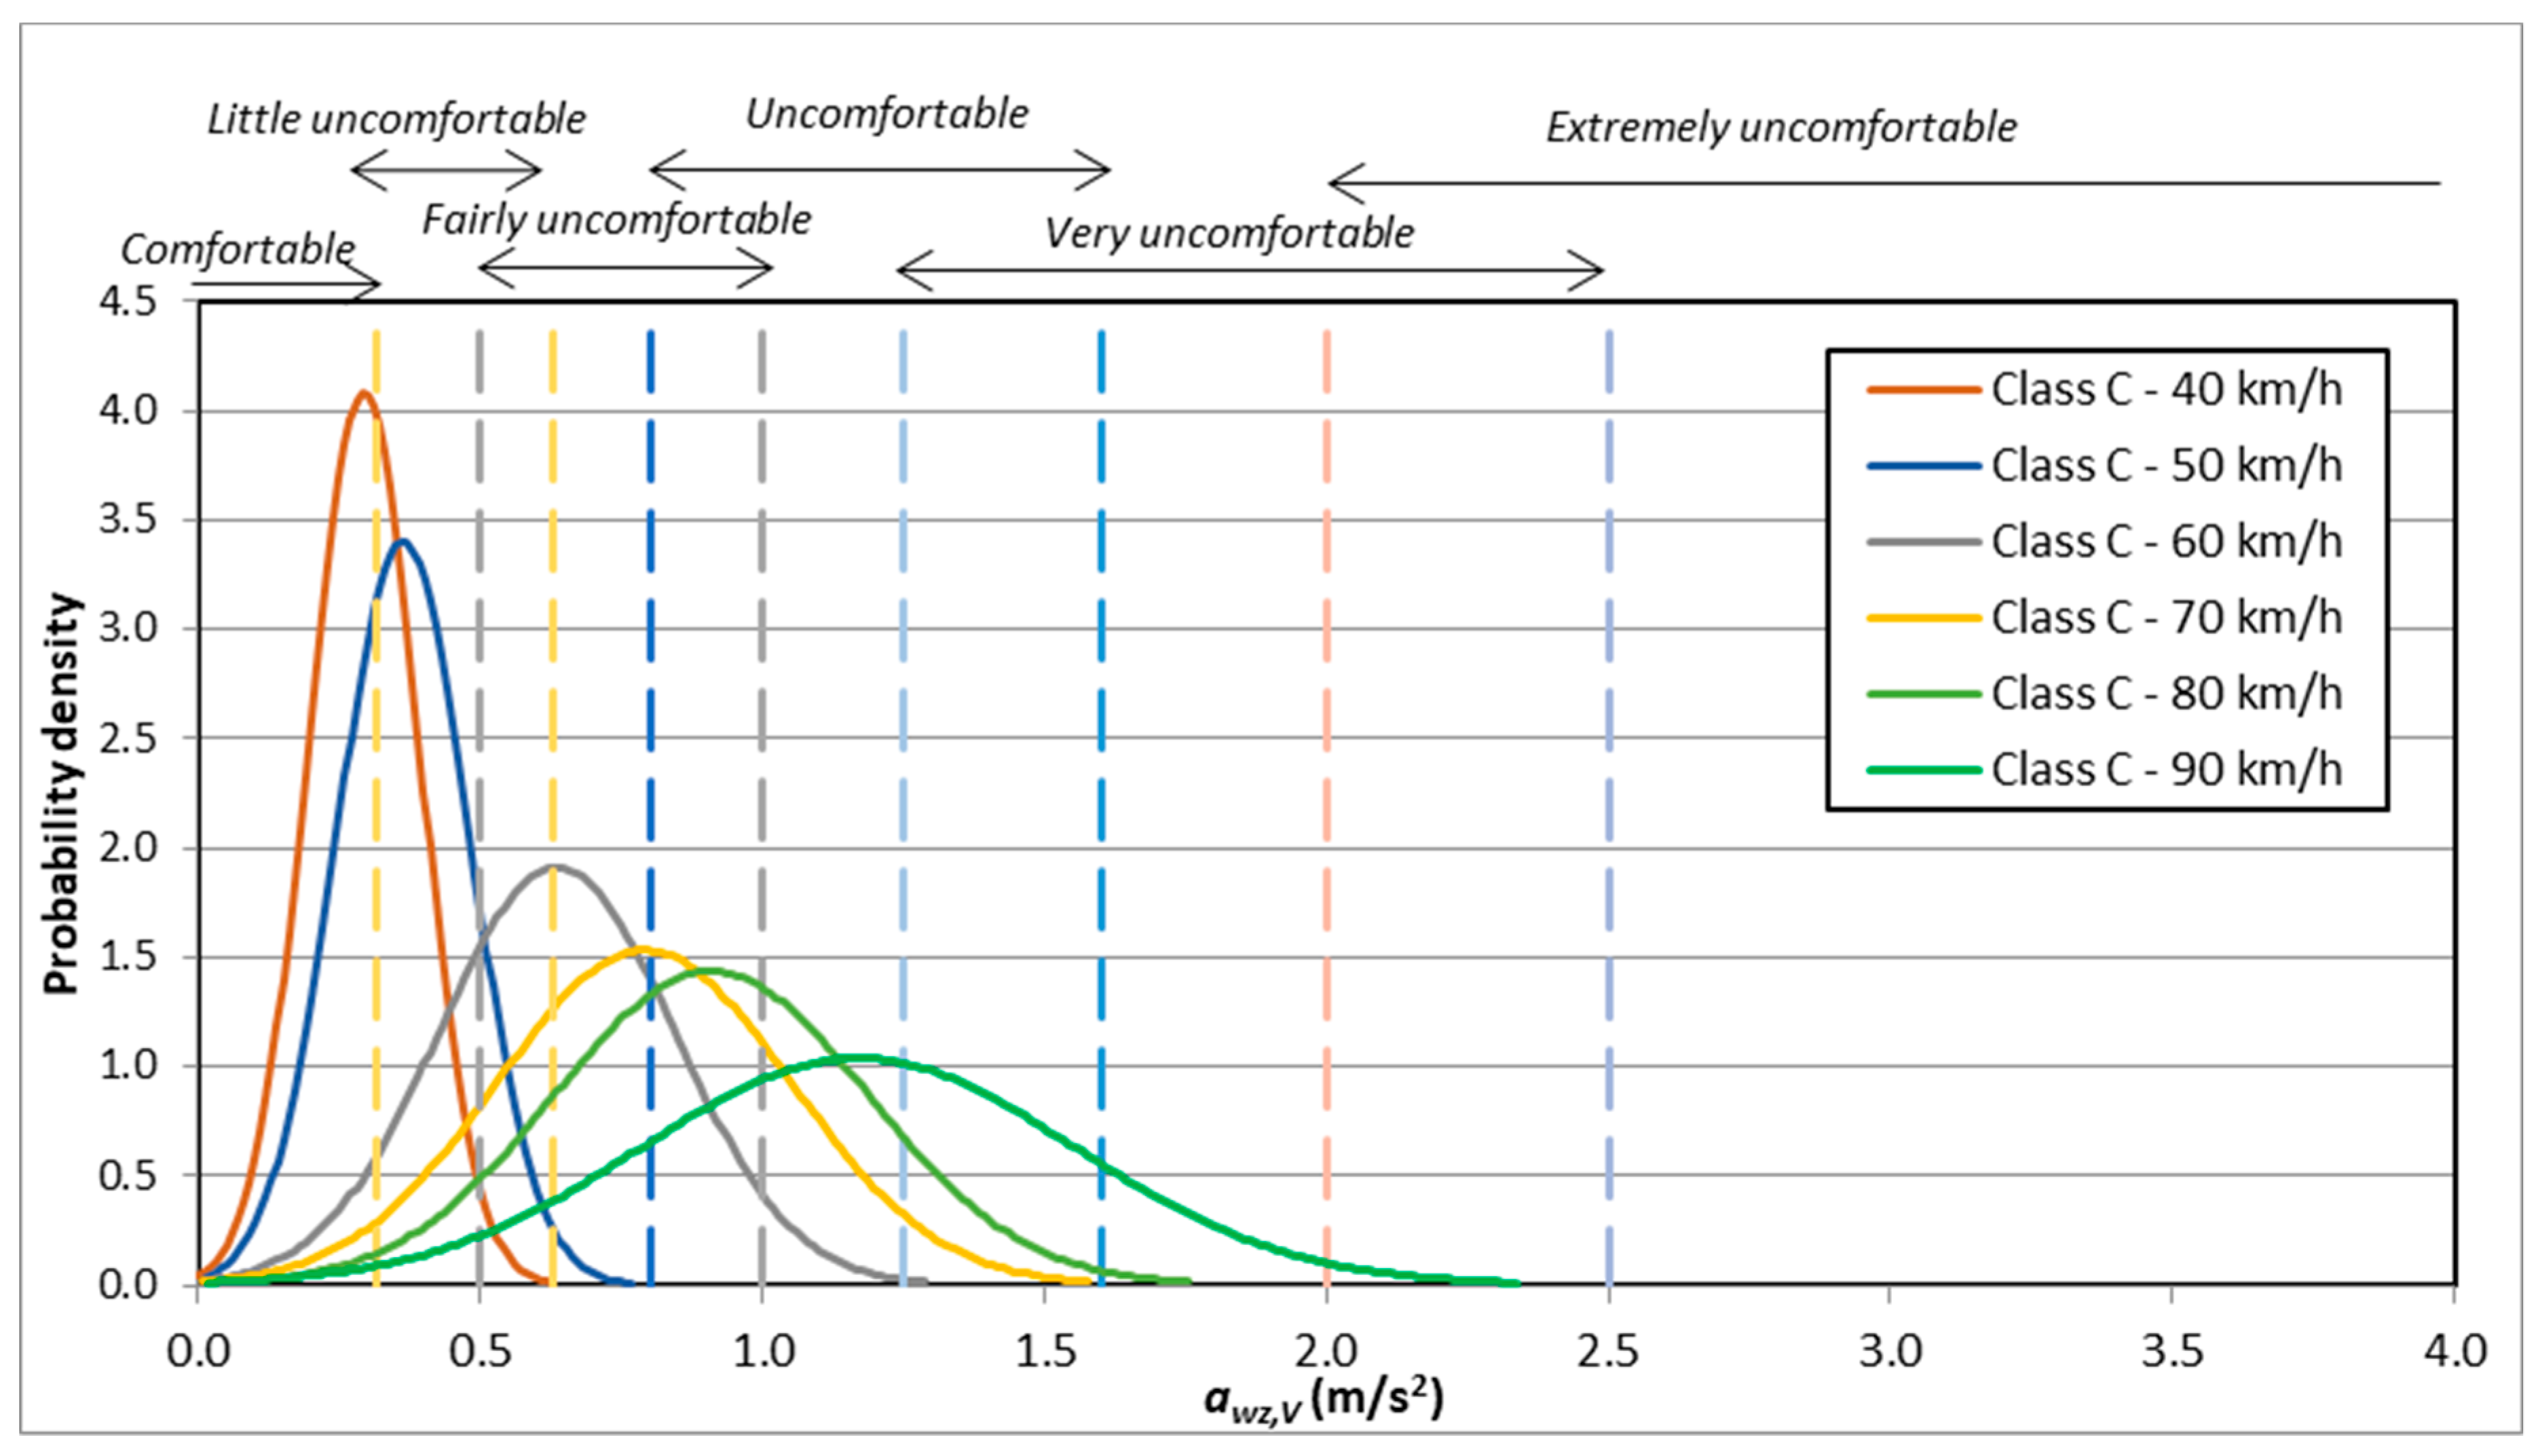
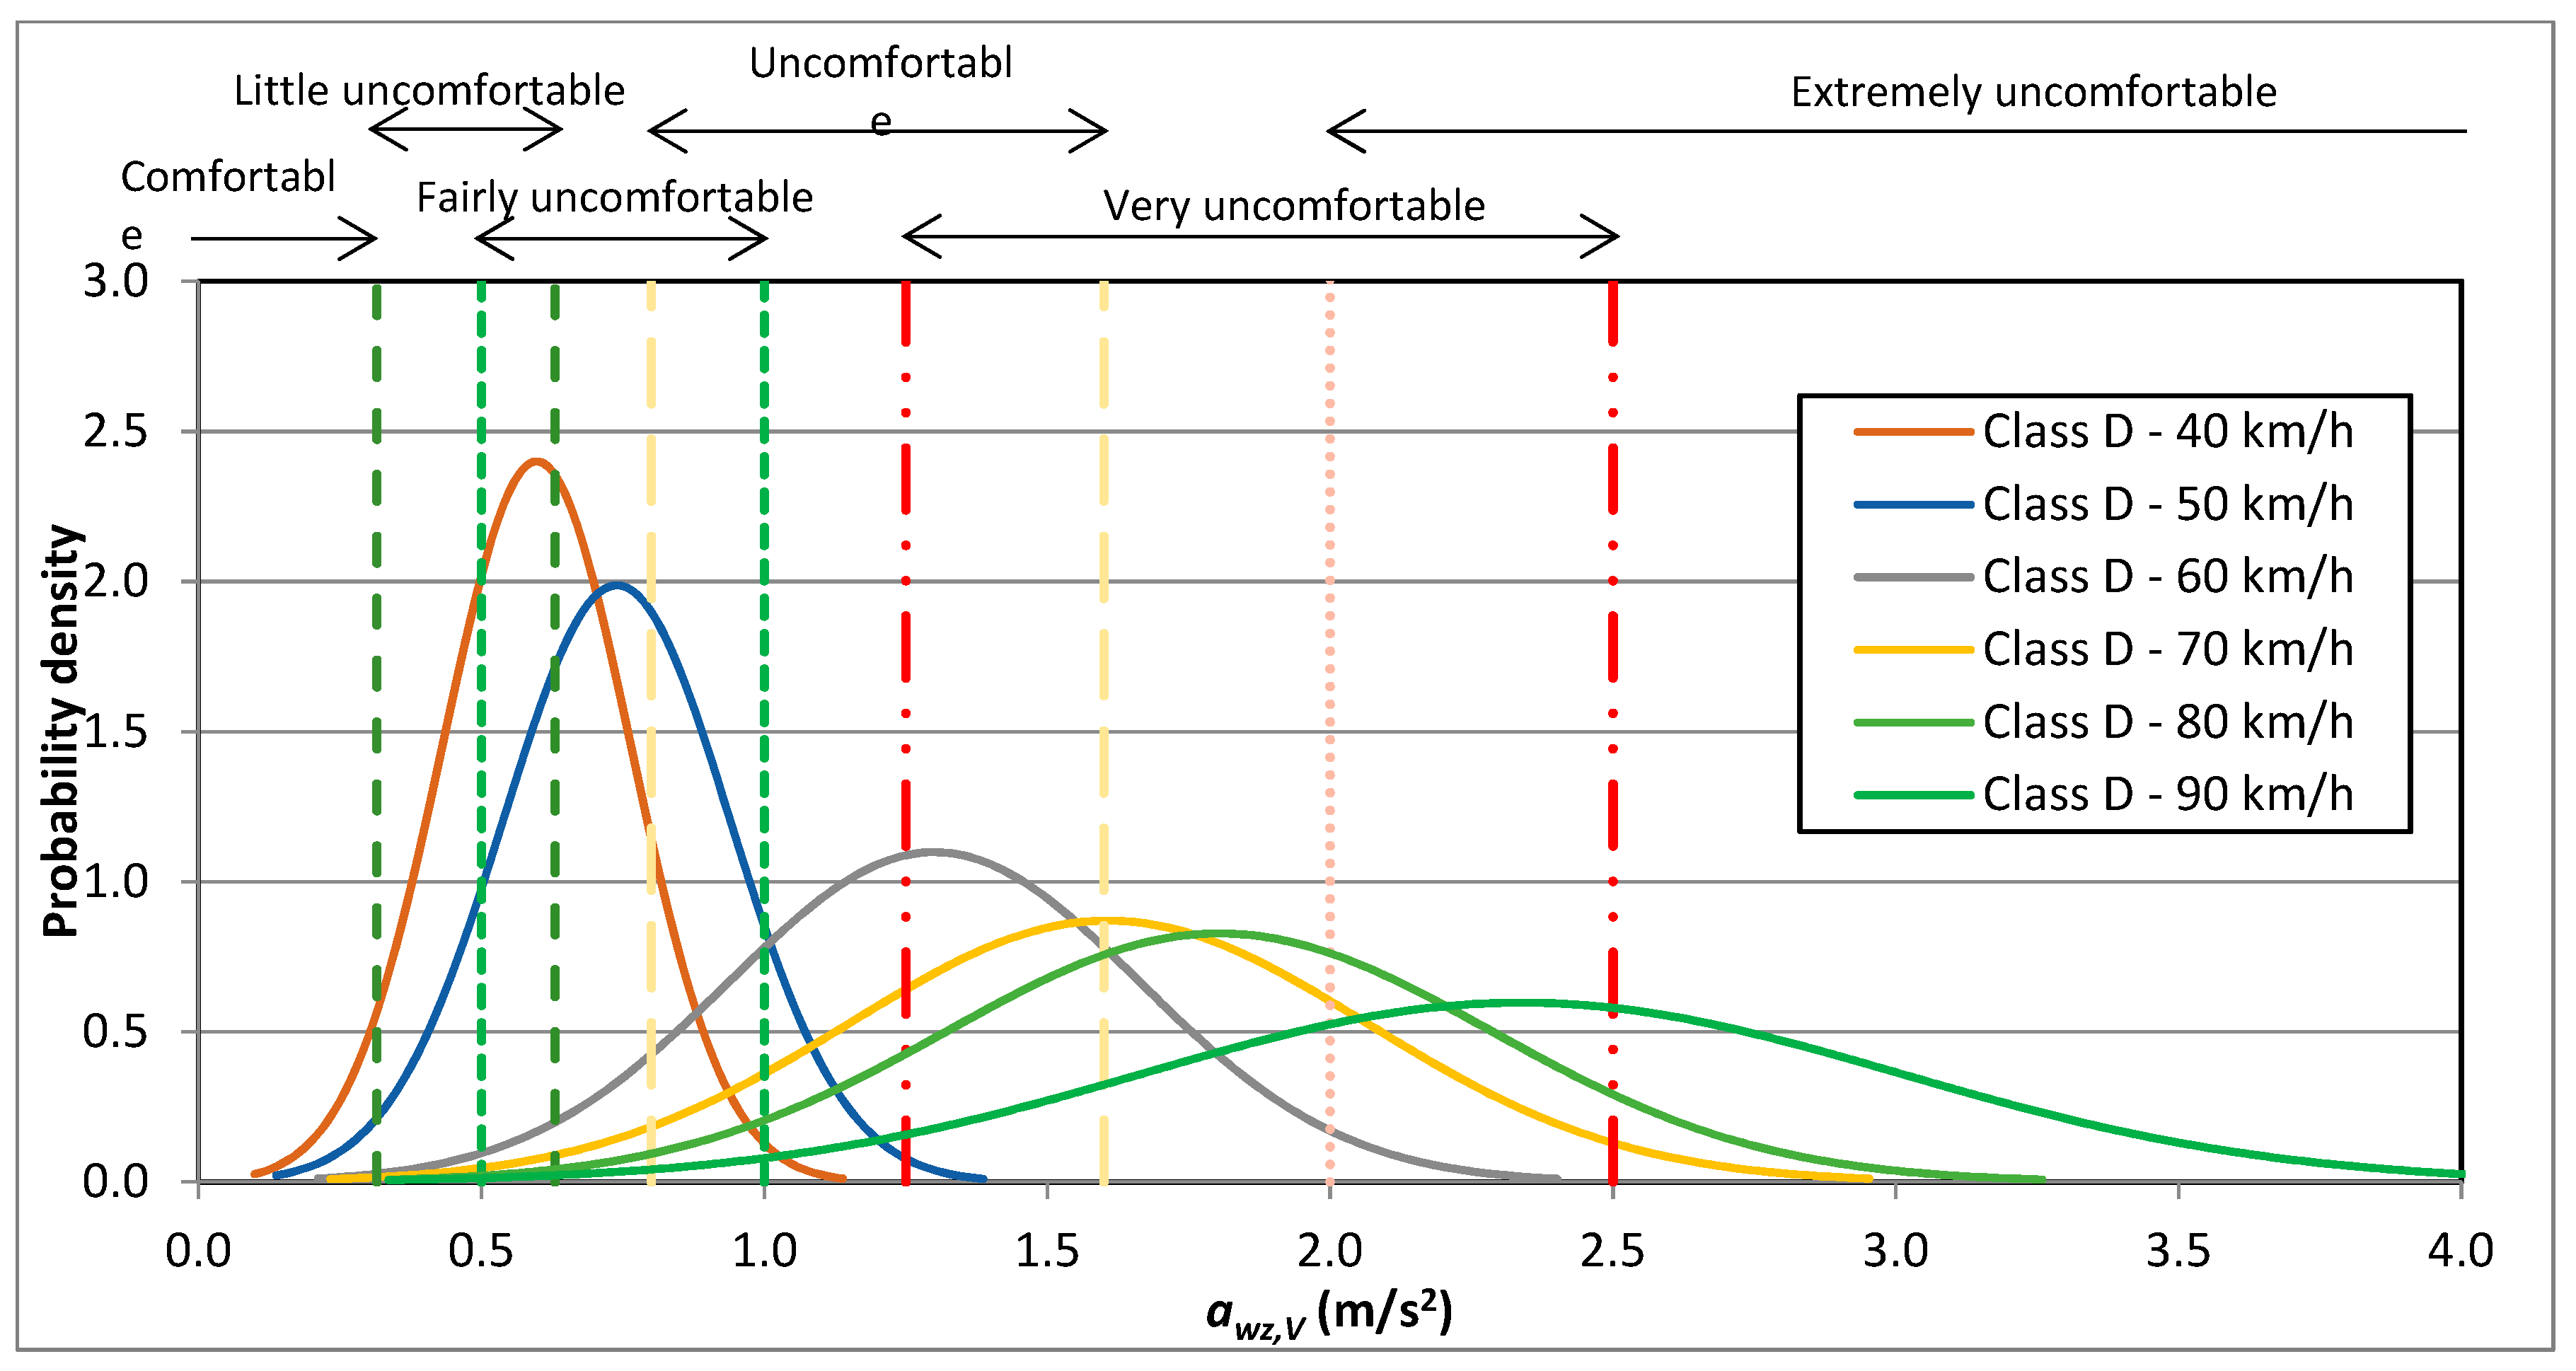
The trend described above confirmed what could be expected. Considering this result, it was decided to calculate
awz values for the sections belonging to classes C and D for a speed range of 40–90 km/h. It was found that, in order to achieve an adequate comfort level for passenger car users (see
Figure 7 and
Figure 8), vehicles should transit at speed between:
With regard to these results, it is reasonable to assume that road users, travelling on the last mentioned two ISO classes sections, will decrease vehicle speed not only as a consequence of the desired level of comfort, but also to avoid possible damages to the vehicles mechanical components. In fact, considering fixed road surface profile and vehicle mechanical characteristics, the vertical acceleration magnitude becomes lower if the traveling speed decreases.
This fact underlines the chance of accepting these ride quality classes in case of roads having very low legal speed limits, like urban roads, while for another kind of roads, like those examined in this research, the speed transit for class C and D profiles cannot be tolerable.
Most of the Pavement Management Systems are based on IRI that is calculated at fixed speed (i.e., 80 km/h) and, as already stated before, such index is usually used to evaluate roughness on different road categories (e.g., highways, primary, local) characterized by different speed ranges.
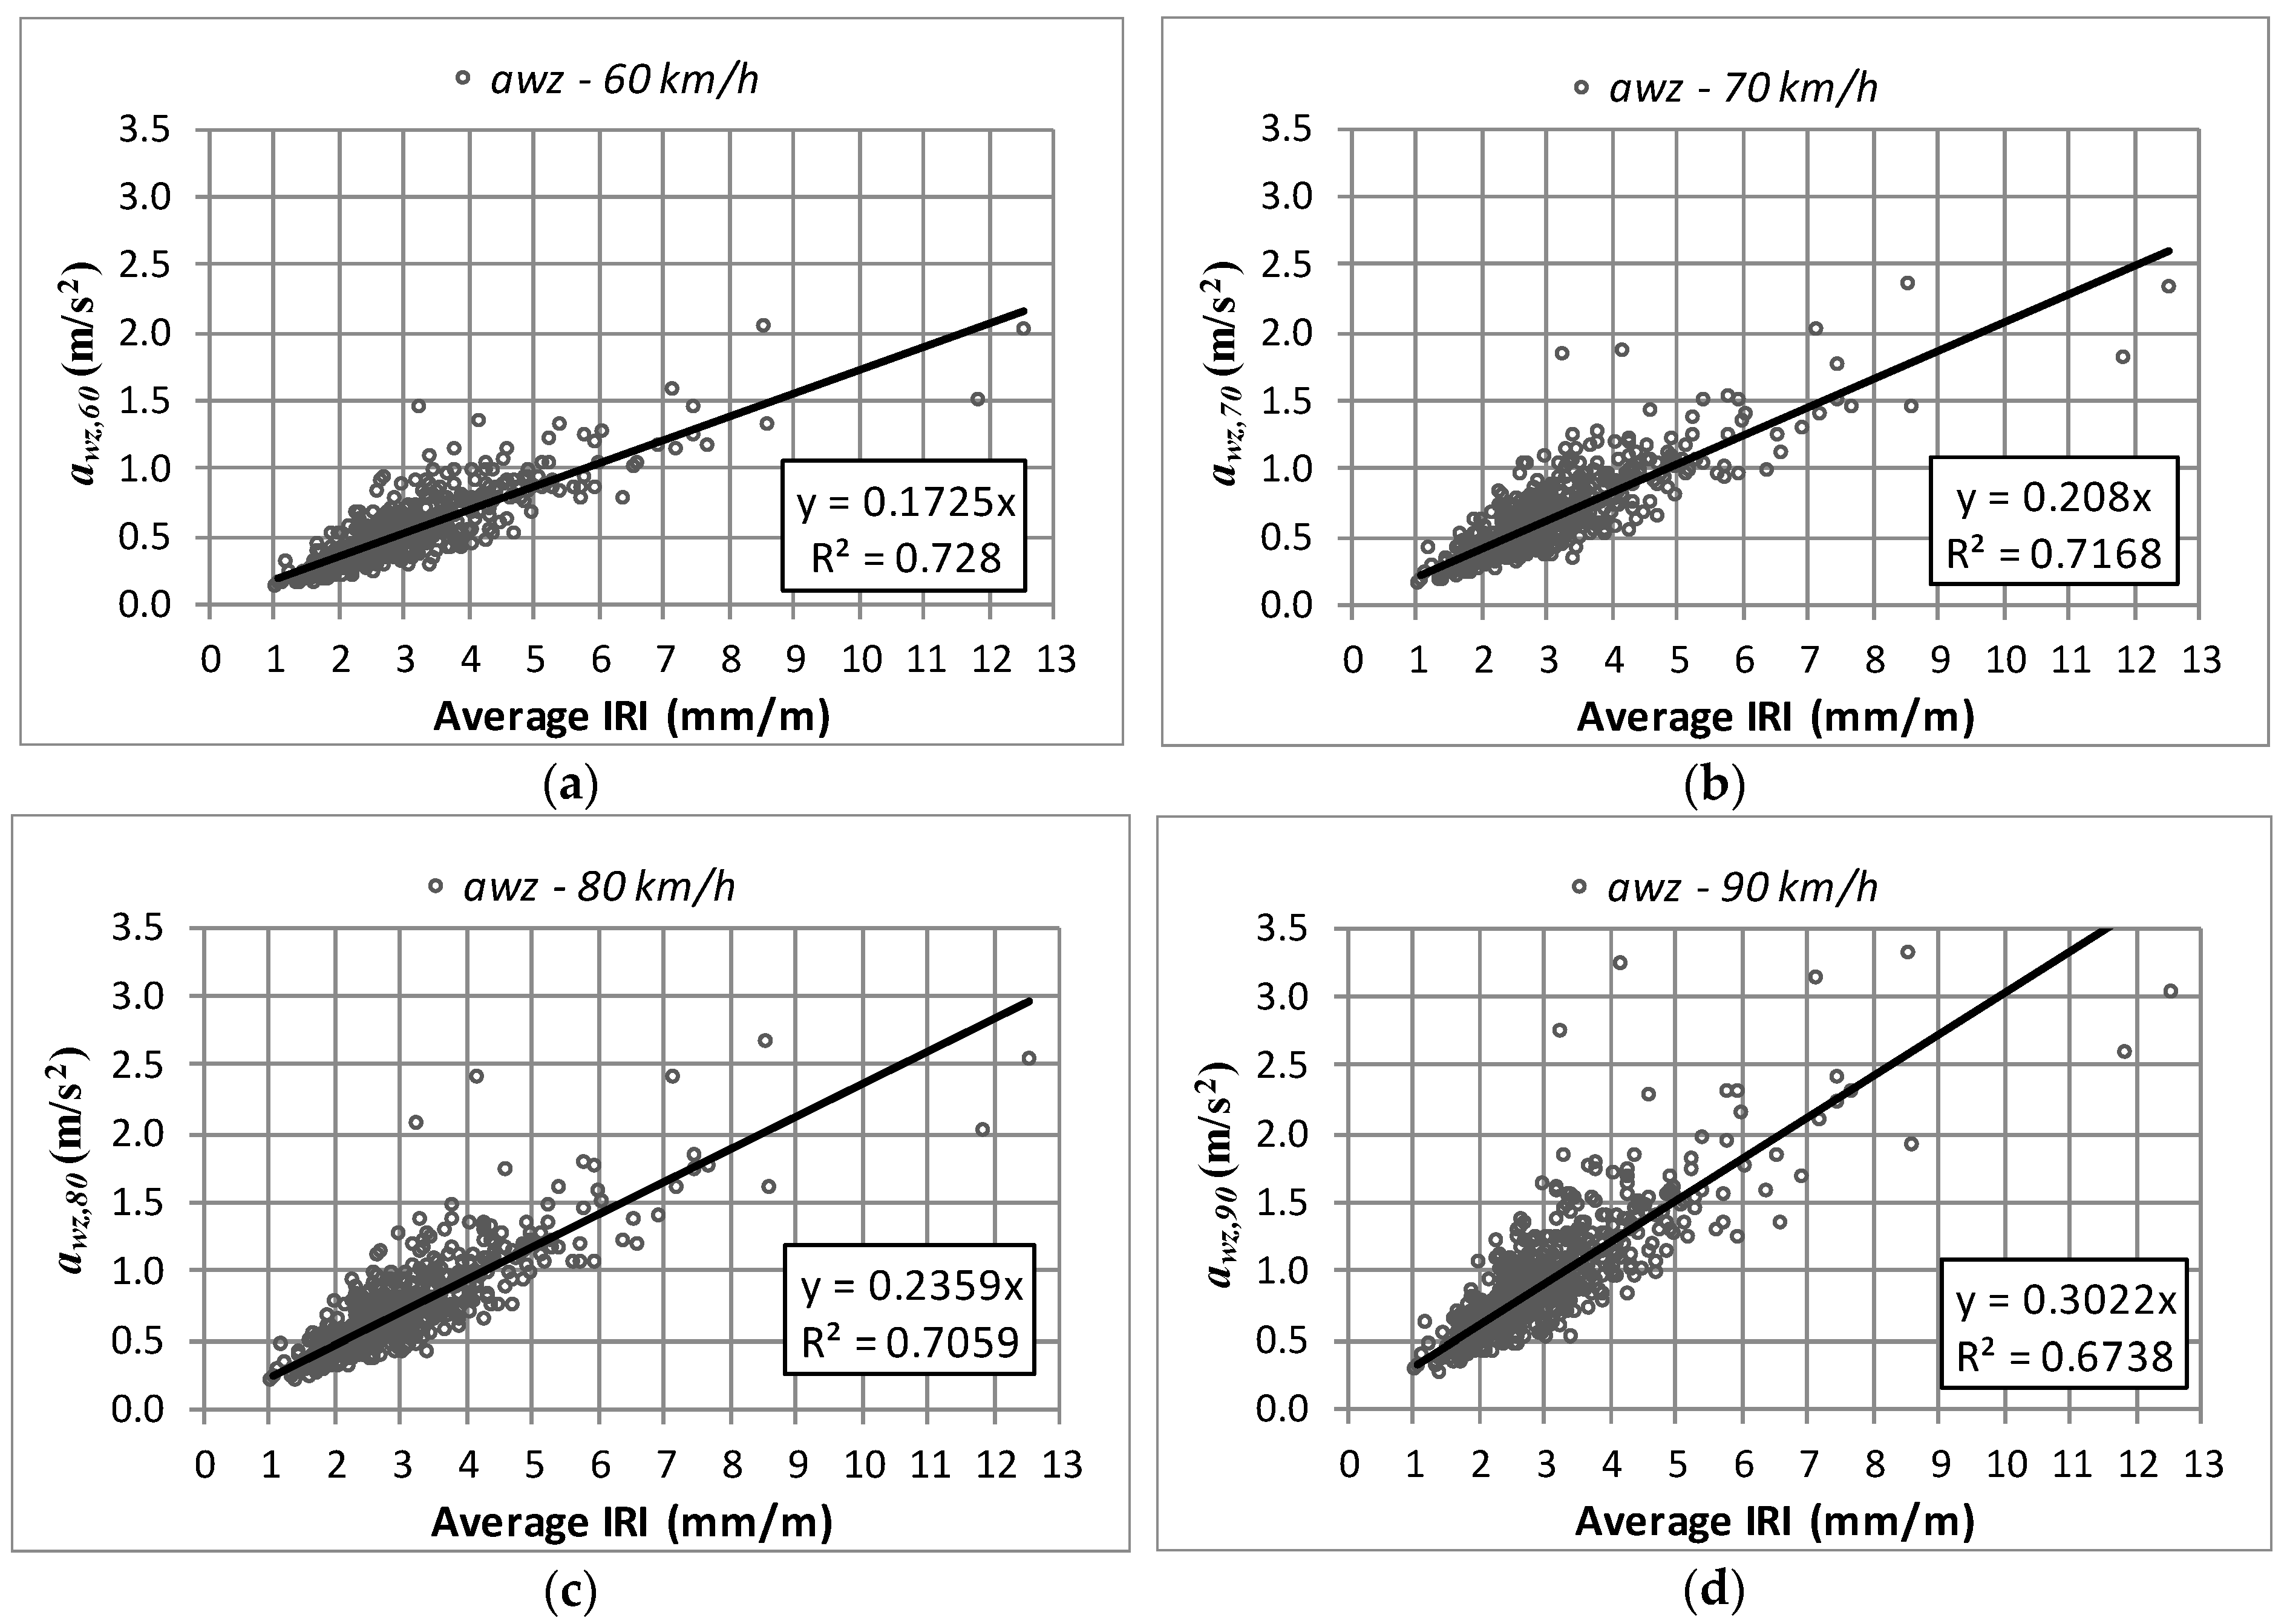
Comparing IRI values with the
awz ones calculated at different speeds falling within the speed range of the examined roads (i.e., 60–90 km/h), it was observed how sections with similar IRI values can induce different acceleration levels on road users, as can be noted in
Figure 9. This aspect remarks the difficulties of IRI index to capture the road users’ perception of the irregularities present along the road as it is significantly affected by the traveling speed that works as a filter (together with vehicles mechanical parameters) applied to the wavelength content of longitudinal road profiles.
In addition, IRI cannot properly capture the presence of punctual discontinuities that can induce a considerable discomfort to road users.
Applying linear regression to the examined data, slope values very close to the ones found by Cantisani and Loprencipe [
17] were obtained and reported in
Table 4. This result seems important, considering that the profiles sample analyzed in this research is particularly representative because it belongs to real roads. The similarity of the slopes obtained by the linear regression underlines the possibility of using the speed-related IRI limits proposed in the last-mentioned paper, in order to relate IRI values to the level of comfort perceived by users.
As previously explained, in this research sections with a length of 320 m were considered to make comparisons with homogeneous data compared to previous studies. In fact, for the evaluation of road roughness pavements, lengths of less than 320 m are generally used (over the World, a length of 100 m is adopted [
28]) to better highlight the presence of punctual irregularities in the road section.
On the other hand, the main benefit of finding and using IRI thresholds consists in the fact that many road agencies commonly use profilometers that can be used for IRI calculation. On the contrary, adequate instruments to measure accelerations levels inside road vehicles are not actually common, and above all, there are no regulations for the pre-and post-processing of acquired data.
However, in the opinion of the authors, the best approach to the problem would be to directly use the measurements of the acceleration levels as, through this method, it is possible to obtain additional information about ride quality and the effects of road condition on the driving speed.
3.3. Estimation of Road Users Running Speed
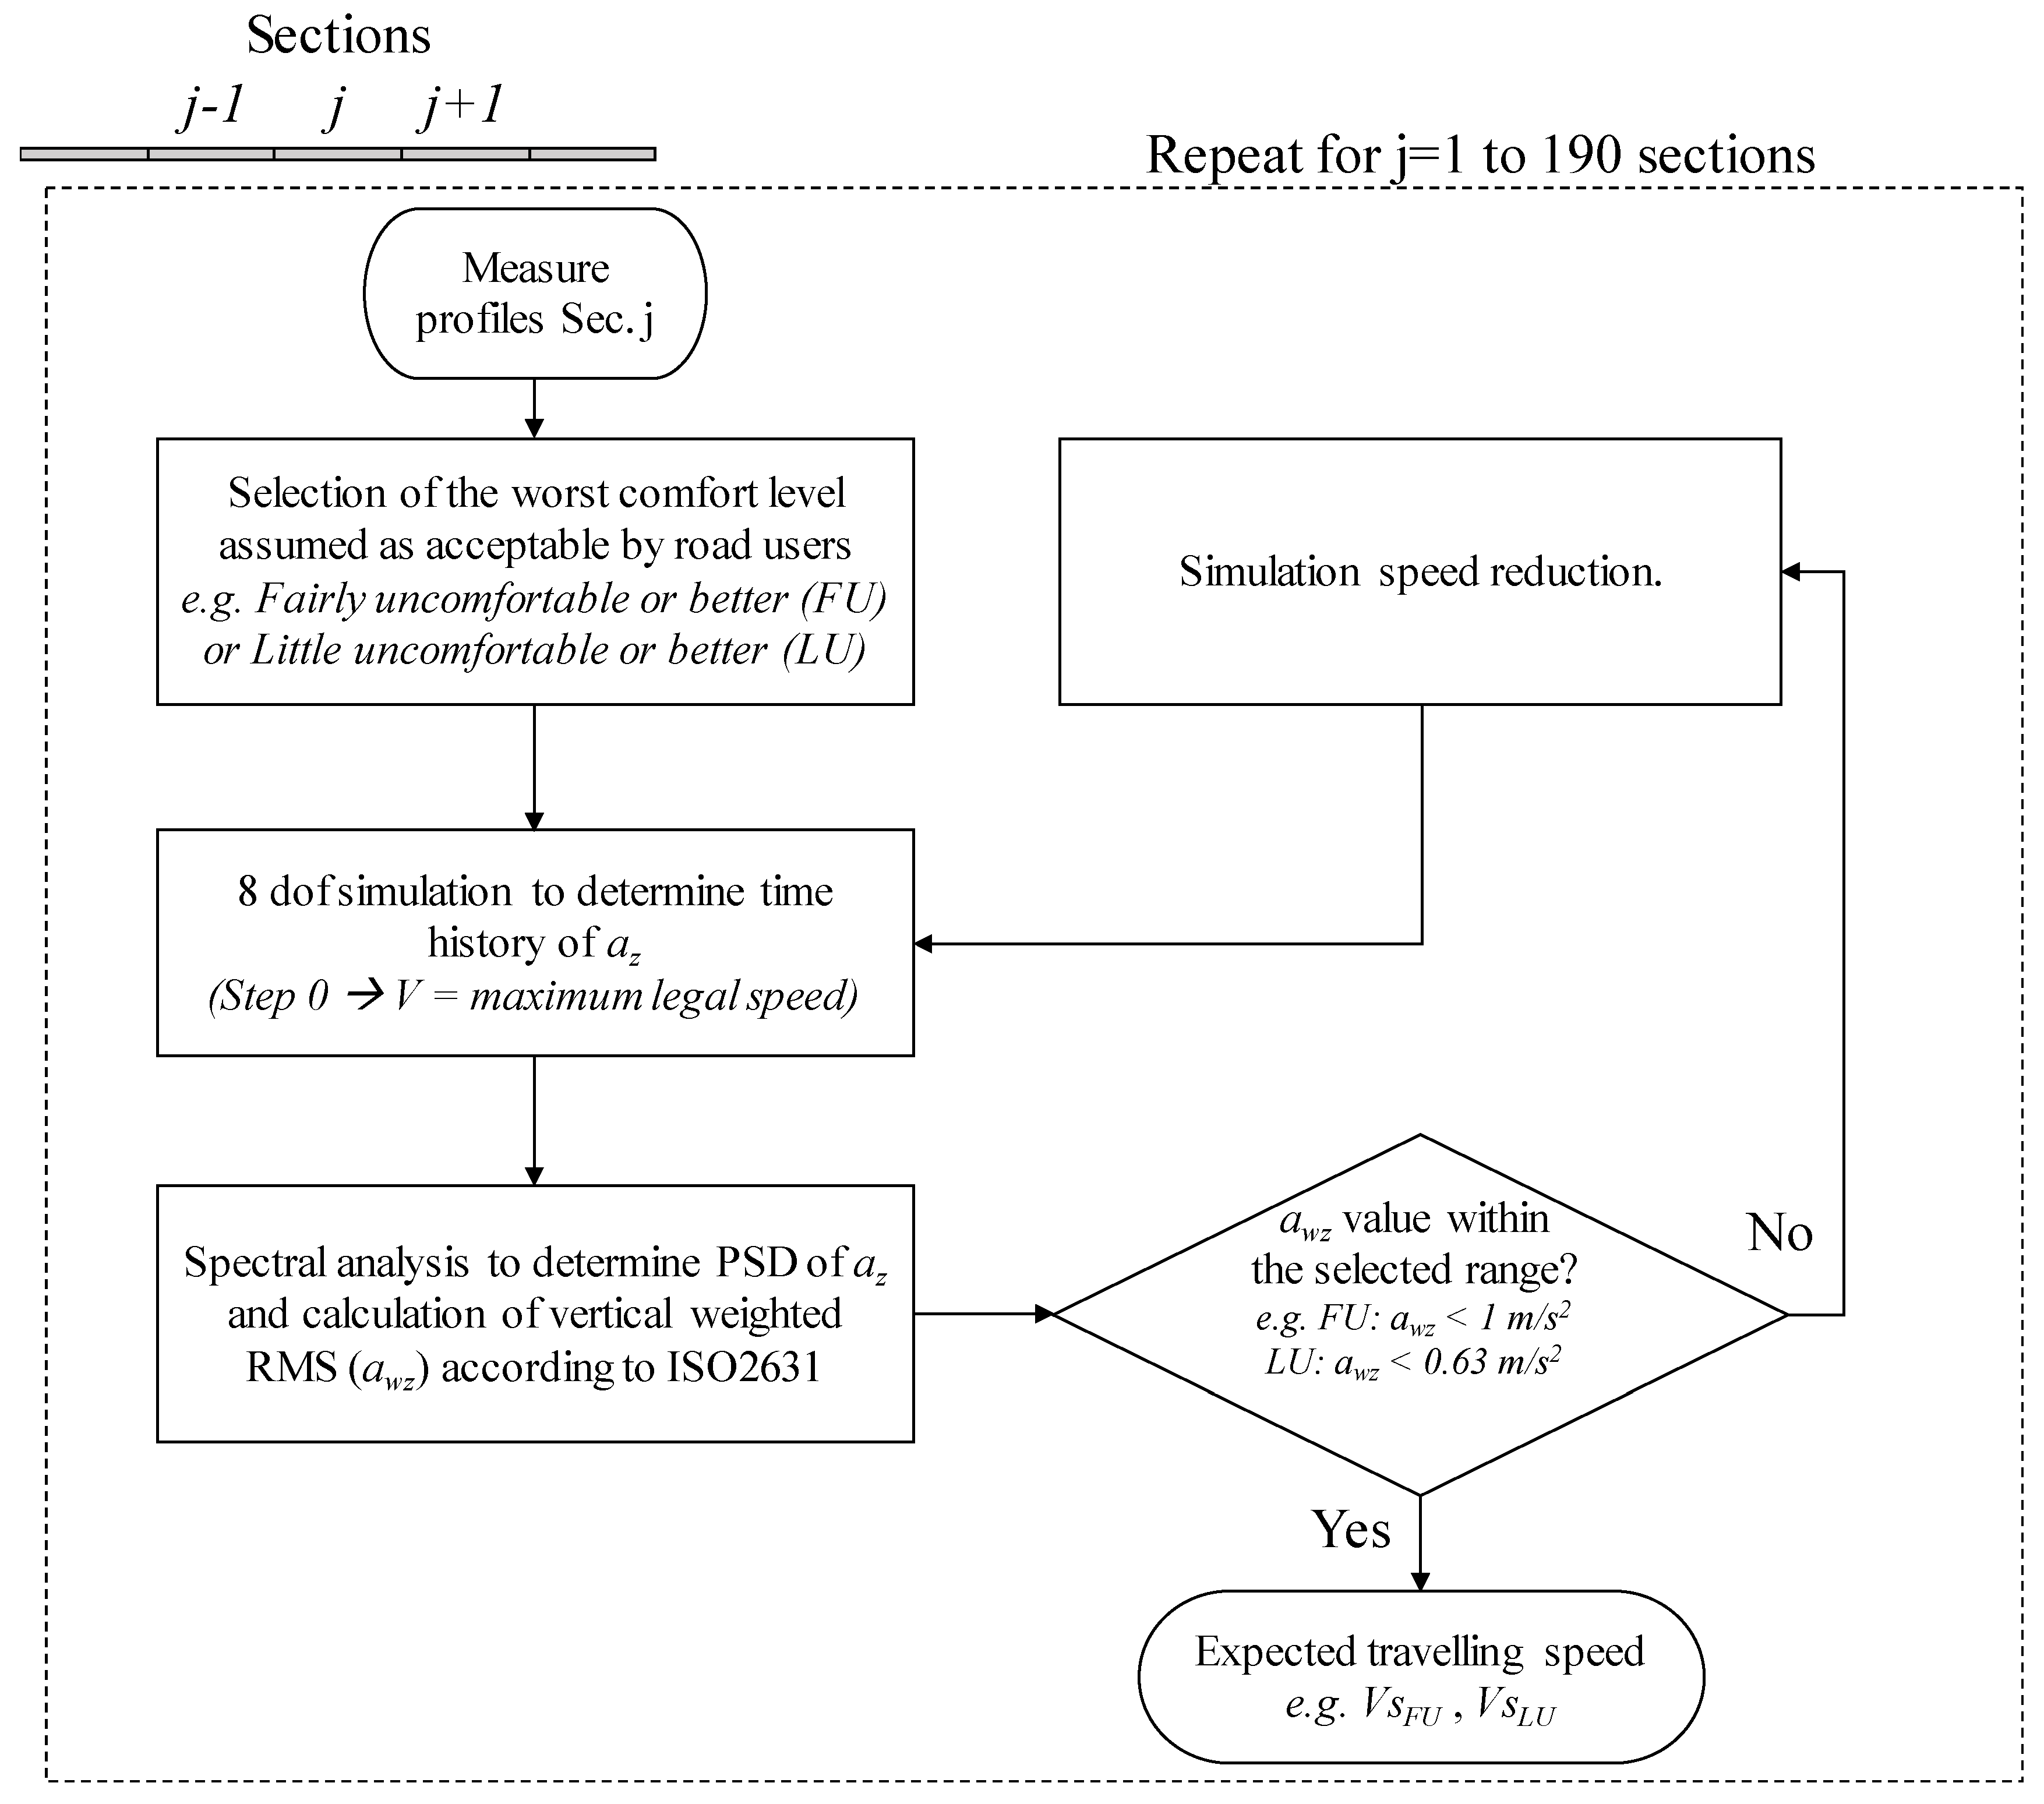
Using the approach described in ISO 2631, it is possible to estimate for each road section the speed values according to which the road users may accept a particular level of discomfort due to road roughness.
In this sense, the first step should consist in defining the target comfort level but this activity presents certain difficulties since it depends on several aspects as also confirmed by the overlapping zones between adjacent levels provided in ISO 2631 standard. For these reasons, it was decided to consider for this analysis, two different target comfort levels:
- ▪
Fairly uncomfortable or better (awz < 1 m/s2);
- ▪
Little uncomfortable or better (awz < 0.63 m/s2)
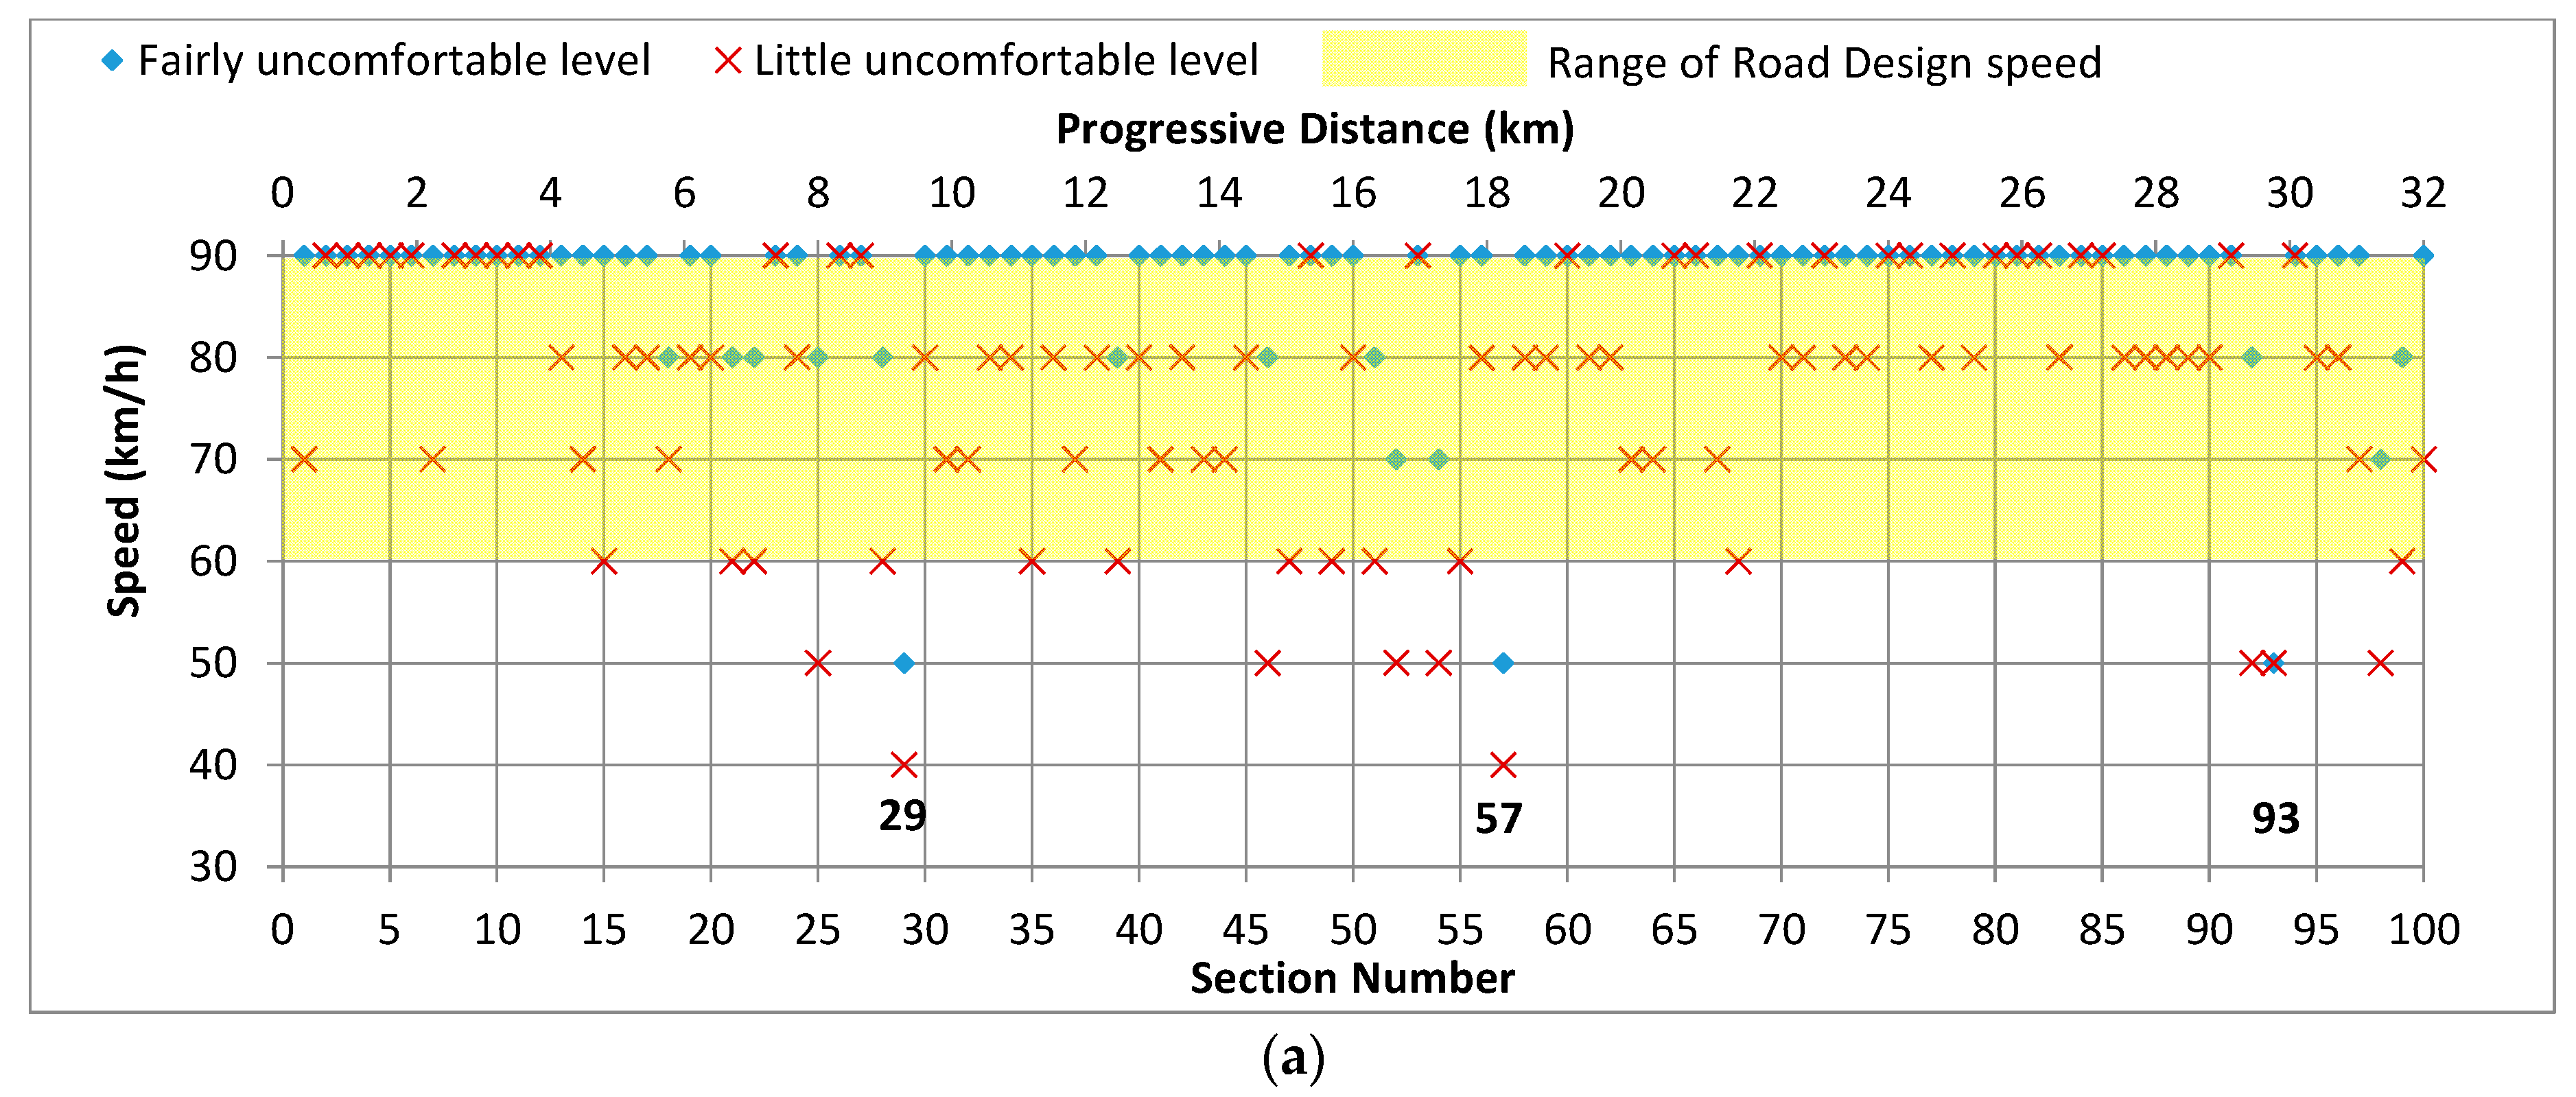
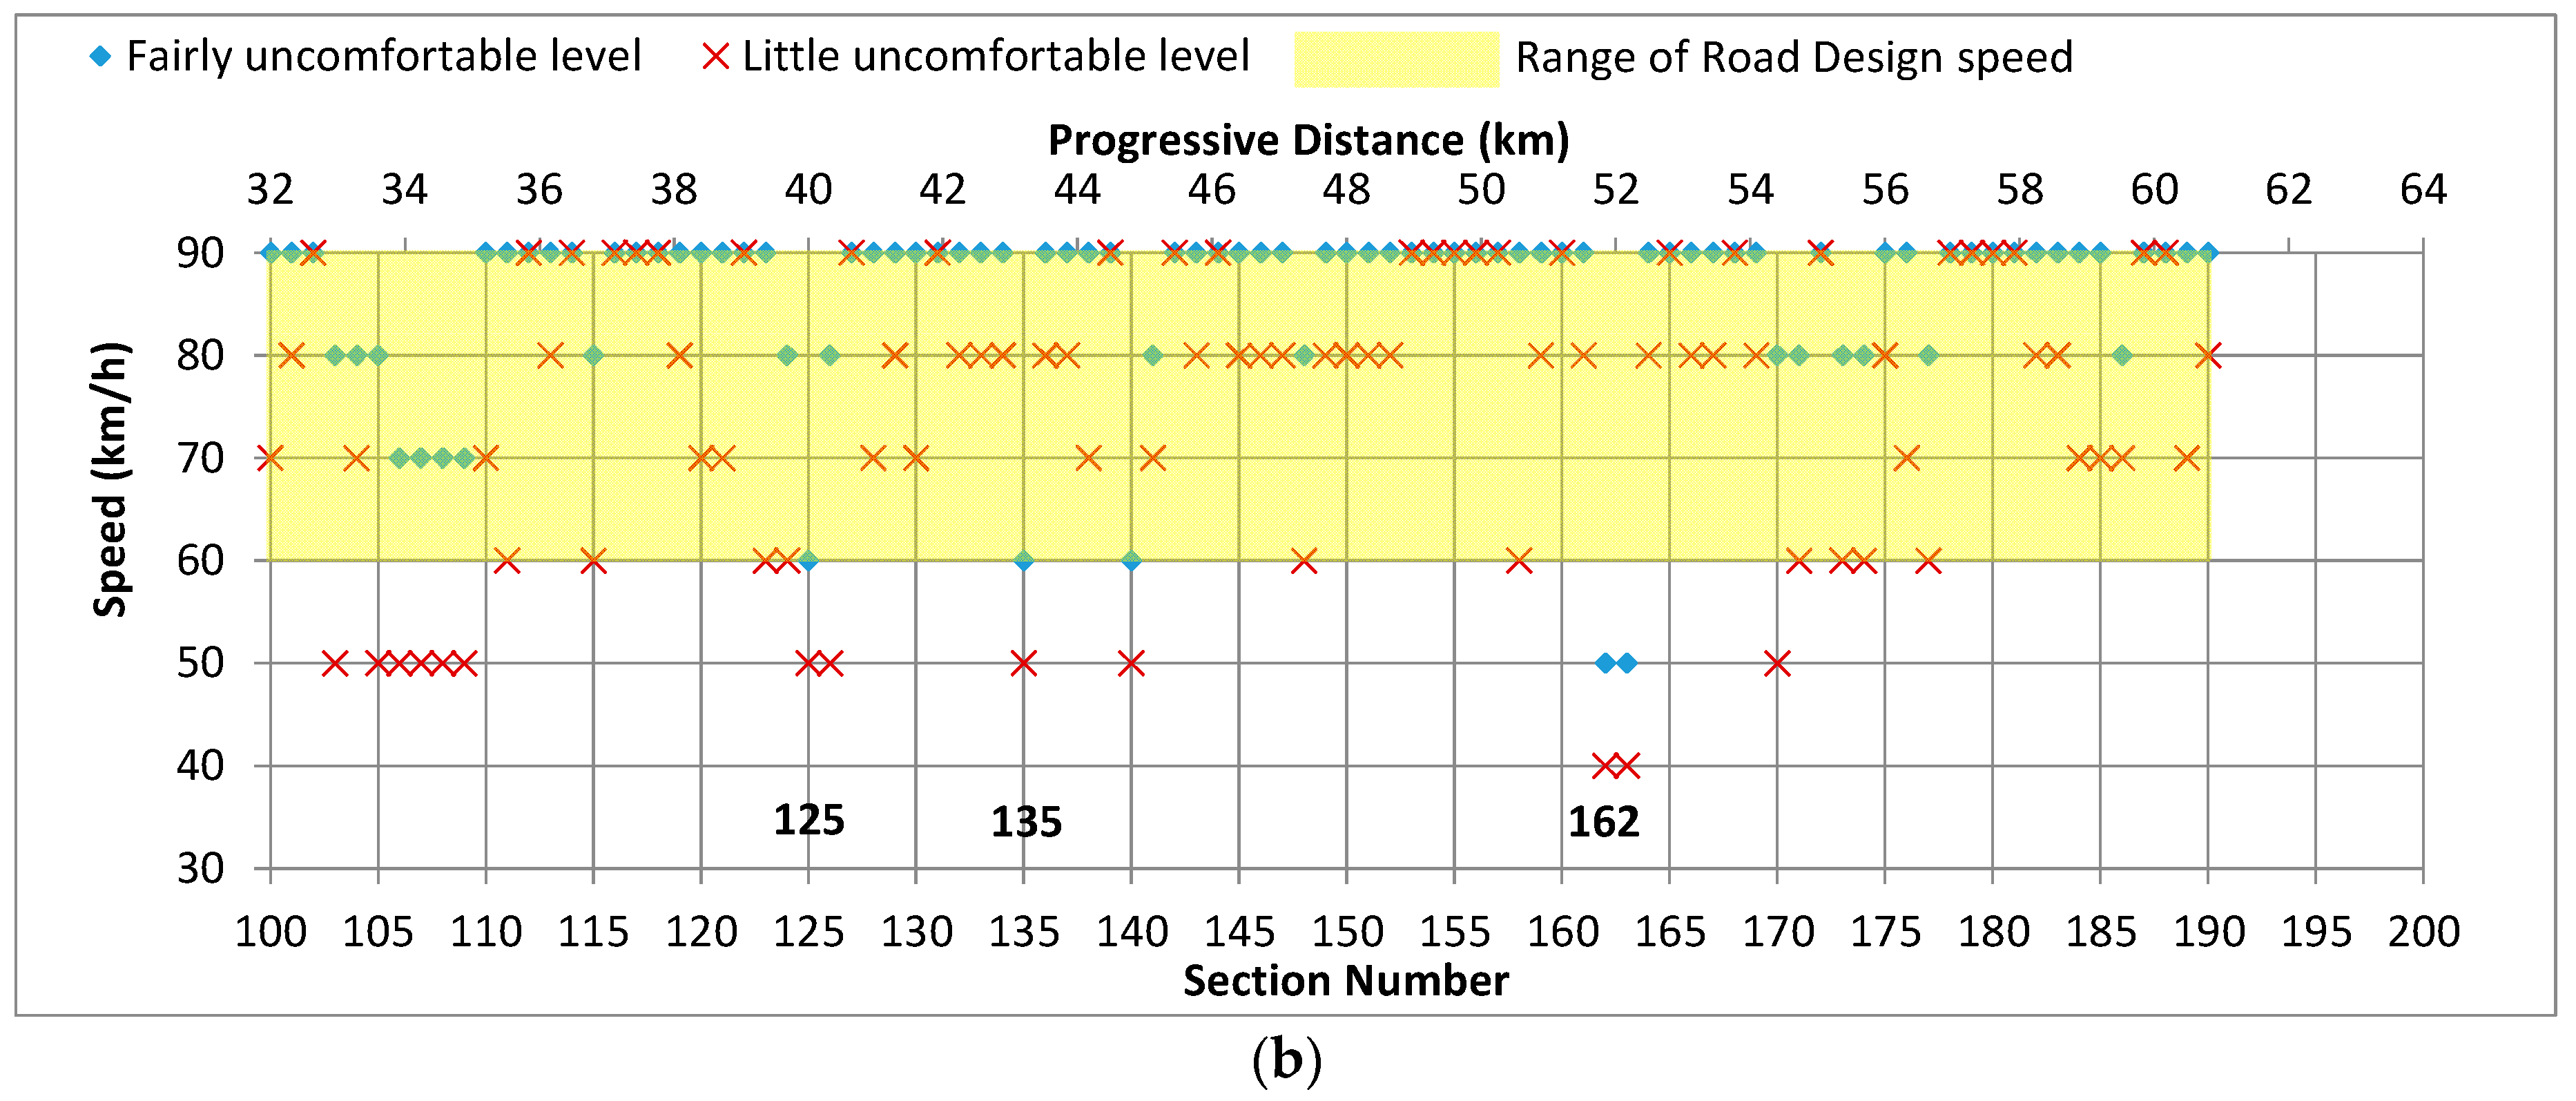
Considering for example the 190 sections of Road 04, the maximum speed values for which the perceived comfort level is equal or better to the target comfort level defined above were determined for all the sections adopting the procedure described in
Figure 10. The results are reported in
Figure 11.
Once the estimated road users speed is calculated along the whole road for each of the two comfort levels, the results can be compared with the design speed to found the sections where the unevenness level does not allow running at speeds compatible with the specific speed range of the examined road.
Analyzing the graphs in
Figure 11, the sections that are expected to be run at speed lower than the minimum value of the design speed interval of the examined road (equal to 60 km/h) can be located. Furthermore, it is possible to compare the speeds of adjacent sections, assessing if the transition between them is adequate and acceptable in terms of safety and performance criteria.
In this way, road agencies can properly locate the priority needs, also evaluating the overall level of service (LOS) through a comparison with the geometric characteristics of the road.
The results obtained with the aforementioned approach were then compared with the ones obtained for the same sections using the IRI approach. In particular, the comparison concerns the application to Road 04 of the speed-related thresholds found for IRI and the traveling speed estimated considering the
awz method. Thus, the speed obtained (with an approximation of 10 km/h) considering a “
Fairly uncomfortable” level (or better:
awz < 1 m/s
2) for each section of Road 04 and the corresponding IRI values are reported in
Figure 12. In the same figure, the IRI threshold between
Fair and
Mediocre ride quality (IRI = 2.31–3.30 mm/m) proposed by Cantisani and Loprencipe [
17] or Yu et al. [
15] (these limits are very close) for a maximum value of design speed is also reported.
The indications provided by IRI threshold seems, in general, to be in agreement with the ones provided by the speed diagram (for
Fairly uncomfortable level or better, see
Figure 12) but, for some sections, they can induce the road agencies to intervene while speed and users comfort could still be acceptable. This circumstance should be considered also because, in general, this kind of choices is influenced by financial constraints and availability of resources.
In these sections (highlighted with arrows), there is no correspondence in the diagram between the exceeding of the proposed IRI threshold and the occurrence of a speed reduction to guarantee an acceptable level of comfort. For these cases, we can consider that the linear regression between values of awz and IRI is not able to fully explain the phenomenon or the different value of reference speed, affected by the adopted approximation of 10 km/h, does not allow to appreciate the required speed reduction.
In other sections, where the exceeding of thresholds is more evident, the proposed methodology rightly proposes very large speed reductions to guarantee the expected level of comfort.
In addition, it is possible to note that for these most critical sections in Road 04 (see
Table 5), the measures required to reduce discomfort level is similar for sections having quite different IRI values (e.g., Section 29 and Section 57). On the other hand, the results in terms of maximum allowable speed capable to grant a certain comfort level can be different even for sections having very close IRI values, like sections 57, 93, 125, and 135.
Besides, considering sections 105 and 109 (in
Figure 12), which apparently present very good IRI values (both lower than 3 mm/m, respectively 2.79 and 2.65 mm/m), the speed diagrams show that for
Fairly uncomfortable level, both sections can be traveled at speeds within the design speed range characterizing the examined road. However, if a better comfort level is desired (
Little uncomfortable), the speed should be lower than the minimum value (60 km/h), precisely equal to 50 km/h (see
Figure 11), and this condition could not be accepted. In particular, this can be a sign that a significant degradation in the next future can be expected to happen on these sections before than on others. Such indications would be very useful to develop a proper maintenance plan.
As already stated before, it is important to highlight that vertical weighted accelerations on road users can provide more information to road agencies. In fact, in addition, to assess road roughness on pavements surface, also relating it to the comfort levels, road agencies can evaluate the possibility to impose a decrease of the allowed speed in order to have an acceptable ride quality until the optimal road conditions will be restored.
Finally, a general overview of the advantages and disadvantages for each of the three methods (ISO 8608 classification, IRI,
awz) considered in this work is reported in
Table 6.


