Article

Monitoring the Dynamic Response of a Buried Polyethylene Pipe to a Blast Wave: An Experimental Study

College of Science Wuhan University of Science and Technology, Wuhan 430065, Hubei, China
*
Author to whom correspondence should be addressed.
Appl. Sci. 2019, 9(8), 1663; https://doi.org/10.3390/app9081663
Submission received: 27 March 2019 / Revised: 15 April 2019 / Accepted: 16 April 2019 / Published: 22 April 2019
(This article belongs to the Special Issue Structural Damage Detection and Health Monitoring)

Abstract

:
Although the use of polyethylene (PE) pipelines has become increasingly widespread in recent years, few studies have addressed their seismic design and ability to withstand blast waves. In order to establish their seismic capacity, the dynamic response of buried pipelines subjected to blast waves must be explored in depth. Here, we studied the dynamic response of PE pipes situated near an explosive source. Time histories of dynamic strains were measured by conventional strain gauges after simple waterproof treatment, and pipe and ground vibration velocity curves were obtained. Based on the experimental data, the attenuation law of the peak strains under the conditions of different charge masses and blast center distances was analyzed, and the spectrum characteristics of strain, velocity of the pipe, and ground velocity were studied. The results revealed that a large hoop strain on the PE pipes was produced due to the local impact near the explosive source. We found that peak hoop strain (PHS) or peak axial strain (PAS) had a power attenuation relationship with the scaled distance, and this relationship could also be derived by dimensional analysis. The average frequency of strains had the same attenuation form as the charge mass, which was between 10 Hz and 50 Hz. Additionally, the vibration of the pipe showed a low frequency. We also determined that the attenuation of the average frequency of pipe and ground vibration velocity was closely related to the charge mass and the scaled distance. Pipe peak vibration velocity (PPVV), ground peak particle velocity (GPPV), and the peak dynamic strain of pipe were highly positively correlated, which verifies the feasibility of using GPPV to characterize pipeline vibration and strain level. Thus, a blasting criterion of 10% minimum request strength (MRS) for PE pipe was proposed, which means that the additional PHS or PAS of the dangerous point must be less than 10% MRS, and we also propose limiting the safety distance–charge mass for blasts near buried PE pipelines by the criterion. Some results in this paper can serve as the basis for future in-depth theoretical research.

1. Introduction

Recently, enabled by advanced sensing technology [1,2], the rapid development of structural health monitoring (SHM) [3,4,5,6] and damage detection [7,8,9,10] in many fields, especially in the field of civil infrastructure [11,12,13], has occurred. In particular, SHM of pipelines—a major form of infrastructure—has received much attention [14,15,16]. Representing a new trend in pipeline technology, the use of polyethylene (PE) pipelines has become increasingly widespread because of their corrosion resistance and low cost. However, compared with their metal counterparts, PE materials have much lower moduli and are prone to damage as a result of extreme events [17,18,19], such as explosions, which often accompany underground construction. Blasting technology is an economical and efficient type of construction technology that is commonly used in underground engineering. However, blasting operations inevitably trigger some negative effects. The impact and vibration effects of blast waves may cause potential safety hazards to surrounding underground pipelines. Therefore, the accurate calculation of the safety distance between an explosion source and a pipeline is essential for the rational design and safe construction of engineering blasting.
Structures subject to high strain rate loads, such as explosion and impact, have received much attention [20,21,22,23,24]. To date, many experts and scholars have studied the allowable vibration velocity criterion of buried pipelines under the impact of blast waves. The recommended ground peak particle velocity (GPPV) safety criterion ranges from 2.0 cm/s to 15 cm/s with a wide span [25,26,27,28,29]. In actuality, the difference in the responses of different pipes subjected to the same blast wave may be very large due to varying materials and types of pipe. Moreover, the strength (yield) limit and impact resistance of individual pipes are also different, and the generation and attenuation of blast waves are very different under varying charge and site conditions. These distinctions are very important; however, such differences cannot be reflected by a single velocity criterion. Examples of representative research on buried pipelines subjected to the impact of blast waves include the following: Dowding’s calculation formula, which is derived from a plane wave with constant amplitude, whose calculation result can be used as the upper limit of the response of buried pipelines under far-field plane waves [30]; and the empirical formulas proposed by Esparza et al. based on model and field test data, which require applicable site conditions and experimental environments [28]. There are also two typical semi-theoretical, semi-empirical formulas: One by Kouretzis et al., which is based on the harmonic assumption and uses a thin shell cylindrical model [31], and another by Abedi et al., which is based on the law of pressure attenuation of blast waves and uses the beam model on elastic foundation [29]. In these two formulas, the blast wave and pipe were simplified by different types, and therefore, their applications require further investigation and analysis. Thus, most of the existing criteria are based on their respective engineering cases, and current, in-depth research on the dynamic responses of pipelines subjected to blast waves is still lacking, especially with respect to PE pipelines.
In this study, the dynamic response of a PE pipe situated near an explosive source was investigated. The pipe was directly buried in the soil, and measurements, including pipe dynamic strains, vibration velocities of the pipe, and ground vibrations were measured. The results revealed that a large hoop strain on the PE pipe was produced due to the local impact. Additionally, we found that peak hoop strain (PHS) or peak axial strain (PAS) has a power attenuation relationship with the scaled distance. The spectrum analysis revealed that the pipe vibration was a low-frequency vibration; therefore, the dynamic effect of pipe vibration can be ignored, and the process can be considered to be quasi-static when blasting criteria are discussed to ensure the safety of nearby PE pipes. Finally, a blasting criterion of 10% minimum request strength (MRS) for PE pipes is proposed.

2. The Experimental Setup

2.1. PE Pipe Parameters

A water supply pipe made with black PE80 material was chosen as the experimental object. Since the mechanical properties of PE materials with medium and high density vary greatly with different processing techniques, a material tensile test was conducted. The parameters of the PE material and pipe are shown in Table 1.
In Table 1, L is the total length of the pipe, D is the outside diameter of the pipe, δ is the wall thickness, ρp is the density, EP is the young modulus of the PE material, μ is the Poisson ratio, δb is the ultimate strength, ξ% is the elongation, and αs is the relative stiffness coefficient of the pipe and the soil. When αs is less than 1, it means that the pipe is a flexible pipeline. The definition of αs is as follows:
α s = ( E P δ 3 ) / ( E d r 0 3 )
where r0 is the average radius of the pipe. Ed is the soil deformation modulus, and here, it is 8 MPa.

2.2. Experimental Site and Pipe

The buried pipe is shown in Figure 1. The surrounding soil was yellow clay. There was a sewage treatment pool close to the experimental site. The water content of the soil increased rapidly with depth. After about 2.5 m from the surface, the soil was muddy. The soil parameters varied greatly at different depths.

2.3. Strain Gages and Strain Indicator

Strain testing is simple in normal environments, whereas, here, the pipeline was buried directly in highly saturated soil, and the strain gauge was tested in a watery environment. To date, there have been few studies on waterproof strain gauge, and thus, there are few established products in existence. Therefore, BX120-3AA electrical resistance strain gauges waterproofed with underwater, curable adhesive were used in this experiment. The position of the strain gauge patch on the pipe is shown in Figure 2. There were 18 strain gauges in five sections of the pipe and nine test points.
A 16-channel dynamic strain indicator (UT3416) with a maximum sampling frequency of 128 kHz was used for strain measurement. Considering the short duration of the explosion impact process, the sampling frequency was set to 128 KHz.

2.4. Velocity Sensor and Blasting Vibration Meter

Here, two TC-4850 blasting vibration meters were used to test the vibration velocity of the pipe and ground. The velocity sensors were arranged at the end of the pipe and in the ground just above the middle of the pipe. The sampling frequency was 8 KHz. The X-axis direction of the sensor was horizontal, the Y-axis was parallel to the pipe axis, and the Z-axis was in the plumb direction.

3. Experimental Procedure

The pipe was directly buried in the soil. After ditch pumping, the ditch bottom was artificially filled and tamped, and then, the thin layer of sand was leveled. The pipe depth was 1.5 m, as shown in Figure 3. The explosion source and the centerline of the pipeline were at the same level. The blast center distance R is the horizontal distance between the pipeline and the point source in this paper. The blasting source depth h was also 1.5 m.
Some small spherical packages with coupling charges in the soil were made by the second rock emulsion explosive (the TNT equivalent is about 0.708). The experimental scheme is shown in Table 2. Q is the charge mass. The charge was strictly carried out according to the standards set before the experiment. After charging, the chamber was covered with at least 50 cm of soil, and then, sandbags were pressed. The explosives were detonated using a cord detonator.

4. Strain Results and Analysis

4.1. Dimensional Analysis

There are many factors that affect the dynamic stress distribution of a pipeline: Such as pipe material, diameter, wall thickness, surrounding medium (soil) characteristics, and so on. Moreover, the characteristics and attenuation of blast waves are very different under different charge conditions and site conditions. It is also very difficult to establish an accurate function to describe the comprehensive effects of various factors. Therefore, one solution is to determine empirical formulas based on experimental data by using similarity theory and dimension analysis of variables.

4.1.1. Load Acting on the Pipe

In these experiments, the explosion source was simplified to a point source. An explosion was assumed to be instantaneous, and the reaction process was ignored here. The main point of concern was the stress wave propagating outside of the shock wave zone in the soil. Prior studies have found that the minimum stress on the shock front propagating in high saturation is about 2 MPa. The stress acting on the pipeline in this experiment was far less than this threshold; therefore, the compression wave velocity c was considered to be a constant, which represented the compression effects of the soil. It was assumed that the earth was semi-infinite, homogeneous, and isotropic. The soil density ρs represents the inertia of the soil. The parameters on both sides of the wave front should satisfy the law of conservation of mass and momentum. The relationship between the vibration velocity vp and the pressure pw on the wave front is as follows [28]:
ρ s · ( c v p ) = ρ s · c
ρ s · ( c v p ) 2 + p w = ρ s · c 2
where ρ s is the density behind the wave front. Therefore, the peak pressure pmax acting on the pipe is a function of soil density, wave velocity, and peak particle velocity (PPV) vmax as follows:
p max = ρ s · c · v max
where c and ρs are constants. Here, vmax was used to represent the load level and was calculated by the Sadowski formula:
v max = k ( R / Q 1 / 3 ) α = k R ¯ α
where k and α are mainly related to factors such as field character and charge conditions, k is the field coefficient, α is the attenuation index. The scaled distance definition is:
R ¯ = R / Q 1 / 3
The variable was derived from dimensionless parameters and considered the comprehensive effect of Q and R.

4.1.2. The Maximum Strain of the Pipeline

The pipeline was impacted by a blast wave with peak particle velocity vmax. The deformation of the pipeline was linear elastic. The maximum strain εmax can be determined by D, δ, ρp, Ep, ρs, Ed, c, and vmax. These variables include the load, inertia, and compression effect of the pipeline and soil and geometric properties of the pipeline section. The function of stress on the outer surface of the PE pipe is given by:
ε max = f ε ( D , δ , E p , E d , ρ p , ρ s , c , v max )
Applying the π theorem, Equation (7) is expressed in a dimensionless form:
ε max = f ε ( D δ , E d E p , E p ρ s c 2 , ρ p ρ s , v max c )
The specific form of the function is unknown and should be determined by the measured data. In this experiment, after the parameters of D, δ, ρp, Ep, ρs, Ed, and c were determined, vmax was a variable, which was determined by Equation (5). Therefore, we adopted the power function form for the maximum strain of the pipeline, as shown in the following equation:
ε max = k R ¯ α
where k′ and α′ are parameter of the comprehensive reaction charge conditions, pipe properties, field character, and other factors. α′ is the attenuation index. Its rationality was verified by the experimental data.

4.2. Strain Analysis

4.2.1. The Test Data of the Peak Strain

When a blast wave propagates into the soil, the stress amplitude and loading rate vary with the explosion center distance. According to the literature [32], when R ¯ < 6 the blast wave in rock and soil is dominated by P- waves. When 6 R ¯ 30 the waveform starts to change, and the surface wave component gradually increases. When R ¯ > 30 the blast wave is dominated by seismic waves. Therefore, the data (R = 2.7 m and R = 3.75 m) must be emphatically analyzed, because the scaled distance (6–11) is in the range of the waveform conversion partition. When R = 2.7 m, the peak tensile strain (PTS) and peak compressive strain (PCS) of each test point are shown in Table 3.
It can be seen that, for Section 3 closest to the blast source, the hoop PCSs of test points 1 and 3 were generally greater than the PTS, and the axial PTS of test point 3 was larger than the PCS. At the top and bottom of the pipe (test points 2 and 4), the hoop PTS was generally greater than the PCS, and the axial PCS was generally greater than the PTS. When the scaled distance was small, the PHS was generally larger than the PAS at the same point. This was due to the high water content in the highly saturated clay, which was conducive to the propagation of explosive wave energy. The flexible PE pipe produced a greater hoop strain under the local impact. It should be pointed out that the PTS and PCS of the same test point were not always reached at the same time due to the dynamic effect of explosive wave propagation, and the interval was several milliseconds. The external surface of the pipe could be simplified as a biaxial stress state. In the linear elastic deformation range, the stress–strain relationship followed the generalized Hooke’s law.

4.2.2. Peak Strain Attenuation Law

According to Equation (9), the peak strain of the representative test point was fitted with the scaled distance, and the attenuation curves are shown in Figure 4, Figure 5 and Figure 6. Note: The TNT equivalent conversion was not performed when calculating the scaled distance.
As can be seen from the attenuation curve, there was a power attenuation relationship between the PTS or PCS at each test point and scaled distance. The decision coefficient was between 0.80 and 0.97, and the PHS attenuation index (absolute value, the same below) was obviously greater than that of the PAS. The PHS attenuation index was between 2.5 and 3.4. The attenuation indexes of different test points were different for the same section. The attenuation indexes of the central point, which is located on the front side of the pipe facing the blast wave, were larger than those of the back. Comparing Figure 4a,b, the difference between the hoop PCS of 33H and 31H decreased with the increasing scaled distance; however, the axial PCS of 33Z and 31Z hardly changed with the scaled distance. This was because the PHS had a strong correlation with the local deformation of the pipe section, and the PAS was more affected by the overall deformation of the pipe. As shown in Figure 7, the scaled distance ranged from 6 to 11, and the axial PTS values of 23Z and 33Z were approximately equal, which also indicated a strong correlation between the PAS and overall deformation.

4.2.3. Influence of Waveform Conversion

When R = 3.75 m, because the blast wave was located in the waveform conversion zone of the longitudinal wave to surface wave, the characteristics of the transformation of the PCS and PTS of each test point were very obvious. As shown in Figure 8, the PCS and PTS of 21H were selected for comparison. As the scaled distance increased, the difference between the two became gradually smaller until the amplitude was approximately equal. As shown in Figure 9, the PCSs were compared for 31H and 31Z. As the scaled distance increased, the relative magnitudes changed, from the PHS being greater than the PAS to the opposite scenario. This was the result of the evolution of the blast waveform.
When R = 2.7 m, the scaled distance was in the range of 4–8, and the blast wave was still dominated by the compression wave. Fitting the PCS data of 33H, as shown in Figure 10, the PCS attenuation index was 3.137 at R = 2.7 m, which was much smaller than the attenuation index of 6.8761 at R = 3.75 m. The composite attenuation index was 3.0699. This shows the influence of different blast wave zones; load attenuation was faster in the waveform conversion zone.

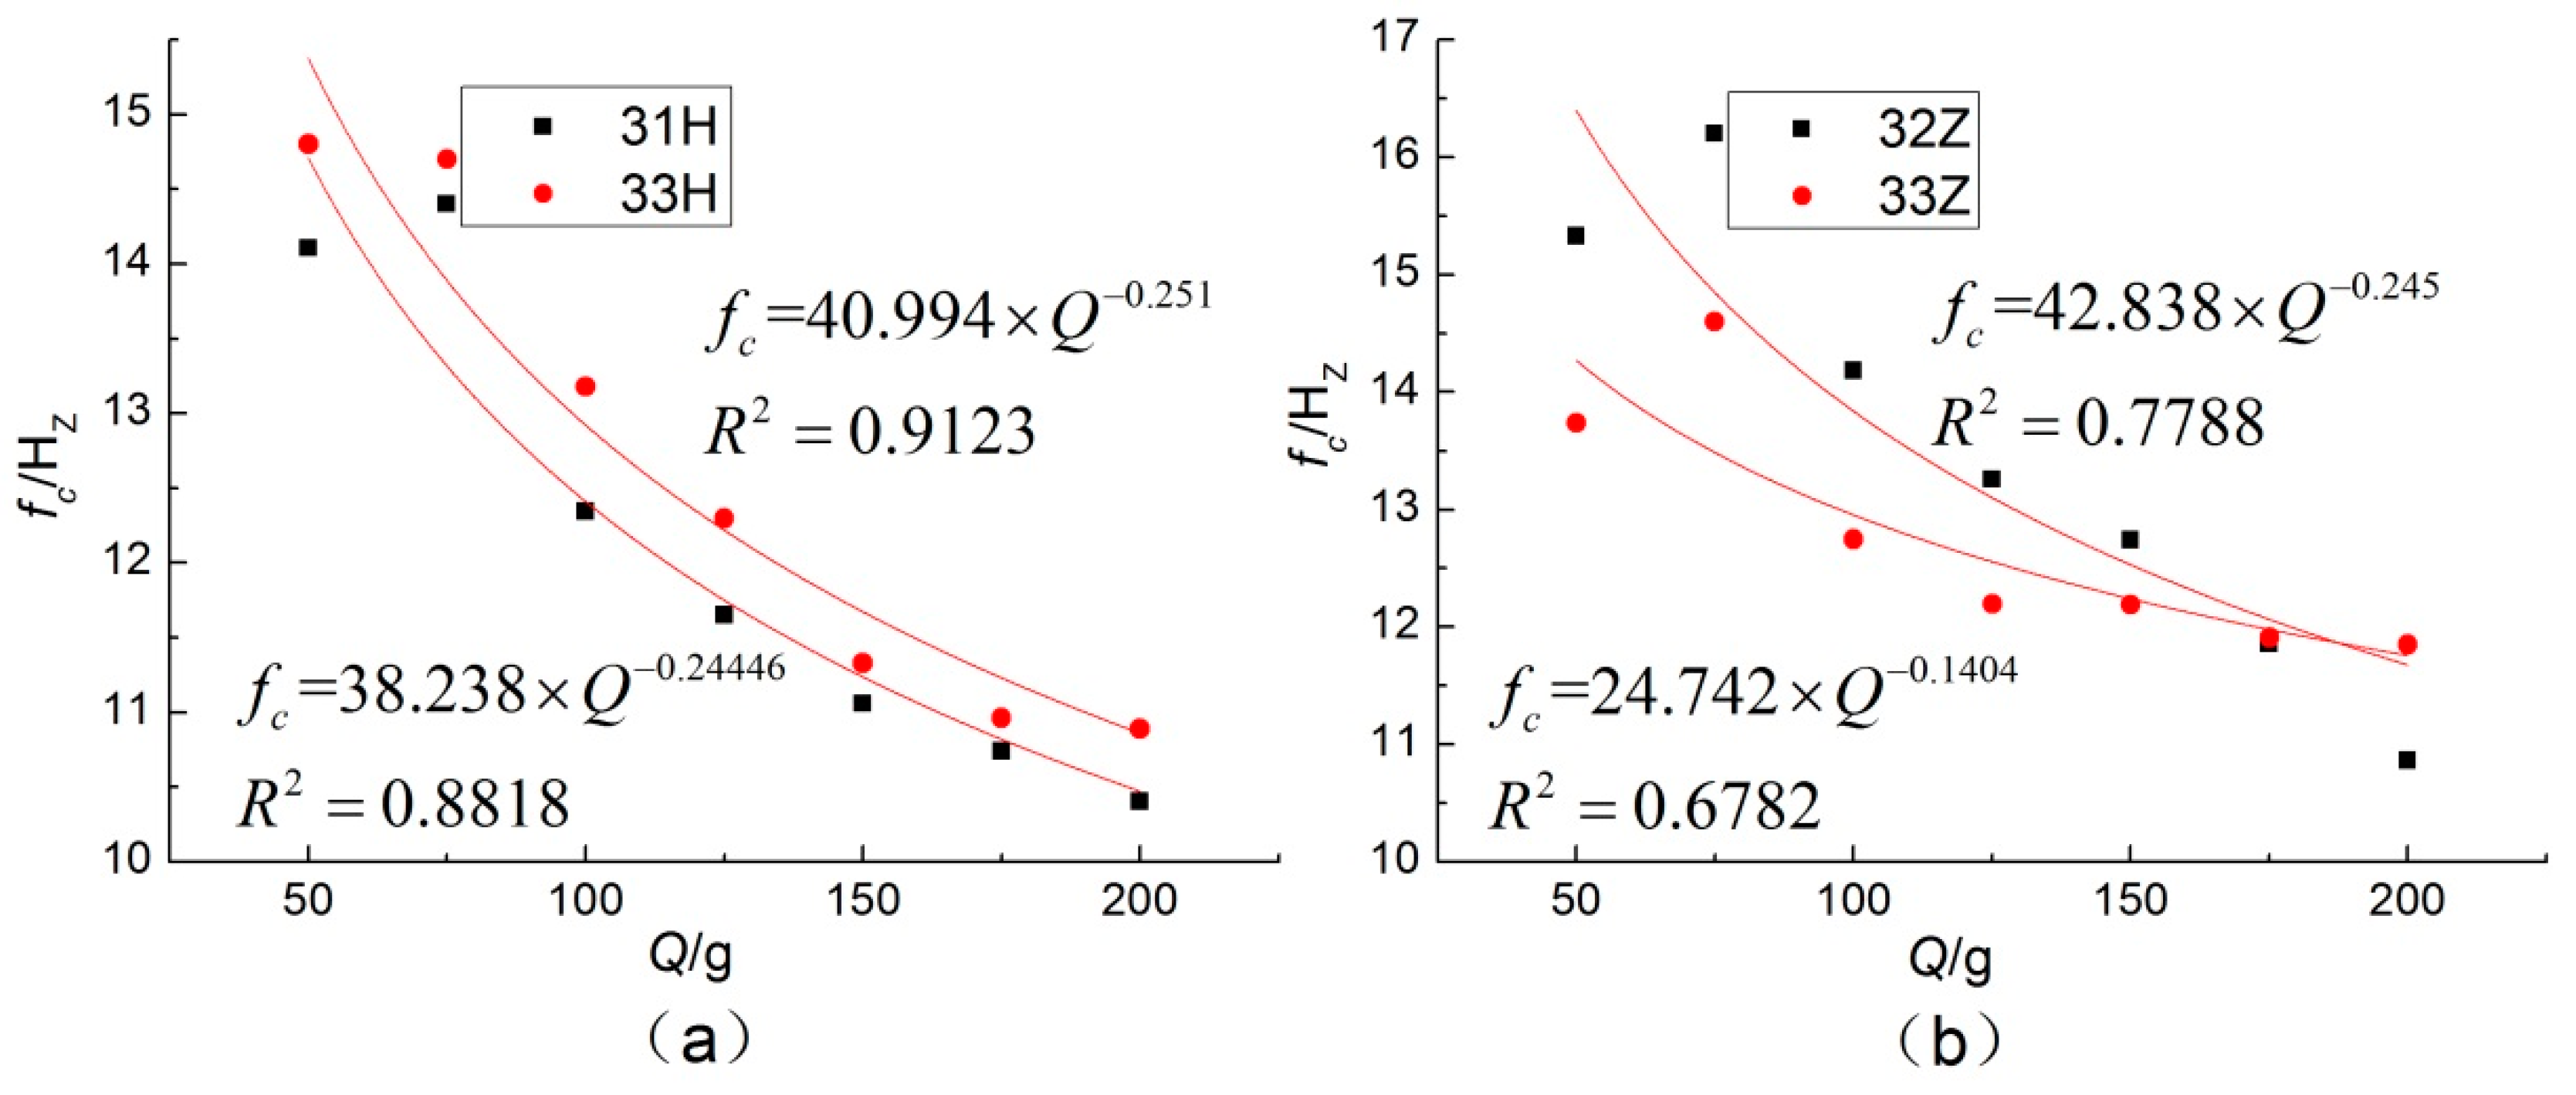
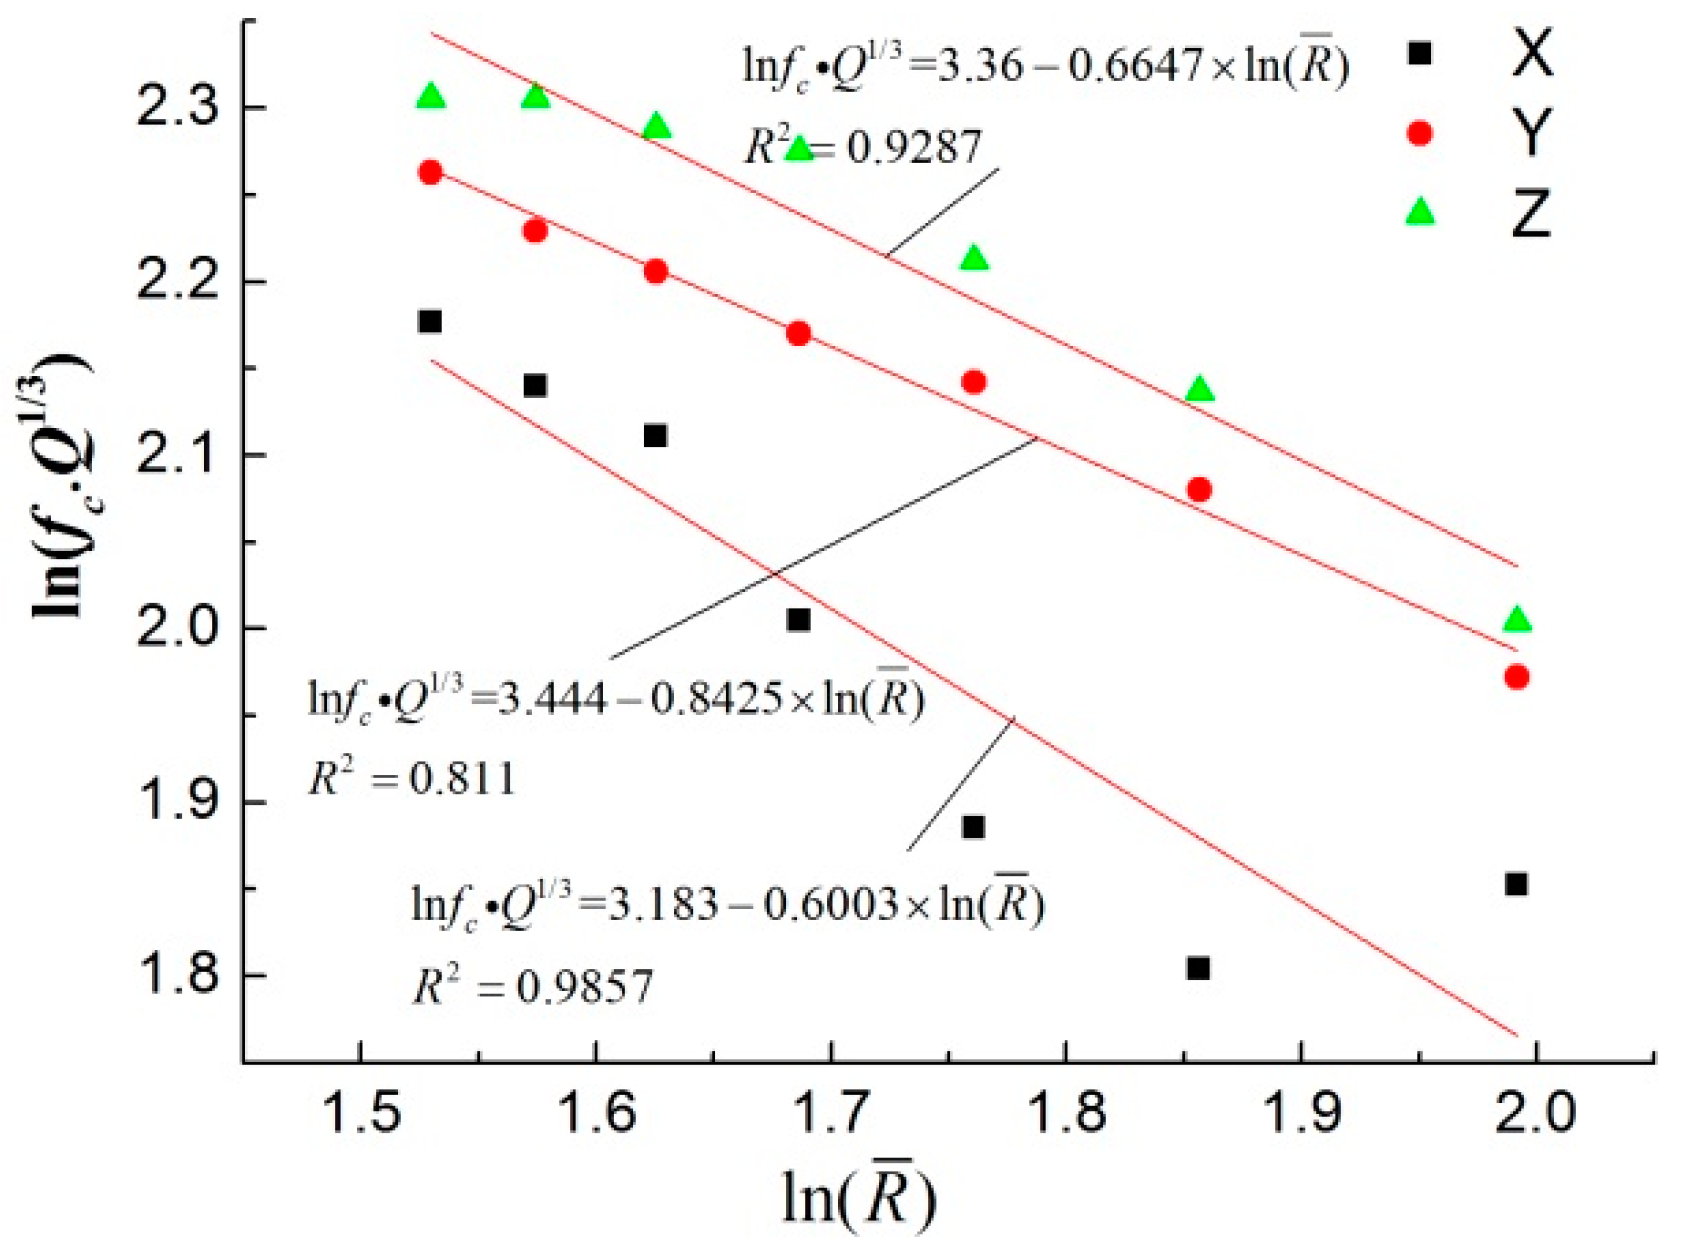
4.2.4. Dynamic Strain Spectrum Analysis

In general, the frequency of a blast wave is higher than that of a natural earthquake wave. However, due to the strong damping of the soil, the response frequency of the pipe–soil structure is relatively low. The effective signals by spectrum analysis are mainly concentrated in the low-frequency band (0–200 Hz). Here, the environment of the experiment site was complex, the sampling frequency of the dynamic strain indicator was high, and the cut-off frequency filter was not set, and thus, the noise was severe. Therefore, the signal was low-pass filtered, and the typical waveform and spectrum are shown in Figure 11.
Take the dynamic strain spectra of the four test points, as shown in Figure 12. Each spectrum is a single-peak or multi-peak curve with a low peak frequency. The peak frequency of strain in this experiment was less than 10 Hz.
Whether the hoop strain or the axial strain, there was an obvious peak frequency, and the peak frequency was superior to other extreme values; the value was from 4 Hz to 9 Hz. The peak frequency contains limited spectrum information, and there is no obvious law comparing the peak frequency of each charge mass. Therefore, in this paper, the average frequency is defined as [33]:
f c = i = 1 n A i f i / i = 1 n A i
where fi is the frequency of fast Fourier transform (FFT) spectrum and Ai is the amplitude.
Since the effective signal was mainly concentrated in the low-frequency band, the cut-off frequency was set to 200 Hz when calculating the average frequencies (R = 2.7 m). All the average frequencies were lower than 50 Hz. The law of attenuation of the average frequency with the increase of the charge mass was very obvious, showing a power attenuation relationship, as shown in Figure 13.

5. Vibration Velocity Results and Analysis

Normally, the amplitude of a blast wave attenuates with the increase of depth, which is due to the strong reflection wave produced when the blast wave propagates into the ground; hence, the surface velocity is larger than the underground velocity. The pipe is restrained by the soil, and the mechanical properties of the pipe and soil are obviously different. There is slip between the pipe and the soil; therefore, the surface vibration velocity is much larger than the pipe vibration velocity.

5.1. GPPV and Pipe Peak Vibration Velocity (PPVV)

Under these experimental conditions, the ratio of GPPV to PPVV was between 2 and 3. The test data (R = 2.7 m) was taken as shown in Table 4. Here, the peak velocity was synthesized by the maximum values of the X-, Y-, and Z-axes. Although the three maximum values were not simultaneous, the time difference was small, and the synthetic maximum value was slightly larger than the true value. The average ratio was 38.6%. Although the ratios fluctuated with the scaled distance, the range was small.
The attenuation curves with the scaled distance show a good power function relationship, as shown in Figure 14. The attenuation index was larger than those in the related literature. This was because the explosion took place in the soil, the propagation medium was clay, and the location was near the explosive source. There was a strong linear correlation between GPPV and PPVV, as shown in Figure 15.

5.2. Velocity Spectrum

The interference signals, whose frequencies were relatively high, had less of an effect on the velocity spectrum because of the low sampling frequency. Figure 16 shows the pipe velocity spectrum of the test data (R = 2.7 m).
The ground velocity spectrum was similar to the pipe spectrum, and the frequency components showed little difference. A comparison with the dynamic strain spectrum revealed that the frequency band of the strain spectrum was narrower than the velocity spectrum. The peak frequency of the strain was generally lower than the peak frequency of the velocity, and the main frequency band also moved toward the low-frequency region. In the velocity spectrum, there were several large peak frequencies, and the second peak bandwidth in the Z-axis direction accounted for a larger proportion. In the strain spectrum, the second peak frequency amplitude and bandwidth were weakened, and the first peak frequency band was dominant. It was difficult to find the variation law of peak frequency because of the many influencing factors and the large variation of the wave form near the explosive source. There was no change rule that was easily discernible by analyzing the main frequency given by the instrument or the center frequency of the main frequency band. Moreover, there was a sudden change in value. Therefore, the average frequency was used. When calculating the average frequency, the cut-off frequency was 200 Hz. Referring to the results in the literature [34], the main frequency appears to be mainly affected by the explosion source (the radius of the explosion cavity), charge mass, blast center distance, and the properties of the propagation medium. The formula for the average frequency is as follows:
f c = k ( c / Q 1 / 3 ) ( R / Q 1 / 3 ) α
After taking the logarithm of both sides, the following equation is obtained:
ln ( f c · Q 1 / 3 ) = ln ( k · c ) + α · ln ( R ¯ )
Using Equation (12), the fitted curves are shown in Figure 17, and the attenuation law is very obvious.

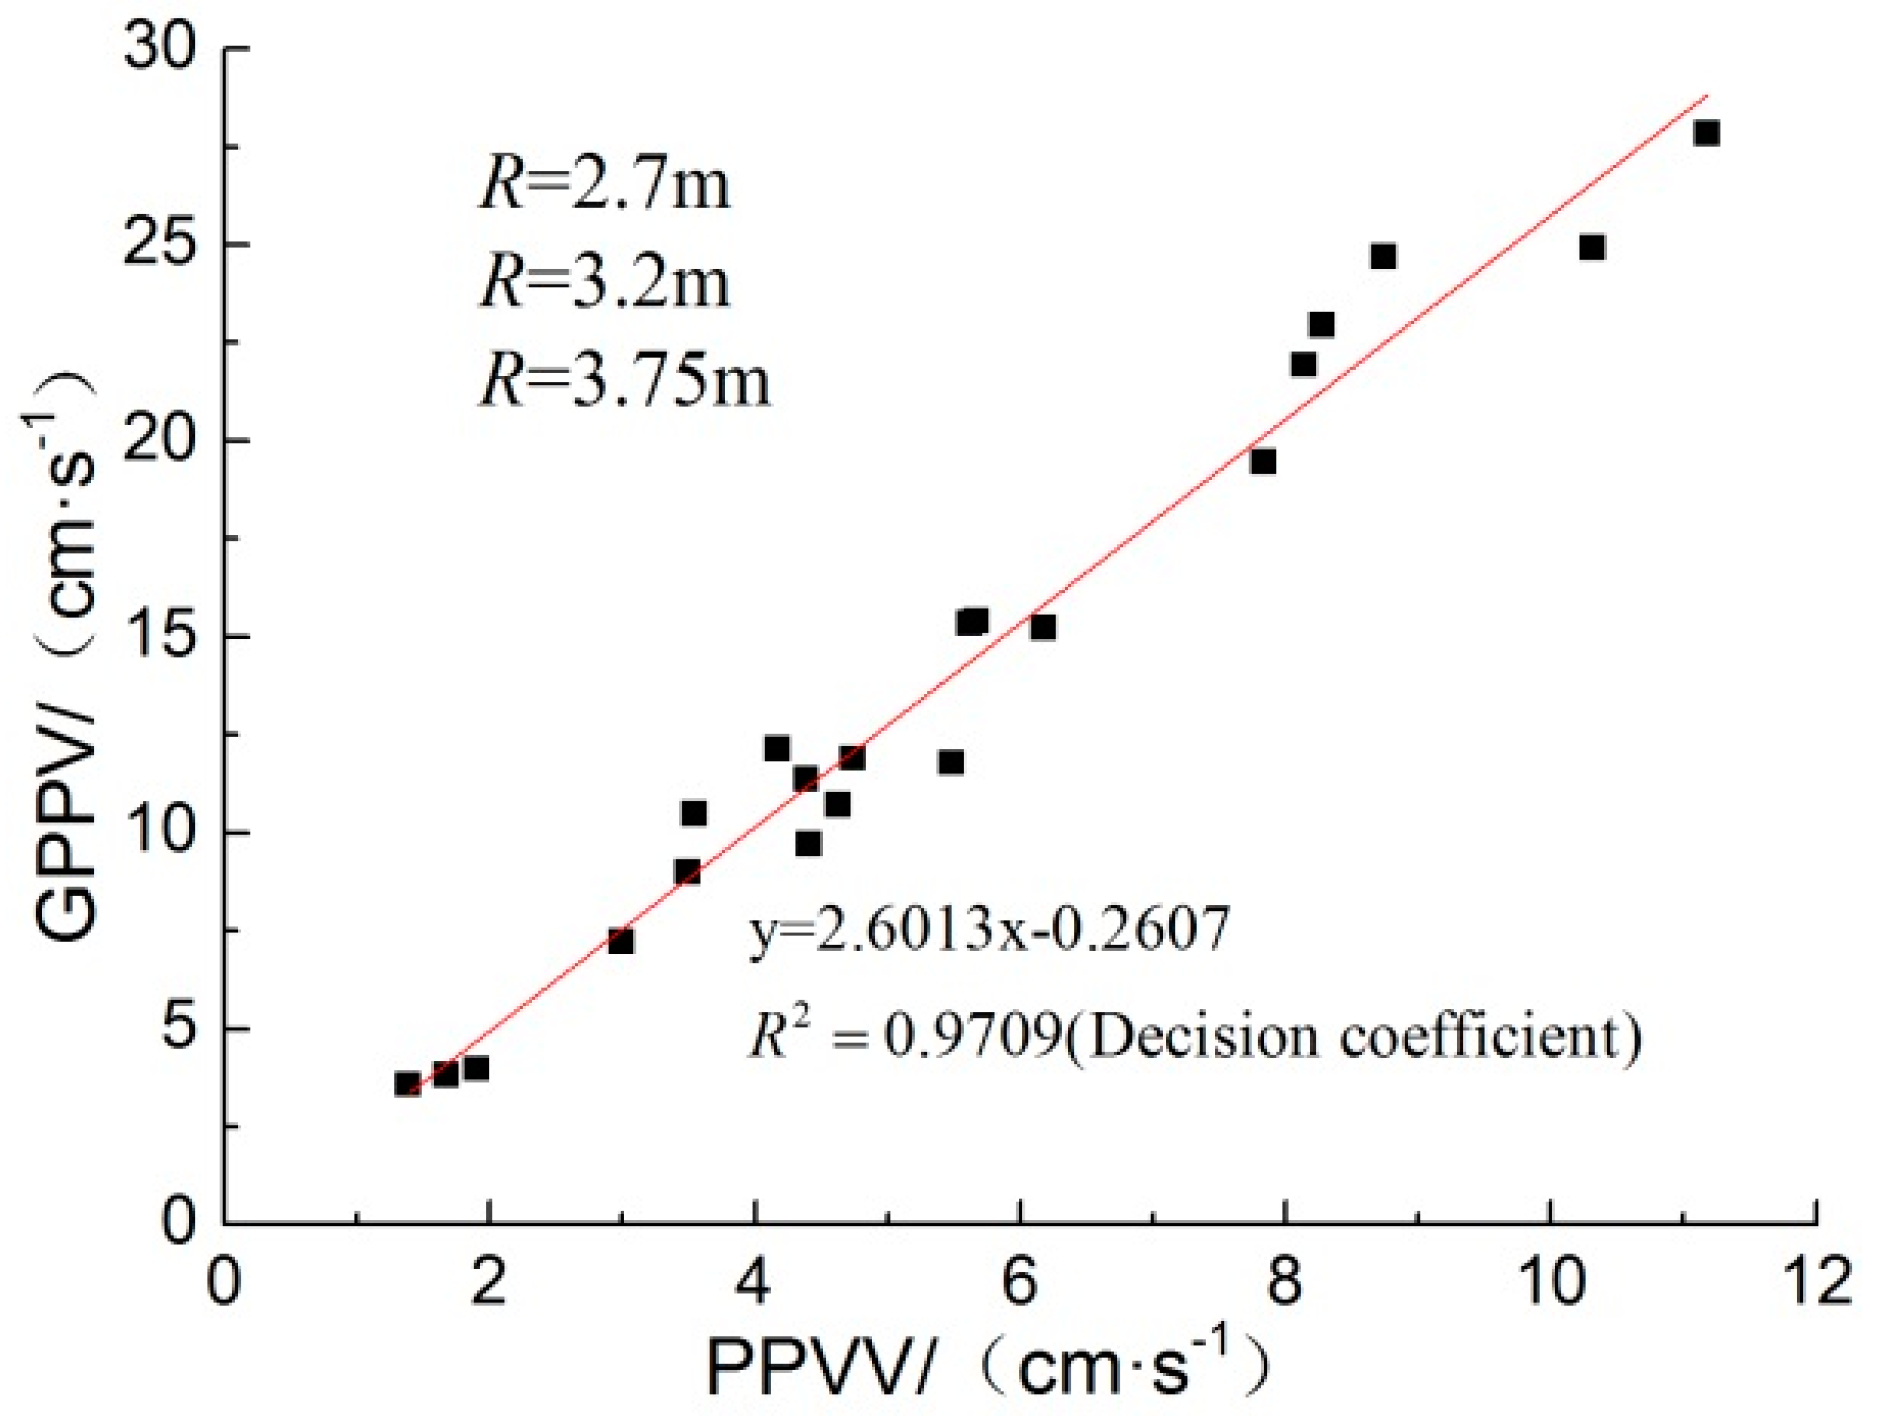
5.3. Correlation Analysis

Two sets of test data (R = 3.75 m and R = 2.7 m) were analyzed, and the correlation between peak strain and peak vibration velocity was obtained, as shown in Figure 18. The peak strain was not only strongly positively correlated with PPVV, but also strongly positively correlated with GPPV. Therefore, the strain level can be represented by GPPV.

6. Blasting Criterion for PE Pipe

One of the disadvantages of a PE pipeline is that its mechanical strength is low and prone to ductile fracture under high working pressure and impact load. The combined stress caused by internal pressure and impact load should be taken into account in the safety check of gas pipelines, and its maximum value should be within the safety threshold. The pipe–soil structure must meet strength and durability requirements.

6.1. Stress–Strain Constitutive Relation

According to the experimental data analysis, the vibrations were low frequency, and the process was considered to be quasi-static. The peak axial and hoop strains did not always occur at the same time and were not always the same sense (tension or compression). Thus, the external surface of the pipe could be simplified as a biaxial stress state, and the hoop and axial stresses were the principle stresses. Therefore, in the linear elastic deformation range, the stress–strain relationship followed a simplified, generalized Hooke’s law [27].
ε h = 1 µ 2 E p σ h
ε a = 1 µ 2 E p σ a
where εh is hoop strain, εa is axial strain, δh is hoop stress, and δa is axial stress.

6.2. Blasting Criterion Establishment

Here, the Mises strength theory was adopted, which relates to the distortional energy criterion. In a biaxial stress state, it is assumed that the first and second principle stresses are the same sense, and the third principle stress is zero under the most disadvantageous condition. This can be simplified into the following inequality:
σ 1 2 + σ 2 2 + σ 1 σ 2 σ y
σ 1 = σ h 1 + σ h 2
σ 2 = σ a
where δ1 is the first principal stress. δh1 is the hoop stress caused by the maximum working pressure, and it is 50% MRS for PE80 material according to the China national code. For the pipe used in this experiment, the maximum working pressure is 0.5 MPa. δh2 is the additional hoop stress caused by the blast wave. δ2 is the second principal stress, which is the axial stress caused by the blast wave and other factors, such as the Poisson effect. δy is the ultimate stress. Here, the hoop stress rather than the axial stress became the main controlling factor, because of its smaller pipe–soil relative stiffness coefficient. If the coefficient were larger, the additional axial stress might have been the major factor. Considering the importance of natural gas pipeline safety and durability, we propose that MRS should be used as the ultimate stress value instead of the PE material yield or strength limit, and the maximum safety threshold of δh2 should be 10% MRS. In fact, MRS is the minimum guaranteed value of the hoop tensile strength of PE pipe for a 50 year service life under the working pressure action at 20 °C, which is the material’s durability index and is far less than the yield limit of PE material. Under the short-term blasting load, the cumulative damage can be ignored. Therefore, there is no doubt that this is a safer criterion for a straight pipe, and it can be used with confidence. Thus, the total hoop stress can be up to 60% MRS, and the maximum total axial stress should be 55%, according to the inequality of Equation (15).

6.3. Engineering Design and Safety Monitoring

The blasting criterion can be used for engineering design or safety monitoring. It is primary and fundamental for determining the safety distance–charge mass for blasts near buried PE pipelines. The process of engineering blasting design is shown in Figure 19. On the other hand, safety monitoring can be implemented by using the blasting criterion, as shown in Figure 20.
An estimate of the maximum allowable charge mass at a specified blasting center distance can be determined by the peak strain–scaled distance fitting equations from Figure 4 based on the conditions of this experiment using the suggested blasting criterion. For example, the specified blasting center distance was set to 5 m, because blasting operation is prohibited within 5 m of a gas pipeline according to Chinse regulations; the blasting source depth was set to 1.5 m in soil. The maximum allowable GPPV for the purposes of safety monitoring can be determined by the peak strain–GPPV process outlined Figure 18. The calculation parameters and results are listed in Table 5.
Based on the above results, the maximum allowable GPPV is 291 mm/s, which is far greater than the standard recommended by other studies in the literature. Based on this experiment, such vibration amplitude does not pose a problem for a straight pipe. After the experimental scheme was completed, a final, additional test was implemented. The pipe was pressured to 0.6 MPa greater than the specified maximum working value (which was 0.5 MPa), the blasting center distance was set to 2.2 m, and the charge mass was 200 g. The maximum strains were at the same level compared with calculation results. No leak occurred, and there was no change in the pipe’s pressure after it was subjected to blasting.

7. Conclusions and Future Work

Since the pipe was locally impacted by the blast wave, the stress distribution was not uniform in the near and middle field of the blast wave. Both the peak strain and average frequency are closely related to the scaled distance. Using the scaled distance as the main variable to describe the problem, which includes two factors, the charge mass and the blast center distance, simplifying the influence of other complex factors into a proportional coefficient and attenuation index proved to be an effective method of solving this practical engineering problem, which is consistent with general engineering practices. Here, it was shown that the pipe vibration is a low-frequency vibration. Therefore, the dynamic effect of pipe vibration can be ignored, and the process can be considered to be quasi-static when blasting criteria are analyzed.
  • When the scaled distance is in the range of 4–11, the PCS is generally larger than the PAS at the same test point. The hoop stress level is related to the pipe–soil relative stiffness and the mechanical properties of the material. The shape of the circular section of pipe changes and the local deformation characteristics are obvious. As the scaled distance increases, the blast wave transforms from a compression wave to a seismic wave. The difference between the PHS and PAS value decreases progressively, the local deformation effect steadily weakens, and the overall deformation effect is relatively enhanced and gradually begins to dominate [35]. Therefore, the hoop stress should be fully considered in the safety check in the near and middle field of the blast wave.
  • The peak strain and scaled distance have a good power attenuation relationship as demonstrated by dimensional analysis and experimental data analysis.
  • According to the strain and velocity spectrum analysis, all of the average frequency is between 10–50 Hz and the vibration frequency is low. The average frequency of strain has a power attenuation relationship with the increase in the charge mass. Additionally, the average frequency of velocity is attenuated with the increase in the scaled distance, and inversely proportional with the blasting cavity factor.
  • There was a strong linear correlation between the peak strain, PPVV, and GPPV in this experiment. Thus, we determined that GPPV can directly and effectively reflect the stress level. Moreover GPPV monitoring has the advantages of simple operation, reliable testing, and so on. Therefore, GPPV monitoring should be adopted and promoted as a technical means of on-site monitoring of buried pipelines.
  • A single velocity criterion does not reflect the complex influence of various factors, such as pipe type, pipe material, soil properties, blasting source, and so on. Therefore, it is more reasonable to adopt 10% MRS of PE pipe as the blasting criterion. This criterion is accurate and easy to calculate.
In this research, we studied a PE pipeline’s dynamic response after being subjected to non-destructive blast tests. In future work, we will study the structural health monitoring (SHM) of buried PE pipelines subjected to increased blast levels that will actually cause damage to the pipeline. We will use piezoceramic patch transducers due to their advantages of high bandwidth [36,37,38], dual sensing and actuation capacity [39,40,41], and ease of bonding to the surface of a pipeline [42]. We plan to use the active sensing method [43,44] to perform the SHM of the pipeline by using distributed surface–bond piezoceramic patches [45]. With piezoelectric transducers, we can monitor the dynamic response of the pipeline in its passive mode [46,47,48] and perform damage detection using the active sensing method [49,50,51].

Author Contributions

Data curation, X.G., F.H. and L.L.; Formal analysis, X.G.; Funding acquisition, D.Z.; Project administration, D.Z.; Resources, L.L.; Supervision, D.Z.; Validation, X.G.; Original draft preparation, X.G. and F.H.; and Review and editing, D.Z. and X.G.

Funding

This research was funded by the Natural Science Foundation of China under Grant No. 51574184.

Acknowledgments

The authors greatly appreciate the comments from the reviewers, whose comments helped to improve the quality of the paper.

Conflicts of Interest

The authors declare no conflict of interest.

References

  1. Kong, Q.; Fan, S.; Bai, X.; Mo, Y.L.; Song, G. A novel embeddable spherical smart aggregate for structural health monitoring: Part I. Fabrication and electrical characterization. Smart Mater. Struct. 2017, 26, 095050. [Google Scholar] [CrossRef]
  2. Kong, Q.; Fan, S.; Mo, Y.L.; Song, G. A novel embeddable spherical smart aggregate for structural health monitoring: Part II. Numerical and experimental verifications. Smart Mater. Struct. 2017, 26, 095051. [Google Scholar] [CrossRef]
  3. Song, G.; Wang, C.; Wang, B. Structural health monitoring (SHM) of civil structures. Appl. Sci. 2017, 7, 789. [Google Scholar] [CrossRef]
  4. Tomonori, N.; Spencer, B.F.; Agha, G.A.; Mechitov, K.A. Model-based data aggregation for structural monitoring employing smart sensors. In Proceedings of the 3rd International Conference on Networked Sensing Systems 2006, Chicago, IL, USA, 31 May–2 June 2006; pp. 203–210. [Google Scholar]
  5. Balageas, D.; Fritzen, C.P.; Güemes, A. Structural Health Monitoring; John Wiley & Sons: New Jersey, NJ, USA, 2006; pp. 85–95. [Google Scholar]
  6. Yan, S.; Ma, H.; Li, P.; Song, G.; Wu, J. Development and Application of a Structural Health Monitoring System Based on Wireless Smart Aggregates. Sensors 2017, 17, 1641. [Google Scholar] [CrossRef]
  7. Hu, X.; Zhu, H.; Wang, D. A study of concrete slab damage detection based on the electromechanical impedance method. Sensors 2014, 14, 19897–19909. [Google Scholar] [CrossRef]
  8. Xu, J.; Hao, J.; Li, H.; Luo, M.; Guo, W.; Li, W. Experimental Damage Identification of a Model Reticulated Shell. Appl. Sci. 2017, 7, 362. [Google Scholar] [CrossRef]
  9. Kong, Q.; Robert, R.H.; Silva, P.; Mo, Y.L. Cyclic crack monitoring of a reinforced concrete column under simulated pseudo-dynamic loading using piezoceramic-based smart aggregates. Appl. Sci. 2016, 6, 341. [Google Scholar] [CrossRef]
  10. Lu, G.; Li, Y.; Wang, T.; Xiao, H.; Huo, L.; Song, G. A multi-delay-and-sum imaging algorithm for damage detection using piezoceramic transducers. J. Intell. Mater. Syst. Struct. 2016, 28, 1150–1159. [Google Scholar] [CrossRef]
  11. Luo, M.; Li, W.; Hei, C.; Song, G. Concrete Infill Monitoring in Concrete-Filled FRP Tubes Using a PZT-Based Ultrasonic Time-of-Flight Method. Sensors 2016, 16, 2083. [Google Scholar] [CrossRef]
  12. Cho, S.; Yun, C.B.; Lynch, J.P.; Zimmerman, A.T.; Spencer, B.F., Jr.; Nagayama, T. Smart wireless sensor technology for structural health monitoring of civil structures. Steel Struct. 2008, 8, 267–275. [Google Scholar]
  13. Huo, L.; Chen, D.; Liang, Y.; Li, H.; Feng, X.; Song, G. Impedance based bolt pre-load monitoring using piezoceramic smart washer. Smart Mater. Struct. 2017, 26, 057004. [Google Scholar] [CrossRef]
  14. Zhang, G.; Zhu, J.; Song, Y.; Peng, C.; Song, G. A Time Reversal Based Pipeline Leakage Localization Method with the Adjustable Resolution. IEEE Access. 2018, 6, 26993–27000. [Google Scholar] [CrossRef]
  15. Zhu, J.; Ren, L.; Ho, S.C.; Jia, Z.; Song, G. Gas pipeline leakage detection based on PZT sensors. Smart Mater. Struct. 2017, 26, 025022. [Google Scholar] [CrossRef]
  16. Hong, X.; Song, G.; Ruan, J.; Zhang, Z.; Wu, S.; Liu, G. Active monitoring of pipeline tapered thread connection based on time reversal using piezoceramic transducers. Smart Struct. Syst. 2016, 18, 643–662. [Google Scholar] [CrossRef]
  17. Gao, Y.; Brennan, M.J.; Joseph, P.F. On the effects of reflections on time delay estimation for leak detection in buried plastic water pipes. J. Sound Vib. 2009, 325, 649–663. [Google Scholar] [CrossRef]
  18. Hunaidi, O.; Chu, W.; Wang, A.; Guan, W. Detecting leaks in plastic pipes. J. Am. Water Works Assoc. 2000, 92, 82. [Google Scholar] [CrossRef]
  19. Ahadi, M.; Bakhtiar, M.S. Leak detection in water-filled plastic pipes through the application of tuned wavelet transforms to Acoustic Emission signals. Appl. Acoust. 2010, 71, 634–639. [Google Scholar] [CrossRef]
  20. Xu, K.; Deng, Q.; Cai, L.; Ho, S.; Song, G. Damage Detection of a Concrete Column Subject to Blast Loads Using Embedded Piezoceramic Transducers. Sensors 2018, 18, 1377. [Google Scholar] [CrossRef]
  21. Qi, B.; Kong, Q.; Qian, H.; Patil, D.; Lim, I.; Li, L.M.; Liu, D.; Song, G. Study of impact damage in PVA-ECC beam under low-velocity impact loading using piezoceramic transducers and PVDF thin-film transducers. Sensors 2018, 18, 671. [Google Scholar] [CrossRef] [PubMed]
  22. Grant, M.; Stewart, M.G. Probabilistic Risk Assessment for Improvised Explosive Device Attacks That Cause Significant Building Damage. J. Perform. Constr. Facil. 2015, 29, B4014009. [Google Scholar] [CrossRef]
  23. Zhu, J.; Wang, N.; Ho, S.C.; Song, G. Method for Rapid Impact Localization for Subsea Structures. IEEE Sens. J. 2018, 18, 3554–3563. [Google Scholar] [CrossRef]
  24. Štoller, J.; Zezulová, E. Use of ultrasound-The ultrasonic pulse velocity method for the diagnosis of protective structures after the load of TNT explosion. In Proceedings of the ICMT, 2017 International Conference, Brno, Czech Republic, 31 May–2 June 2017; pp. 230–235. [Google Scholar]
  25. Zhang, Z.; Zhao, C.; Zhang, L.; Zhao, M. Experimental investigation of blasting vibration safety criterion on buried pipeline. Blasting 2016, 33, 12–16. [Google Scholar]
  26. Dai, L.; Zhang, H.; Meng, G.; Zhang, L.; Cui, Y.; Li, J. Risk analysis of blasting operations around in-service oil and gas pipelines. Oil Gas Stor. Transp. 2012, 11, 801–803. [Google Scholar]
  27. Siskind, D.E.; Stagg, M.S.; Wiegand, J.E.; Schulz, D.L. Surface Mine Blasting near Pressurized Transmission Pipelines; U.S. Department of the Interior Bureau of Mines Ri.: Minneapolis, MN, USA, 1994; pp. 2–3, 22–32.
  28. Esparza, E.D.; Westine, P.S.; Wenzel, A.B. Pipeline Response to Buried Explosive Detonations; American Gas Association: Arlington, VA, USA, 1981; Volume 2, pp. 146–152, 133–134. [Google Scholar]
  29. Abedi, A.S.; Hataf, N.; Ghahramani, A. Analytical solution of the dynamic response of buried pipelines under blast wave. Int. J. Rock Mech. Mining Sci. 2016, 88, 301–306. [Google Scholar] [CrossRef]
  30. Dowding, C.H. Blast Vibration Monitoring and Control; Prentice-Hall: New Jersey, NJ, USA, 1985; pp. 167–171. [Google Scholar]
  31. Kouretzis, G.P.; Bouckovalas, G.D.; Gantes, C.J. Analytical calculation of blast-induced strains to buried pipelines. Int. J. Impact Eng. 2007, 34, 1683–1704. [Google Scholar] [CrossRef]
  32. Kutuzov, B.H. Blasting Engineer’s Manual; Liu, Q., Ed.; China Coal Industry Publishing House: Beijing, China, 1992; pp. 137–138. [Google Scholar]
  33. Triviño, L.F.; Mohanty, B.; Milkereit, B. Seismic waveforms from explosive sources located in boreholes and initiated in different directions. J. Appl. Geophys. 2012, 87, 81–93. [Google Scholar] [CrossRef]
  34. Lu, W.; Zhang, L.; Zhou, J.; Jin, X.; Chen, M.; Yan, P. Theoretical Analysis on Decay Mechanism and Law of Blasting Vibration Frequency. Blasting 2013, 30, 1–7. [Google Scholar]
  35. Datta, T.K. Seismic response of buried pipelines: A state-of-the-art review. Nucl. Eng. Des. 1999, 192, 271–284. [Google Scholar] [CrossRef]
  36. Hu, Y.; Yang, Y. Wave propagation modeling of the PZT sensing region for structural health monitoring. Smart Mater. Struct. 2007, 16, 706–716. [Google Scholar] [CrossRef]
  37. Lu, G.; Feng, Q.; Li, Y.; Wang, H.; Song, G. Characterization of Ultrasound Energy Diffusion Due to Small-Size Damage on an Aluminum Plate Using Piezoceramic Transducers. Sensors 2017, 17, 2796. [Google Scholar] [CrossRef]
  38. Wang, F.; Ho, S.C.M.; Huo, L.; Song, G. A Novel Fractal Contact-Electromechanical Impedance Model for Quantitative Monitoring of Bolted Joint Looseness. IEEE Access 2018, 6, 40212–40220. [Google Scholar] [CrossRef]
  39. Venugopal, V.P.; Wang, G. Modeling and analysis of Lamb wave propagation in a beam under lead zirconate titanate actuation and sensing. J. Intell. Mater. Syst. Struct. 2015, 26, 1679–1698. [Google Scholar] [CrossRef]
  40. Yao, P.; Kong, Q.; Xu, K.; Jiang, T.; Huo, L.; Song, G. Structural health monitoring of multi-spot welded joints using a lead zirconate titanate based active sensing approach. Smart Mater. Struct. 2016, 25, 015031. [Google Scholar] [CrossRef]
  41. Agrawal, B.N.; Elshafei, M.A.; Song, G. Adaptive antenna shape control using piezoelectric actuators. Acta Astronaut. 1997, 40, 821–826. [Google Scholar] [CrossRef]
  42. Wang, F.R.; Huo, L.S.; Song, G. A piezoelectric active sensing method for quantitative monitoring of bolt loosening using energy dissipation caused by tangential damping based on the fractal contact theory. Smart Mater. Struct. 2018, 27, 9. [Google Scholar] [CrossRef]
  43. Huo, L.; Li, C.; Jiang, T.; Li, H.N. Feasibility Study of Steel Bar Corrosion Monitoring Using a Piezoceramic Transducer Enabled Time Reversal Method. Appl. Sci. 2018, 8, 2304. [Google Scholar] [CrossRef]
  44. Lu, G.; Li, Y.; Zhou, M.; Feng, Q.; Song, G. Detecting Damage Size and Shape in a Plate Structure Using PZT Transducer Array. J. Aerosp. Eng. 2018, 31, 04018075. [Google Scholar] [CrossRef]
  45. Huo, L.; Wang, B.; Chen, D.; Song, G. Monitoring of Pre-Load on Rock Bolt Using Piezoceramic-Transducer Enabled Time Reversal Method. Sensors 2017, 17, 2467. [Google Scholar] [CrossRef] [PubMed]
  46. Xu, B.; Song, G.; Mo, Y.L. Embedded piezoelectric lead-zirconate-titanate-based dynamic internal normal stress sensor for concrete under impact. J. Intell. Mater. Syst. Struct. 2017, 28, 2659–2674. [Google Scholar] [CrossRef]
  47. Du, G.; Zhang, J.; Zhang, J.; Song, G. Experimental Study on Stress Monitoring of Sand-Filled Steel Tube during Impact Using Piezoceramic Smart Aggregates. Sensors 2017, 17, 1930. [Google Scholar] [CrossRef] [PubMed]
  48. Song, G.; Olmi, C.; Gu, H. An overheight vehicle–bridge collision monitoring system using piezoelectric transducers. Smart Mater. Struct. 2007, 16, 462–468. [Google Scholar] [CrossRef]
  49. Du, G.; Kong, Q.; Wu, F.; Ruan, J.; Song, G. An experimental feasibility study of pipeline corrosion pit detection using a piezoceramic time reversal mirror. Smart Mater. Struct. 2016, 25, 037002. [Google Scholar] [CrossRef]
  50. Feng, Q.; Kong, Q.; Huo, L.; Song, G. Crack detection and leakage monitoring on reinforced concrete pipe. Smart Mater. Struct. 2015, 24, 115020. [Google Scholar] [CrossRef]
  51. Du, G.; Kong, Q.; Lai, T.; Song, G. Feasibility Study on Crack Detection of Pipelines Using Piezoceramic Transducers. Int. J. Distrib. Sens. Netw. 2013, 9, 631715. [Google Scholar] [CrossRef]
Figure 1. The buried polyethylene (PE) pipe used in the experiment.
Applsci 09 01663 g001
Figure 2. The layout of the strain gauges and velocity sensor.
Applsci 09 01663 g002
Figure 3. The location of the PE pipe and explosion source.
Applsci 09 01663 g003
Figure 4. PCS of 31H, 31Z, 33H, and 33Z (R = 2.7 m and R = 3.75 m).
Applsci 09 01663 g004
Figure 5. The peak strains of 32H, 32Z, 34H, and 34Z (R = 2.7 m and R = 3.75 m).
Applsci 09 01663 g005
Figure 6. PCS of 23H and 33H (R = 2.7 m and R = 3.75 m).
Applsci 09 01663 g006
Figure 7. PTS of 23Z and 33Z (R = 3.75 m).
Applsci 09 01663 g007
Figure 8. The PTS and PCS of 21H (R = 3.75 m).
Applsci 09 01663 g008
Figure 9. The PCS of 31H and 31Z (R = 3.75 m).
Applsci 09 01663 g009
Figure 10. The PCS of 33H (R = 2.7 m or R = 3.75 m).
Applsci 09 01663 g010
Figure 11. Typical strain waveform before and after filtering: (a) The original and filtered signals; (b) the fast Fourier transform (FFT) spectra of the original and filtered signals.
Applsci 09 01663 g011
Figure 12. The spectrum of strain (R = 2.7 m and Q = 100 g).
Applsci 09 01663 g012
Figure 13. The attenuation curve of the average frequency (R = 2.7 m).
Applsci 09 01663 g013
Figure 14. The attenuation curves of PPVV and GPPV.
Applsci 09 01663 g014
Figure 15. The relationship between GPPV and PPVV.
Applsci 09 01663 g015
Figure 16. The velocity spectrum of the pipe (R = 2.7 m and Q = 100 g).
Applsci 09 01663 g016
Figure 17. The fc of the pipe velocity spectrum.
Applsci 09 01663 g017
Figure 18. The correlation between peak strain and PPVV or GPPV (R = 3.75 m and R = 2.7 m): (a) the peak strain and PPVV; (b) the peak strain and GPVV.
Applsci 09 01663 g018
Figure 19. The flow chart of engineering blasting design.
Applsci 09 01663 g019
Figure 20. Flow chart of engineering blasting safety monitoring.
Applsci 09 01663 g020
Table 1. Parameters of the polyethylene material and pipe.
L (m)D (mm)δ (mm)MRS (MPa)ρp (kg·m−3)EP (MPa)μσb (MPa)ξ%αs
4.8314.918.48936834.90.3831.61160.20
Table 2. Experimental scheme.
H (m)R (m)Q (g)
1.52.75075100125150175200
3.25075100125150175200
3.755075100125150175200
Table 3. The peak tensile strain and peak compressive strain (R = 2.7 m).
PointThe Peak Tensile Strain (PTS) and Peak Compressive Strain (PCS)/10−6
50 (g)75 (g)100 (g)125 (g)150 (g)175 (g)200 (g)
R ¯ = 7.3
(m/kg−1/3)
R ¯ = 6.4
(m/kg−1/3)
R ¯ = 5.8
(m/kg−1/3)
R ¯ = 5.4
(m/kg−1/3)
R ¯ = 5.1
(m/kg−1/3)
R ¯ = 4.8
(m/kg−1/3)
R ¯ = 4.6
(m/kg−1/3)
PTSPCSPTSPCSPTSPCSPTSPCSPTSPCSPTSPCSPTSPCS
21H46121861517316099239143318162340182356
21Z427956116689071109751197811476121
23H4015362826521094315129419115345177480
23Z13710313997141107200154256197178169292232
31H43109561156414487202122271136286158296
31Z95846279113109137171159216164235159254
32H1217024724716790263145341259371313442365
32Z8396216311107139131209193290248341296395
33H4120117433391279158403271554333614420657
33Z14195303295192125256180339224370243387256
34H749021118510597183105279152329202377274
34Z117113171220135145171202215243246260239283
Numbering rules for measuring points: The first is the section number; the second is test point number, the H is the hoop direction, and the Z is axial, referring to Figure 2.
Table 4. Ground peak particle velocity (GPPV) and pipe peak vibration velocity (PPVV, R = 2.7 m).
ItemPeak Velocity (mm·s−1)
50 (g)75 (g)100 (g)125 (g)150 (g)175 (g)200 (g)
PPVV35474462788387
GPPV90119114152194229247
Ratio38.9%39.9%38.7%40.6%40.3%36.1%35.4%
Table 5. The calculation parameters and results.
Blasting Source DistanceMRSMaximum Allowable Hoop StressMaximum Allowable PHSMinimum Scaled DistanceAllowable Charge MassAllowable GPPV
5 m8 MPa0.8 MPa820 (×10−6)2.92 m kg−1/35.02 kg291 mm/s

