Article

Interhemispheric Brain Switching Correlates with Severity of Sleep-Disordered Breathing for Obstructive Sleep Apnea Patients

1
Department of Automation, Xiamen University, Xiamen 361000, China
2
School of Control Science and Engineering, Shandong University, Jinan 250100, China
3
School of Information Technology and Electrical Engineering, The University of Queensland, Brisbane, QLD 4072, Australia
4
State Key Lab of Integrated Services Networks, Xidian University, Xi’an 710071, China
5
School of Information Engineering, Zhengzhou University, Zhengzhou 450001, China
6
College of Computer and Information Engineering, Xiamen University of Technology, Xiamen 361024, China
*
Authors to whom correspondence should be addressed.
Both authors contributed equally to this paper.
Appl. Sci. 2019, 9(8), 1568; https://doi.org/10.3390/app9081568
Submission received: 17 March 2019 / Revised: 10 April 2019 / Accepted: 11 April 2019 / Published: 16 April 2019
(This article belongs to the Section Applied Biosciences and Bioengineering)

Abstract

:
(1) Background: Alternating interhemispheric slow-wave activity during sleep is well-established in birds and cetaceans, but its investigation in humans has been largely neglected. (2) Methods: Fuzzy entropy was used to calculate a laterality index (LI) from C3 and C4 EEG channels. The subjects were grouped according to an apnoea-hypopnoea index (AHI) for statistical analyses: Group A AHI < 15 (mild); Group B 15 ≤ AHI < 30 (moderate); Group C AHI ≥ 30 (severe). The LI distribution was analysed to characterise the brain activity variation in both hemispheres, and the cross-zero switching rate was given statistical tests to find the correlations with the severity of obstructive sleep apnea and sleep states, i.e., wake (W), light sleep (LS), deep sleep (DS), and REM. (3) Results: EEG brain switching activity was observed in all sleep stages, and the LI distribution shows that, for obstructive sleep apnea patients, the interhemispheric asymmetry of brain activity is more obvious than healthy people. A one-way ANOVA revealed a significant difference of switching rate among three groups (F(2,95) = 7.23, p = 0.0012), with Group C shows the least, and also a significant difference among four sleep stages (F(3,94) = 5.09, p = 0.0026), with REM the highest. (4) Conclusions: The alternating interhemispheric activity is confirmed ubiquitous for humans during sleep, and sleep-disordered breathing intends to exacerbate the interhemispheric asymmetry.

1. Introduction

Sleep apnea is a serious health hazard and even life-threatening [1]. Survey reports that the prevalence of hypertension in severely snoring patients is as high as 48%, and the prevalence of coronary heart disease is 3 to 4 times that of ordinary people [2]. Besides, the incidence of cerebrovascular accident (stroke) is twice that of ordinary people [3]. If a person has more than 20 apneas per hour during sleep, his 5-year mortality rate will exceed 11%, and the 8-year mortality rate will reach 37% [4]. About 3000 people die every day from sleep apnea syndrome and its related diseases worldwide [5]. There are two types of sleep apnea: Obstructive sleep apnea (OSA) and Central sleep apnoea, in which OSA is the most common. It results from a blocked airway, usually when throat muscles intermittently relax and block your airway during sleep. Signs and symptoms of OSA include high blood pressure, snoring, morning headache, observed episodes of breathing cessation during sleep and abrupt awakenings accompanied by gasping or choking [6].
The apnea-hypopnea index (AHI) is widely used to evaluate the severity of OSA. It records the average number of apnea or hypopnea events per hour. It is commonly accepted that the AHI values are categorized as: (i) normal when AHI < 5; (ii) mild sleep apnea when 5 ≤ AHI < 15; (iii) moderate sleep apnea when 15 ≤ AHI < 30; and (iv) severe sleep apnea when AHI ≥ 30 [7]. The standard approach to diagnose OSA involves in-laboratory polysomnography (PSG), in which EEG remains the best technique for the functional imaging of the brain during sleep [8,9]. EEG is the most common tool used in sleep research [10,11,12,13,14,15,16]. Recently, EEG coherence analysis has garnered considerable interests to study the functional asymmetry of the brain [17,18,19,20,21,22]. A fundamental left-right brain switching mechanism is observed across the animal kingdom from invertebrates through to birds and mammals, including. humans. Reports show that when facing competing motion stimuli on its left and right, Drosophila would choose one stimulus at a time and then try to rotate toward its direction. This behaviour indicates that Drosophila has alternating left/right optic lobe local field potential (LFP) activities [23]. Long et al. revealed that some switching might exist in the control of birdsong timing between the left/right high vocal centre (HVC) on the timescale of song syllables or long subsyllabic elements [24,25]. For hamsters, continuous light would separate the daily activities into two parts, with antiphase circadian oscillations in the left/right suprachiasmatic nuclei (SCNs), namely, splitting of circadian rhythms. In split hamsters, the right/left SCN oscillate 12 h out of phase with each other, and the twice-daily locomotor bouts alternately correspond to one or the other [26,27]. Alternating left-right nostril patency in rat, rabbit, cat, dog, domestic pig, and humans [28,29,30,31,32]. Alternating unihemispheric slow-wave activity is well-established in birds [33] and aquatic mammals [34]. Existing reports show that alternating unilateral slow-wave sleep is always the most common sleep pattern for some specific species, such as marine mammals, birds, and possibly certain reptiles. Unihemispheric sleep, on the one hand, would help these animals maintain vigilance from the threat of predators even in sleep, and on the other hand, also assist uninterrupted breathing during sleep in marine mammals. However, its investigation in humans has been largely neglected. One exception reports their research on oscillation of sleep EEG dynamics between left/right hemisphere during REM sleep. It reveals that the brain works on an alternating left/right hemispheric in dominance and this dominance would fluctuate approximately every minute [35]. Independent studies have shown in individuals with obstructive sleep apnoea that apnoea/hypopnoea events are associated with asymmetric hemisphere EEG activity [20,23]; the latter report used three measures of interhemispheric symmetry (i.e., magnitude of squared coherence, phase lag index, nonlinear synchronization index).
In the current study, we sought to: (i) characterise inter-individual variation in brain switching activity in an adult sample with sleep-disordered breathing; (ii) examine the relationship between such switching activity and subjects’ apnoea-hypopnoea index (AHI), which indicates the severity of sleep apnoea by the number of apnoea and hypopnoea events per hour of sleep; and (iii) explore the differences in brain switching in subjects with sleep-disordered breathing during different sleep states.

2. Materials and Methods
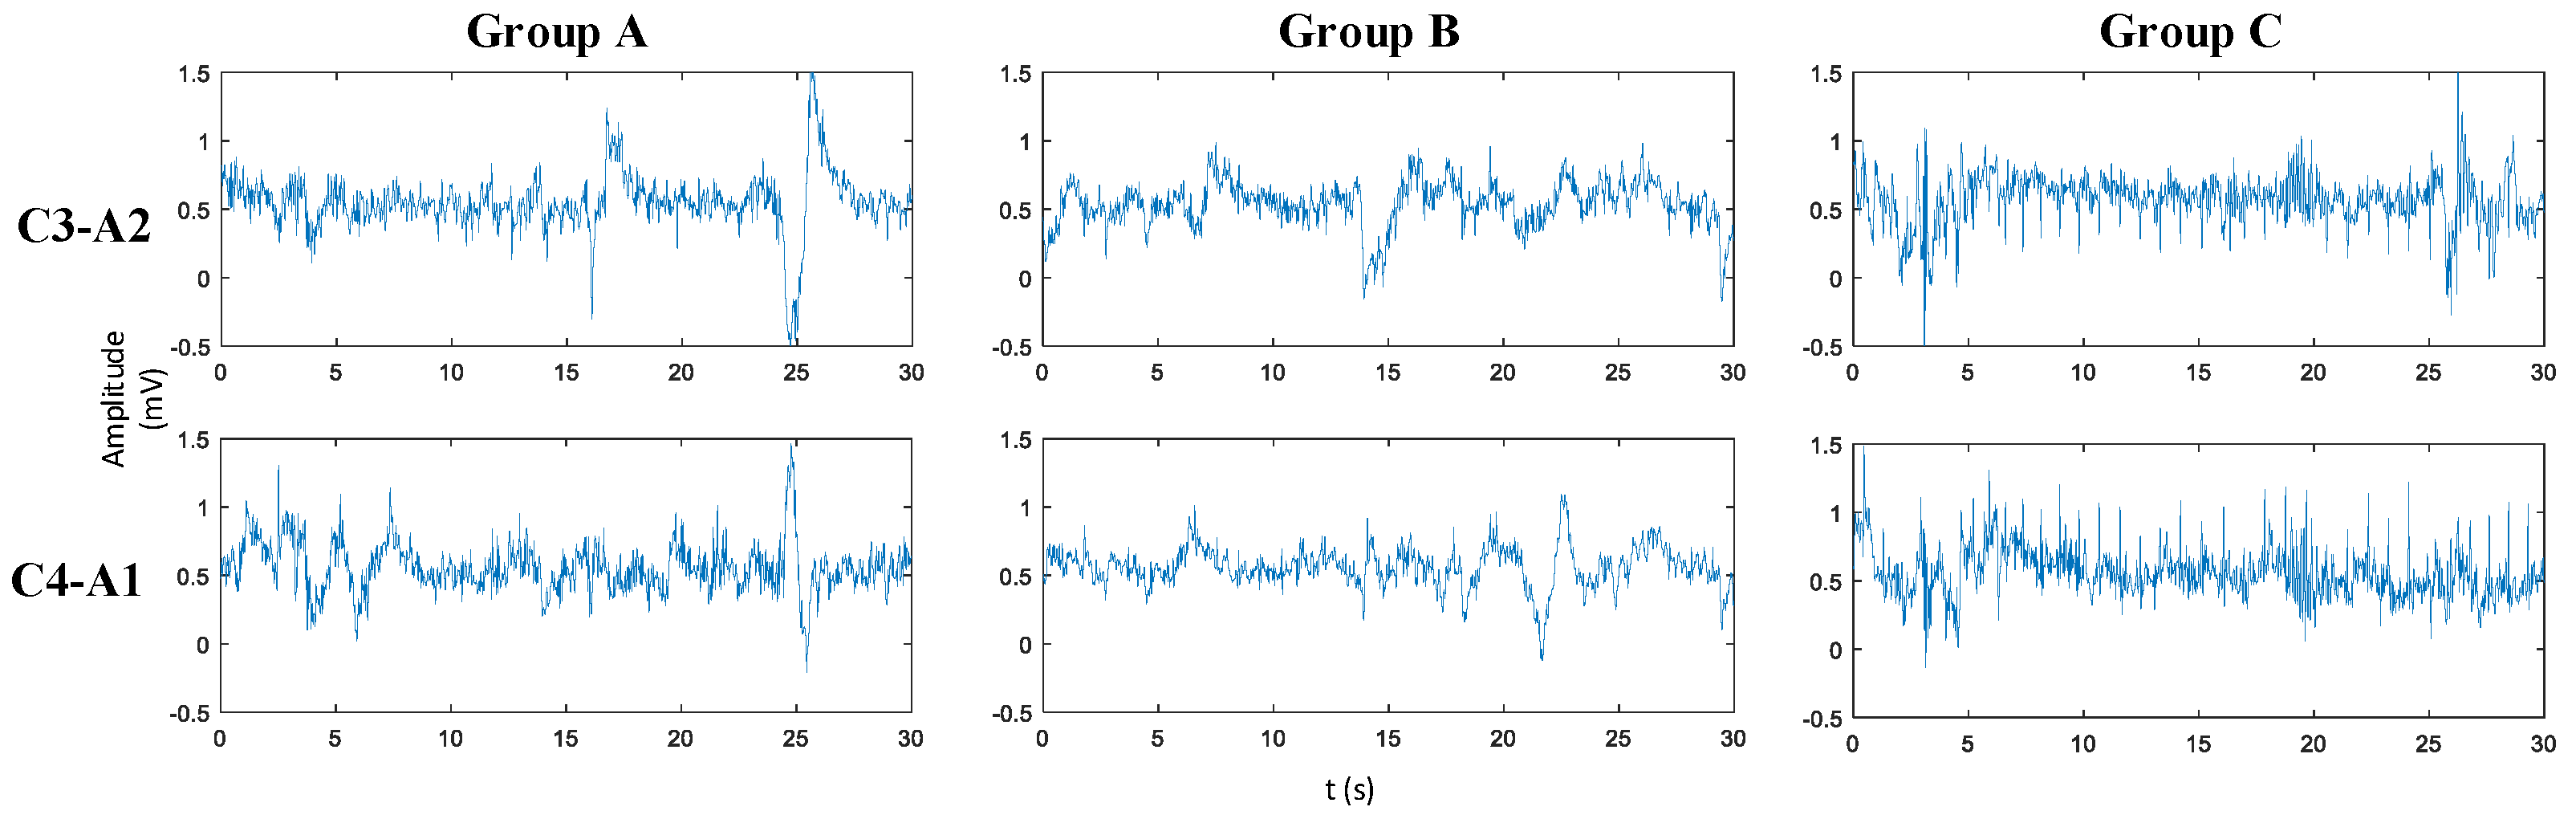
2.1. Materials

The experimental data used in this paper are obtained from the University College Dublin Sleep Apnea Database (UCDDB). It contains 25 (4 females and 21 males; mean age = 49.96 years; range: 28–68) full overnight polysomnograms (PSGs) with simultaneous three-channel Holter ECG. The polysomnogram records were obtained by utilizing the Jaeger-Toennies system, and a 10–20 electrode placement system was used to describe the locations of scalp electrodes. Each record in the database consisted of 2 EEG channels (C3-A2 and C4-A1), 2 EOG channels, and 1 EMG channel, with the sampling frequency at 128 Hz. According to the R&K criteria, each EEG signal was divided into segments of 30 s (3000 data points), with each segment corresponding to a single sleep stage including AWA, REM, S1, S2, S3, S4, Artifact, and Indeterminate. In order to delete artifacts like body movements or arousals, EEG signals labelled Artifact and Indeterminate were filtered and removed.
Subjects in this database were diagnosed with possible obstructive sleep apnea, central sleep apnea or primary snoring: (i) mean PSG recording = 6.9 h; range: 5.9–7.7; (ii) mean AHI = 24; range = 2–91 [36]. These subjects are grouped according to the severity of the sleep breathing-disorder which is evaluated by the apnoea-hypopnoea index (AHI) for statistical analyses: Group A (n = 11) AHI < 15 (mild); Group B (n = 8) AHI 15 ≤ AHI < 30 (moderate); Group C (n = 6) AHI ≥ 30 (severe). Detailed information of the grouped subjects is presented in Table 1, and Figure 1 gives examples of 30 s epoch C3-A2 and C4-A1 EEG for three Groups.
As an information measure, entropy determines the uniformity of proportion distribution [37]. Given a time series, the greater the probability of generating new patterns means the greater its irregularity, and entropy has been widely used in evaluating the degree of randomness (or inversely, the degree of orderliness) of a time series [38]. Reports have proved that entropy can measure the irregularity of a signal, and the higher the irregularity of a signal the greater its corresponding entropy will be [39]. Specifically, fuzzy entropy (FuzzyEn) can be a measure of time series complexity in EEG signals—smaller values indicate greater sequence self-similarity, while larger values indicate more complex signal sequences. In this paper, fuzzy entropy was extracted from both C3-A2 and C4-A1 EEG channels to calculate the laterality index (LI) between left- and right-hemisphere neural activity. The regional differences in the stability of sleep across the hemispheres can be approximately determined by the LI distribution. Furthermore, the cross-zero switching frequency of LI was calculated to evaluate the interhemispheric brain switching. In this paper, we mainly explore the correlations of LI distribution and cross-zero switching rate with the severity of OSA and the corresponding sleep states. The block diagram of the method is illustrated in Figure 2, and the data is shown for a 52 year-old male (ucddb006) with an AHI of 31.

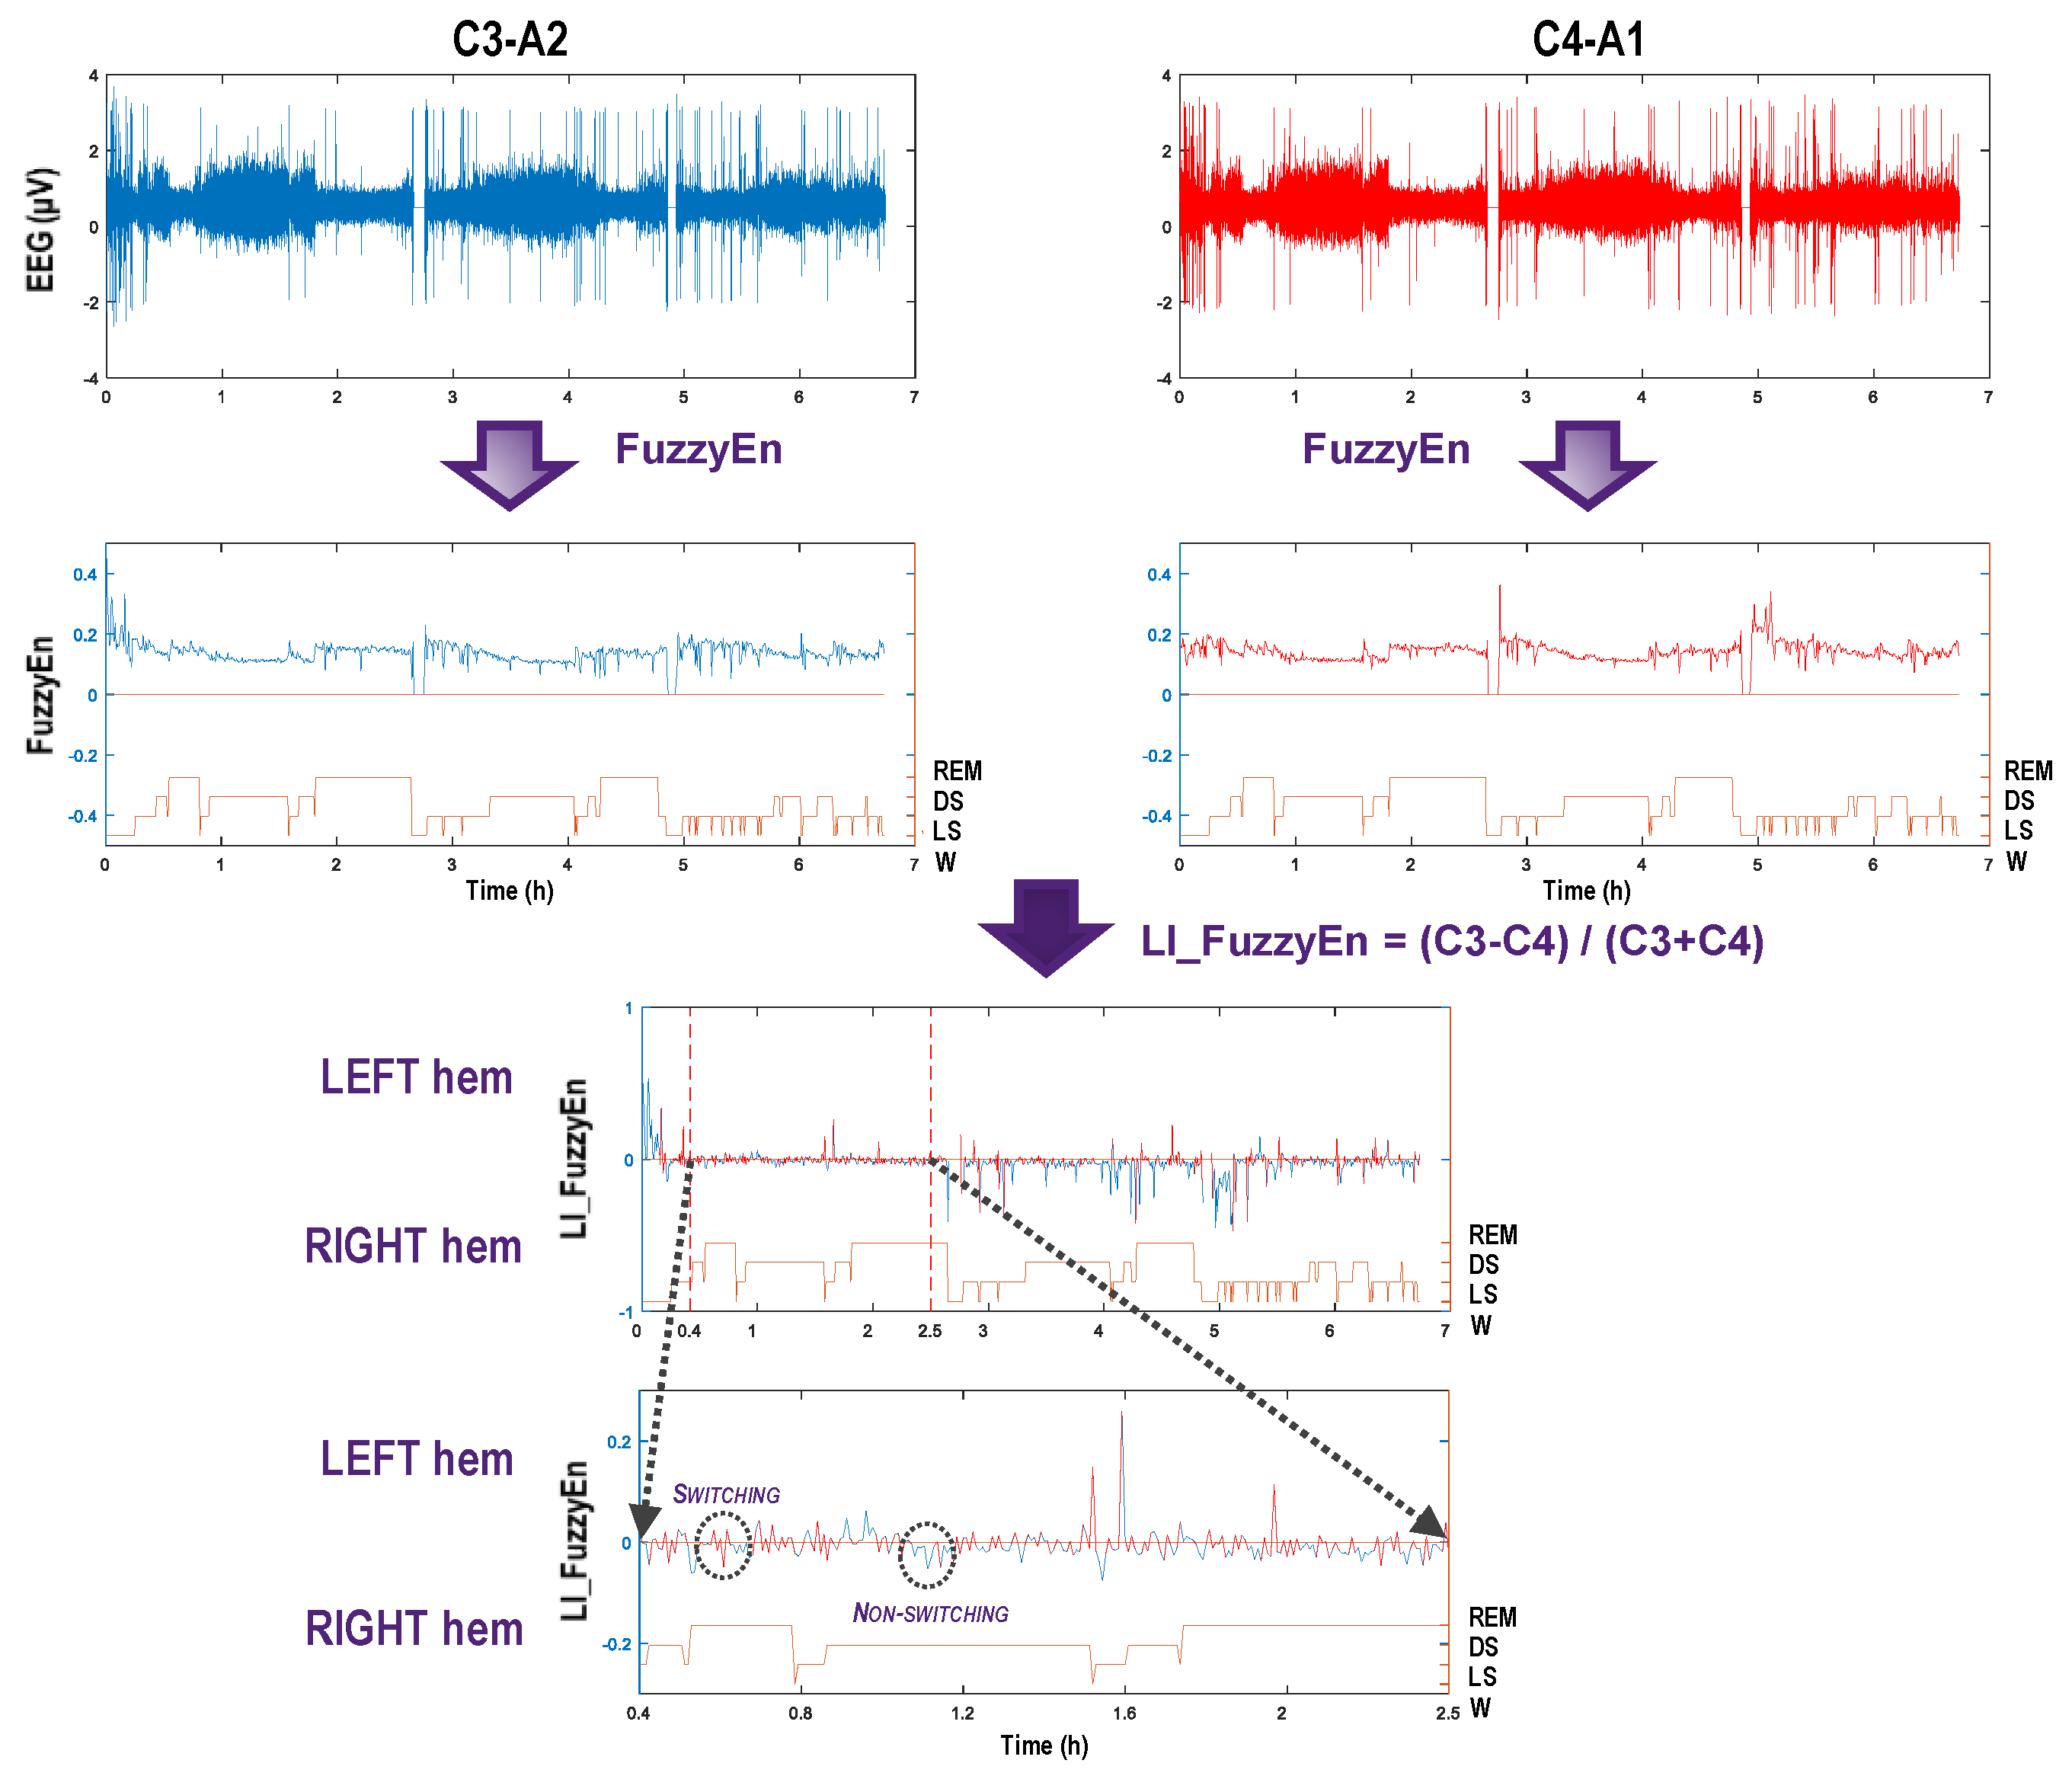
2.1.1. Fuzzy Entropy

Fuzzy entropy (FuzzyEn) measures the probability of the new model, representing the information of uncertainty for a series. Since FuzzyEn contains vagueness and ambiguity un-certainties, it is quite different from the classical Shannon entropy because no probabilistic concept is needed to define it, while Shannon entropy contains the randomness uncertainty (probabilistic). The FuzzyEn is defined using the concept of membership degree, and its calculation procedure is explained in [39]. The FuzzyEn statistic, given input value for embedding dimension, fuzzy power, and tolerance threshold, is defined as:
FuzzyEn ( m , n , r , N ) = ln ϕ m ( n , r ) ln ϕ m + 1 ( n , r )
where
ϕ m ( n , r ) = 1 N m i = 1 N m ( 1 N m 1 j = 1 , j i N m ( exp ( ( d i j m ) n / r ) ) )
in which d i j m = d [ X i m , X j m ] = max k ( 0 , m 1 ) { | x ( i + k ) x 0 ( i ) ( x ( j + k ) x 0 ( j ) ) | } , indicating the maximum distance between two local sequence segments X i m and X j m , X i m = { x ( i ) , x ( i + 1 ) , , x ( i + m 1 ) } x 0 ( i ) , 1 i , j N m . While x 0 ( i ) indicates the mean value of the sequence { x ( i ) , x ( i + 1 ) , , x ( i + m 1 ) } .

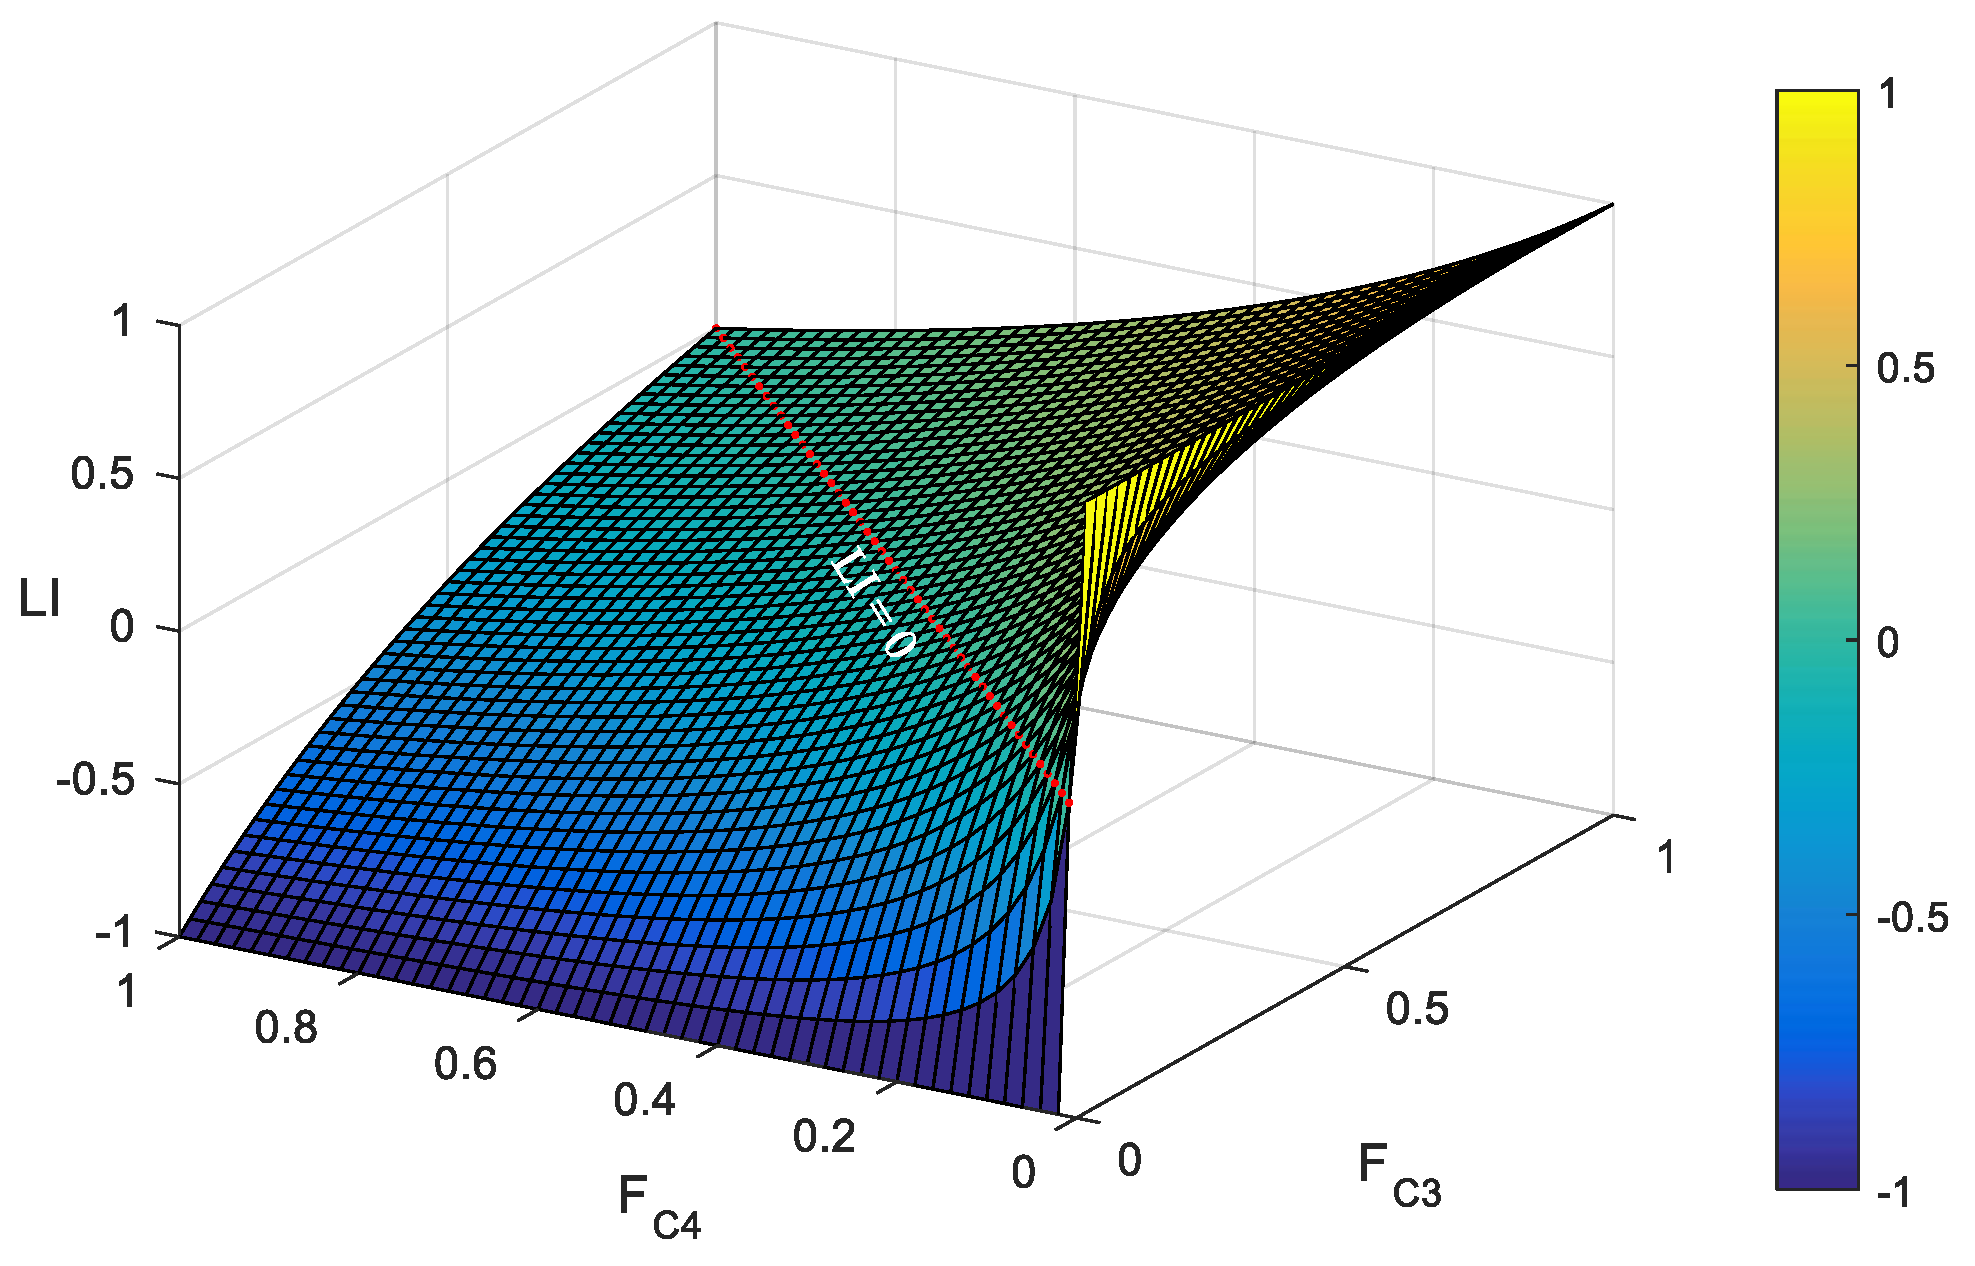
2.1.2. Laterality Index and Its Distribution

Generally, the Laterality index (LI) value is computed using the following classic formula [40,41]:
LI = λ · F C 3 F C 4 F C 3 + F C 4
where FC3 and FC4 represent the fuzzy entropy values calculated for channel C3-A2 and C4-A1, respectively. The factor λ is a scaling factor that defines the range of LI values. Usually, different λ values, like 1, −1 [42], 100, or 200 [43], have been used for different meanings. In this study, λ is held to 1, and LI varies continuously from 1 for pure right hemisphere dominance to + 1 for pure left hemisphere dominance. Figure 3 shows the 3-dimensional numerical distribution of LI along with FC3 and FC4. LI is symmetric about the red line which indicates LI = 0 , and if LI falls on the lower left side of the red line, it means that the right hemisphere dominates the main activity of the brain; on the contrary, if LI falls on the upper right side of the red line, the left brain hemisphere is the dominance.

3. Results

To explore the correlations of LI distribution and switching rate with the severity of OSA and sleep states, a set of experiments are conducted using MATLAB 2015a on a Dell computer with a 3.40 GHz Intel Core i7-2600 CPU and 16.0 GB RAM. This section consists of three main parts: fuzzy entropy extraction, laterality index distribution, and a statistical test of EEG switching rate. The experiments and results of each part are given as follows.

3.1. Fuzzy Entropy Extraction

Since the sleep stages are annotated every 30s, both EEG channels were segmented into epochs every 30s. Following the data preprocessing, FuzzyEn is calculated for each epoch of both channels. For parameter selection, the embedding dimension m is chosen as the default value 2, and different choices of tolerance threshold r = r × SD (SD is the standard deviation of each 30 s epoch) and fuzzy power n influence the standard deviation of the calculated entropy. It is worth noting that n and r are the gradient and width of the boundary of the fuzzy function μ ( d i j m , n , r ) , respectively. We test different r values from 0.05 to 0.2 and different n values from 1 to 5, and for a comprehensive consideration of a steady standard deviation of the calculated entropy and a small computation, we set the tolerance threshold r = 0.15 × SD and fuzzy power n = 2 . In addition, the time lag tau is set to the default value 1. The parameter selection in this study refers to the suggestions in existing papers [44,45]. The box plots of the fuzzy entropy of both channels is given in Figure 4.

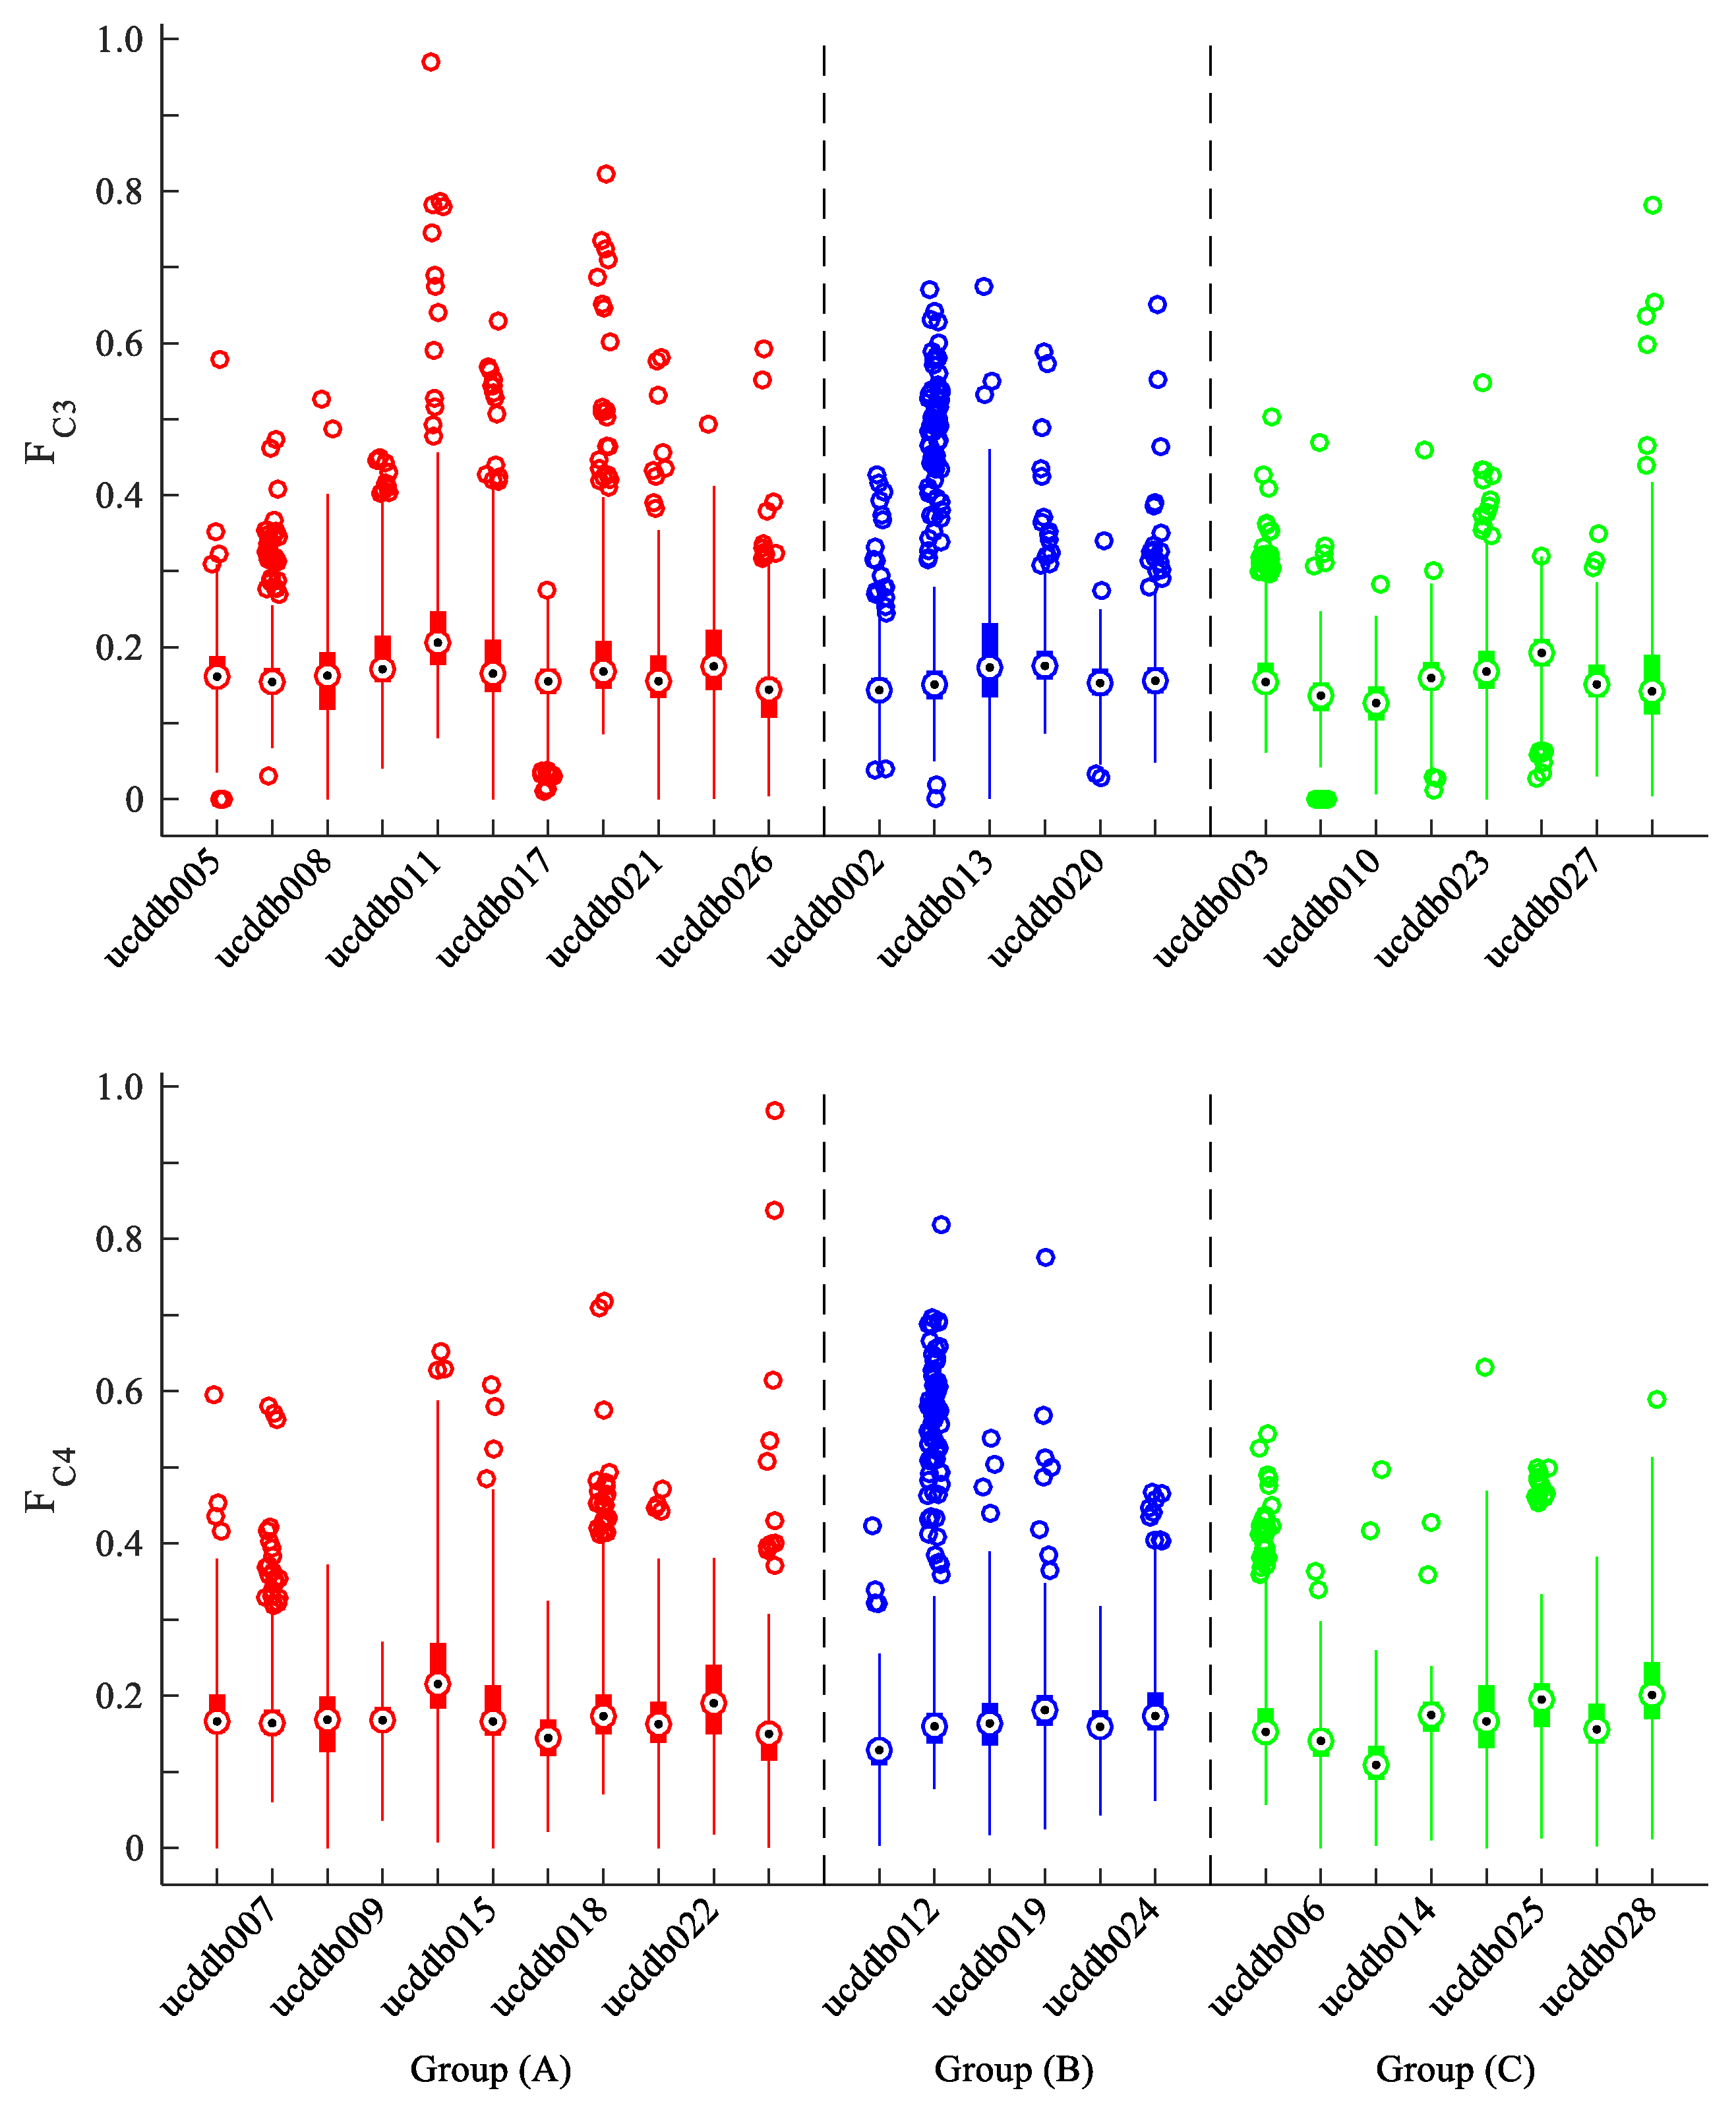
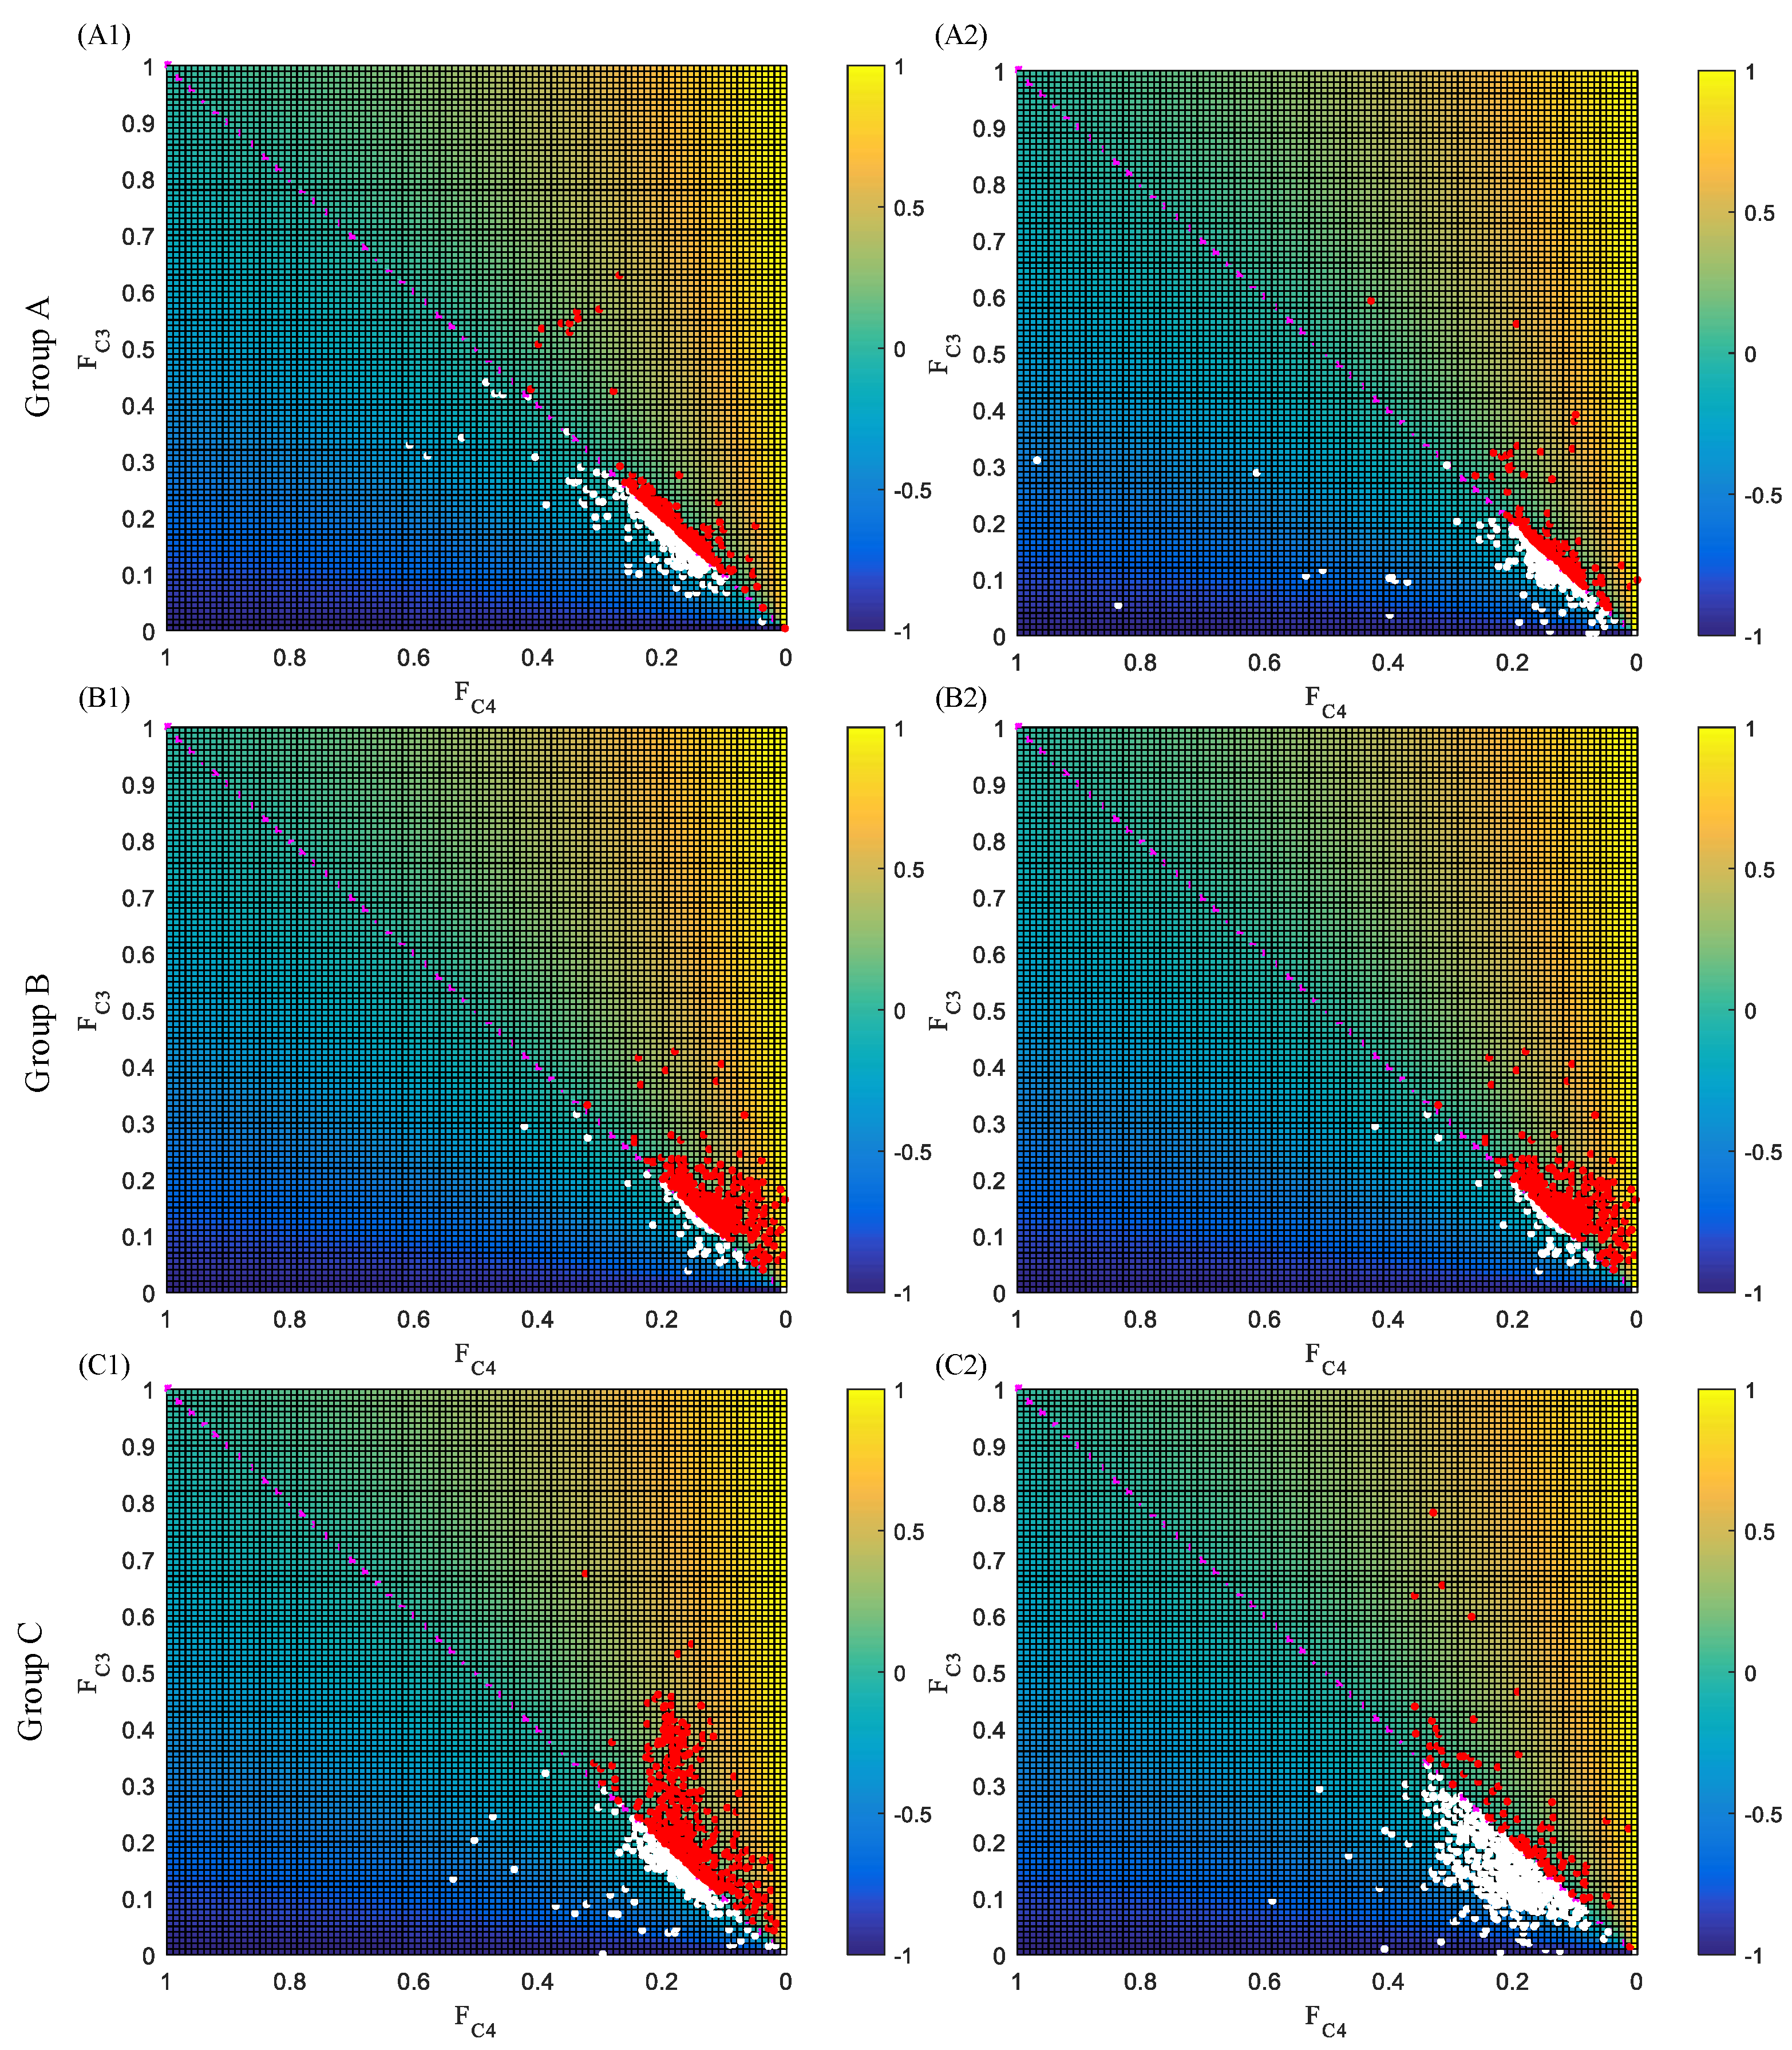
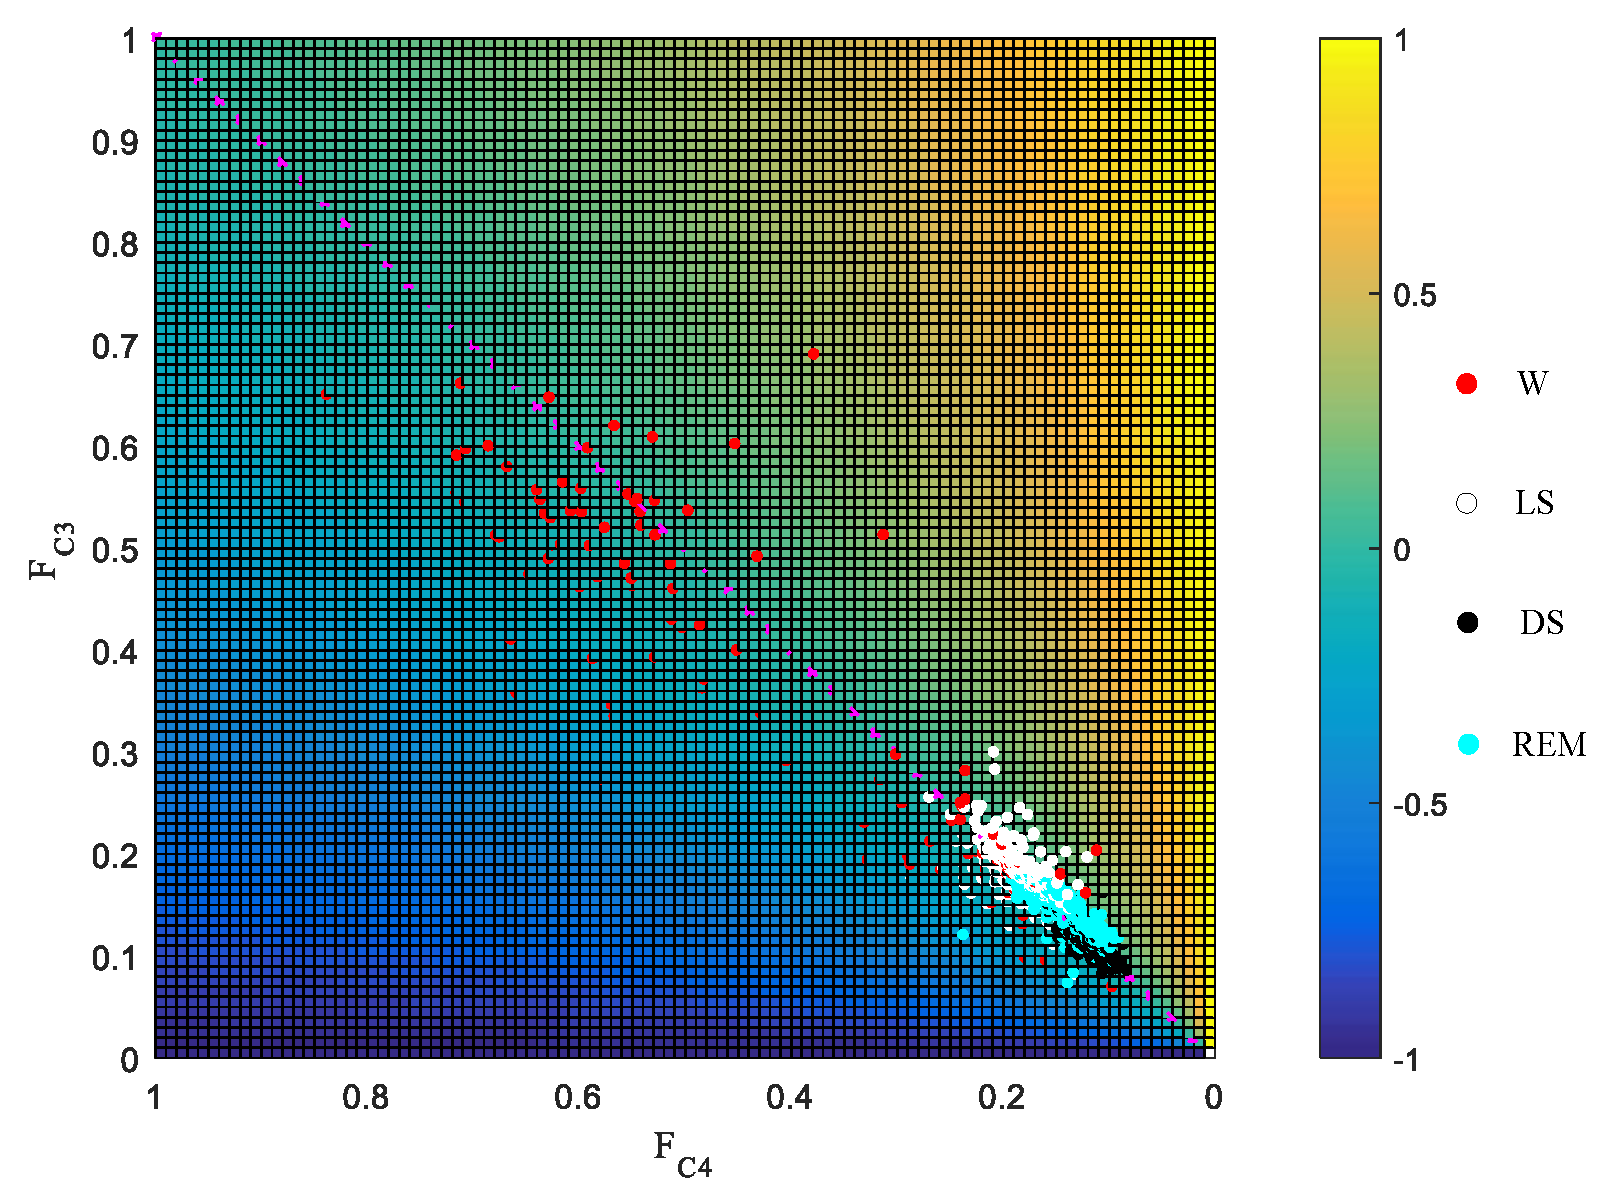
3.2. Laterality Index Distribution

Figure 5 illustrates the LI distributions along with FC3 and FC4 for three groups. The two axes represent FC3 and FC4, respectively, and the pixels in each subfigure indicate the corresponding LI. If LI locates in the upper right corner, i.e., FC3 approaches 1 and FC4 approaches 0, the main brain activity is concentrated in the left hemisphere. On the contrary, if LI locates in the lower left corner, i.e., FC3 approaches 0 and FC4 approaches 1, the main brain activity is concentrated in the right hemisphere. It is noted that the LI distribution is symmetrical in respect to the diagonal for healthy people in group A. However, OSA patients show a significant asymmetrical distribution of LI in Group B and C, as illustrated in subfigures B1-C2. The symmetry respect to the diagonal signifies that FC3 and FC4 are similar which indicates that both hemispheres would have a similar activity intensity during sleep for healthy people. However, the asymmetry in respect to the diagonal means that FC3 or FC4 is much bigger than the other, which implies that the brain activity intends to concentrate on left or right hemisphere during sleep for OSA patients.
At the same time, Figure 6 is also given to show the LI distribution regarding different sleep stages. It is worth noting that the LI distribution shows a significant difference among wake, light sleep, deep sleep, and REM. The red dots which correspond to wake locate in the centre of the entire LI map while the other three colours distribute in the lower right corner of the LI map with a clear separation between each other. It implies that the fuzzy entropy features for both C3 and C4 channels during wake stage are much bigger than the other three sleep stages, which is reasonable because the brain for both hemispheres during wake is much more active than the other sleep stages. Also, deep sleep shows the smallest fuzzy entropy for both channels, while REM is also smaller than that of light sleep. This means that the fuzzy entropy feature could be applied to classify different sleep stages, which agrees with our previous work in [39].

3.3. Statistical Test of EEG Switching Rate

As previously discussed, EEG switching rate is calculated from LI, and the cross-zero frequency of LI is regarded as the switching rate. In this section, we first present the switching rate of three groups among different sleep stages. Then the ANOVA test is also presented to show the statistical significance.
Table 2 shows the mean value of switching rate and its corresponding variance for three groups among wake (W), light sleep (LS), deep sleep (DS), and REM, respectively. We can observe that the mean switching rate shows a degressive trend from Group A, B to C for all sleep stages. This signifies that the inter-hemispheric switching is more frequent than OSA patients, and the switching rate intends to decrease with the severity of sleep-disordered breathing. This conclusion agrees with the LI distribution in Figure 5, in which the symmetric distribution for healthy people means a more frequent switching between both hemispheres. However, the brain activity for OSA patients intends to concentrate on one unilateral hemisphere. Thus, the inter-hemispheric switching rate is smaller.

3.3.1. ANOVA Test

In this section, the one-way ANOVA test was given to analyse the difference of inter-hemispheric switching in three groups.
  • Test of data normality and variance homogeneity
    In order to perform the ANOVA test, two conditions need to be satisfied: (1) data normality and (2) variance homogeneity. Thus, we reported the test results of these two conditions for Groups and Sleep Stages, respectively. For normality test, p-value is the probability of observing a test statistic as extreme as, or more extreme than, the observed value under the null hypothesis. Small values of p cast doubt on the validity of the null hypothesis. Also, h = 1 indicates the rejection of the null hypothesis, i.e., the data in vector x comes from a distribution in the normal family, while h = 0 means a failure to reject the null hypothesis. Our experiments reported that the switching rate for both Groups and Sleep Stages are normally distributed, with h = 0 and p > 0.05 for both considerations. Besides, since the p-value for homogeneity test is also bigger than 0.05, with p = 0.9896 for Groups test and p = 0.2204 for Sleep Stages test, it also reveals that the data satisfies variance homogeneity.
  • ANOVA test
    Based on the test results of data normality and variance homogeneity, the ANOVA test for three groups and four sleep stages were given in this section. First of all, the one-way ANOVA test was given to test the inter-differences among groups or sleep stages. Results showed that the p-values for both tests were 0.0012 (p1 < 0.05) and 0.0026 (p2 < 0 .05), respectively, which indicates that the differences among groups or sleep stages were significant. Figure 7 illustrates the boxplot of data distributions for Figure 7a Groups and Figure 7b Sleep Stages. It also clearly reveals the inter-differences in each subfigure. Also, since we were considering two factors, i.e., groups (AHI) and sleep stages that may affect the switching rate, we also performed the two-way ANOVA to give a more comprehensive difference test for both factors. The results were given in Table 3. The p-values for both factors also agrees with the previous one-way ANOVA test, but it also reveals that there is no evidence of an interaction effect of the two.

3.3.2. Independent Samples t-Test

To further test the differences between every possible pair, the independent samples t-test is performed for three groups and four sleep stages. The results are given in Table 4, and it is noted that the p-values in bold are no more than 0.05, indicating that the differences between group A and C, wake and REM, light sleep and REM, and deep sleep and REM were significant.

4. Discussion and Conclusions

In the work of this paper, we investigated the statistical properties of the overnight EEG data in obstructive apnea patients. One of the main findings is that the brain activity asymmetry intends to get worse with the severity of sleep-disordered breathing for obstructive sleep apnea patients. Some interpretations of this finding include that sleep-disordered breathing is always accompanied by neural injuries, and this kind of damage is preferentially unilateral. Injured structures include brain regions involved in hormone release and major neurotransmitter activity. This damage is reflected in a series of structural magnetic resonance procedures and also as a functional distortion of the evoked activity in the brain that regulates important autonomic and respiratory functions [46]. Besides, another finding implies that the fuzzy entropy features during wake state are much bigger than the other three sleep stages, and deep sleep shows the smallest fuzzy entropy while light sleep is only smaller than that of wake state. In addition, in terms of the four sleep stages, REM shows the highest mean switching rate while deep sleep shows the lowest. Existing work reported that the REM stage showed close coordination of the electrical manifestations of activity of the two hemispheres [47]. The REM stage is a kind of heterogeneous sleep because it is very similar to the wake state. Although the body is paralyzed, the brain is somewhat awake in some respects. EEG during the REM stage often shows faster neural oscillations that are different from Delta waves in deep sleep, more similar to patterns in wake state. During the REM stage, the neuronal state of the cerebral cortex and thalamus is more depolarized than other sleep stages, which means that it is more likely to be excited. As a result, the switching between the left and right hemispheres of the brain during REM sleep will be more. Similar study was presented in [48], they reported that switching was found in all sleep stages, and variation in left-right switch rate (Hz) was observed during W (0.076–0.084), light sleep (0.073–0.088), deep sleep (0.082–0.094) and REM sleep (0.082–0.090). In comparison, our results showed more distinct differences among sleep stages and thus could be used for stage scoring.
At the same time, we should also point out the main limitation of this study, which we will focus on improving in the future. Since there is only 1 healthy subject (ucddb018, AHI = 2) in the applied database, we simply included it in group A, i.e., mild obstructive sleep apnea, and thus there is no control group in this study. Still, the current conclusions were still trustworthy because we mainly focus on interhemispheric switching correlates with the severity of sleep-disordered breathing which gets worse from Group A to Group C. In our future work, on the one hand, we would include a control group of adequate healthy subjects, and on the other hand, bipolar montage C3/C4 would be applied instead of unipolar C3 and C4, since relative changes may provide better reliability for characterizing the differences, and laterality analysis.
As a conclusion, alternating interhemispheric brain activity during sleep is investigated for obstructive sleep apnea patients. Our main work focuses on characterising inter-individual variation in brain switching activity, examining the relationship between such switching activity and subjects’ apnoea-hypopnoea index (AHI), and exploring the differences in brain switching in subjects with sleep-disordered breathing during different sleep states. In order to address that, the fuzzy entropy is calculated for both C3 and C4 EEG channels, from which the laterality index (LI) is applied to illustrate the interhemispheric variations in brain activities. The distributions of LI in the positive or negative side reflect the brain activities in the left or right hemisphere. In addition, the cross-zero switching rate of LI is calculated and analysed to characterise the brain switching in both hemispheres. Extensive experiments are performed on the UCDDB database, in which most subjects have varying degrees of obstructive sleep apnea. Results show that EEG brain switching activity was observed in all sleep stages with a wide range of individual variation. The LI distribution shows an obvious interhemispheric asymmetry of brain activity for OSA patients, and it also reveals a significant difference among sleep states, i.e., wake, light sleep, deep sleep, and REM.
Furthermore, statistical tests are given to find the correlations of switching rate with the severity of OSA. The one-way ANOVA revealed a significant difference of switching rate among three groups (p = 0.0012), with Group C showing the least, and also a significant difference among four sleep stages (p = 0.0026), with REM the highest. The two-way ANOVA also confirms this result, but an interaction effect of the two is still not evident, possibly due to an underpowered subsample. The independent samples t-test further tests the differences between every possible pair, which reveals a significance between group A and C, wake and REM, light sleep and REM, and deep sleep and REM; however, the others do not.

Author Contributions

Y.L. and Z.Z. designed the global structure and experiments; G.Z., H.G. and D.L. performed the experiments; W.W. and S.W. analyzed the data; Y.L. and Z.Z. wrote the paper.

Funding

This work was supported by Xiamen Science and Technology Planning Project (3502Z20183058); Special Project of Foreign Science and Technology Cooperation and Exchange in Xiamen University of Technology (E201301300); Natural Science Foundation of Fujian Province (2018J01572); Shandong Province Key Research and Development Plan (2018GSF118133); China Postdoctoral Science Foundation (2018M642144).

Acknowledgments

The authors would like to thank Trung Ngo for his great suggestions to this paper and also to my PhD studying.

Conflicts of Interest

The authors declare no conflict of interest.

References

  1. Kales, A.; Caldwell, A.B.; Cadieux, R.J.; Vela-Bueno, A.; Ruch, L.G.; Mayes, S.D. Severe obstructive sleep apnea—II: Associated psychopathology and psychosocial consequences. J. Dis. 1985, 38, 427–434. [Google Scholar] [CrossRef]
  2. Ahmad, M.; Makati, D.; Akbar, S. Review of and Updates on Hypertension in Obstructive Sleep Apnea. Int. J. Hypertens. 2017, 2017, 1848375. [Google Scholar] [CrossRef]
  3. Jean-Louis, G.; Zizi, F.; Clark, L.T.; Brown, C.D.; McFarlane, S.I. Obstructive Sleep Apnea and Cardiovascular Disease: Role of the Metabolic Syndrome and Its Components. J. Clin. Sleep Med. 2008, 4, 261–272. [Google Scholar] [PubMed]
  4. Gurubhagavatula, I.; Sullivan, S.; Meoli, A.; Patil, S.; Olson, R.; Berneking, M.; Watson, N.F. Management of Obstructive Sleep Apnea in Commercial Motor Vehicle Operators: Recommendations of the AASM Sleep and Transportation Safety Awareness Task Force. J. Clin. Sleep Med. 2017, 13, 745–758. [Google Scholar] [CrossRef] [PubMed] [Green Version]
  5. Motamedi, K.K.; Mcclary, A.C.; Amedee, R.G. Obstructive sleep apnea: A growing problem. Ochsner J. 2009, 9, 149–153. [Google Scholar] [PubMed]
  6. Lucia, S.; Daniela, C.; Giuseppe, D.M. Obstructive sleep apnoea syndrome and its management. Ther. Adv. Chronic Dis. 2015, 6, 273–285. [Google Scholar] [Green Version]
  7. Ruehland, W.R.; Rochford, P.D.; O’Donoghue, F.J.; Pierce, R.J.; Parmjit, S.; Thornton, A.T. The new AASM criteria for scoring hypopneas: Impact on the apnea hypopnea index. Sleep 2009, 32, 150–157. [Google Scholar] [CrossRef]
  8. Bloch, K.E. Polysomnography: A systematic review. Technol. Health Care 1997, 5, 285. [Google Scholar]
  9. Chesson, A.L.; Ferber, R.A.; Fry, J.M.; Grigg-Damberger, M.; Hartse, K.M.; Hurwitz, T.D.; Johnson, S.; Kader, G.A.; Littner, M.; Rosen, G.; et al. The Indications for Polysomnography and Related Procedures. Sleep 1997, 20, 423–487. [Google Scholar] [CrossRef] [Green Version]
  10. Wu, C.T.; Dillon, D.G.; Hsu, H.C.; Huang, S.; Barrick, E.; Liu, Y.H. Depression detection using relative EEG power induced by emotionally positive images and a conformal kernel support vector machine. Appl. Sci. 2018, 8, 1244. [Google Scholar] [CrossRef]
  11. Kose, U. An Ant-Lion Optimizer-Trained Artificial Neural Network System for Chaotic Electroencephalogram (EEG) Prediction. Appl. Sci. 2018, 8, 1613. [Google Scholar] [CrossRef]
  12. Al-Nafjan, A.; Hosny, M.; Al-Ohali, Y.; Al-Wabil, A. Review and classification of emotion recognition based on EEG brain-computer interface system research: A systematic review. Appl. Sci. 2017, 7, 1239. [Google Scholar] [CrossRef]
  13. Li, Y.J.; Huang, J.J.; Zhou, H.Y.; Zhong, N. Human Emotion Recognition with Electroencephalographic Multidimensional Features by Hybrid Deep Neural Networks. Appl. Sci. 2017, 7, 1060. [Google Scholar] [CrossRef]
  14. Anwar, S.M.; Saeed, S.M.U.; Majid, M.; Usman, S.; Mehmood, C.A.M.; Liu, W. A game player expertise level classification system using electroencephalography (EEG). Appl. Sci. 2018, 8, 18. [Google Scholar] [CrossRef]
  15. Chowdhury, M.E.H.; Khandakar, A.; Hossain, B.; Alzoubi, K. Effects of the phantom shape on the gradient artefact of electroencephalography (EEG) data in simultaneous EEG–fMRI. Appl. Sci. 2018, 8, 1969. [Google Scholar] [CrossRef]
  16. Ren, H.; Qu, J.F.; Chai, Y.; Huang, L.; Tang, Q. Cepstrum Coefficient Analysis from Low-Frequency to High-Frequency Applied to Automatic Epileptic Seizure Detection with Bio-Electrical Signals. Appl. Sci. 2018, 8, 1528. [Google Scholar] [CrossRef]
  17. Coben, R.; Clarke, A.R.; Hudspeth, W.; Barry, R.J. EEG power and coherence in autistic spectrum disorder. Clin. Neurophysiol. 2008, 119, 1002–1009. [Google Scholar] [CrossRef]
  18. Corsi-Cabrera, M.; Guevara, M.A.; Arce, C.; Ramos, J. Inter and intrahemispheric EEG correlation as a function of sleep cycles. Prog. Neuro-Psychopharmacol. Biol. Psychiatry 1996, 20, 387–405. [Google Scholar] [CrossRef]
  19. Leocani, L.; Comi, G. EEG coherence in pathological conditions. J. Clin. Neurophysiol. 1999, 16, 548. [Google Scholar] [CrossRef]
  20. Nielsen, T.; Abel, A.; Lorrain, D.; Montplaisir, J. Interhemispheric EEG coherence during sleep and wakefulness in left- and right-handed subjects. Brain Cogn. 1990, 14, 113–125. [Google Scholar] [CrossRef]
  21. Chen, W.; Wang, S.; Zhang, X.; Yao, L.; Yue, L.; Qian, B.; Li, X. EEG-based motion intention recognition via multi-task RNNs. In Proceedings of the 2018 SIAM International Conference on Data Mining, San Diego, CA, USA, 3–5 May 2018; pp. 279–287. [Google Scholar]
  22. Zhang, D.; Yao, L.; Xiang, Z.; Wang, S.; Chen, W.; Boots, R. EEG-based intention recognition from spatio-temporal representations via cascade and parallel convolutional recurrent neural networks. arXiv, 2017; arXiv:1708.06578. [Google Scholar]
  23. Abeyratne, U.R.; Vinayak, S.; Craig, H.; Duce, B. Interhemispheric asynchrony correlates with severity of respiratory disturbance index in patients with sleep apnea. IEEE Trans. Biomed. Eng. 2010, 57, 2947–2955. [Google Scholar] [CrossRef] [PubMed]
  24. Rial, R.; Gené, L.; Akaârir, M.; Esteban, S.; Nicolau, C.; Gonzalez, J.; Gamundí, A.; Barceló, P. Asymmetric sleep in apneic human patients. Am. J. Physiol. Integr. Comp. Physiol. 2013, 304, R232–R237. [Google Scholar] [CrossRef] [PubMed]
  25. Long, M.A.; Fee, M.S. Using temperature to analyse temporal dynamics in the songbird motor pathway. Nature 2008, 456, 189–194. [Google Scholar] [CrossRef] [PubMed]
  26. Lily, Y.; Foley, N.C.; Bobula, J.M.; Kriegsfeld, L.J.; Rae, S. Two antiphase oscillations occur in each suprachiasmatic nucleus of behaviorally split hamsters. J. Neurosci. 2005, 25, 9017–9026. [Google Scholar]
  27. Butler, M.P.; Rainbow, M.N.; Elizabeth, R.; Lyon, S.M.; Rae, S. Twelve-hour days in the brain and behavior of split hamsters. Eur. J. Neurosci. 2012, 36, 2556–2566. [Google Scholar] [CrossRef] [Green Version]
  28. Bojsen-Moller, F.; Fahrenkrug, J. Nasal swell-bodies and cyclic changes in the air passage of the rat and rabbit nose. J. Anat. 1971, 110, 25–37. [Google Scholar] [PubMed]
  29. Campbell, W.M.; Kern, E.B. The nasal cycle in swine. Rhinology 1981, 19, 127. [Google Scholar]
  30. Bamford, O.S.; Eccles, R. The central reciprocal control of nasal vasomotor oscillations. Pflügers Archiv. 1982, 394, 139–143. [Google Scholar] [CrossRef] [PubMed]
  31. Friling, L.; Nyman, H.T.; Johnson, V. Asymmetric nasal mucosal thickening in healthy dogs consistent with the nasal cycle as demonstrated by MRI and CT. Vet. Radiol. Ultrasound 2014, 55, 159–165. [Google Scholar] [CrossRef]
  32. Kahana-Zweig, R.; Geva-Sagiv, M.; Weissbrod, A.; Secundo, L.; Soroker, N.; Sobel, N. Measuring and Characterizing the Human Nasal Cycle. PLoS ONE 2016, 11, e0162918. [Google Scholar] [CrossRef]
  33. Rattenborg, N.C.; Lima, S.L.; Amlaner, C.J. Half-awake to the risk of predation. Nature 1999, 397, 397–398. [Google Scholar] [CrossRef]
  34. Lyamin, O.I.; Manger, P.R.; Ridgway, S.H.; Mukhametov, L.M.; Siegel, J.M. Cetacean sleep: An unusual form of mammalian sleep. Neurosci. Biobehav. Rev. 2008, 32, 1451–1484. [Google Scholar] [CrossRef]
  35. Imbach, L.L.; Esther, W.; Ulf, K.; Johannes, S.; Scammell, T.E.; Baumann, C.R. Inter-hemispheric oscillations in human sleep. PLoS ONE 2012, 7, e48660. [Google Scholar] [CrossRef]
  36. Heneghan, C.; Chua, C.P.; Garvey, J.F.; De Chazal, P.; Shouldice, R.; Boyle, P.; McNicholas, W.T. A portable automated assessment tool for sleep apnea using a combined Holter-oximeter. Sleep 2008, 31, 1432–1439. [Google Scholar]
  37. Inouye, T.; Shinosaki, K.; Sakamoto, H.; Toi, S.; Ukai, S.; Iyama, A.; Katsuda, Y.; Hirano, M. Quantification of EEG irregularity by use of the entropy of the power spectrum. Electroencephalogr. Clin. Neurophysiol. 1991, 79, 204–210. [Google Scholar] [CrossRef]
  38. Costa, M.; Goldberger, A.L.; Peng, C.K. Multiscale entropy analysis of biological signals. Phys. Rev. E Stat. Nonlinear Soft Matter Phys. 2005, 71, 021906. [Google Scholar] [CrossRef]
  39. Zhang, Z.; Wei, S.; Zhu, G.; Liu, F.; Li, Y.; Dong, X.; Liu, C.; Liu, F. Efficient sleep classification based on entropy features and a support vector machine classifier. Physiol. Meas. 2018, 39, 115005. [Google Scholar] [CrossRef]
  40. Seghier, M.L. Laterality index in functional MRI: Methodological issues. Magn. Resonance Imaging 2008, 26, 594–601. [Google Scholar] [CrossRef]
  41. Binder, J.R.; Swanson, S.J.; Hammeke, T.A.; Morris, G.L.; Mueller, W.M.; Fischer, M.; Benbadis, S.; Frost, J.; Rao, S.M.; Haughton, V.M. Determination of language dominance using functional MRI: A comparison with the Wada test. Neurology 1996, 46, 978–984. [Google Scholar] [CrossRef] [Green Version]
  42. Fernandez, B.; Cardebat, D.; Demonet, J.F.; Joseph, P.A.; Mazaux, J.M.; Barat, M.; Allard, M. Functional MRI follow-up study of language processes in healthy subjects and during recovery in a case of aphasia. Stroke 2004, 35, 2171–2176. [Google Scholar] [CrossRef]
  43. Benson, R.R.; Fitzgerald, D.B.; Lesueur, L.L.; Kennedy, D.N.; Kwong, K.K.; Buchbinder, B.R.; Davis, T.L.; Weisskoff, R.M.; Talavage, T.M.; Logan, W.J.; et al. Language dominance determined by whole brain functional MRI in patients with brain lesions. Neurology 1999, 52, 798. [Google Scholar] [CrossRef] [PubMed]
  44. Azami, H.; Fernández, A.; Escudero, J. Refined multiscale fuzzy entropy based on standard deviation for biomedical signal analysis. Med. Biol. Eng. Comput. 2017, 55, 2037–2052. [Google Scholar] [CrossRef] [PubMed] [Green Version]
  45. Richman, J.S.; Moorman, J.R. Physiological time-series analysis using approximate entropy and sample entropy. Am. J. Physiol. Heart Circ. Physiol. 2000, 278, H2039. [Google Scholar] [CrossRef] [PubMed]
  46. Harper, R.M.; Kumar, R.; Ogren, J.A.; Macey, P.M. Sleep-disordered breathing: Effects on brain structure and function. Respir. Physiol. Neurobiol. 2013, 188, 383–391. [Google Scholar] [CrossRef] [PubMed]
  47. Mascetti, G.G. Unihemispheric sleep and asymmetrical sleep: Behavioral, neurophysiological, and functional perspectives. Nat. Sci. Sleep 2016, 8, 221–238. [Google Scholar] [CrossRef]
  48. Zhu, G.; Ngo, T. Characterising a putative EEG switching biomarker in chronobiology. J. Sleep Res. 2018, 27, e53_12766. [Google Scholar]
Figure 1. Illustration of 30 s epoch C3-A2 and C4-A1 EEG signals for Group A, B, and C.
Applsci 09 01568 g001
Figure 2. Block diagram of the method. EEG signals from both C3-A2 and C4-A1 channels are acquired, and the fuzzy entropy is calculated to indicate the unilateral brain activity. To reflect the activity difference or asymmetry between both hemispheres, the laterality index is calculated from the fuzzy entropy features. Then the LI distribution and brain switching could be clearly shown along with the sleep states.
Applsci 09 01568 g002
Figure 3. LI as a function of FC3 and FC4 (with λ = 1 ). The X-axis and Y-axis represent FC3 and FC4 respectively, and the Z-axis indicates LI.
Applsci 09 01568 g003
Figure 4. Box plots of the Fuzzy entropy features. The fuzzy entropy of channel C3-A2 is given in the above figure, and that of channel C4-A1 is illustrated in the below one. Red box plots represent Group A, blue represents Group B, and green represents Group C separately.
Applsci 09 01568 g004
Figure 5. LI distribution for three groups. Group A: (A1) ucddb015, (A2) ucddb022. Group B: (B1) ucddb002, (B2) ucddb013. Group C: (C1) ucddb025, (C2) ucddb028.
Applsci 09 01568 g005
Figure 6. LI distribution for different sleep states.
Applsci 09 01568 g006
Figure 7. Boxplot of switching rate for three Groups.
Applsci 09 01568 g007
Table 1. Polysomnograms results of the grouped subjects in UCDDB database.
(a) Group A (AHI < 15)
Subject IDAgeSexAHISleep Efficiency (%)PSG Duration (s)Percentage (%)
WLSDSREM
ucddb00565M13832479837.4141.166.3015.13
ucddb00747M12902440510.3357.8115.6216.24
ucddb00863F5642304134.7449.9310.964.36
ucddb00952M12802775920.5454.5915.249.62
ucddb01151M8602703039.5642.6713.114.67
ucddb01528M6772748822.7153.9315.947.42
ucddb01753M12872368413.0554.258.2424.46
ucddb01835M2602468539.9041.1216.672.31
ucddb02141F13822740918.1853.8913.9114.02
ucddb02234M7582364041.5536.2116.655.59
ucddb02649M14872516013.3740.6916.5929.36
(b) Group B (15 ≤ AHI < 30)
Subject IDAgeSexAHISleep Efficiency (%)PSG Duration (s)Percentage (%)
WLSDSREM
ucddb00254M23842247016.1851.4711.6320.72
ucddb01251M25852594114.9345.7216.9022.45
ucddb01362F16612433339.0938.9613.698.26
ucddb01949M1692255738.3346.8323.0021.83
ucddb02052M15782258622.4748.278.5120.74
ucddb02454M24832725017.1549.1215.1518.58
(c) Group C (AHI ≥ 30)
Subject IDAgeSexAHISleep Efficiency (%)PSG Duration (s)Percentage (%)
WLSDSREM
ucddb00348M51812647819.0540.8218.5921.54
ucddb00652M31892426711.3934.1630.6923.76
ucddb01038M3492272118.1664.508.7118.63
ucddb01456M36792323921.3268.09010.59
ucddb02368F39672585032.7552.618.016.62
ucddb02552M91772135022.9369.341.276.47
ucddb02745M55862679114.2266.293.9215.57
ucddb02850M46682166031.6247.857.2113.31
Table 2. Mean Values ± Variance of Switching Rate in Three Groups.
WakeLight SleepDeep SleepREM Sleep
Group A0.2497 ± 0.00410.3009 ± 0.00410.2316 ± 0.01980.3537 ± 0.0077
Group B0.2093 ± 0.00240.2319 ± 0.00350.1785 ± 0.01780.3293 ± 0.0086
Group C 0.1505 ± 0.00490.1800 ± 0.00810.1541 ± 0.02320.2267 ± 0.0180
Table 3. Test of two-way ANOVA.
Factorsp
Sleep Stages0.0012
Groups0.0006
Sleep Stages * Groups0.1106
Table 4. Independent samples t-test of every possible pair.
PairsGroupsPairsSleep Stages
A-BA-CB-CW-LSW-DSW-REMLS-DSLS-REMDS-REM
p0.1350.0000.063p0.1290.5820.0000.6120.0100.017

