Article

Comprehensive Evaluation for Real-Time Compaction Quality Using i-AHP and i-GAM: Case Study of Earth-Rock Dam

State Key Laboratory of Hydraulic Engineering Simulation and Safety, Tianjin University, Tianjin 300072, China
*
Author to whom correspondence should be addressed.
Appl. Sci. 2019, 9(8), 1543; https://doi.org/10.3390/app9081543
Submission received: 22 March 2019 / Revised: 7 April 2019 / Accepted: 8 April 2019 / Published: 13 April 2019
(This article belongs to the Section Civil Engineering)

Abstract

:
The real-time compaction quality evaluation of earth-rock dam plays a pivotal role in ensuring dam safety. However, the current real-time compaction quality evaluation only takes the physical properties of compacted dam materials into account, which fails to characterize whether their mechanical property meets the requirements of deformation and destruction, and no quantitative heterogeneity of real-time compaction quality is studied. This paper presents a comprehensive evaluation method to address these problems. First, based on on-site tests, real-time physical and mechanical indices are obtained. Next, the analytic hierarchy process, extended by the interval model (i-AHP) method, is introduced for real-time compaction quality evaluation considering both these indices, and the hybrid compaction index (HCI) is firstly proposed based on the i-AHP method. Finally, an improved geostatistical analysis method (i-GAM) is developed to quantify the real-time compaction quality heterogeneity. A case study of an earth-rock dam project in southwest China demonstrates the effectiveness and advantages of the proposed method.

1. Introduction

The compaction quality of earth-rock dam, especially in the region of dam core impervious material, is essential to dam safety [1]. Strengthening compaction quality control is an important measure to ensure the anti-seepage and strength performance of compacted materials and further prevents the appearance of cracks [2]. In the current specification of earth-rock dams [3], spot tests are chosen as the main control means. Spot tests are convenient to operate, but there are three shortcomings. First, these tests cannot be executed only after the whole working face is compacted, and the testing process can last for a day. Additionally, only after the inspection and evaluation are qualified can the next working face be constructed, which will delay construction progress. Second, the position of limited test pits is randomly chosen, which is unrepresentative and cannot fully reflect the whole working face [4]. When an unqualified test pit appears, it is rather ambiguous to define the scope of supplementary rolling. Third, the method is destructive and the test pits are usually of large size and need to be refilled and recompacted, which is harmful to the homogeneity and continuity of the properties of dam materials [5]. Therefore, in the last decade, real-time compaction monitoring (RTCM) technology for continuous compaction control is gradually introduced as a supplement to the quality evaluation of dam compaction, which integrates global position system (GPS), general packet radio service (GPRS) and personal digital assistant (PDA) technologies [6]. Based on the RTCM technology, the real-time evaluation for compaction quality has been developed, but there are still following main restrictions.
(1)
Due to their simplicity and convenience, the physical indices of compacted dam materials (i.e., the compactness K and porosity n) are chosen as the evaluation indices for compaction quality. Physical indices are the indicators of the proportional relationship between the mass and volume of the three phases (i.e., the solids, liquids and gases) of earth-rock dam materials [7], which can help reflect the physical composition and seepage properties of compacted materials. Mechanical indices characterize the deformation and destruction morphology of earth-rock dam materials in the process of being subjected to external forces or other effects [7], which can help reflect the strength and stiffness performance. Due to the correlation between them, the physical properties are usually used to represent the mechanical properties. However, due to the uncertainties in material internal structure (i.e., the grain composition and moisture content), the relationship between the two properties is indeterminate [8]. Therefore, it is not enough to only assess the compaction quality with the physical indices.
(2)
For the current real-time compaction quality evaluation of dam materials, the inherent heterogeneity of the evaluation indices within the whole working face has been ignored. It is noteworthy that the compaction quality heterogeneity resulting from local under-compaction and over-compaction may lead to an uneven settlement and arch effect [3], which are major causes of dam damage.
In allusion to these limitations, a comprehensive compaction quality evaluation method is proposed in this paper. In this method, real-time hybrid evaluation of compaction quality is carried out, integrating both the physical and mechanical properties of compacted dam materials and then analyzing the real-time compaction quality heterogeneity. This paper proceeds as follows: Section 2 gives a brief research background of compaction quality evaluation; Section 3 introduces the framework of this paper; Section 4 introduces the compaction quality evaluation system and relevant indices; Section 5 demonstrates the research methodology proposed in this paper; Section 6 is a case study to demonstrate the feasibility and advantages of the proposed method; Finally, conclusions and future research are summarized in Section 7.

2. Research Background

A crucial process in dam construction is dam material compaction. Compared with similar research in other engineering fields, the compaction measurement indices can mainly be divided into two categories: the physical indices and the mechanical indices [8,9,10]. The common indices are summarized in Table 1 according to category. The main indices currently applied in earth-rock dam projects are the physical indices (i.e., the compactness K and the porosity n), which are obtained by random spot tests. Additionally, the nondestructive alternatives for physical indices such as nuclear density gauge method and additional mass method have been applied at the construction site [3].
The above detection techniques belong to the point-control and post-control methods. For the point-control method, less than 1% of the entire working face can be assessed [11]. For the post-control method, the time-consuming process will delay construction progress and is inconducive to timely construction feedback control. To get around these obstacles, the RTCM system has been rapidly developed, as it can realize continuous compaction control and evaluation [12], and various real-time prediction methods for physical properties of dam materials have been investigated. For example, based on the compaction parameters (i.e., rolling speed Ns, compaction passes Np, vibration state Nv and compaction thickness Nt) and material parameters (i.e., gradation Mg and moisture content Mm), Liu et al. [4] established a compactness prediction model to predict material compactness by using the multiple regression method. Wang et al. estimated the compactness using support vector regression with bacterial foraging algorithm (SVR with BFA) [1] and the support vector regression with the chaotic firefly algorithm (SVR with CFA) [13] respectively, which improved the prediction accuracy to a great extent. In recent years, based on the RTCM technology, continuous measurement indices (CMI) were proposed as substitutes for physical indices. By monitoring the drum acceleration using accelerometers and encoders, Thurner et al. [14,15] proposed the compaction meter value (CMV) which is derived from the amplitudes of drum acceleration and its harmonics. Based on CMV, other indices (i.e., the resonance meter value RMV, oscillometer value OMV and continuous compaction value CCV) were proposed [11]. Liu et al. [16,17] introduced the CMV into earth-rock dam construction. By establishing the regression relation with compactness and dry density, they presented the compaction value (CV) and unit compaction energy (UCE) as compaction quality measurement indices. Other main CMI are listed in Table 1.
However, the above-mentioned research only takes the physical indices of compacted materials as the ultimate control indices. Although related to the mechanical properties, the physical indices neglect the uncertainty in the internal structure of dam materials [8], moreover, the relationship between physical and mechanical indices is only empirical and lacks a strict theoretical basis [15,18]. The physical indices can only reflect the physical composition and seepage property and fail to represent the mechanical properties. Additionally, since there is a stronger correlation between the drum vibration acceleration and the material stiffness or modulus [19], it is more appropriate for the drum vibration acceleration to establish a prediction model with the mechanical indices than the physical indices. Therefore, reasonably considering both the properties of dam materials will help fully reflect the compaction quality. Due to its simplicity and flexibility, the analytic hierarchy process (AHP) method, proposed by Saaty [20], has been widely used to solve comprehensive evaluation problems [21,22]. In the method, the weights of the alternatives are given by the decision-making experts. However, due to complexity in the construction field and the insufficient experience to support the experts to make a fully deterministic judgement, the results are usually subjective and uncertain [22]. To address this problem, several theories have been developed, including the evidence theory, probability theory, fuzzy set theory and convex set theory [23]. Among these theories, the interval model, as a representative of the convex set model, is extensively used since it is easy to combine with on-site statistical data. The model can take the subjectivity and uncertainty into account by extending the deterministic numbers to bounded intervals [24]. Therefore, the mathematical model of AHP extended by the interval model (i-AHP) method is introduced for the evaluation of real-time compaction quality.
Besides, although it is crucial for dam safety, the inherent heterogeneity of dam material compaction has rarely been studied. The reason may be that it cannot be quantified until the RTCM technology is introduced to dam construction which realizes full monitoring coverage of the working face. In other engineering fields, the geostatistical analysis method (GAM) has been introduced to spatial heterogeneity analysis [25,26]. Based on the GAM, Xu et al. [27] studied the effect of compaction quality heterogeneity on structural response in highway pavements and proposed the Cova index to quantify the heterogeneity. The semivariogram model parameters in these studies are fitted using the least square method or the weighted regression method; however, the fitting accuracy needs to be further discussed.
The objectives of this paper are to: (1) establish the prediction models for the physical and mechanical indices of earth-rock dam materials; (2) based on the i-AHP method, establish a hybrid evaluation model for real-time compaction quality, which considers both physical and mechanical properties and deals with the uncertainty in determining the weights of the alternatives, and to develop the hybrid compaction index (HCI); and (3) present the improved GAM (i-GAM) to improve the model fitting precision and investigate the inherent heterogeneity of the HCI. Through the above work, the comprehensive compaction quality evaluation with full coverage can be achieved, and the inherent heterogeneity analysis of compaction quality can help find the weak construction area which is benefit for timely feedback control.

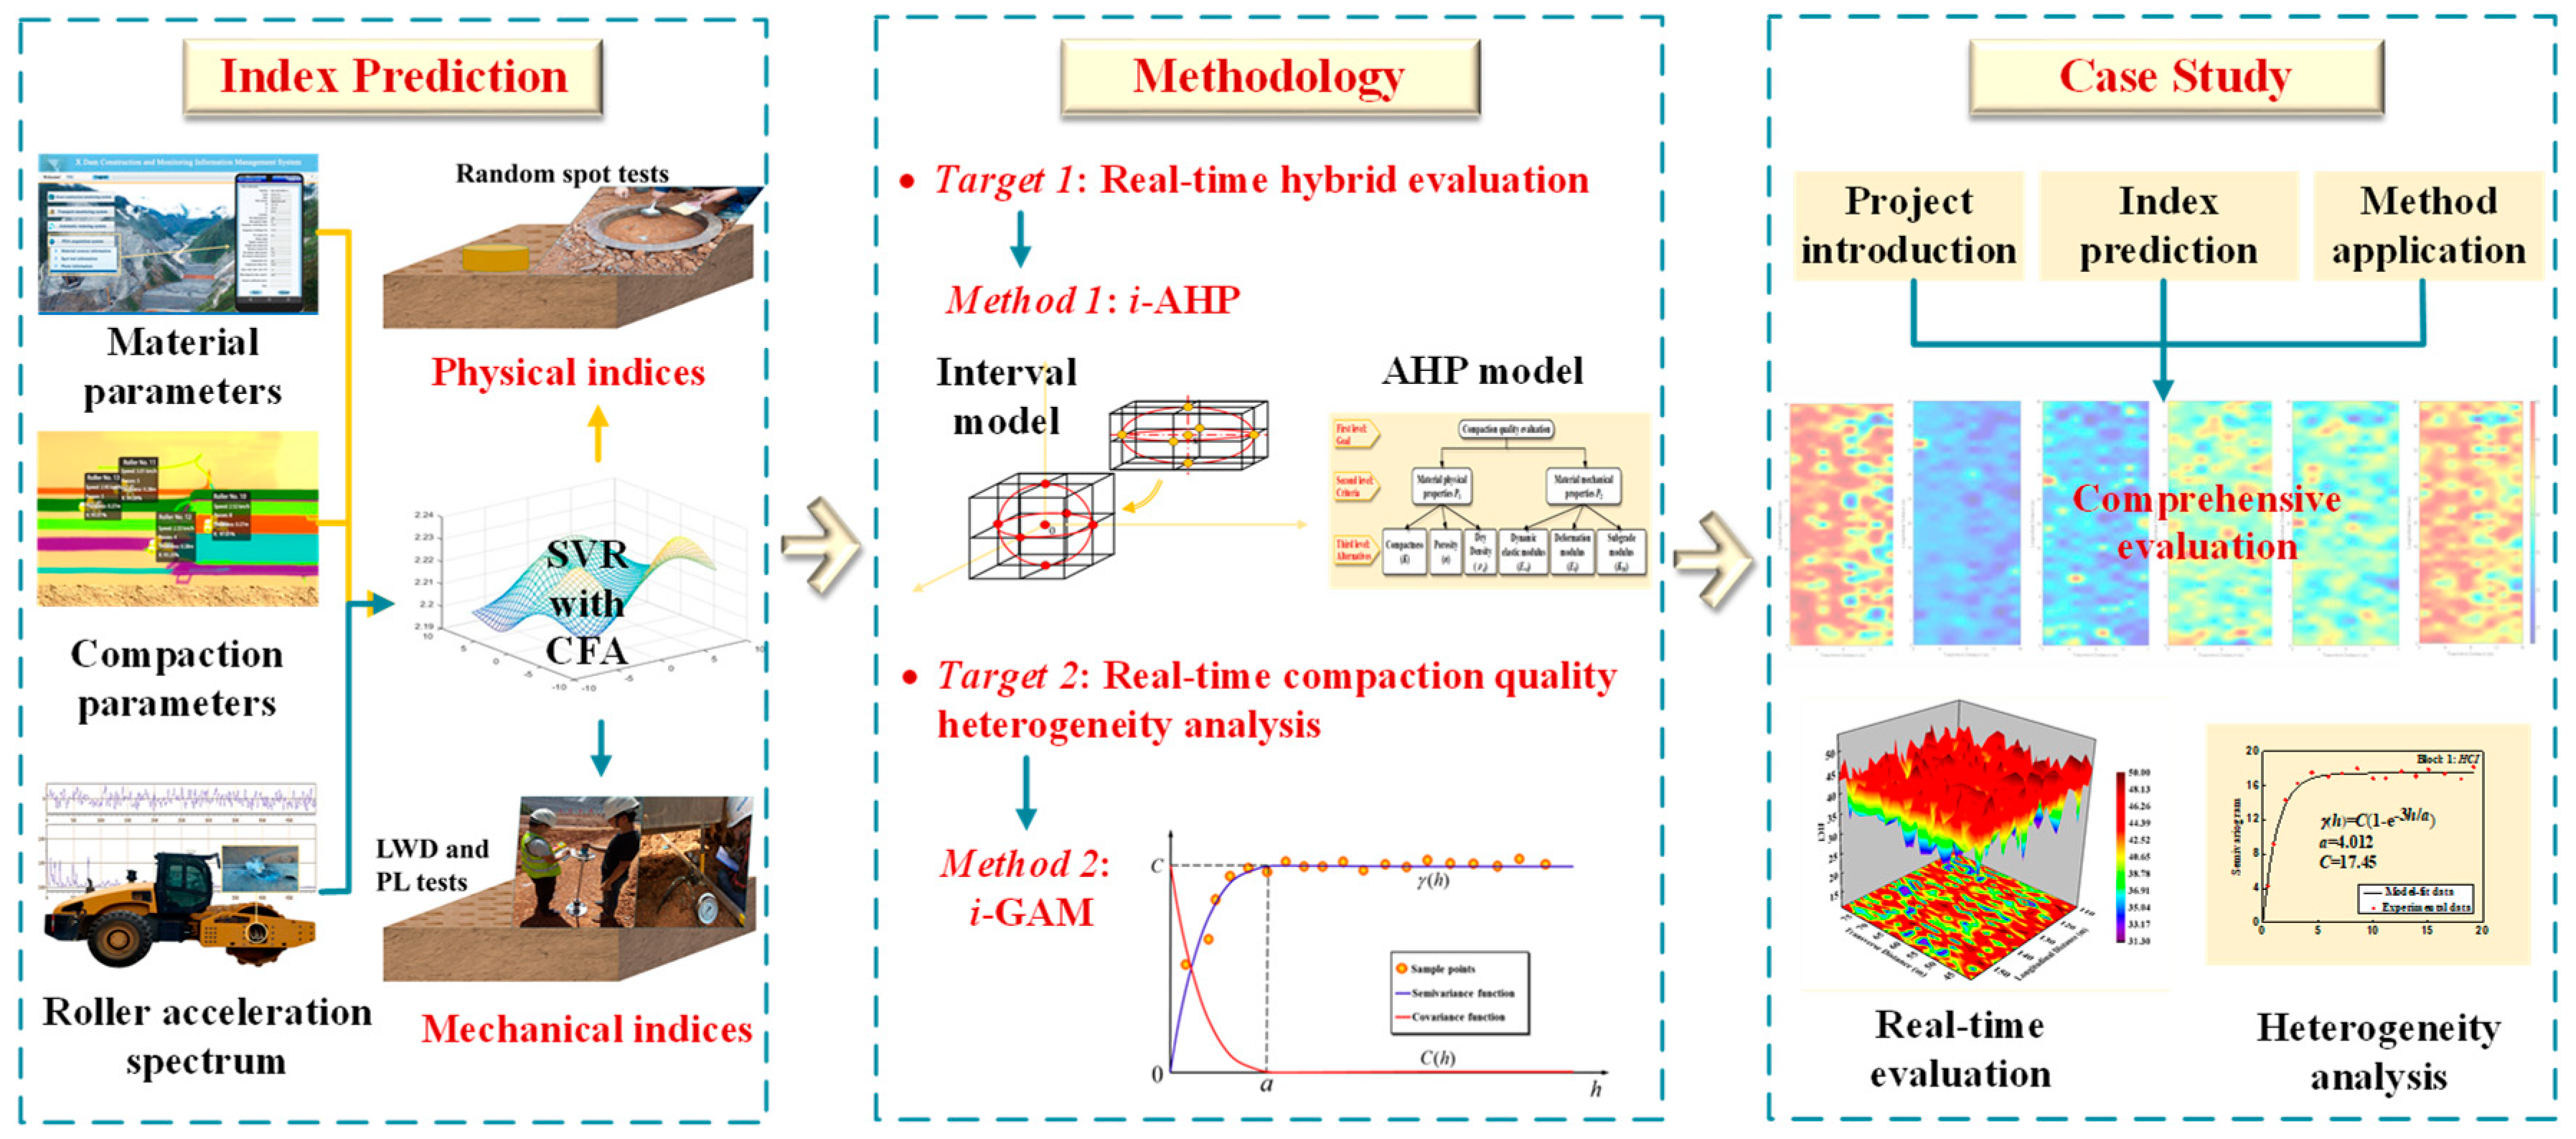
3. Research Framework

As shown in Figure 1, the research framework mainly includes three parts: predicting the real-time physical and mechanical indices, establishing the comprehensive evaluation model of compaction quality and addressing a case study. First, based on the RTCM technology, the prediction models for real-time physical and mechanical indices are established by using SVR with CFA. The material and compaction parameters are selected as the inputs for the physical indices’ prediction, and the roller acceleration spectrum is selected for the mechanical indices. Secondly, the comprehensive evaluation model of compaction quality is established, in which the i-AHP method is introduced for real-time hybrid evaluation and i-GAM is presented to analyze real-time compaction quality heterogeneity. Finally, the proposed method is applied to a high earth-rock dam project in China.

4. Compaction Quality Evaluation System and Its Indices

4.1. Evaluation System for Compaction Quality

The three-level i-AHP evaluation system for compaction quality is established as illustrated in Figure 2 for hybrid evaluation of compaction quality and deriving the HCI. Based on Table 1, the compactness (K) and dry density ( ρ d ) for gravel-mixed cohesive soil at the core wall, porosity (n) and dry density ( ρ d ) for rockfill area are selected as the physical indices [3]. The dynamic elastic modulus (Evd), deformation modulus (E0) and subgrade modulus (K30) are selected as the mechanical indices.

4.2. Evaluation System for Compaction Quality

To obtain the real-time physical and mechanical indices, two groups of independent variables are selected as the prediction inputs, respectively. The compaction parameters (i.e., rolling speed Ns, compaction passes Np, vibration state Nv and compaction thickness Nt) and the material parameters (i.e., gradation Mg and moisture content Mm) are chosen to predict the distribution of material physical indices [1,4,13], and the drum vibration acceleration during roller travel is chosen to predict the distribution of material mechanical indices [19]. The SVR with CFA is employed to establish the compaction quality prediction model, and its efficiency and accuracy have been demonstrated in Reference [13]. Through the above process, we can obtain the real-time physical and mechanical indices.

4.2.1. On-Site Point-Test Compaction Measurement Indices

(1)
Physical compaction measurement indices
The on-site physical indices can be obtained with the random spot test method. The expressions of K and n are
{ K = ρ m ρ m a x n = V 0 V V 0 = 1 V V 0 = ( 1 ρ 0 ρ ) × 100 %
where K is the compactness, n is the porosity (%), ρ m is the wet density (kg/m3), and ρ m a x is the maximum wet density (kg/m3), V 0 is the material apparent volume (m3), V is the material solid volume (kg/m3), and ρ 0 is the material apparent density (kg/m3).
(2)
Mechanical compaction measurement indices
The on-site mechanical compaction indices here include E v d , E 0 and K 30 . E v d can be detected by light weight deflectometer (LWD) tests and can be expressed as
E v d = 3 r σ 2 S
where E v d is the dynamic elastic modulus (MPa), r is the radius of load plate (mm), σ is the impact load (MPa), S is the settlement of load plate (mm).
E 0 and K 30 can be obtained by plate load (PL) tests and can be expressed as
{ E 0 = I 0 ( 1 μ 2 ) p d S K 30 = P 0 0.00125 ,
where E 0 is the deformation modulus (MPa), K 30 is the subgrade modulus (MPa/m), I 0 is the shape coefficient, usually 0.785 for circular plate and 0.886 for square plate, μ is the material Poisson ratio, p is the imposed pressure (kPa), d is the diameter or side length of load plate (mm), and S is the settlement of load plate (mm), P 0 denotes the load when the settlement of PL tests is 1.25 mm for a 300 mm diameter circular load plate. The testing process can refer to Refs. [28,29].

4.2.2. Real-Time Compaction Measurement Indices

The real-time collection of compaction parameters and roller acceleration spectrum is based on the RTCM system. Referring to Figure 1, the collection process is performed in the following three steps.
(1)
The position and vibration state data of rollers can be collected by the GPS orientation and vibration state monitoring modules installed on the roller. Combined with real-time kinematic global positioning system [34], the horizontal positioning accuracy can reach 1 to 2 cm and the vertical accuracy can reach 2 to 3 cm. The roller acceleration signal can be obtained by the acceleration monitoring module (including the accelerometers and encoders) that is installed on the center of the roller’s drum. The rotation of eccentric masses produces eccentric force and causes the drum to vibrate at a certain frequency. It has been confirmed that with the continuous compaction of dam materials, the material stiffness and modulus will constantly improve and the corresponding amplitude of roller signal acceleration will constantly change [7,14,15].
(2)
The above data will be sent to the application server through data terminal unit of global system for mobile communications. Via the calculation of application server, we can obtain the real-time compaction parameters (i.e., Ns, Np, Nv and Nt). The 3D compaction monitoring client will read above massages and visualize them as shown in Figure 3. The material parameters (i.e., Mg and Mm) can be collected by the PDA collection system as illustrated in Reference [13]. Meanwhile, the acceleration amplitude spectrum can be obtained from the roller acceleration signal by Fast Fourier Transform [16], based on which the indices C M V and C C V can be acquired [28].
{ C M V = C 0 A 2 Ω A Ω C C V = ( A 0.5 Ω + A 1.5 Ω + A 2.5 Ω + A 3 Ω A 2.5 Ω + A 3 Ω ) × 100 ,
where A Ω and A 2 Ω are the drum acceleration amplitudes at the fundamental frequency Ω and the first harmonic component of the real-time acceleration response signal. C 0 is the site calibration constant. A 0.5 Ω represents the first subharmonic, and A 1.5 Ω , A 2.5 Ω and A 3 Ω denote the other higher-order harmonics.
(3)
Based on correlation analysis, the real-time physical indices across the working face can be predicted by compaction and material parameters [13]. Additionally, for the lack of a strict theoretical basis for, and physical significance of, C M V and C C V , the character parameters of the original acceleration amplitude spectrum (i.e., A 0.5 Ω , A Ω , A 1.5 Ω , A 2 Ω , A 2.5 Ω , A 3 Ω ) are chosen as the original prediction inputs for the prediction of mechanical indices. SVR with CFA is employed to establish the real-time prediction model and the system client will access the data continuously and perform a visual display for the real-time feedback control.

5. Methodology

5.1. Mathematical Models of the Evaluation System

The comprehensive compaction quality evaluation includes the real-time hybrid evaluation and the real-time compaction quality heterogeneity analysis. The mathematical models are shown in Equations (5)–(7), comprised of three parts: the objective model, the method set model and the parameter set model. Equation (5) defines the objective model E of compaction quality evaluation, where E R denotes the real-time hybrid evaluation model, E P denotes the real-time compaction quality heterogeneity analysis model. Equation (6) defines the method set model, where f is the i-AHP method for the hybrid evaluation of material physical indices ( I P ) and mechanical indices ( I M ), y denotes the i-GAM, and h denotes the lag distance, a parameter in i-GAM. S and V are the rating matrix and the total weight vectors. k denotes the interval mathematics method, g denotes the prediction model, denotes the coupled algorithm. Equation (7) defines the parameter set model, where C and a represents the semivariogram model parameters in i-GAM. The i-AHP and i-GAM will be elaborated in the following parts of this section.
E = E R E P ,
{ E R = f ( I P , I M ) E P = y ( h ) I P = g ( N s , N p , N v , N t , M g , M m ) I M = g ( A 0.5 Ω , A Ω , A 1.5 Ω , A 2 Ω , A 2.5 Ω , A 3 Ω ) f = k ( S , V ) g = S V R F A ,
{ E R = [ H C I ] E P = [ C , a ] I P = [ K , n , ρ d ] I M = [ E v d , E 0 , K 30 ] .

5.2. Real-Time Hybrid Compaction Quality Evaluation Using i-AHP Method

Based on the real-time predicted physical and mechanical indices, the i-AHP model is established for the real-time hybrid compaction quality evaluation.

5.2.1. Interval Model

In interval mathematics, the uncertain parameters can be described by interval model, the geometric forms of which can be a line, a rectangle or multi-dimensional cuboid, and the model can be defined as follows.
Definition 1.
Let R be the real number field, for two given real numbers x , x + R , and x x + , then the interval number model x I is defined as:
x I = [ x , x + ] = { x : x R , x x x + } ,
where x and x + represent the upper and lower bounds.
From this definition, we notice that the interval number model turns to a specific point model when x = x + , which is deterministic and means there is no uncertainty.
Definition 2.
The median x c and deviation x r of the interval number model x I is defined as:
{ x c = ( x + x + ) 2 x r = ( x x + ) 2 .
Therefore, the interval number model can be also expressed as:
x I = [ x , x + ] = x c + x r e ,
where e = [ 1 , 1 ] denotes the unit interval number.
Definition 3.
If x i I = [ x i , x i + ] I ( R )   ( i = 1 , 2 , , n ) , the interval vector model can be defined as:
x I = { ( x 1 , x 2 , , x n ) T : ( x 1 , x 2 , , x n ) T R n , x i x i I , i = 1 , 2 , n } ,
and for m × n interval number x i j I = [ x i j , x i j + ] I ( R )   ( i = 1 , 2 , , m   a n d   j = 1 , 2 , , n ) , the interval matrix model can be defined as:
X I = ( x i j I ) m × n = [ x 11 I x 12 I x 1 n I x 21 I x 22 I x 2 n I x m 1 I x m 2 I x m n I ] [ [ x 11 , x 11 + ] [ x 12 , x 12 + ] [ x 1 n , x 1 n + ] [ x 21 , x 21 + ] [ x 22 , x 22 + ] [ x 2 n , x 2 n + ] [ x m 1 , x m 1 + ] [ x m 2 , x m 2 + ] [ x m n , x m n + ] ] = ( X , X + ) .

5.2.2. i-AHP Model

Based on the interval model, the i-AHP model is established by extending the deterministic numbers to uncertain-but-bounded intervals, and the process for the real-time hybrid evaluation is as follows:
(1)
Construct the i-AHP system and the rating matrix. The i-AHP system is established as shown in Figure 2. Thereafter, a scoring criterion is necessary by using expert grading method. Then the rating matrix of each element can be obtained as:
s = [ s 1 , s 2 , , s n ] ,
where n denotes the total number of elements in the alternative level.
(2)
Construct the interval comparison matrices through pairwise comparison. As shown in Figure 2, the comparison matrices include the criterion level to objective level ( P I ) and the alternative level to criterion level ( A I ).
P I = P 1 P 2 P m P 1 P 2 P m [ 1 p 12 I p 1 m I p 21 I 1 p 2 m I p m 1 I p m 2 I 1 ] ,
A I = A 1 A 2 A n A 1 A 2 A n [ 1 a 12 I a 1 n I a 21 I 1 a 2 n I a n 1 I a n 2 I 1 ] ,
where m is the total number of elements in criteria level. x i j I = [ x i j , x i j + ] ( x = p , a ) denote the interval model for comparing the importance of the ith and the jth element, and a i j I = 0 ( i j ) when A i and A j are in different criteria. The elements in the comparison matrices satisfy the reciprocal principle, namely x i j ± = 1 / x j i ( x = p , a ) , and the importance degree is listed in Table 2.
(3)
Calculate the interval weight vectors of the interval comparison matrices, including the criterion level to objective level ( p ¯ I ) and the alternative level to criterion level ( a ¯ I ). The expression of p ¯ I is:
{ p ¯ I = [ p ¯ , p ¯ + ] = [ ε 1 x , ε 2 x + ] ε 1 = j = 1 m 1 i = 1 m p i j + ε 2 = j = 1 m 1 i = 1 m p i j ,
where x and x + are the normalized eigenvectors of P and P + .
(4)
Check the consistency of the interval comparison matrices. Firstly, the fuzzy degree of interval number model x I is defined as:
δ ( x I ) = 2 x r x c .
Then the fuzzy degree of P I can be expressed as:
δ ( P I ) = 2 x r m ( m 1 ) i = 1 m j = 1 , i 1 m δ ( p i j I ) .
The criterion of consistency check is:
{ C . R . = η m ( m 1 ) R . I . 0.1 × ( 1 + δ ( P I ) ) η = λ + ( c 1 + c ) ( λ + λ ) c = 1 j = 1 m w j j = 1 m w j + 1 ,
where C.R. denotes the consistency ratio. R.I. denotes the average random consistency index, which can be queried in Reference [20]. The error of the interval comparison matrices will be too large when Equation (19) can’t be satisfied, which requires a new judgement.
(5)
Define and calculate the HCI. The interval total weight vectors can be obtained based on the above process, which is expressed as:
v I = p ¯ I a ¯ I ,
then the final hybrid evaluation index HCI can be defined as Equation (21), here H C I I denotes the interval HCI, and the higher index shows the better compaction quality.
H C I I = s v I .

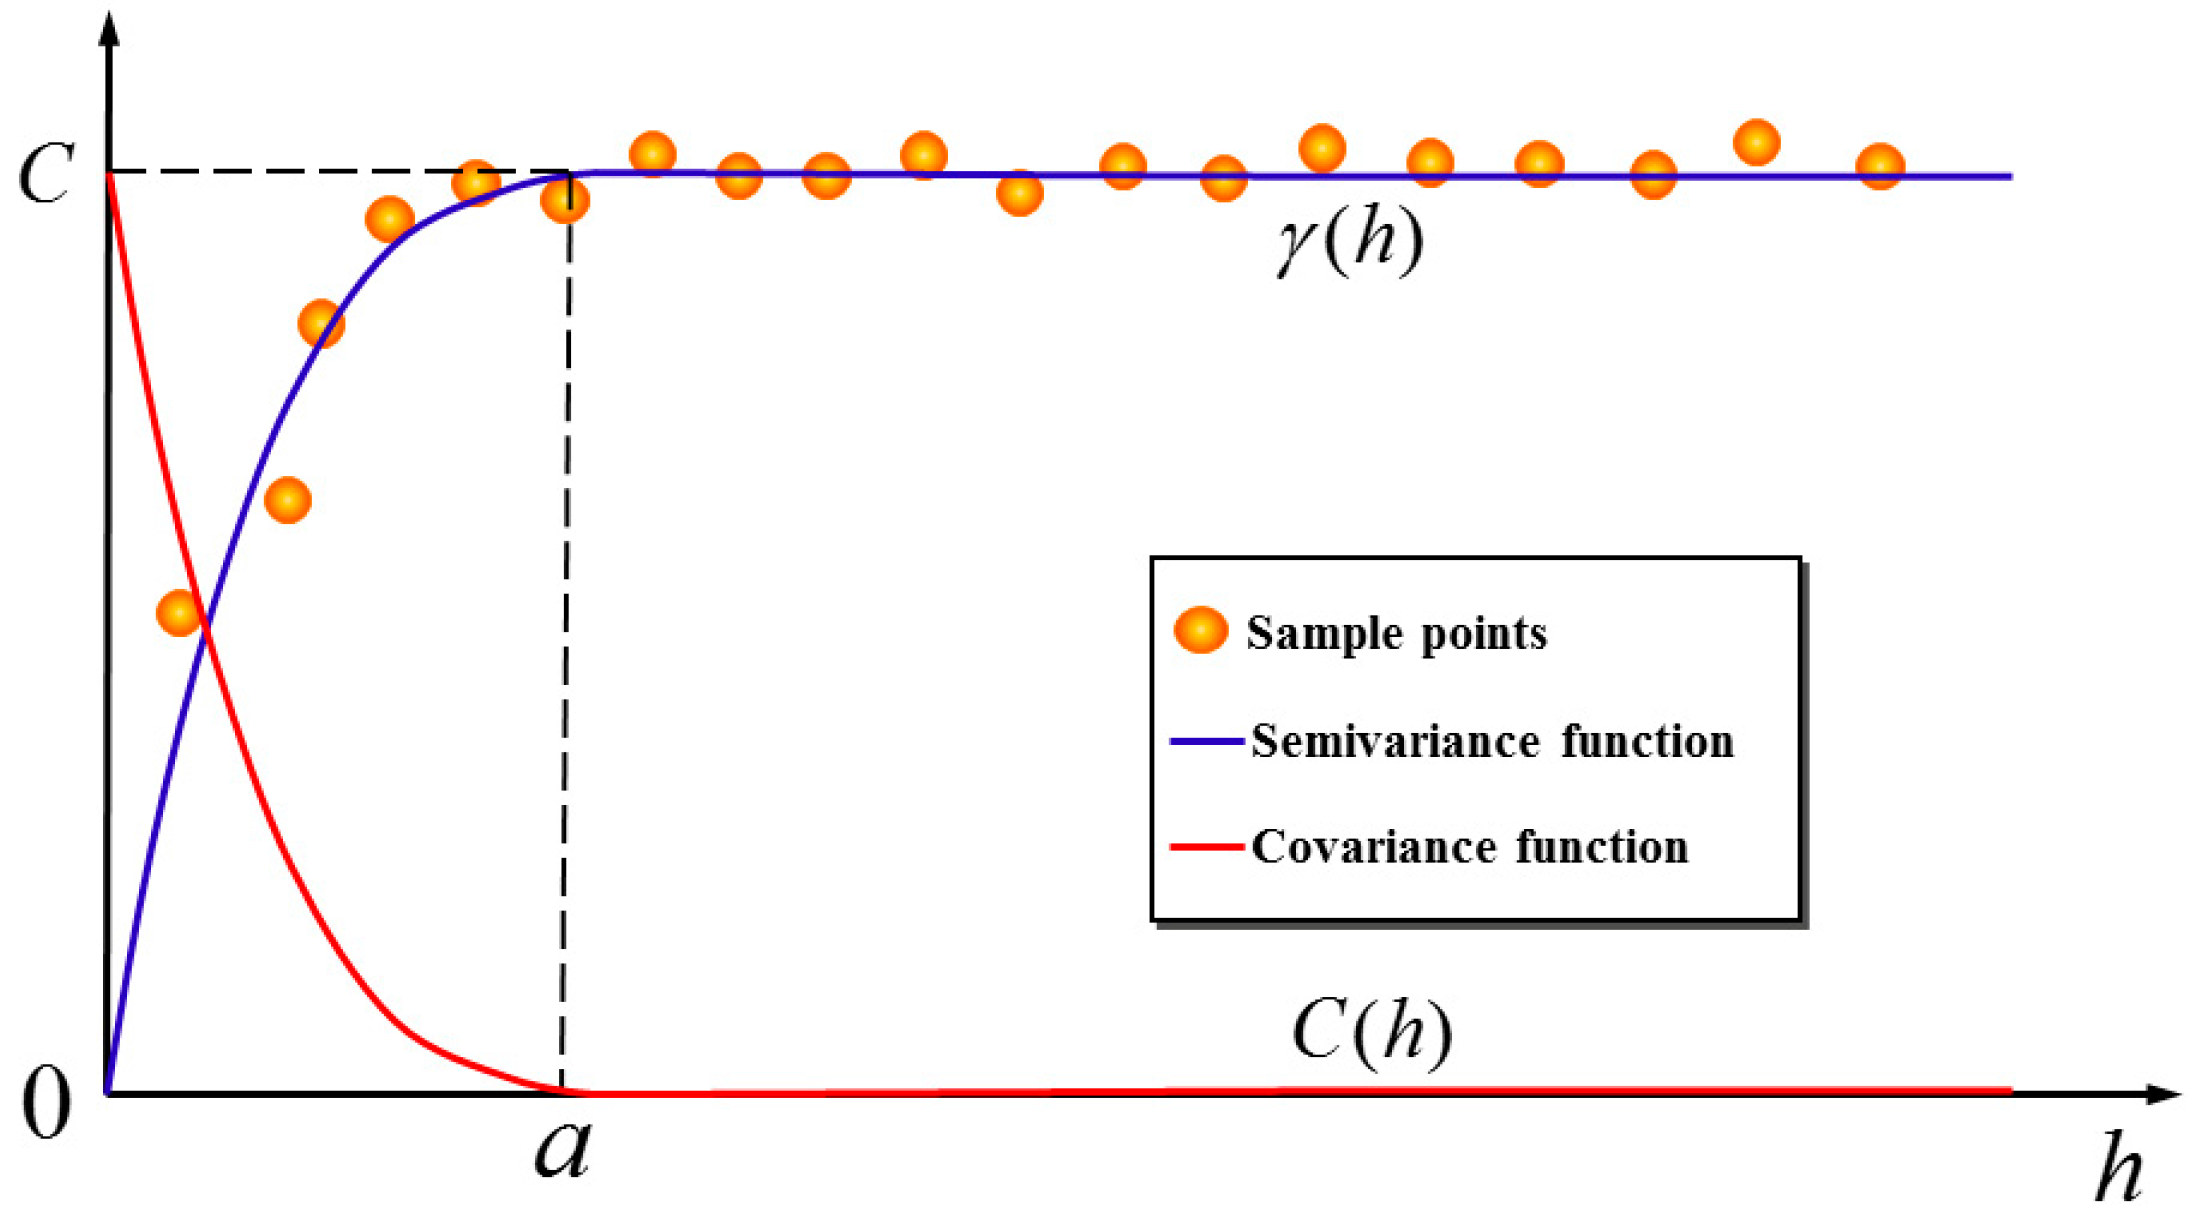
5.3. Analyais for Real-Time Compaction Quality Heterogeneity Using i-GAM

The current evaluation method for compaction quality of earth-rock dam has ignored the inherent inhomogeneity of the evaluation indices within the working face, which may lead to uneven settlement and arch effect of the dam. Based on enough information collected by the RTCM system, i-GAM can help to quantify the inhomogeneity of real-time compacted quality, which can be expressed as:
γ ( h ) = 1 2 E [ Z ( x ) x ( x + h ) ] 2 ,
where γ ( h ) denotes the semivariance function, h represents the lag distance (m), Z(x) and Z(x + h) denotes the evaluation indices collected at distance x and (x + h), respectively. However, due to the difficulty of directly calculating the semivariance, Equation (23) is introduced to obtain them by sample points.
{ γ ( h ) = 1 2 N ( h ) i = 1 N ( h ) [ Z ( x ) Z ( x + h ) ] 2 h = n u m l a g n u m = i n t ( d i s l a g + 0.5 ) + 1 ,
where N ( h ) represents the number of data pairs, lag denotes the lag class distance interval and doesn’t exceed 1/2 of the maximum distance of data pairs (m). num denotes lag class, dis is the actual distance between each data pair (m), and int is the integer function.
The dotted pair data (h, γ ( h ) ) needs to be marked in cartesian coordinates, afterwards the semivariogram can be obtained through curve-fitting as shown in Figure 4. The most commonly used fitting model is the exponential model as Equation (24) [27].
γ ( h ) = C ( 1 e 3 h a ) ,
where C = lim h + γ ( h ) represents the sill, which indicates the maximum difference of evaluation indices in space. a denotes the range, which represents the minimum mean distance to reach the plateau sill. A lower sill and larger range show stronger compaction uniformity and geospatial continuity.
In Reference [27], the coefficient of the semivariogram (Cova) index was proposed to quantify the geospatial heterogeneity of materials. Results show that the Cova index has a close value and trend with the coefficient of variance (Cov) index of material evaluation indices. However, we have deduced that the above two indexes theoretically have the same value, which is elaborated in the Appendix A. Therefore, we can infer that the small difference between Cova and Cov in Reference [27] is caused by the error of curve-fitting. In the demonstration, Equation (25) is obtained.
C = s t d 2 ,
where s t d is the standard deviation of evaluation indices. Therefore, in the process of curve-fitting of semivariance function in this paper, the value of sill C in the exponential model can be predefined rather than being fitted by a mathematical method, which will surely improve the accuracy of the fitting model.

6. Case Study

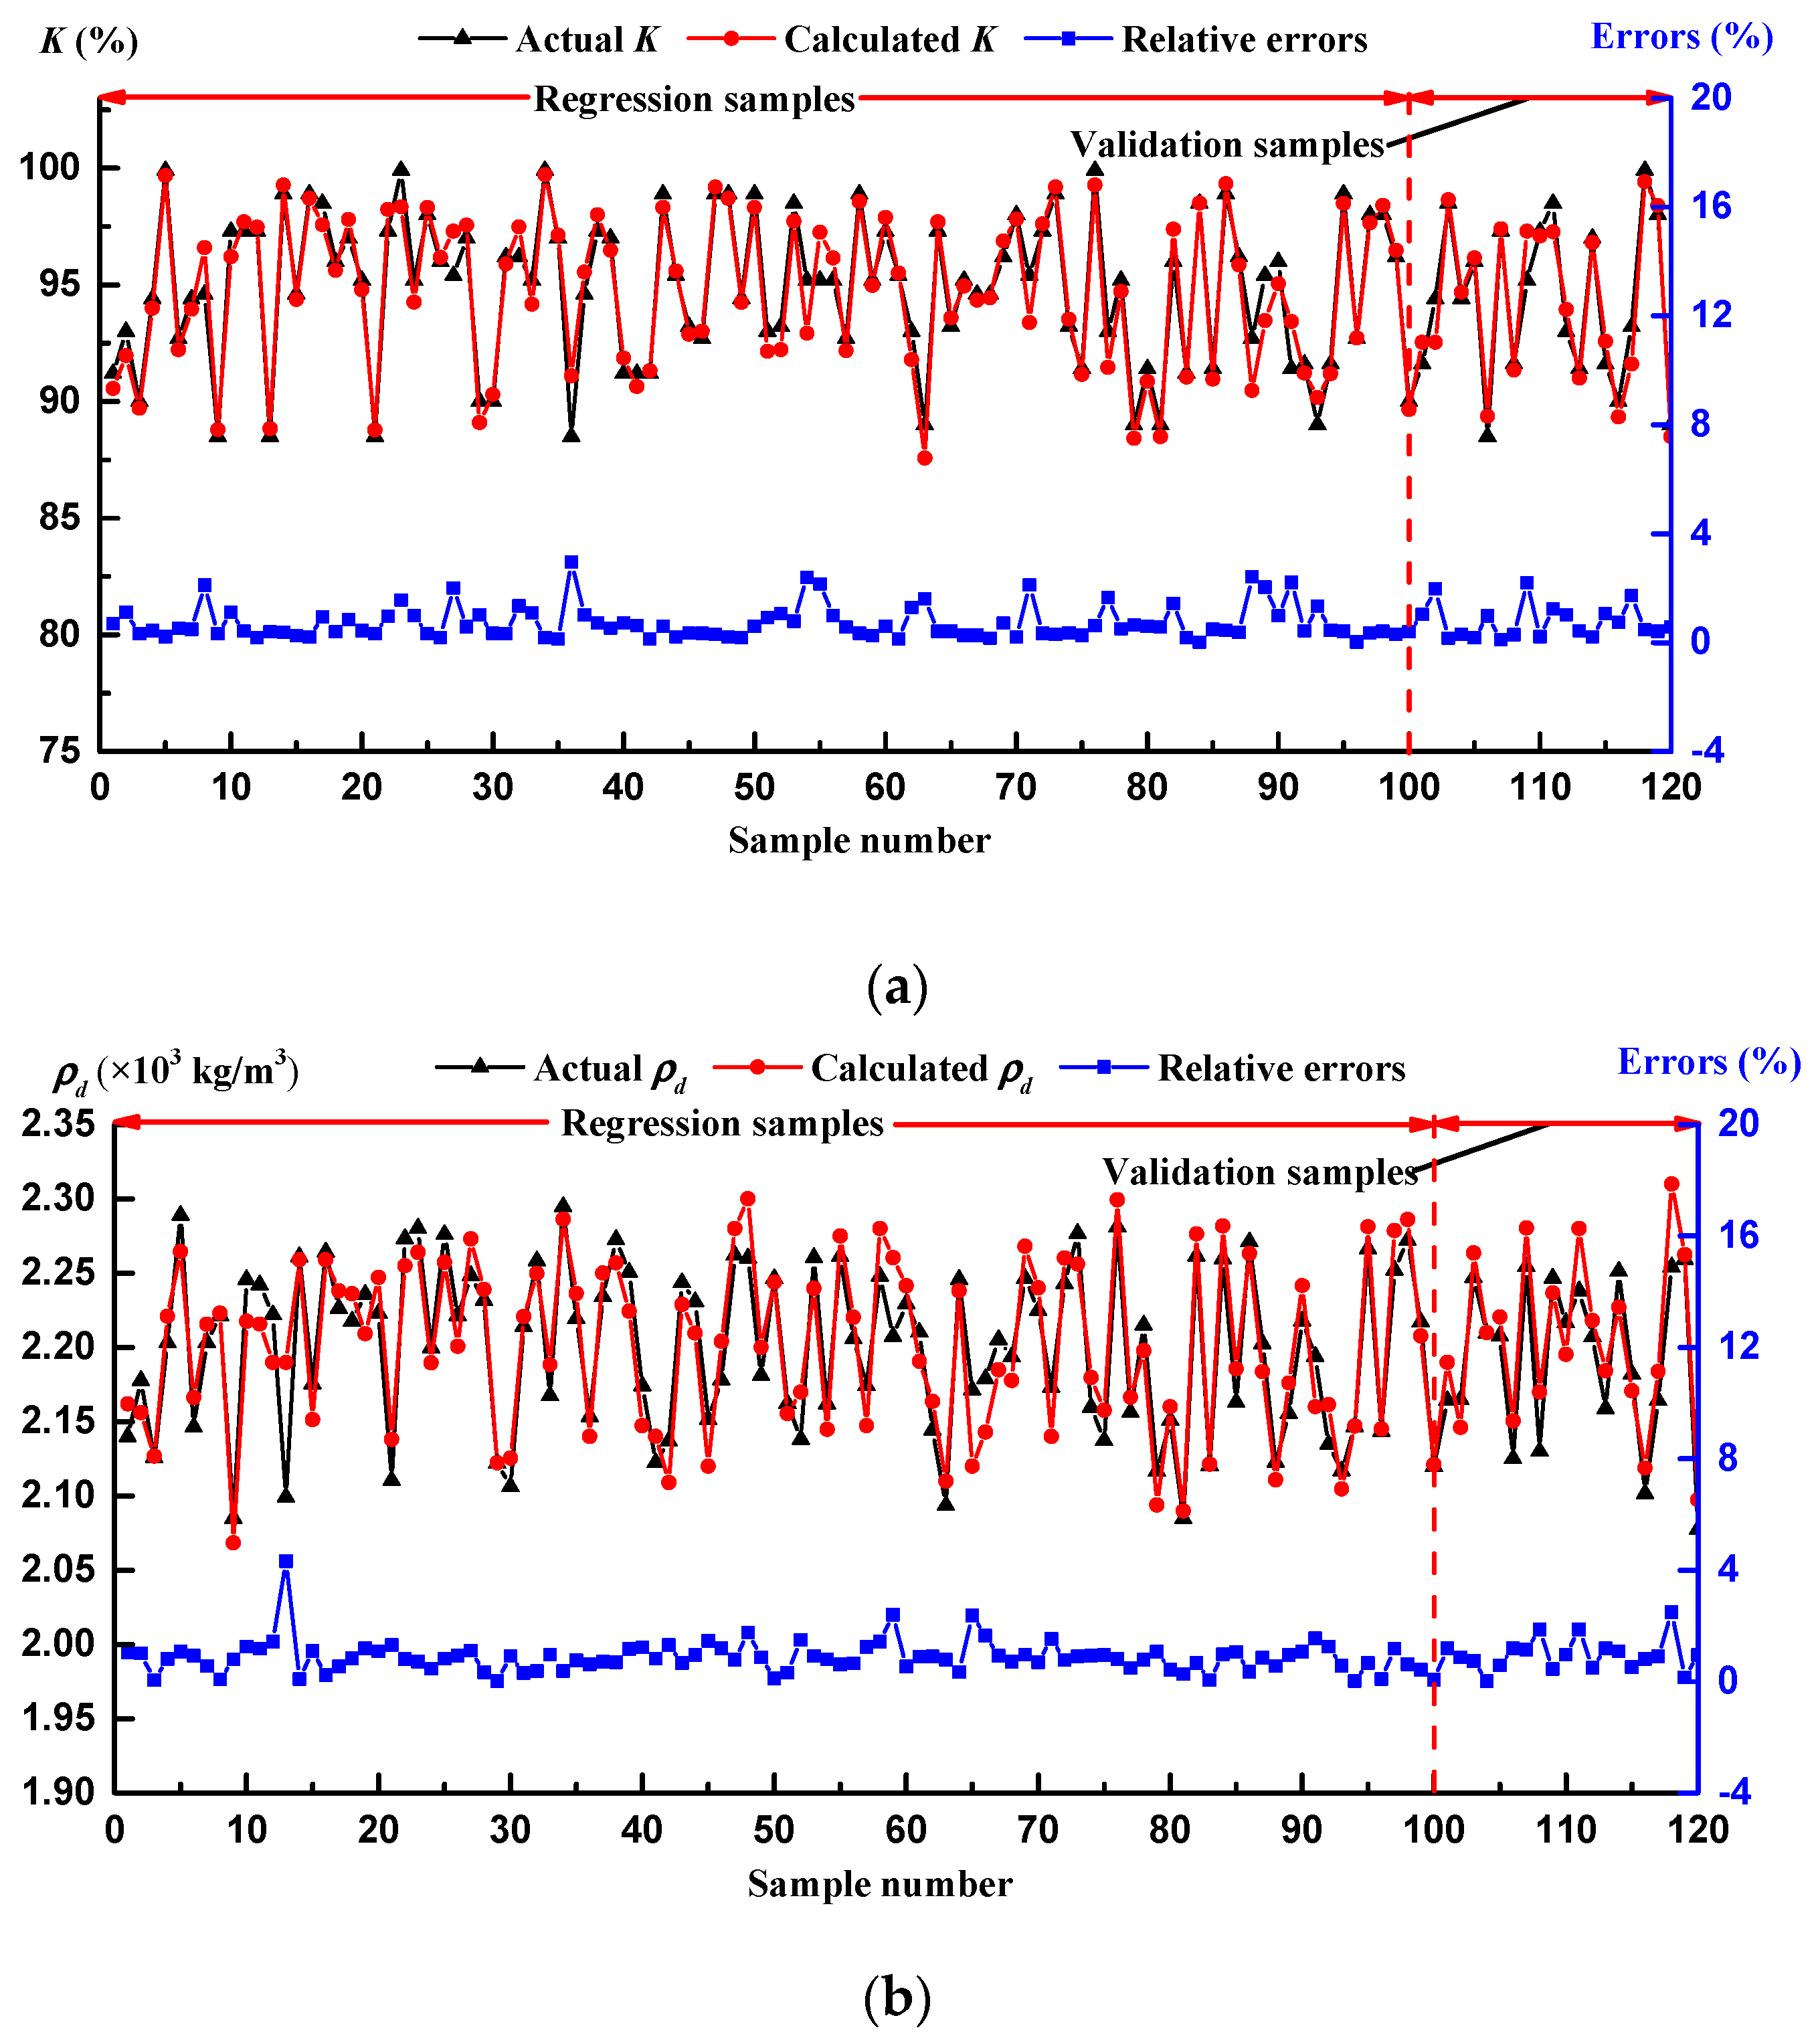
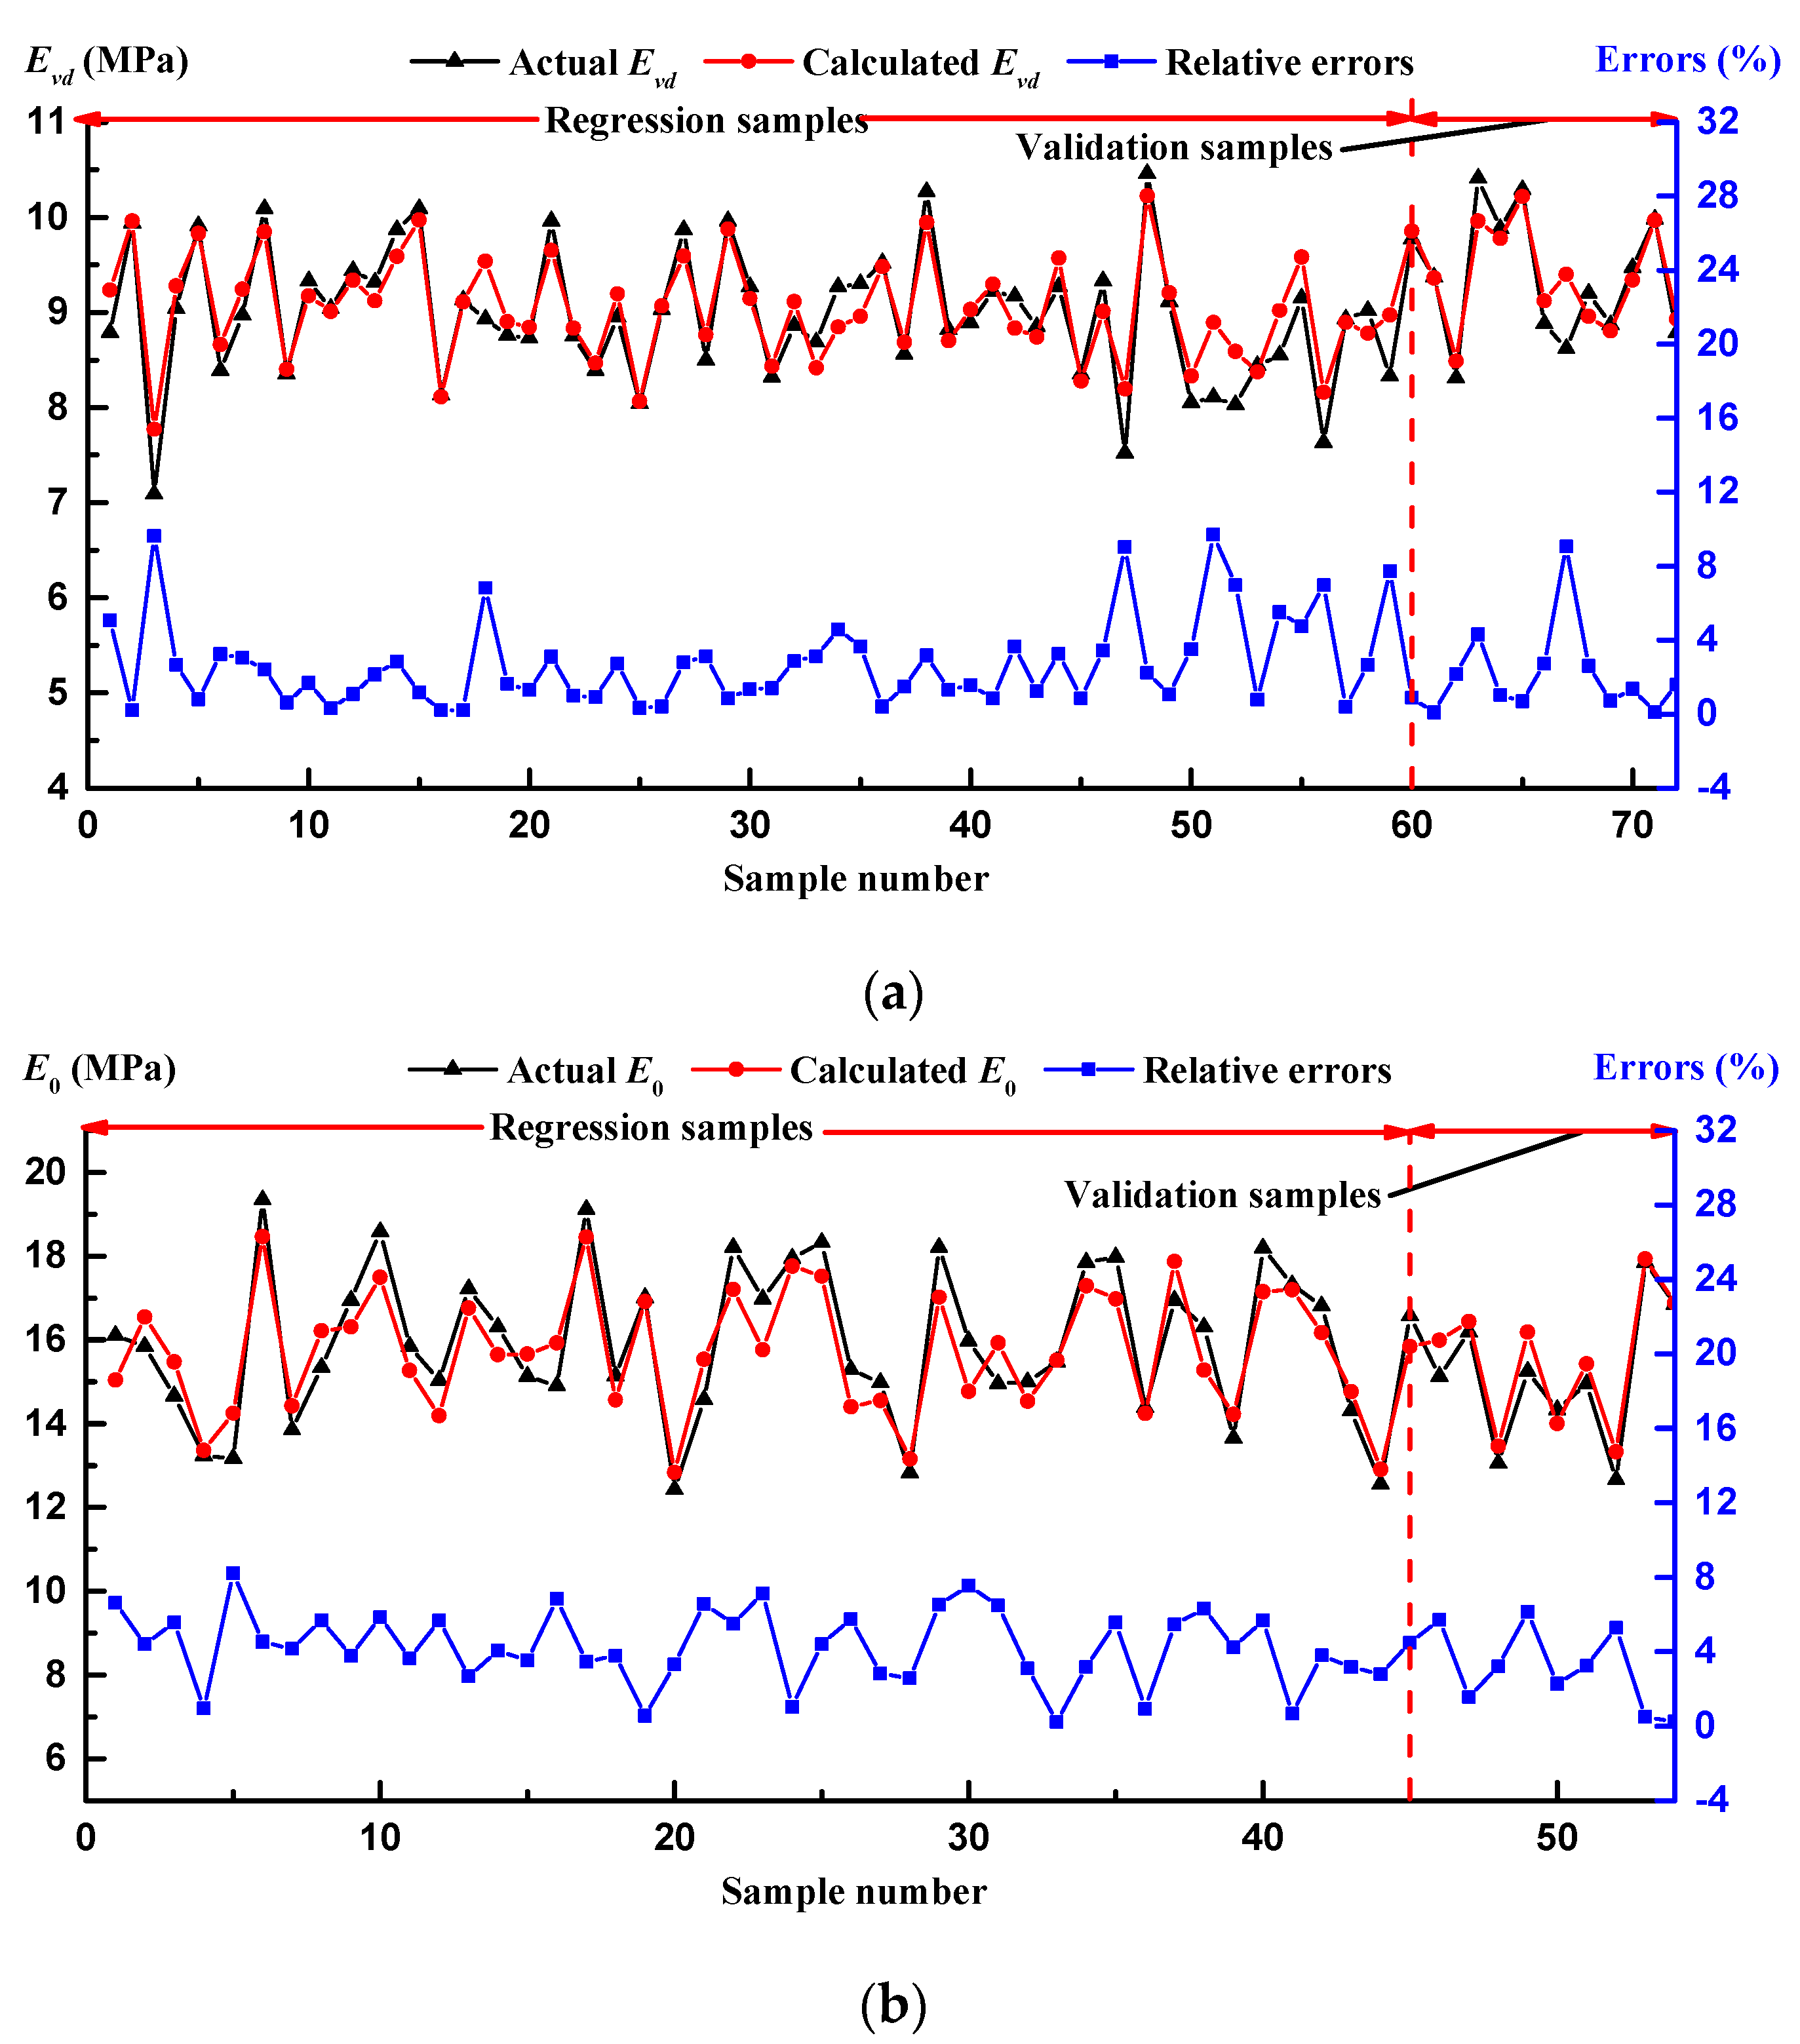
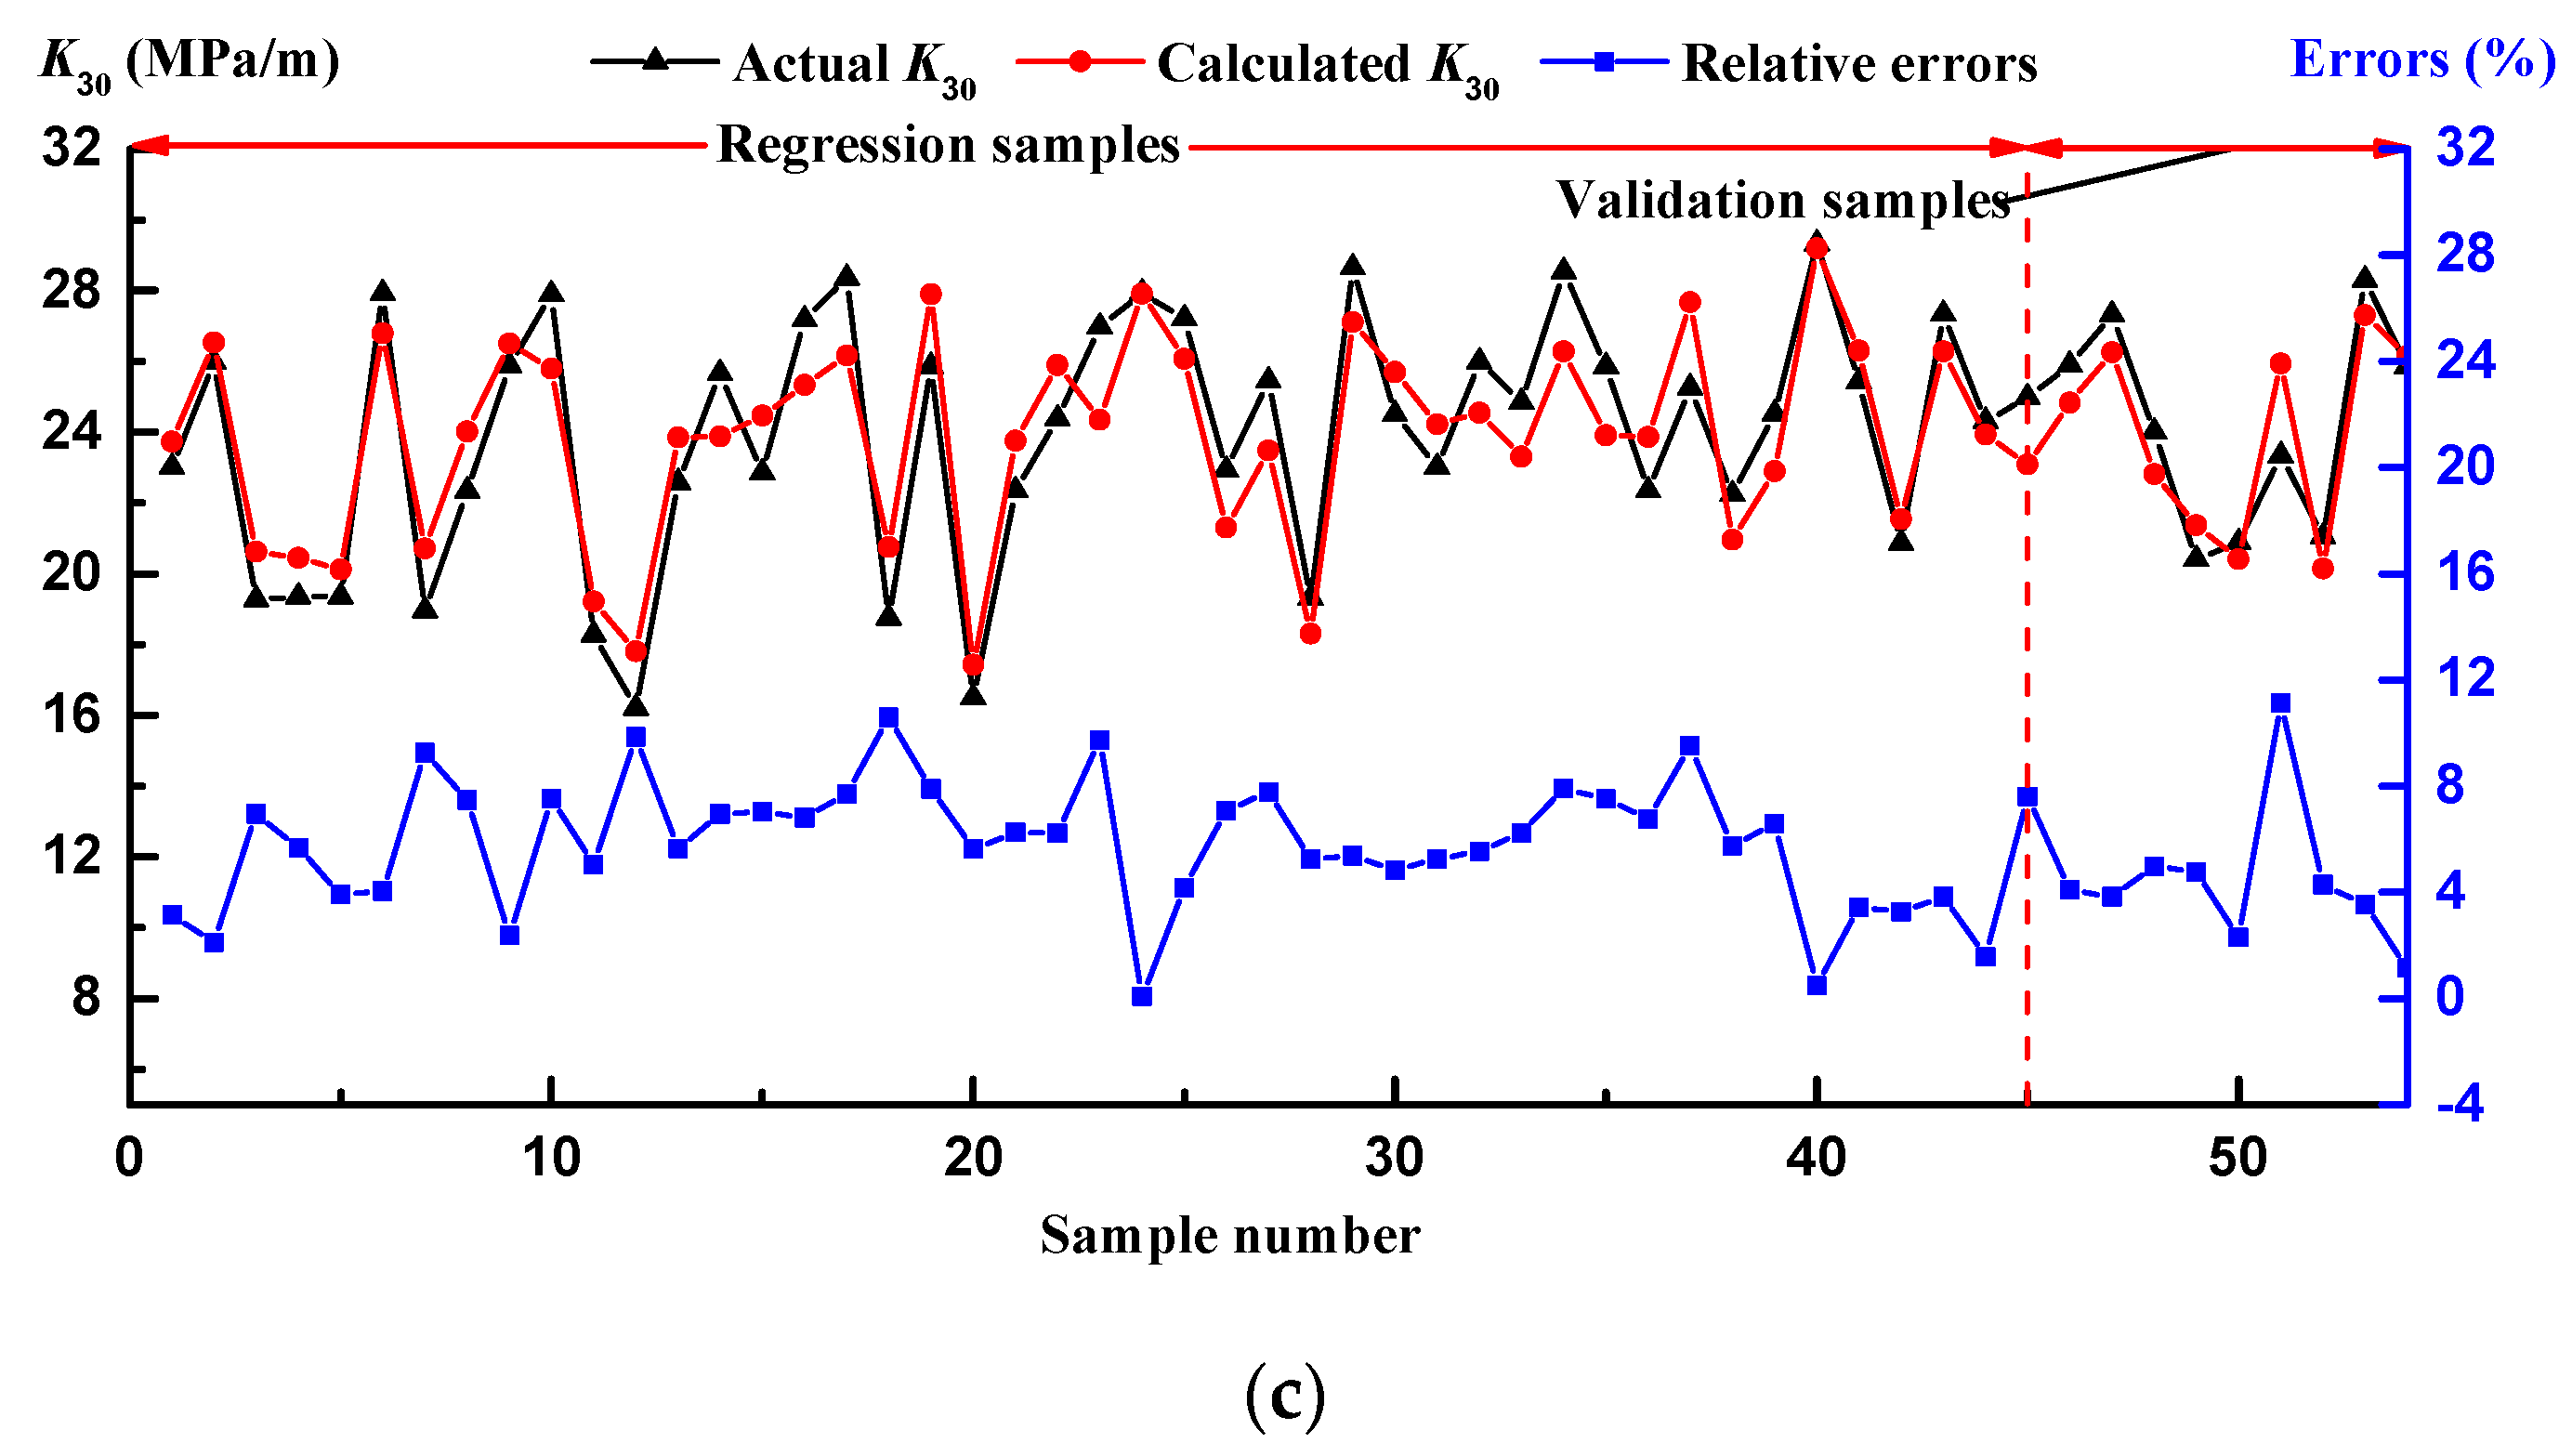
6.1. Prediction Model of Real-Time Physical and Mechanical Indices

The high core-wall rockfill dam of X hydropower station located in Sichuan Province, China, is selected as the case study. The maximum dam height is 295 m which is the third highest earth-rock dam in the world. The RTCM and PDA collection systems are applied here to realize all-weather real-time intelligent control for compaction quality and information collection of material sources and spot tests [6]. The core wall district with gravel-mixed cohesive soil is selected as the research object, which is compacted using ten roller passes with padfoot rollers the vibration frequency of which is 27 Hz and the exciting force can reach 416 kN. The physical indices (i.e., K and ρ d ) are obtained by the random spot tests. To minimize the effect of material disturbance, a slight location offset is adopted. One hundred samples are applied to establish the prediction model of physical indices using SVR with CFA, and 20 additional samples are used for cross validation. The comparison between the actual values and measured values is shown in Figure 5. The linear correlation coefficient (R) [Equation (26)] is adopted as the accuracy criteria.
R = N y y y y N y 2 ( y ) 2 N ( y ) 2 ( y ) 2 ,
where y is the actual value, y is the calculated value, and N is the data bulk. In Figure 5a, the maximum relative absolute error of K is 2.94%, and the coefficient R reaches 0.977; in Figure 5b, the maximum relative absolute error of ρ d is 4.32%, and the coefficient R reaches 0.917, which denotes the prediction model performs well.
Like the prediction of physical indices, 105 samples are applied to establish the prediction model of mechanical indices, and 21 additional samples are used for cross validation. In Figure 6a, the maximum relative absolute error of E v d is 9.69%, and the coefficient R reaches 0.916; in Figure 6b, the maximum relative absolute error of E 0 is 8.22%, and the coefficient R reaches 0.921; in Figure 6c, the maximum relative absolute error of K 30 is 11.13%, and the coefficient R reaches 0.899, which indicates the availability of the prediction model. Referring to the different maximum relative absolute errors in Figure 5 and Figure 6, we find the prediction accuracy of the mechanical indices is lower than that of the physical indices. The reason may be that the unevenness of the working face leads to inadequate contact between the roller’s drum and the dam materials, which makes the drum vibration acceleration create a bigger noise than the compaction and material parameters. It is important to reduce the noise by combining wavelet analysis and an intelligent algorithm to further improve the prediction accuracy in the future [35].

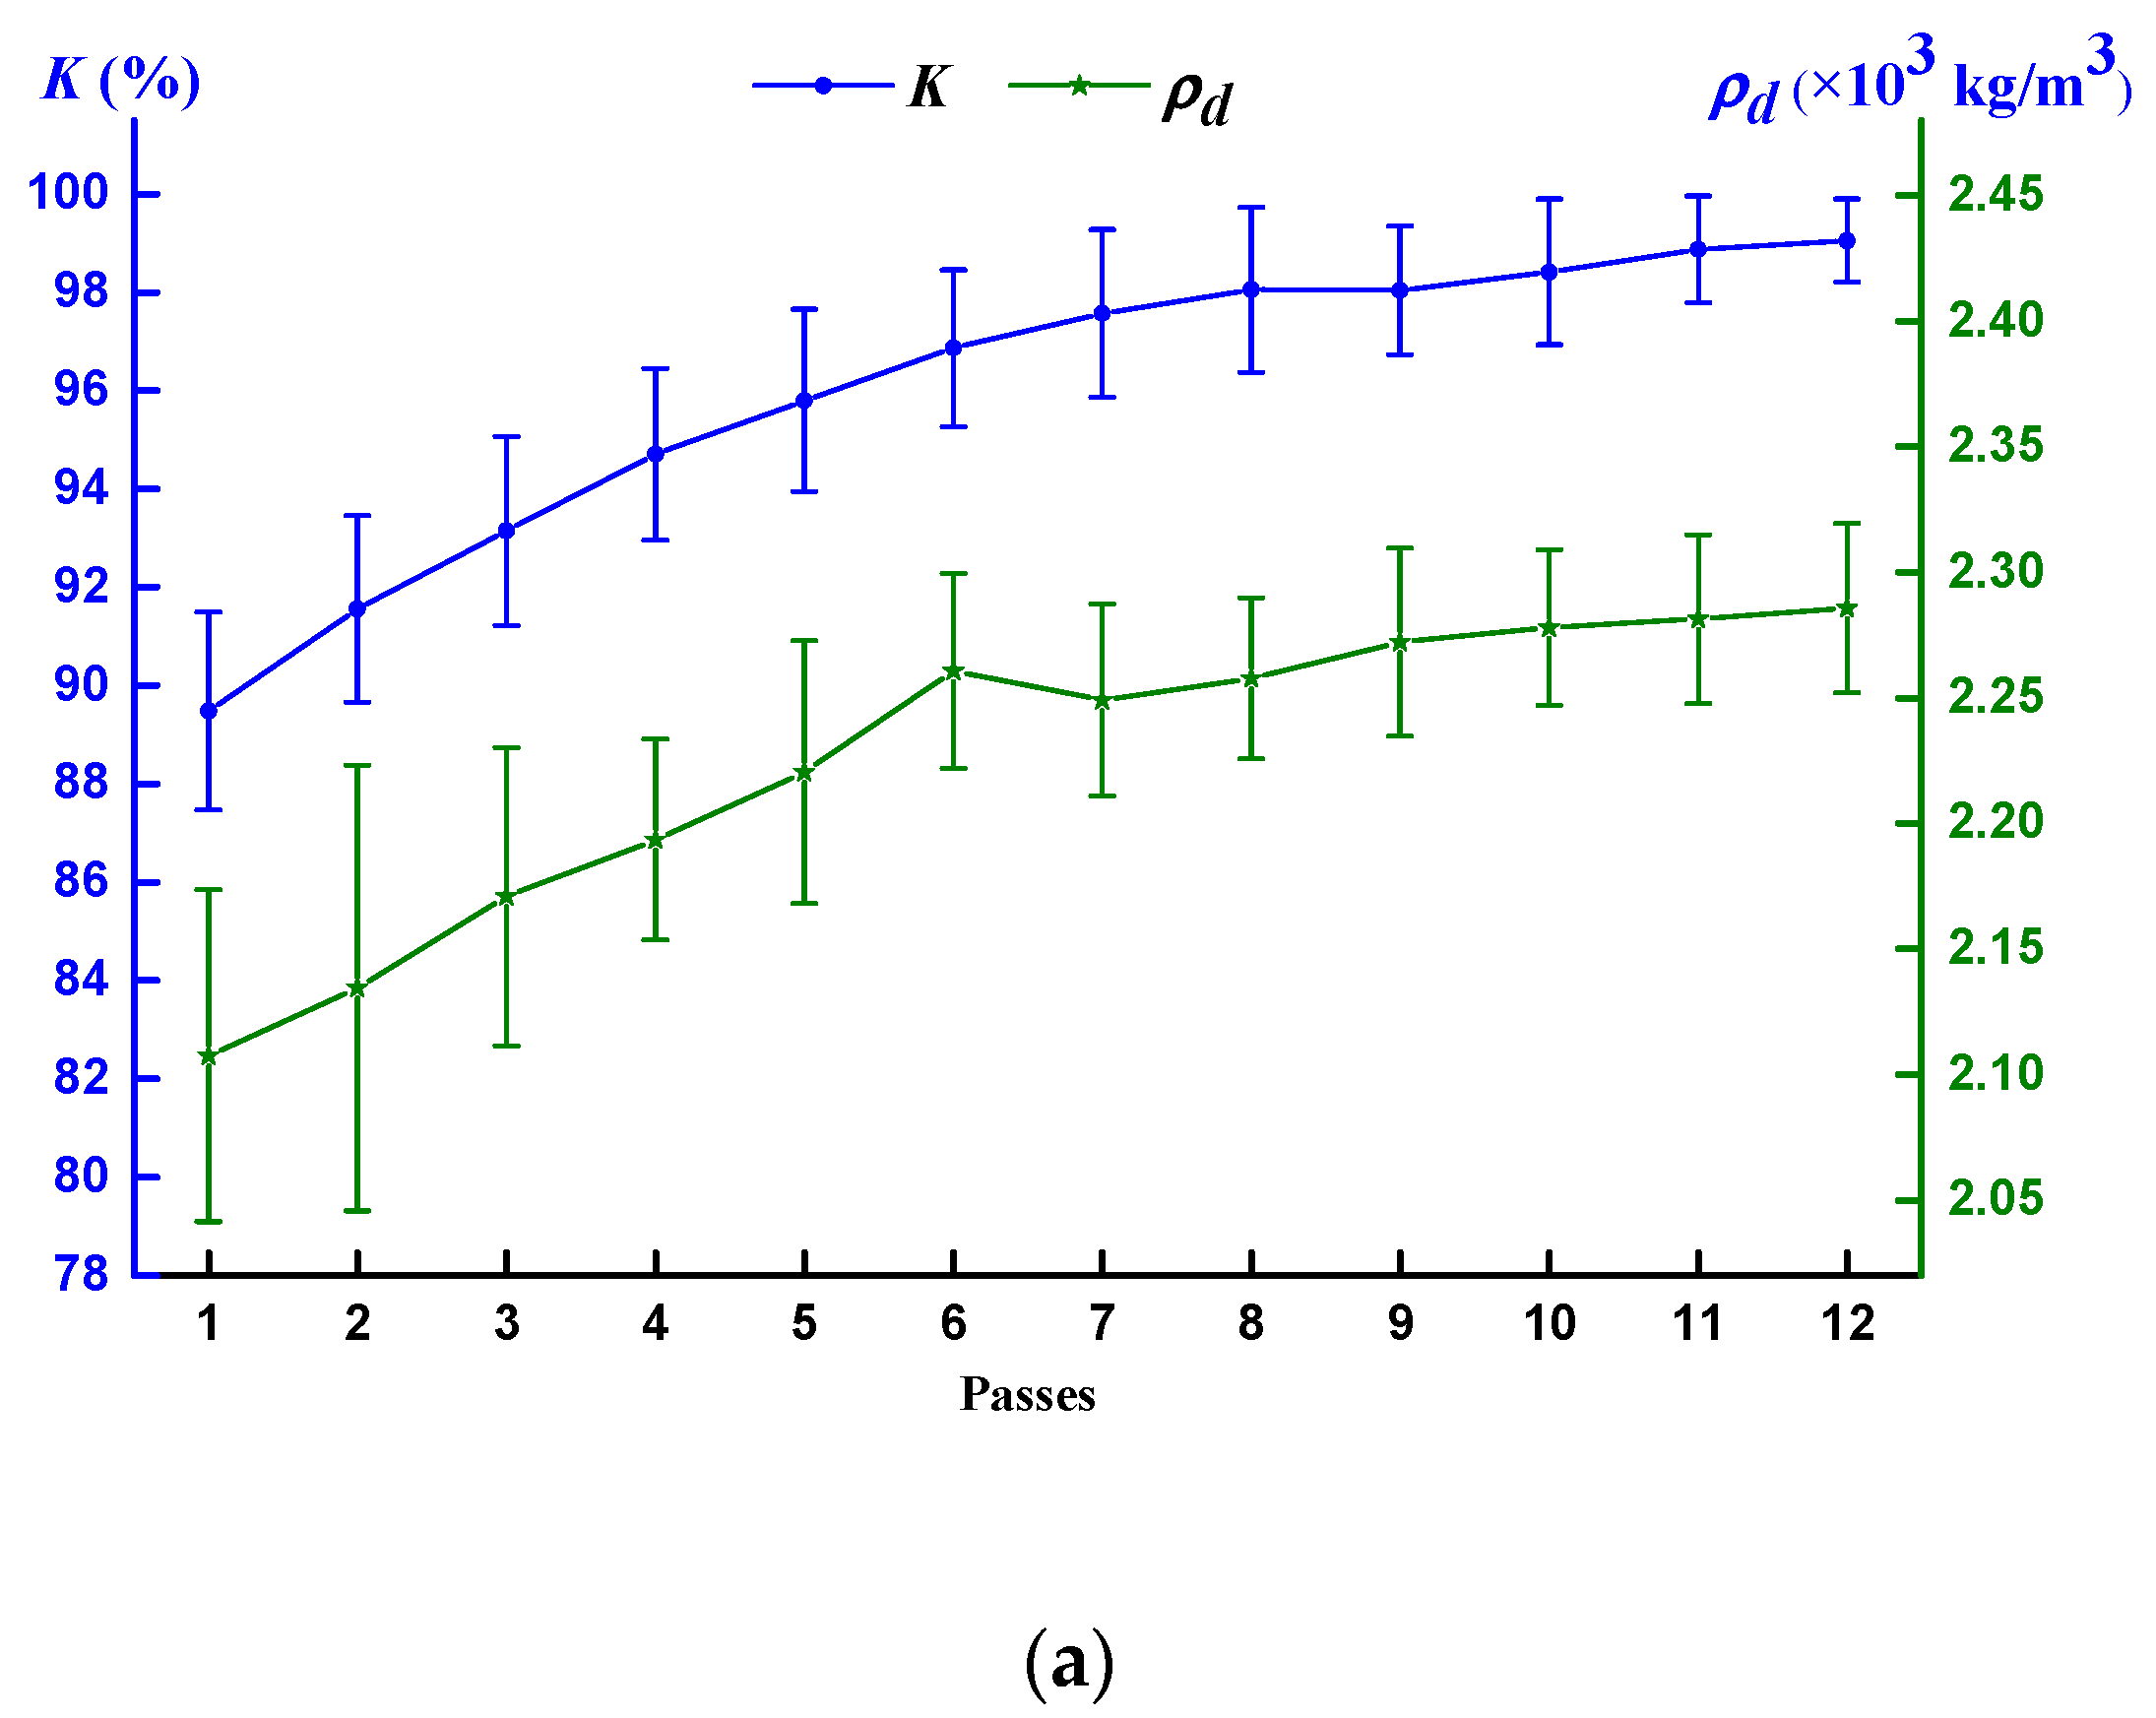
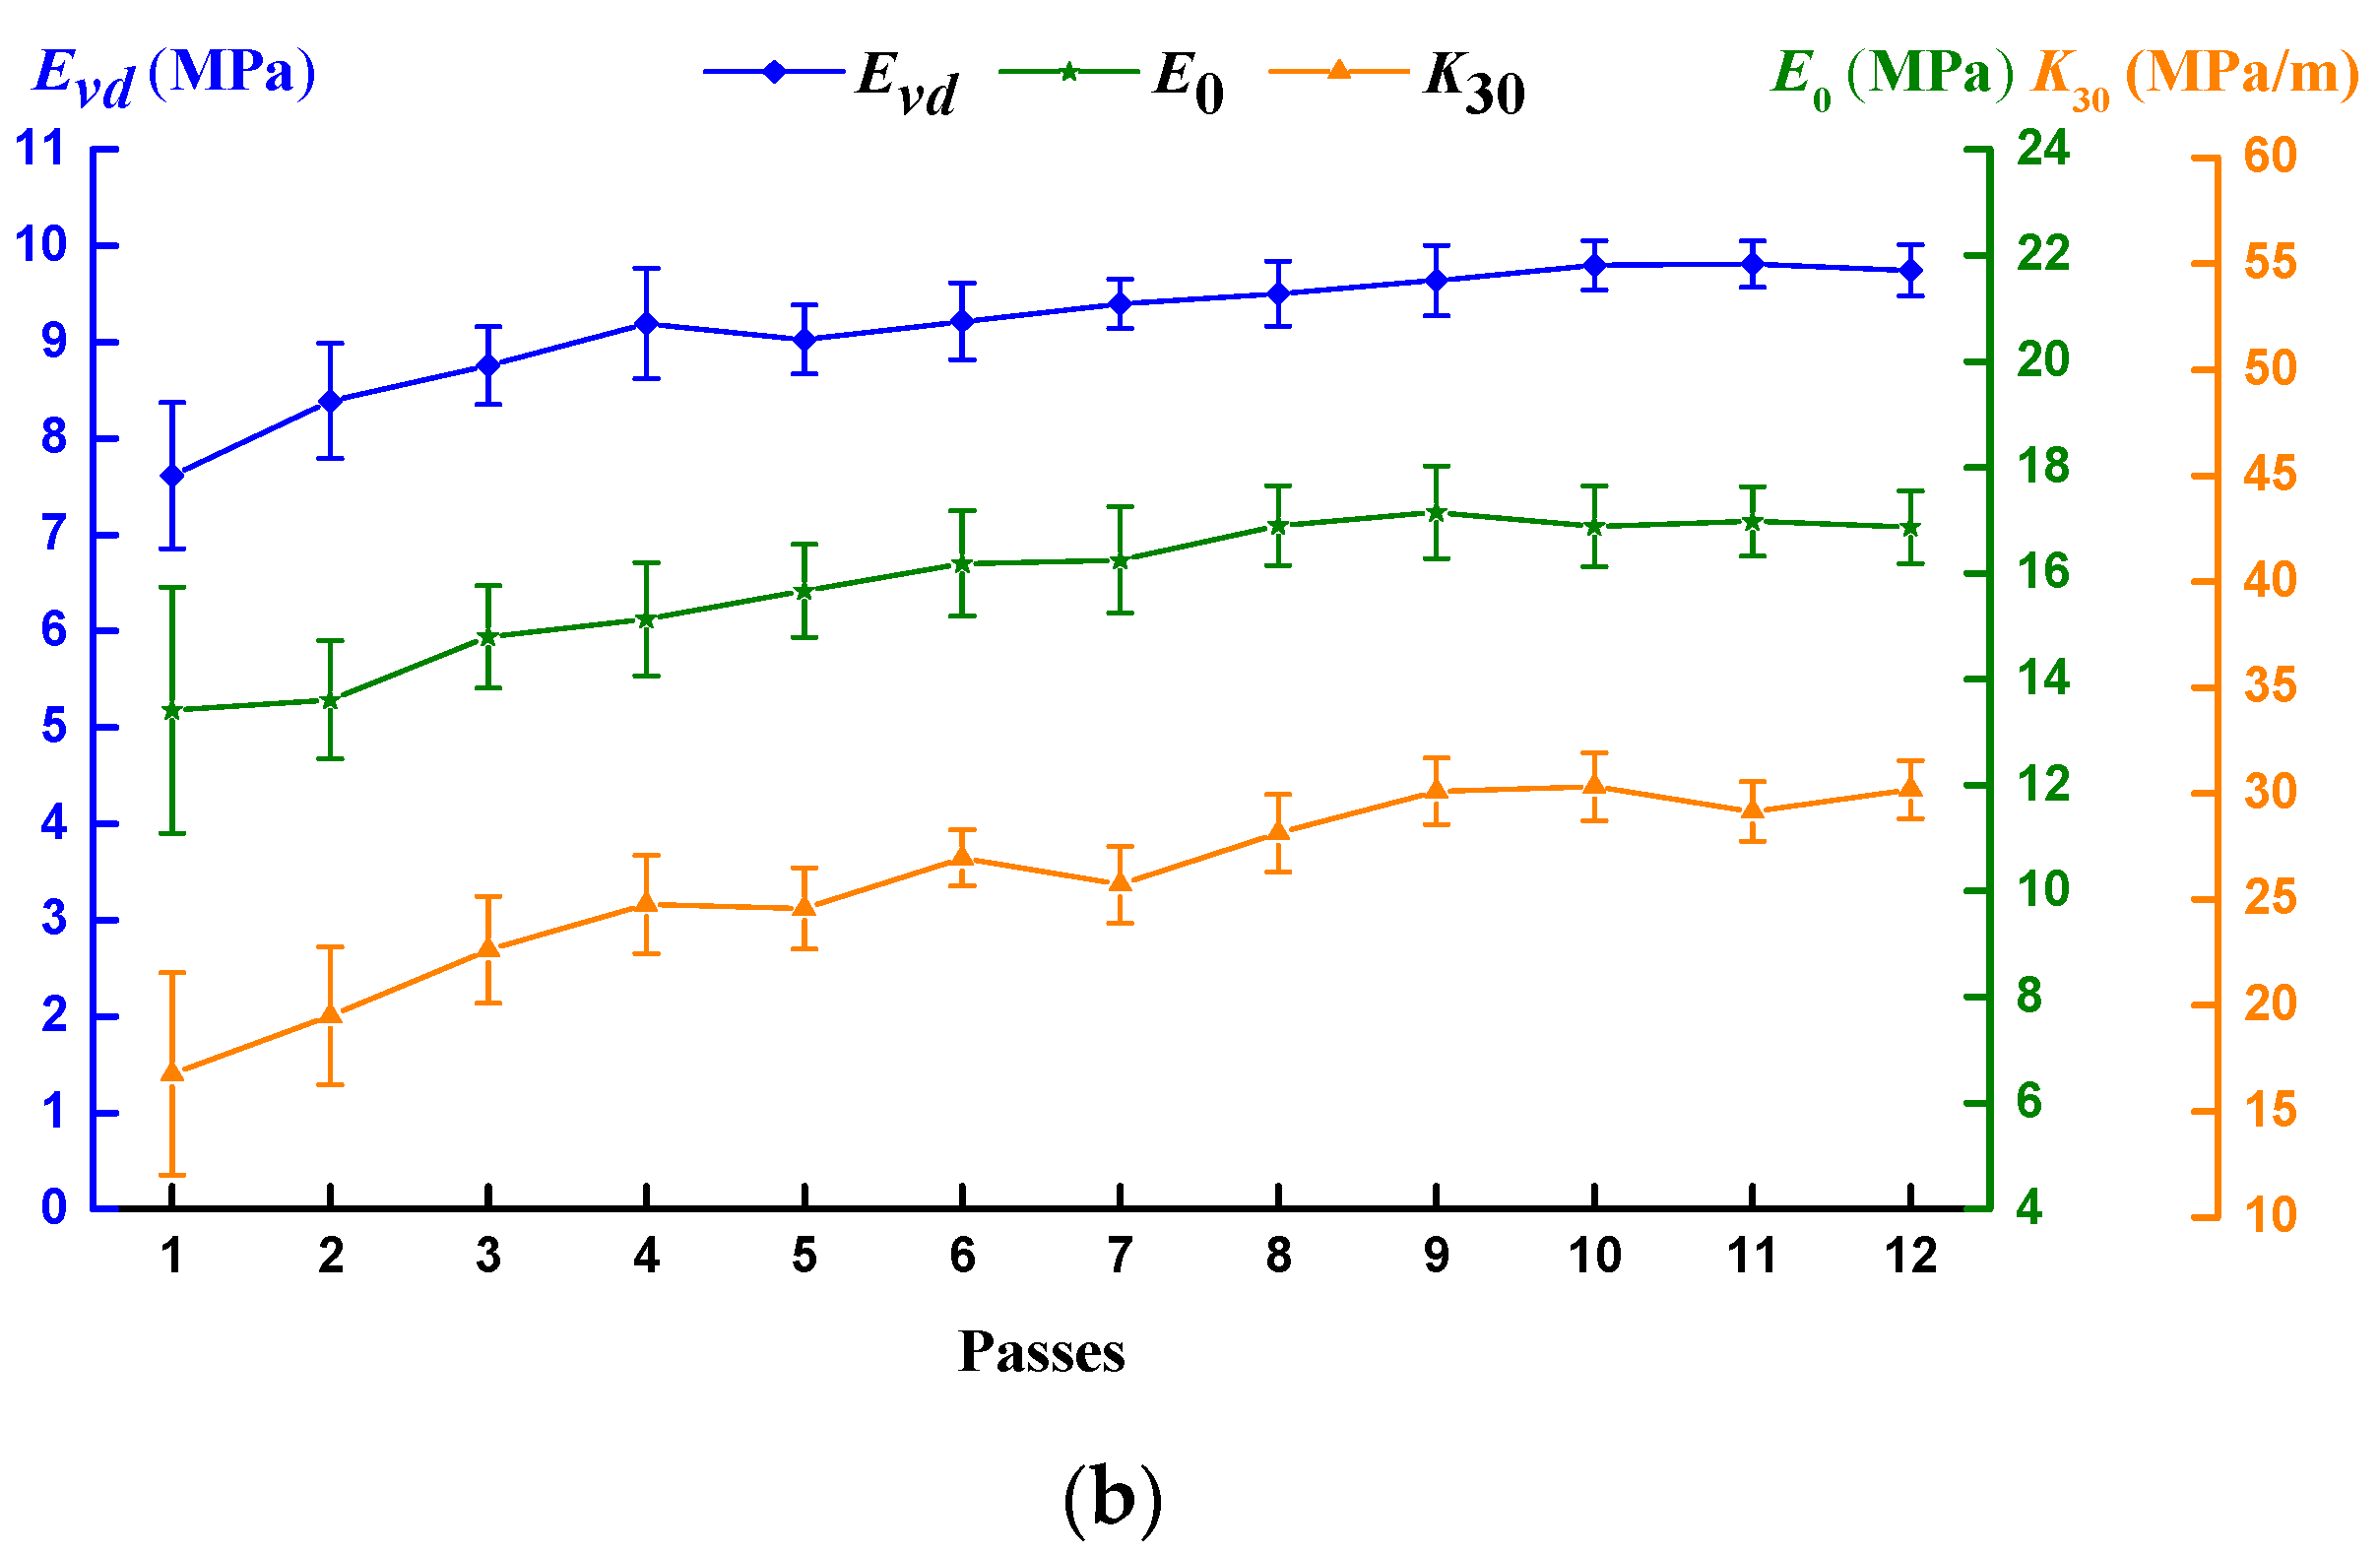
6.2. Rolling Compaction Calibration Test

To establish the quality-level classification standard for the evaluation indices, referring to Reference [26], a rolling compaction calibration test is conducted prior to helping establish the rating matrix. The target values of physical and mechanical indices are produced from these calibration strips as references for compaction quality control during the earth-rock dam construction.
To execute the test, one working face in the core wall was selected. According to the specifications [3], the compaction parameters (i.e., Ns, Np, Nv and Nt) and the material parameters (i.e., Mg and Mm) should be prudently guaranteed to meet the construction requirements.
Through the calibration test, the relationship of compaction passes with the physical and mechanical indices can be obtained as shown in Figure 7. In Figure 7a, the mean K increases from 89.48 to 99.90 (%), and the std decreases from 2.01 to 0.85 (%); the mean ρ d increases from 2.10 to 2.29 ( × 10 3 kg / m 3 ), and the std decreases from 0.066 to 0.033 ( × 10 3 kg / m 3 ). In Figure 7b, the mean E v d increases from 7.62 to 9.74 (MPa), and the std decreases from 0.759 to 0.265 (MPa); the mean E 0 increases from 13.42 to 16.87 (MPa), and the std decreases from 2.32 to 0.68 (MPa); the mean K 30 increases from 16.77 to 30.20 (MPa/m), and the std decreases from 4.78 to 1.37 (MPa/m). When compaction passes reaches ten, the physical and mechanical indices almost reach maximum and tend to be stable, thus they are selected as the basis for formulating the scoring criterion.
Referring to Reference [22], the compaction quality in earth-rock dam construction can be divided into five classifications: good, fine, ordinary, poor and bad. The quality-level classification standard in the core wall can be obtained with an expert grading method as shown in Table 3, and the compaction quality rating of the calibration area is good, which lays a foundation for the following comprehensive evaluation of compaction quality.

6.3. Comprehensive Evaluation of Compaction Quality

The test area for conducting the comprehensive evaluation consists of two blocks of 8 m × 40 m in the core wall district. All strips are approximately oriented in the north-south direction.

6.3.1. Real-Time Physical and Mechanical Indices Analysis

We can obtain the real-time discrete physical and mechanical indices using the prediction model described in Section 6.1. Based on Kriging interpolation [4], the physical and mechanical indices of the selected working face with full coverage can be acquired. The contour maps of these indices in the two test blocks are presented in Figure 8a–e. The results indicate that the mean physical and mechanical indices of Block 1 are larger than those of Block 2, which means better compaction quality of Block 1. Moreover, we can get the semivariogram of each index as shown in Figure 9a–e. Taking the compactness K, for example, the sill C of Block 2 is 2.19 times larger than Block 1, and the range of Block 2 is 21% lower than that of Block 1. Similar phenomena are found in the other indices, which indicate the greater compaction uniformity and lower geospatial variability of Block 1. Besides, the similar trends indicate there is close correlation between these indices. It is noteworthy that the mean range a of E v d is 2.303, which is much lower than the other indices. It can be attributed to the difference between effective depth and the test principle of different measuring methods.

6.3.2. Real-Time Hybrid Evaluation of Compaction Quality

The main process of real-time hybrid evaluation is:
(1)
Construct the interval comparison matrices
Through pairwise comparison, the interval comparison matrices P I and A I in the Equations (14) and (15) can be obtained as:
P I = P 1 P 2 P 1 P 2 [ 1 [ 5 , 7 ] [ 1 / 7 , 1 / 5 ] 1 ]
A 1 I = A 1 A 3 A 1 A 3 [ 1 [ 5 , 7 ] [ 1 / 7 , 1 / 5 ] 1 ]
A 2 I = A 4 A 5 A 6 A 4 A 5 A 6 [ 1 [ 1 / 5 , 1 / 2 ] [ 1 / 5 , 1 / 4 ] [ 2 , 5 ] 1 [ 1 / 3 , 1 / 2 ] [ 4 , 5 ] [ 2 , 3 ] 1 ]
(2)
Calculate the interval weight vectors
The interval weight vectors can be obtained as:
p I = [ p ¯ , p ¯ + ] = [ 0.2432 , 0.2781 0.6877 , 0.7865 ]
a 1 I = [ a ¯ 1 , a ¯ 1 + ] = [ 0.7609 , 0.8272 0.1965 , 0.2136 ]
a 2 I = [ a ¯ 2 , a ¯ 2 + ] = [ 0.1183 , 0.1266 0.2537 , 0.2905 0.5791 , 0.6293 ]
(3)
Calculate the interval total weight vectors
After the consistency check, the interval total weight vectors can be calculated by Equation (20) as listed in Table 4.
After the above calculation, the evaluation index H C I I can be obtained in real-time by Equation (21).

6.3.3. Comprehensive Evaluation Results

For the index H C I I , the median of the interval number is adopted as the ultimate evaluation criterion. Based on the real-time calculated HCI and the Kriging interpolation, the contour map of HCI can be obtained as shown in Figure 8f. The mean HCI of Block 1 is 44.07, and that of Block 2 is 40.16. It indicates that the compaction quality of Block 1 is better than Block 2 with consideration of all the physical and mechanical indices, which is consistent with the individual physical and mechanical index evaluation. Moreover, the HCI takes both the physical and mechanical indices into consideration, so it is more synthetic than the individual index. For example, for Zone X marked in Figure 8, we can judge from the contour maps that K 30 is not that great, but K, ρ d , E v d and E 0 are visibly larger than those of the adjacent area. This shows that the relationship between indices is nondeterministic, and hybrid evaluation for these indices is necessary. Zone Y marked in Figure 8f shows a compaction weak area and needs to be recompacted. To compare with the i-AHP method, the traditional AHP method is utilized and the mean HCI of each block is 44.12 and 40.28, respectively. The results are very close to those of the i-AHP method and indicate that the two methods have high consistency. However, the i-AHP method takes both the subjectivity and uncertainty into account, and the important degree is employed for the importance comparison. Moreover, the i-AHP method transforms the uncertainty problem into a determination problem and simplifies the calculation process. Furthermore, the i-AHP method can obtain the interval HCI. For any two points A and B in the working face, when the interval HCI overlaps with each other, the compaction quality at Point A is not necessarily better than that at Point B even if the mean of the former is greater than the latter. Considering the repetitive region of the interval makes it possible for Point B to be better than A when considering the uncertainty in construction, which avoids the arbitrariness of the tradition AHP.
The semivariograms of HCI for each block are as shown in Figure 9f. The sill C is 17.45 in Block 1 and is 37.40 in Block 2. The range a is 4.012 in Block 1 and is 3.880 in Block 2. These indicate the greater compaction uniformity and geospatial continuity of Block 1 when taking both the physical and mechanical indices into account. Through the analysis of the rolling compaction calibration test and referring to Reference [26], a 3.8 and C 30 are determined as the eligibility criteria for the compaction homogeneity for HCI.
Based on the above study, the compaction quality report of a randomly selected working face can be obtained as shown in Figure 10.

6.4. Discussion

To demonstrate the feasibility and advantages of the proposed method, the proposed index HCI is compared with the other individual index, and the results of the i-AHP method are compared with those of the traditional AHP method. Besides, i-GAM is developed to analyze the heterogeneity of HCI. The discussion can be summarized as follows:
(1)
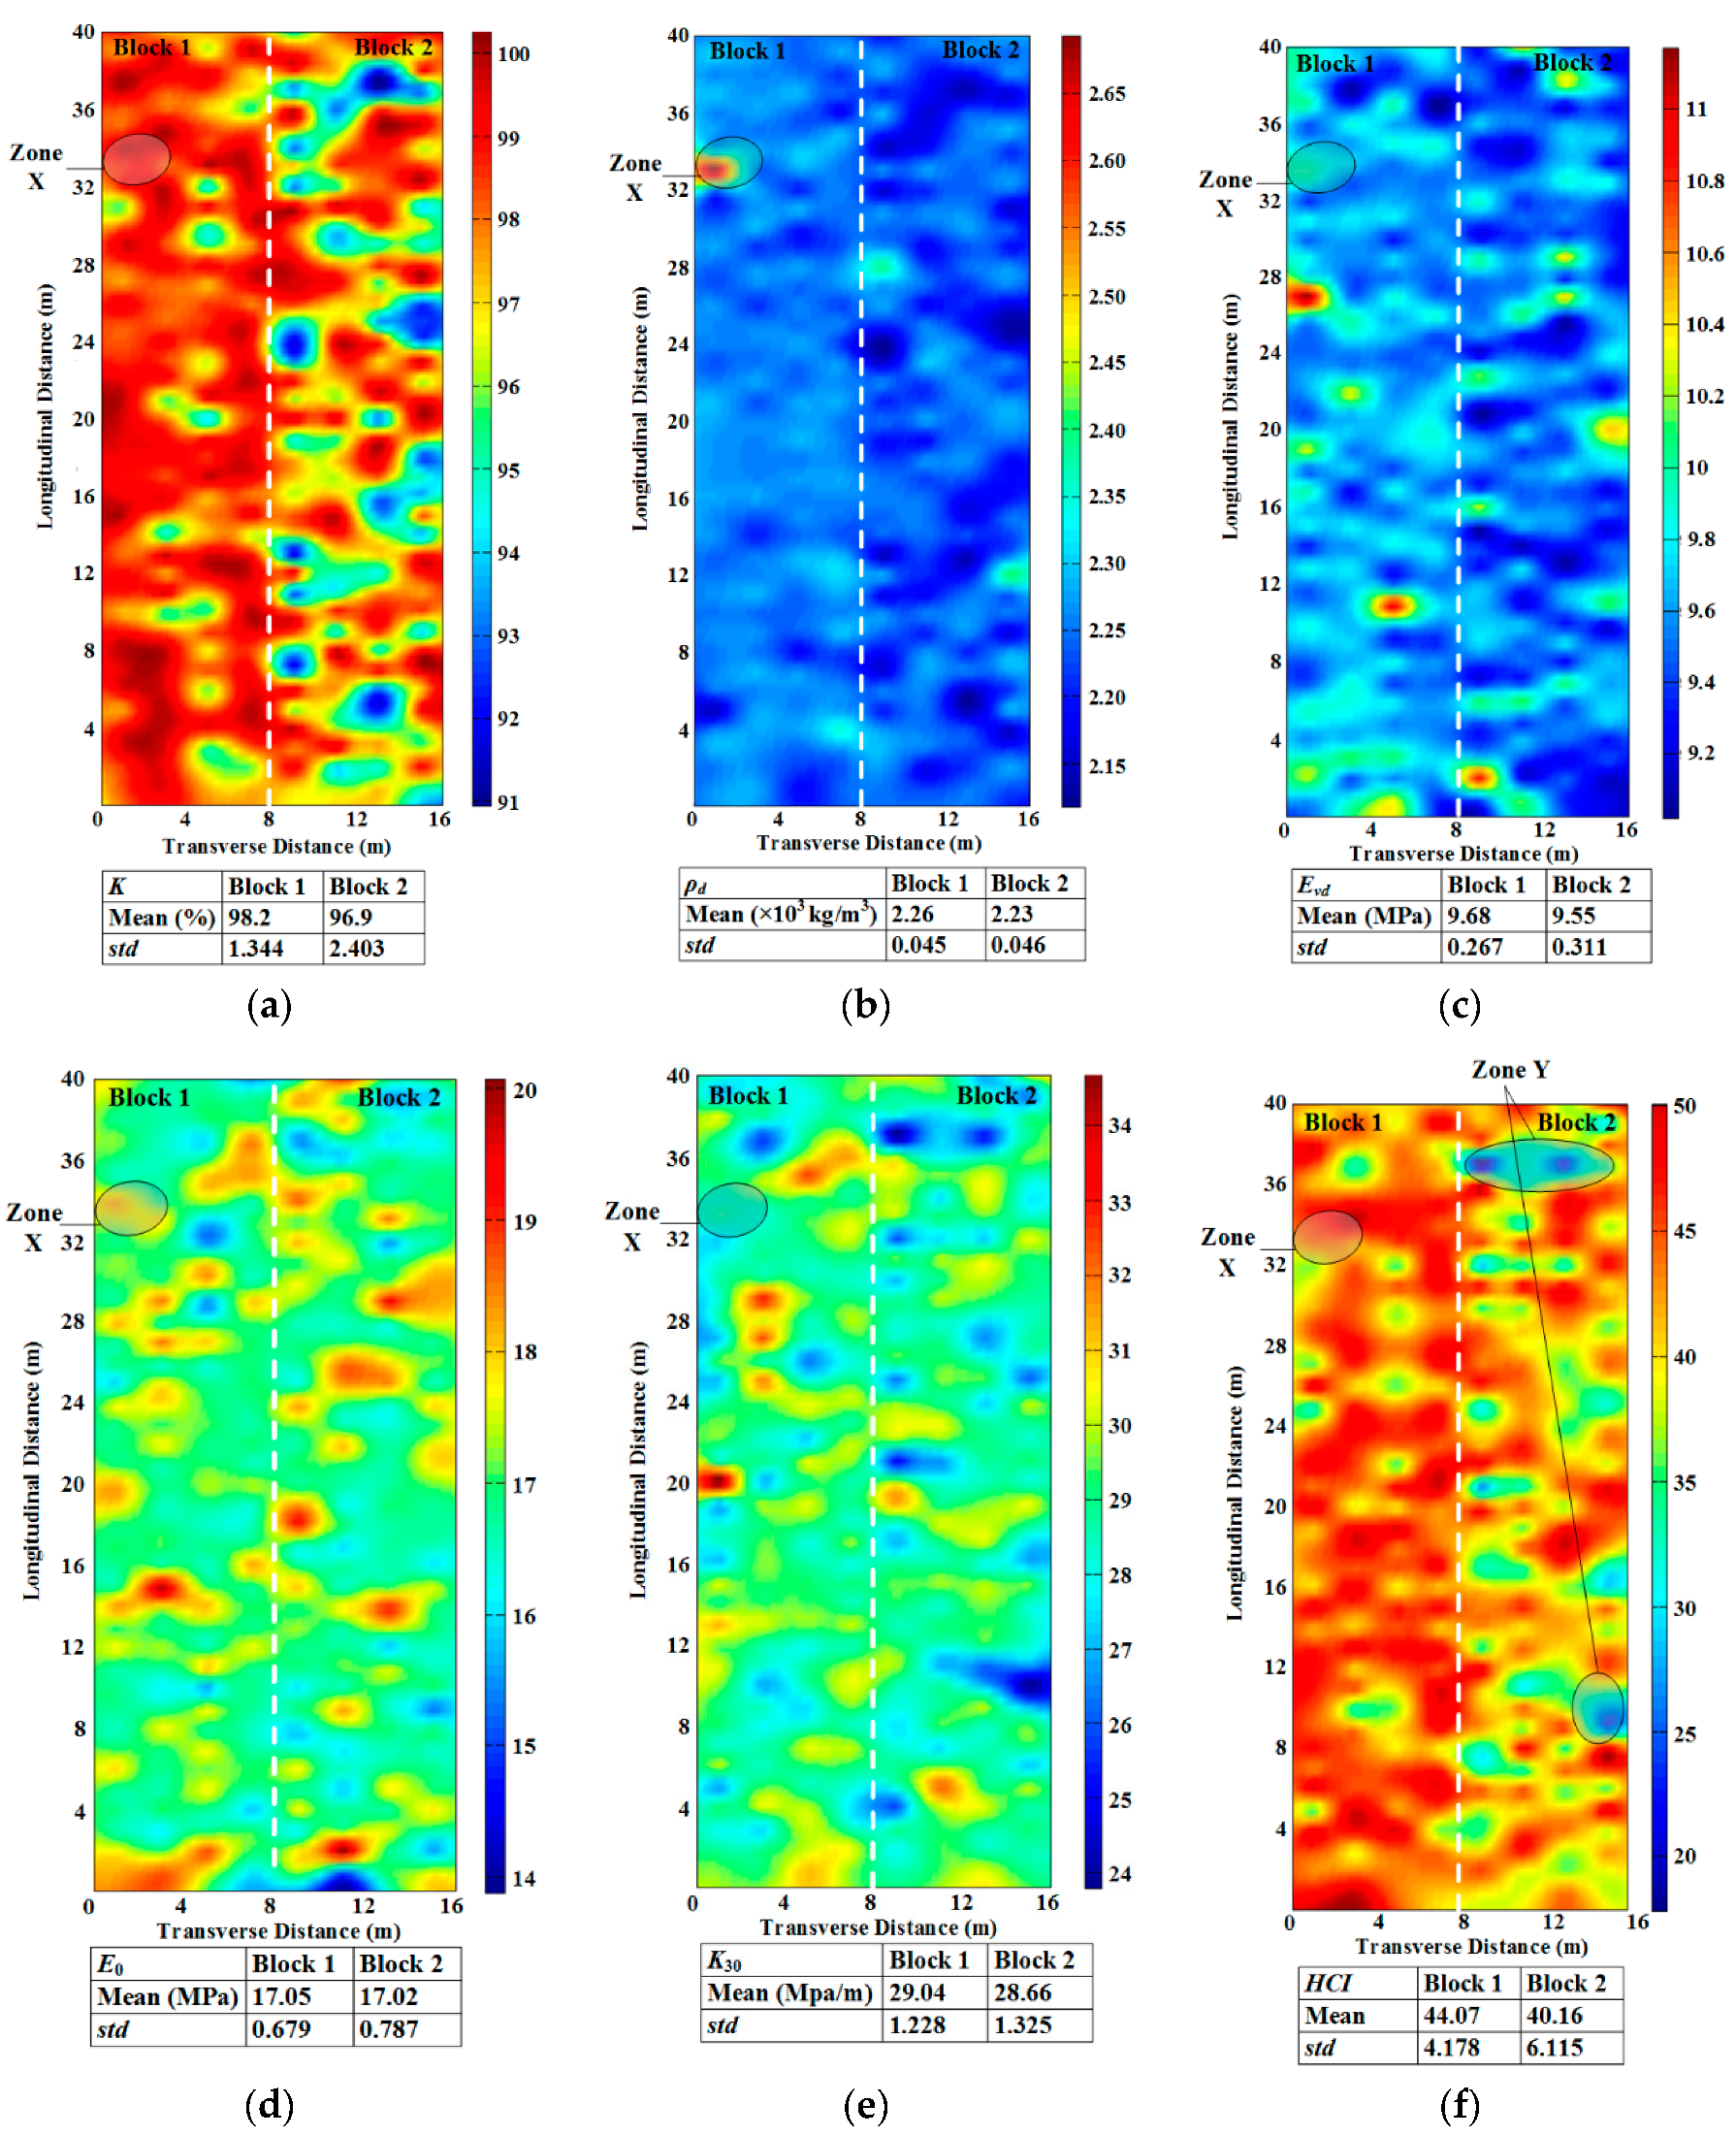
The index HCI proposed in this paper is in accordance with the other individual physical and mechanical index (K, ρ d , E v d , E 0 and K 30 ), and the results of the selected two blocks are comparable. Similar trends are found in the mean value and geostatistical data of each index, which indicates that there is close correlation between these indices. Moreover, results from the i-AHP method are generally the same as those from the traditional AHP method. In fact, the difference between the two methods is less than 0.3%. The above results show high consistency between the proposed method and the traditional method.
(2)
By taking both the physical and mechanical indices into account, the real-time hybrid index HCI can reveal the differences between the physical and mechanical indices, and a low individual index does not result in a low hybrid index. Here, we compared the indices in Zone X, which indicate the relationship between the physical and mechanical indices is not deterministic, and it is crucial to comprehensively consider each index. By taking the subjectivity and uncertainty into account, the i-AHP method can provide more detailed interval information than the traditional AHP method. For the instances of Point A and Point B, decision makers can participate in the process, which will avoid the shortcomings of the traditional AHP method that has an extreme rating based on a precise number.
(3)
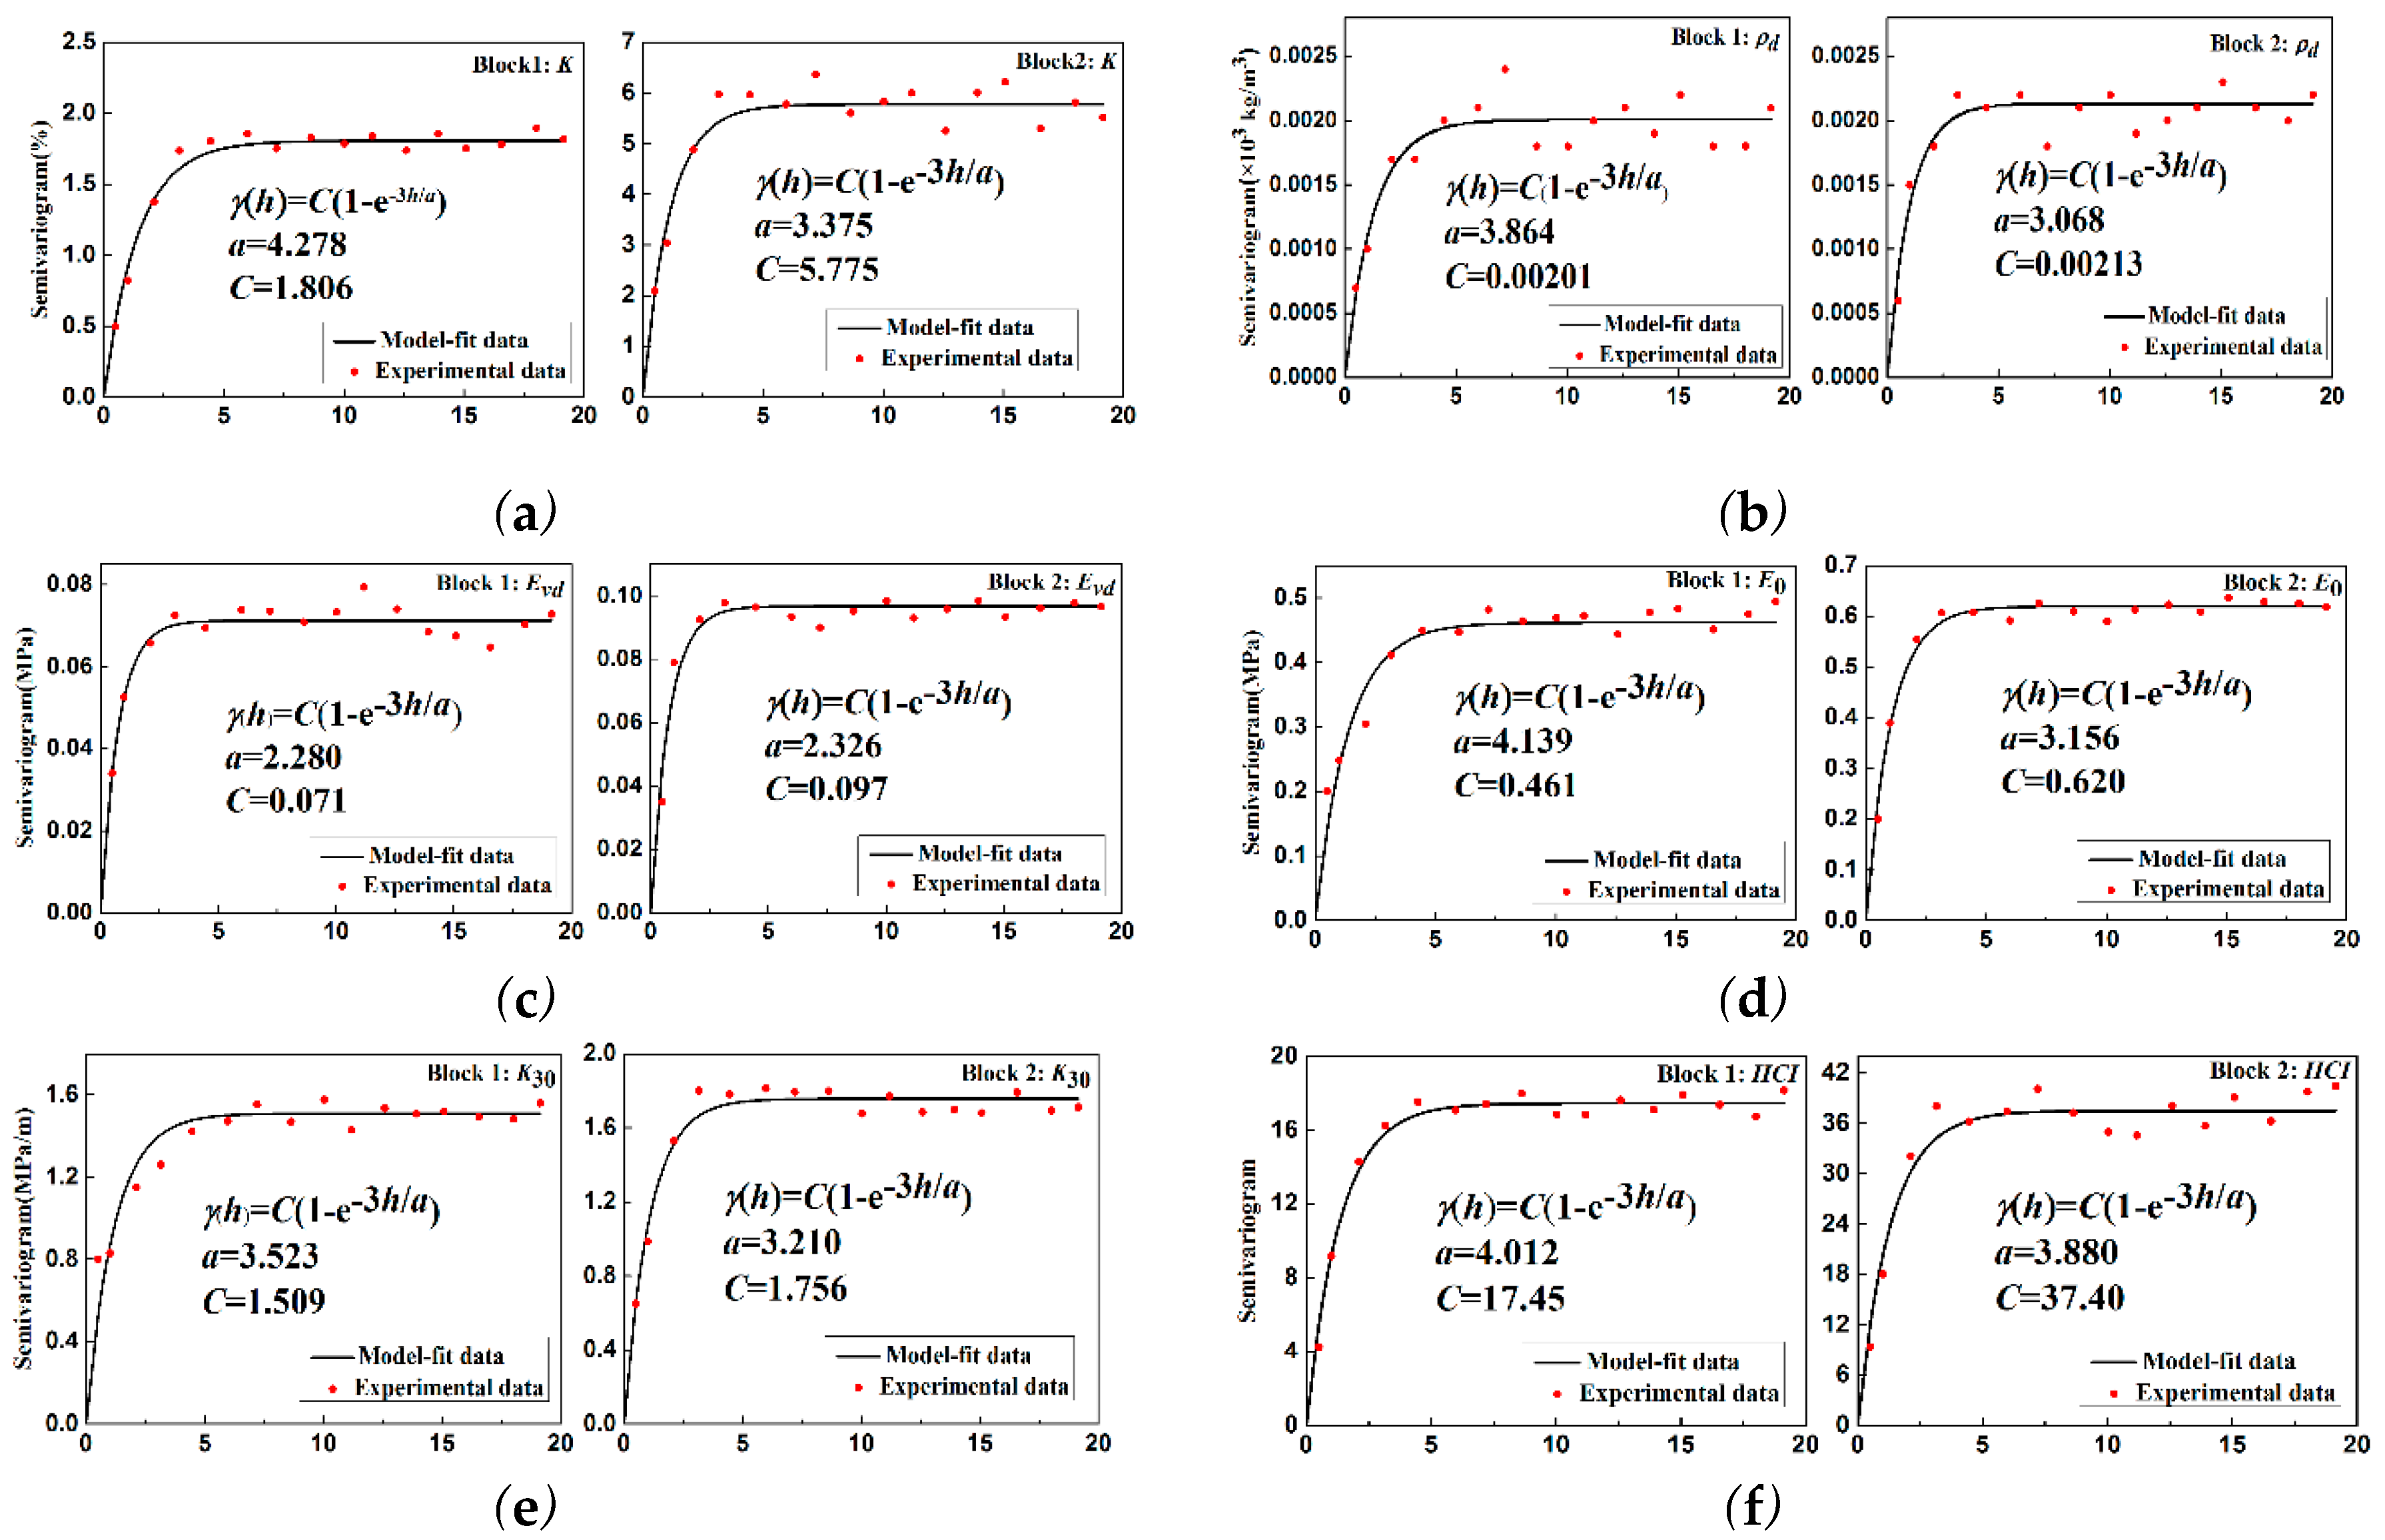
For the compaction quality heterogeneity analysis, semivariogram model parameters C and a can reflect the compaction continuity, and smaller C and larger a can represent better compaction continuity and less variability. With the improvement of fitting accuracy, results show that the C and a of HCI have similar trends with the other individual index.

7. Conclusions and Future Research

The real-time compaction quality control of earth-rock dam materials is a main concern during dam construction. Only real-time physical indices of compacted materials cannot fully reflect compaction quality, moreover, real-time compaction quality heterogeneity is harmful to dam safety and should be quantified. This paper proposes a comprehensive evaluation method of real-time compaction quality of earth-rock dam materials by i-AHP and i-GAM. Considering both physical and mechanical properties, the proposed HCI can fully reflect the overall performance of compacted materials, which is highly representative compared with other individual index evaluation methods. Moreover, the i-AHP method creates more possibilities for decision-makers than the traditional AHP method and makes the evaluation more flexible. The i-GAM method can also help to quantify compaction quality heterogeneity in which the accuracy of fitting model is improved, and with the help of i-AHP and i-GAM, the compaction quality of earth-rock dam can be easily marked and classified with comprehensive consideration of the material’s physical and mechanical properties. Earth-rock dam materials are used in this particular case study, but the proposed method can also be extended to other engineering fields.
Despite the efficiency of the evaluation method, there are several restrictions that need to be further investigated. First, it should be noted that the rolling compaction calibration tests are conducted to deal with the problem that there is no existing specification for the mechanical indices, which should be determined based on plenty of experiments and will be gradually added in the future. Second, only parts of the physical and mechanical indices are selected for comprehensive evaluation, which can be gradually expanded, and the prediction accuracy can be further improved by reducing the noise of prediction inputs. Moreover, augmented reality and intelligent rolling combined with compaction quality heterogeneity assessment will be important aspects of our future research.

Author Contributions

M.L., X.W. and J.W. proposed a comprehensive evaluation method to evaluate real-time compaction quality considering both the physical and mechanical properties of dam materials. M.L., B.C. and M.S. conceived and designed the experiments. J.W. provided the help of program implementation of SVR with CFA. M.L., B.D. and M.S. performed the experiments, analyzed the experiment data, and wrote the initial draft of the manuscript. X.W. and B.C. reviewed and contributed to the final manuscript.

Funding

This research was funded by the Joint Funds of the National Natural Science Foundation of China [grant number U1765205], the Science Fund for Creative Research Groups of the National Natural Science Foundation of China [grant number 51621092], and the Natural Science Foundation of China [grant number 51439005].

Conflicts of Interest

The authors declare no conflict of interest.

Abbreviations

AHPanalytic hierarchy process method
BFAbacterial foraging algorithm
CCVcontinuous compaction value
CFAchaotic firefly algorithm
CMIcontinuous measurement indices
CMVcompaction meter value
CVcompaction value
GAMgeostatistical analysis method
GPSglobal position system
GPRSgeneral packet radio service
i-AHPanalytic hierarchy process extended by interval model method
i-GAMimproved geostatistical analysis method
HCIhybrid compaction index
LWDlight weight deflectometer
OMVoscillometer value
PDApersonal digital assistant
PLplate load
RMVresonance meter value
RTCMreal-time compaction monitoring
SVRsupport vector regression
UCEunit compaction energy

Appendix A. Relationship between Cova Index and Cov Index

According to the Ref. [27], the C o v a index and C o v index can respectively be expressed as:
C o v a = C M e a n ,
C o v = s t d M e a n ,
where C is the sill value and C = lim h + γ ( h ) , M e a n and s t d are the mean value and the standard deviation of evaluation indices. The semivariance γ ( h ) function can be expressed as:
γ ( h ) = 1 2 E [ Z ( x ) Z ( x + h ) ] 2 = E [ Z ( x ) ] 2 E [ Z ( x ) Z ( x + h ) ] .
In addition, the covariance function of evaluation indices at x and x + h can be expressed as:
C ( h ) = C o v [ Z ( x ) Z ( x + h ) ] = E [ Z ( x ) Z ( x + h ) ] E [ Z ( x ) ] E [ Z ( x + h ) ] .
Then
C ( 0 ) = C o v [ Z ( x ) , Z ( x ) ] = V a r [ Z ( x ) ] = E [ Z ( x ) ] 2 { E [ Z ( x ) ] } 2 ,
where Var denotes variance. Moreover, we assume E [ Z ( x ) ] = E [ Z ( x + h ) ] in the same working face, therefore
γ ( h ) = C ( 0 ) C ( h ) .
Then
C = lim h γ ( h ) = lim h [ C ( 0 ) C ( h ) ] = C ( 0 ) = s t d 2 .
Therefore C o v a = C o v .

References

  1. Wang, J.J.; Zhong, D.H.; Wang, F. Evaluation of compaction quality of earth-rock dam based on bacterial foraging-support vector regression algorithm. In Proceedings of the International Conference on Innovative Material Science and Technology, Shenzhen, China, 19–21 August 2016. [Google Scholar] [CrossRef]
  2. Blanco, L.M.P. Compaction Quality Control on Site of Earthworks—A Comparative Study. Ph.D. Thesis, Universidade Nova de Lisboa, Lisboa, Portugal, 2015. [Google Scholar]
  3. China Electricity Council (CEC). DL/T5129-2013-Specification for Rolled Earth-Rockfill Dam Construction; China Electric Power Press: Beijing, China, 2013. (In Chinese) [Google Scholar]
  4. Liu, D.H.; Sun, J.; Zhong, D.H. Compaction quality control of earth-rock dam construction using real-time field operation data. J. Constr. Eng. Manag. 2011, 138, 1085–1094. [Google Scholar] [CrossRef]
  5. Zhang, Q.L.; Liu, T.Y.; Li, Q.B. Roller-integrated acoustic wave detection technique for rockfill materials. Appl. Sci. 2017, 7, 812. [Google Scholar] [CrossRef]
  6. Zhong, D.H.; Liu, D.H.; Cui, B. Real-time compaction quality monitoring of high core rockfill dam. Sci. China Tech. Sci. 2011, 54, 1906–1913. [Google Scholar] [CrossRef]
  7. Bruno, A.W.; Gallipoli, D.; Perlot, C. Effect of very high compaction pressures on the physical and mechanical properties of earthen materials. In Proceedings of the E-UNSAT 2016, Paris, France, 12–14 September 2016. [Google Scholar] [CrossRef]
  8. Sirjacobs, D.; Hanquet, B.; Lebeau, F. On-line soil mechanical resistance mapping and correlation with soil physical properties for precision agriculture. Soil Till. Res. 2002, 64, 231–242. [Google Scholar] [CrossRef]
  9. Leonelli, F.; Di Mascio, P.; Germinario, A.; Picarella, F.; Moretti, L.; Cassata, M.; De Rubeis, A. Laboratory and on-site tests for rapid runway repair. Appl. Sci. 2017, 7, 1192. [Google Scholar] [CrossRef]
  10. Jiang, Y.; Xue, J. Investigation into physical and mechanical properties of SRX—stabilized crushed rock using different compaction methods. Int. J. Pavement Eng. 2017, 1, 1–8. [Google Scholar] [CrossRef]
  11. Mooney, M.; Adam, D. Vibratory roller integrated measurement of earthwork compaction: An overview. In Proceedings of the 7th International Symposium on Field Measurements in Geomechanics, Boston, MA, USA, 24–27 September 2007. [Google Scholar] [CrossRef]
  12. Liu, Y.X.; Zhong, D.H.; Cui, B. Study on real-time construction quality monitoring of storehouse surfaces for RCC dams. Automat. Constr. 2015, 49, 100–112. [Google Scholar] [CrossRef]
  13. Wang, J.J.; Zhong, D.H.; Wu, B.P. Evaluation of compaction quality based on SVR with CFA: case study on compaction quality of earth-rock dam. J. Comput. Civ. Eng. 2018, 32, 05018001. [Google Scholar] [CrossRef]
  14. Thurner, H.; Sandstrom, A. Continuous compaction control, CCC. In Proceedings of the European Workshop Compaction of Soils and Granular Materials, Paris, France, 18–19 May 2000. [Google Scholar]
  15. Sandström, A.J.; Pettersson, C.B. Intelligent systems for QA/QC in soil compaction. In Proceedings of the 83rd Annual Transportation Research Board Meeting, Washington, DC, USA, 11–14 January 2004. [Google Scholar]
  16. Liu, D.; Li, Z.; Lian, Z. Compaction quality assessment of earth-rock dam materials using roller-integrated compaction monitoring technology. Automat. Constr. 2014, 44, 234–246. [Google Scholar] [CrossRef]
  17. Liu, D.; Li, Z.; Liu, J. Experimental study on real-time control of roller compacted concrete dam compaction quality using unit compaction energy indices. Constr. Build. Mater. 2015, 96, 567–575. [Google Scholar] [CrossRef]
  18. Mooney, M.A.; Rinehart, R.V. Field monitoring of roller vibration during compaction of subgrade soil. J. Geotech. Geoenviron. 2007, 133, 257–265. [Google Scholar] [CrossRef]
  19. Mitchell, M.R.; Link, R.E.; Facas, N.W. Position reporting error of intelligent compaction and continuous compaction control roller-measured soil properties. J. Test. Eval. 2009, 38, 13–18. [Google Scholar] [CrossRef]
  20. Saaty, T.L. The Analytic Hierarchy Process: Planning, Priority Setting, Resource Allocation; McGraw-Hill: New York, NY, USA, 1980. [Google Scholar]
  21. Liu, P.; Li, Q.M.; Song, L.L.; Jia, R.Y. The index system for the development level evaluation of regional construction industrialization: A case study in Jiangsu, China. Appl. Sci. 2017, 7, 492. [Google Scholar] [CrossRef]
  22. Zhang, J.; Zhong, D.H.; Zhao, M.Q. An optimization model for construction stage and zone plans of rockfill dams based on the enhanced whale optimization algorithm. Energies 2019, 12, 466. [Google Scholar] [CrossRef]
  23. Luo, Y.; Li, A.; Kang, Z. Reliability-based design optimization of adhesive bonded steel-concrete composite beams with probabilistic and non-probabilistic uncertainties. Eng. Struct. 2011, 33, 2110–2119. [Google Scholar] [CrossRef]
  24. Zhang, P.; Wang, Y.H.; Qin, G.J. A novel method to assess safety of buried pressure pipelines under non-random process seismic excitation based on cloud model. Appl. Sci. 2019, 9, 812. [Google Scholar] [CrossRef]
  25. Du, H.Q.; Zhou, G.M.; Fan, W.Y. Spatial heterogeneity and carbon contribution of aboveground biomass of moso bamboo by using geostatistical theory. Plant Ecol. 2010, 207, 131–139. [Google Scholar] [CrossRef]
  26. Vennapusa, P.K.R.; White, D.J.; Morris, M.D. Geostatistical analysis for spatially referenced roller-integrated compaction measurements. J. Geotech. Geoenviron. 2010, 136, 813–822. [Google Scholar] [CrossRef]
  27. Xu, Q.; Chang, G.K. Experimental and numerical study of asphalt material geospatial heterogeneity with intelligent compaction technology on roads. Constr. Build. Mater. 2014, 72, 189–198. [Google Scholar] [CrossRef]
  28. Yu, Q.M.; Liu, J.K.; Tian, Y.H. Analysis of application situation of continuous compaction control (CCC). Appl. Mech. Mater. 2014, 501–504, 983–992. [Google Scholar] [CrossRef]
  29. White, D.J.; Vennapusa, P.K.R.; Gieselman, H.H. Field assessment and specification review for roller-integrated compaction monitoring technologies. Adv. Civ. Eng. 2011, 1936, 1–15. [Google Scholar] [CrossRef]
  30. Komandi, G. An evaluation of the concept of rolling resistance. J. Terramechanics 1999, 36, 159–166. [Google Scholar] [CrossRef]
  31. Rahman, F.; Hossain, M.; Hunt, M.M. Intelligent compaction control of highway embankment soil. In Proceedings of the 86rd Annual Transportation Research Board Meeting, Washington, DC, USA, 10–25 January 2007. [Google Scholar]
  32. Andereg, R.; Kaufmann, K. Intelligent compaction with vibratory rollers: feedback control systems in automatic compaction and compaction control. Transport Res. Rec. 2004, 1868, 124–134. [Google Scholar] [CrossRef]
  33. Anderegg, R.; Kaufmann, K. Compaction monitoring using intelligent soil compactors. Am. Soc. Civ. Eng. 2006, 187, 1–6. [Google Scholar] [CrossRef]
  34. Yi, T.; Li, N.; Gu, M. Recent research and applications of GPS based technology for bridge health monitoring. Sci. China Tech. Sci. 2010, 53, 2597–2610. [Google Scholar] [CrossRef]
  35. Poungponsri, S.; Yu, X.H. An adaptive filtering approach for electrocardiogram (ECG) signal noise reduction using neural networks. Neurocomputing 2013, 117, 206–213. [Google Scholar] [CrossRef]
Figure 1. Research framework.
Applsci 09 01543 g001
Figure 2. I-AHP system for compaction quality evaluation.
Applsci 09 01543 g002
Figure 3. User interface of the 3D real-time compaction monitoring (RTCM) system.
Applsci 09 01543 g003
Figure 4. Relationship between semivariance function and covariance function.
Applsci 09 01543 g004
Figure 5. Cross validation of physical indices: (a) K; (b) ρ d .
Applsci 09 01543 g005
Figure 6. Cross validation of physical indices: (a) E v d ; (b) E 0 ; (c) K 30 .
Applsci 09 01543 g006aApplsci 09 01543 g006b
Figure 7. Relationship of compaction passes with the indices and the mean errors of test points: (a) physical indices; (b) mechanical indices.
Applsci 09 01543 g007aApplsci 09 01543 g007b
Figure 8. Contour maps of evaluation indices of each block: (ae) the physical and mechanical indices; (f) the hybrid index HCI.
Applsci 09 01543 g008
Figure 9. Semivariogram of evaluation indices of each block: (ae) the physical and mechanical indices; (f) the hybrid index HCI.
Applsci 09 01543 g009
Figure 10. Compaction quality report of randomly selected working face.
Applsci 09 01543 g010
Table 1. Summary of compaction measurement indices.
CategoriesIndicesSymbolsDetection MethodsCMIReferences
Physical propertiesCompactnessKSpot tests IWHR [3]
Porosity nSpot tests IWHR [3]
Dry density ρ d Spot tests IWHR [3]
Mechanical propertiesDynamic elastic modulusEvdLight weight deflectometer (LWD) tests Yu et al. [28]
Deformation modulusE0Plate load (PL) tests White et al. [29]
Subgrade modulusK30PL tests White et al. [29]
California bearing ratioCBRDynamic cone penetrometer tests Yu et al. [28]
Nondestructive alternativesDensity ρ Nuclear density Gauge tests IWHR [3]
Density ρ Additional mass tests IWHR [3]
Compaction meter valueCMVRTCM technologyThurner et al. [14]
Compaction valueCVRTCM technology Liu et al. [16]
Unit compaction energyUCERTCM technology Liu et al. [17]
Sound compaction valueSCVRTCM technologyZhang et al. [5]
Machine drive powerMDPRTCM technology Komandi et al. [30]
Bomag variocontrolBVCRTCM technologyRahman et al. [31]
Soil stiffnessksRTCM technologyAnderegg et al. [32,33]
Table 2. Importance degree and implication for elements in i-AHP system.
Importance DegreeImplication
1The two elements are equally important
3The former is slightly more important than the later
5The former is rather more important than the latter
7The former is strongly more important than the latter
9The former is absolutely more important than the latter
2, 4, 6, 8Indicate the intermediate value of the above adjacent judgments
Table 3. Quality-level classification standard for the physical and mechanical indices in earth-rock dam compaction.
Quality LevelI (Good)II (Fine)III (Ordinary)IV (Poor)V (Bad)
K ( % ) >9998–9995–9890–95<90
ρ d ( × 10 3   kg / m 3 ) >2.272.25–2.272.23–2.252.21–2.23<2.21
E v d (MPa)>9.79.5–9.79.3–9.59.1–9.3<9.1
E 0 (MPa)>16.516–16.515.5–1615–15.5<15
K 30 (MPa/m)>2927.5–2926–27.524.5–26<24.5
Dimensionless value5040302010
Table 4. Interval total weight vectors of the i-AHP model.
Indices Criteria   ( P 1 ) Criteria   ( P 2 ) Total Weight Vectors
[ 0.2432 , 0.2781 ] [ 0.6877 , 0.7865 ]
A 1 [ 0.7609 , 0.8272 ] [ 0.1850 , 0.2300 ]
A 3 [ 0.1965 , 0.2136 ] [ 0.0478 , 0.0594 ]
A 4 [ 01183 , 0.1266 ] [ 0.0814 , 0.0996 ]
A 5 [ 0.2537 , 0.2905 ] [ 0.1745 , 0.2285 ]
A 6 [ 0.5791 , 0.6293 ] [ 0.3983 , 0.4950 ]

