1. Introduction
According to the International Labour Organization (ILO), every 15 seconds 153 workers have a work accident, and more than 317 million accidents occur at work, many of which result in work absenteeism. Further, every 15 seconds a worker dies due to accidents or diseases related to work [
1]. There are environments and processes inherently more dangerous than others; therefore, riskier situations arise. In the case of the mining industry, the number of annual accidents with fatalities is high [
2,
3,
4]. Hence, in the summer of 2006, the United States Congress enacted the Mine Improvement and New Emergency Response (MINER) act to a series of tragedies that occurred earlier that year. The MINER law requires mine managers to submit an emergency response plan [
5].
Technology has provided very effective new solutions and tools for safety and accident prevention. These new tools are mainly related to telecommunication solutions. It has been proven that work environments that have accurate and instant information can save lives [
6]. There are many accidents in mining due to gas explosions, cave-ins, chemical leakages, fires, and electrocution, which can lead to the loss of lives, and trapped or lost miners. In such scenarios it is essential to locate miners and provide assistance as quickly as possible. Therefore, it is very important to have proper localization systems in order to track people in underground mining environments.
Existing positioning technologies such as the global positioning system (GPS) are not useful in indoor applications, especially in underground mining environments. This is because the signal is easily blocked by most construction materials and the mobile terminal cannot process the beacons sent from the satellites [
7,
8,
9,
10,
11,
12]. Therefore, other wireless technologies such as Radio Frequency IDentification (RFID), Wireless Fidelity (Wi-Fi), and Zigbee have been preferred to provide indoor localization/positioning [
5].
In a previous work, the authors proposed a location system based on the placement of points of reference and visible light communication (VLC) technology [
7]. Whereas in [
10], the authors proposed a VLC system for localization in underground mining tunnels developed in conjunction with the trilateration technique in two dimensions. Whereas in this work, the system presented in [
10] will be extended to a VLC three dimension trilateration localization scheme. Therefore, a smaller location estimation error is expected with the new localization scheme. The proposed system will be evaluated and compared with other existing localization systems in terms of location estimation error.
The manuscript has the following organization.
Section 2 introduces state of the art localization schemes used in underground mining environments, whereas
Section 3 provides the basic concepts of VLC systems. In
Section 4 the proposed method is presented in detail, whereas in
Section 5, we evaluate the proposed system and compared it with other existing localization schemes in terms of the localization estimation error. Finally, conclusions are presented in
Section 6.
2. State of the Art—Underground Mining Localization Systems
In the work presented by the United States government through the Institution of Occupational Safety and Health, a revision of the technologies used for tracking devices in underground mines indicates that technologies such as RFID, Wi-Fi, and Zigbee are preferred to meet this purpose [
5]. Therefore, it can be seen that the technologies selected for tracking devices in underground mining environments are characterized by being short range radio frequency (RF) systems.
Indoor applications which require the tracking of devices, normally use RFID based positioning technologies for locating objects or people. It has become an interesting research and development topic since the 1990’s [
7,
8,
9,
10]. RFID based localization technologies can track the movements of objects through a network of radio enabled scanning devices over a distance of several meters.
In [
13], a method is presented for the location of a vehicle equipped with an RFID reader in an underground environment. A particle filter and passive RFID tags are used in the creation of node maps to solve the localization problem. The reported location estimation error is between 0.30 m and 5 m. The study presented in [
14] investigates the use of RFID labels randomly distributed for autonomous localization and navigation in underground environments. The reported location estimation error is between 35 cm and 98 cm. In [
15], a hybrid algorithm based on RFID for simultaneous location and mapping (SLAM) is proposed. The algorithm allows autonomous navigation in environments denied by GPS. A particle filter along with a sensor model that characterizes the strength of the received signal (RSS) is used to create sub-maps. The average location estimation error is 30 cm.
In [
16], the locations of the mobile nodes are captured by the underground nodes using Wi-Fi networks. The result of the simulation shows the method reach location accuracy up to 1.6 m. The work presented in [
17] studies the scheme known as Owl Positioning Systems (OwlPS) for underground mining tunnels. OwlPS is usable as a personal positioning system to track mine workers in the event of an incident. But the system has problems in terms of the propagation of the radio signal, similar to Wi-Fi networks.
In [
18] a positioning system is proposed based on Zigbee technology. The global positioning system is composed by the control center, monitoring base stations, gateways, reference nodes, and mobile nodes. The software and hardware design is detailed in the manuscript, but results of the proposed system are not indicated. In the work presented in [
19], an underground location system based on Zigbee technology and Web geographic information systems (WebGIS) is proposed. The miners are equipped with sensors that communicate via Zigbee. The devices determine the location of the miners in real time by implementing an algorithm based on the received signal strength indicator (RSSI). The information is sent through Zigbee and Ethernet, technologies that act as main channels of data transmission. A server provides the service that shows the distribution of the miners in the e-map through the web. In [
20], it is described and implemented as a new type of security surveillance system in the coal mines, which is a network system based on Zigbee technology. The wireless sensor network consists of fixed nodes, mobile nodes, and a gateway in the underground tunnels. A monitoring software is deployed on the surface. The average location estimation error is quantified as approximately 2.5 m.
In [
21], an underground personal positioning system is proposed. The system is composed of an underground personal positioning station based on Zigbee, which includes a wireless RF receiver, communications, and electronic device for data processing. The system uses the maximum probability estimation algorithm to determine the precise location of the device. Whereas in [
22], a new location system for miners is presented. It is a wireless sensor network based on Zigbee. The system is capable of obtaining in real-time the accurate location of miners within the tunnels of the underground mine. Through the RSSI, the location node takes advantage of its built-in location engine to calculate its coordinates and location. The maximum location estimation error is approximately 6 m.
Whereas in [
23], the authors proposed a new positioning algorithm for underground coal mines based on Zigbee technology, in which the nearest neighbor in signal space (NNSS) algorithm was adopted for the preliminary location and the dynamic triangular measurement (DTM) localization method was used for precise positioning. The algorithm provides personnel tracking, monitoring, in addition to other related functions. No results are displayed related to the location estimation error. In [
24], software and hardware for the location system of underground mines personnel were designed. The system consists of a gateway node, reference node, location node, and the connection of the three devices to a monitor. The system is capable of transmitting the location of the personnel in real-time to the software graphical monitor, and achieve a real-time tracking function for the location node. An algorithm based on RSSI was used as the localization algorithm. The results show a minimum location estimation error of less than 3 m.
As it has been shown, most of the underground localization systems use RF technologies to fulfill the purpose of localization in underground mining. As previously indicated, there are a number of problems with RF systems applied to indoor localization, which include: (i) long response time and low accuracy; (ii) traditional short range RF technologies operated in the 2.4 GHz band do not provide large coverage in underground environments [
25,
26]; (iii) typical RF-based systems are not permitted in environments such as hospitals and airplanes, due to security reasons; (iv) technologies such as Wi-Fi, Zigbee, and RFID incur additional costs associated with the development and particular configuration when applied to large spaces; and (v) lower precision (typically between a few tens and several hundred of meters).
3. Visible Light Communication Systems
VLC is a novel technology traditionally based on LED optical wireless communication (OWC) systems [
27,
28,
29,
30,
31], but significant research progress on laser-diode (LD) based VLC technology has been achieved in recent years [
32,
33,
34,
35,
36]. Traditional LED OWC systems transmit data at high speeds, whereas photo-detectors are used at the receiver side to detect the optical signal, and translates it into an equivalent electrical current [
7,
10]. Traditionally, VLC technologies are characterized as intensity-modulation and direct-detection (IM-DD) systems. Recent developments have enabled LED devices, with high efficiency and brightness to be used as the main transmission source in conventional VLC systems with speeds stretching into hundreds of Mbps [
7]. The dual functionality provided by VLC, lighting, and data communication has created a wide range of interesting applications, including home networks [
27], high-speed data communication through office lighting infrastructures [
28], vehicle-to-vehicle (V2V) communications [
29,
37,
38], high speed communications in environments such as hospitals and airplanes [
30], to name a few.
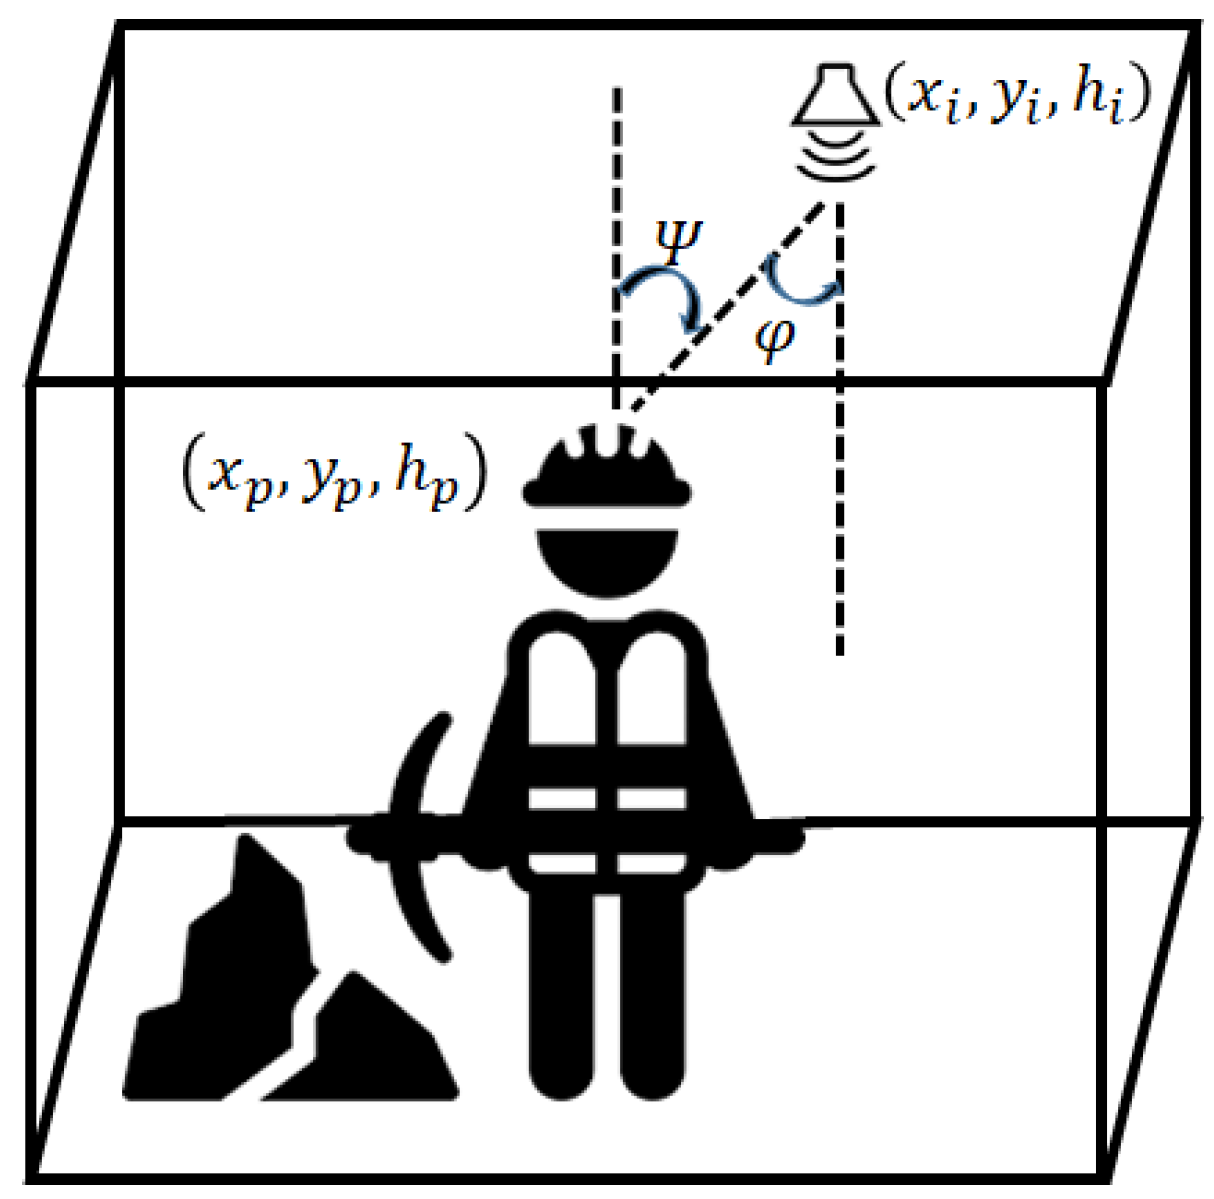
For further details regarding the VLC channel model used in this work [
39],
Figure 1 is used. A transceiver
i placed on the roof of the underground tunnel with coordinates
, and a transceiver
p placed in the helmet of the miner with coordinates
. The angle of incidence of the light is given as
and
is the irradiation angle.
The optical power received by each transceiver
p from the LED
i is described as:
where
is the power transmitted by LED
i and
is the channel impulse response between the LED
i and the photodetector
p. The channel impulse response
can be expressed as [
40]:
where
is the physical area of the photodetector within the receiver,
is the distance between the LED
i and the photodetector
p,
is the gain of the optical filter,
denotes the width of the field of vision of the photodetector, and
is the Lambertian emission order and is given by the semi-angle half power LED as follows:
Whereas the gain of the optical concentrator
is given by:
where
n represents the refractive index.
Based on the three-dimensional coordinate system described in
Figure 1, it is possible to find an expression for the irradiation angle as:
where
is the height of LED
i and
is the height of the photodetector
p. The model also assumes a control system located in each of the safety helmets, which uses an accelerometer to always keep the photo-detector parallel to the roof of the mine, whereby
. Therefore, the channel response of the system could be written as:
Finally, the received power by the photodetector is given by:
For the particular application case at the receiver side (underground mining tunnel), it is assumed that the photo-detector is only exposed to the optical signals generated by the LED transmitters, and not to other natural or artificial lighting sources. The latter assumption is only an initial approach toward the analysis of VLC in underground mining. To the best of the authors’ knowledge, the channel impulse response of a VLC system inside an underground mining facility has not yet been documented in the literature. Therefore, the received signal is modeled as:
where,
represents the electrical signal received from LED
i to receiver
p,
r is the sensitivity in the photo-detector (A/W),
x represents the transmitted optical pulse, ∗ denotes the convolution operator, and
n is modeled as additive white Gaussian noise (AWGN) with mean zero and variance
. The noise model used in this manuscript complies with the thermal and shot noise used in [
41].
4. Description of the Proposed System
The proposed system is based on a telecommunications network that has the three fundamental layers within the network design: access, distribution, and core. Each layer can be considered as a well-defined structured module, with specific functions. The three-layer model ensures that the network maintains sufficient strength and flexibility to provide critical services as well as allowing for growth and changes that occur over time [
42].
In the monitoring center which is within the core layer, a router is able to provide connectivity to the high-speed backbone (Internet) so that the data collected by the location system and stored in the server database is available at any time and in any place. In addition, the core layer through the router is interconnected with the distribution routers through an optical fiber link. Distribution routers interact between the access layer and the core layer to provide high availability to the end user and a route to the core layer.
The access layer represents the perimeter of the network, where traffic enters or leaves the network. The main function of the VLC access points is to provide the users access to the network. The VLC access points are connected to the distribution routers, which could implement technologies for quality of service and network security.
To provide a high data rate and a wider coverage area, as well as to ensure the availability of the link at all times, a traditional cellular structure is the chosen option. It is assumed that inside the underground tunnel, VLC access points are placed on the roof along the entire underground tunnel, where each of them is composed of an LED and a photodetector with coordinates . The LEDs are used to provide illumination as well as communication in the optical cell formed by the light beam.
The newly approved IEEE 802.15.7-2018 standard for local and metropolitan area networks for short-range OWC systems describes the physical layer and the data link layer of VLC; covering topics such as: network topology, addressing, collision prevention, among others [
43]. Based on the standard, the chosen topology for the present work is a star topology, in which communication is established between several mobile devices and a particular VLC access point. Networks with a star topology operate independently of other networks using the same topology. This is achieved by choosing a wireless personal area network (WPAN) identifier that is not being used by another network within the coverage area. Once the WPAN identifier is chosen, the VLC access point allows mobile devices to join the network.
The standard defines the multiple access with carrier monitoring and collision avoidance (CSMA/CA) as the technique used to access the channel [
43]. By using non-beacon-enabled CSMA/CA, the transmission medium is shared by several mobile users at the same time. Every time the device tries to communicate, it has to wait for a random off-time period. If the carrier-sense mechanism finds the channel available to communicate, then the device transmits the data frame. Otherwise, if the channel is busy, the mobile device waits for another random period before trying to access the channel again. Once the signal has been sent from the VLC access points
i, and is captured by the VLC mobile device
p mounted on the miner’s safety helmet, a digital processing unit will be responsible for determining the received power of the signal. Then, the distance between the LED and photodetector is given as:
and depends on the received power (
), transmitted power (
), as well as other channel param. In real conditions, this distance is estimated based on the received and transmitted power, and certain channel param; therefore, channel estimation is required. An experimental method to estimate the channel param is based on locating the photodetector in different places and measuring the received power.
To calculate the position, the VLC mobile device, through the digital processor, implements the trilateration technique. This is done to locate the miners within the different cells, and send the calculated position to the monitoring center by means of the VLC access point with which there is coordination. The benefit of the proposed method in this system is the 3-dimension localization for multiple miners because it introduces and additional variable to the analysis in comparison to the traditional 2-dimension systems; therefore, a lower average localization error is expected.
The proposed algorithm in this manuscript is capable of localizing several miners using a VLC 3 dimensional trilateration localization scheme in any sector of the the mine, even when two or more miners are located in the same sector and at the same time.
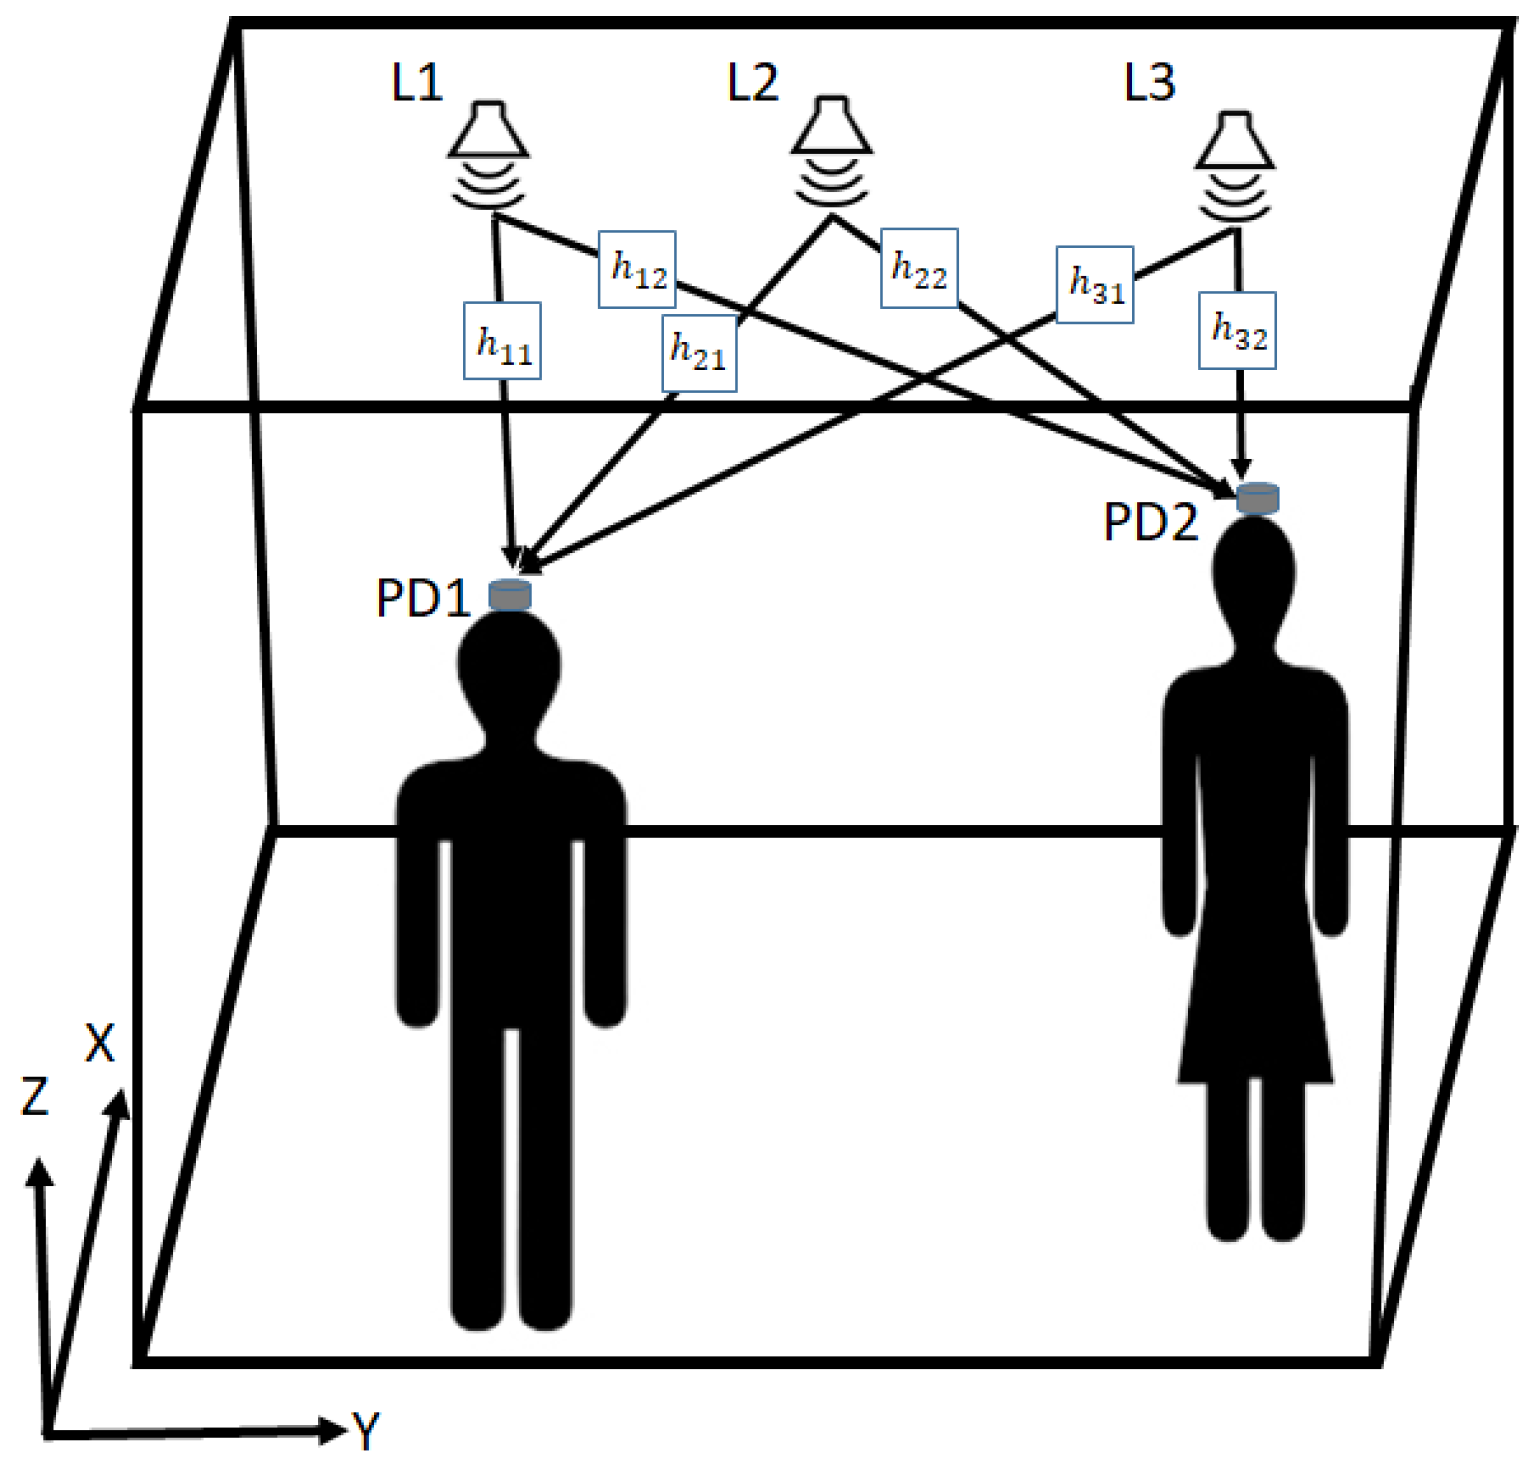
Figure 2 shows the presented model for placing the LEDs and photodetectors. For illustration purposes,
Figure 2 depicts the proposed system for a cell of three LEDs and two photodetectors (miners). Different number of LEDs can be used in each cell, but at least three LEDs are needed for the proposed 3D localization scheme in each cell.
Figure 3 shows the general block diagram of the proposed VLC localization system. The data is transmitted by the LEDs and is received by the photodetectors. The received signal is affected by the optical channel. Two filtering processes are used in the receiver to prepare the useful data for the localization algorithm. The first step is optical filtering, which it is used to eliminate the extra lights outside of the visible light range. The second step is the use of a bank of finite impulse response (FIR) frequency digital filters to separate the carrier tones related to each LED. Then, an amplifier is considered to increase the power of the received signals. Finally, the amplified signal is ready to be used in the localization algorithm.
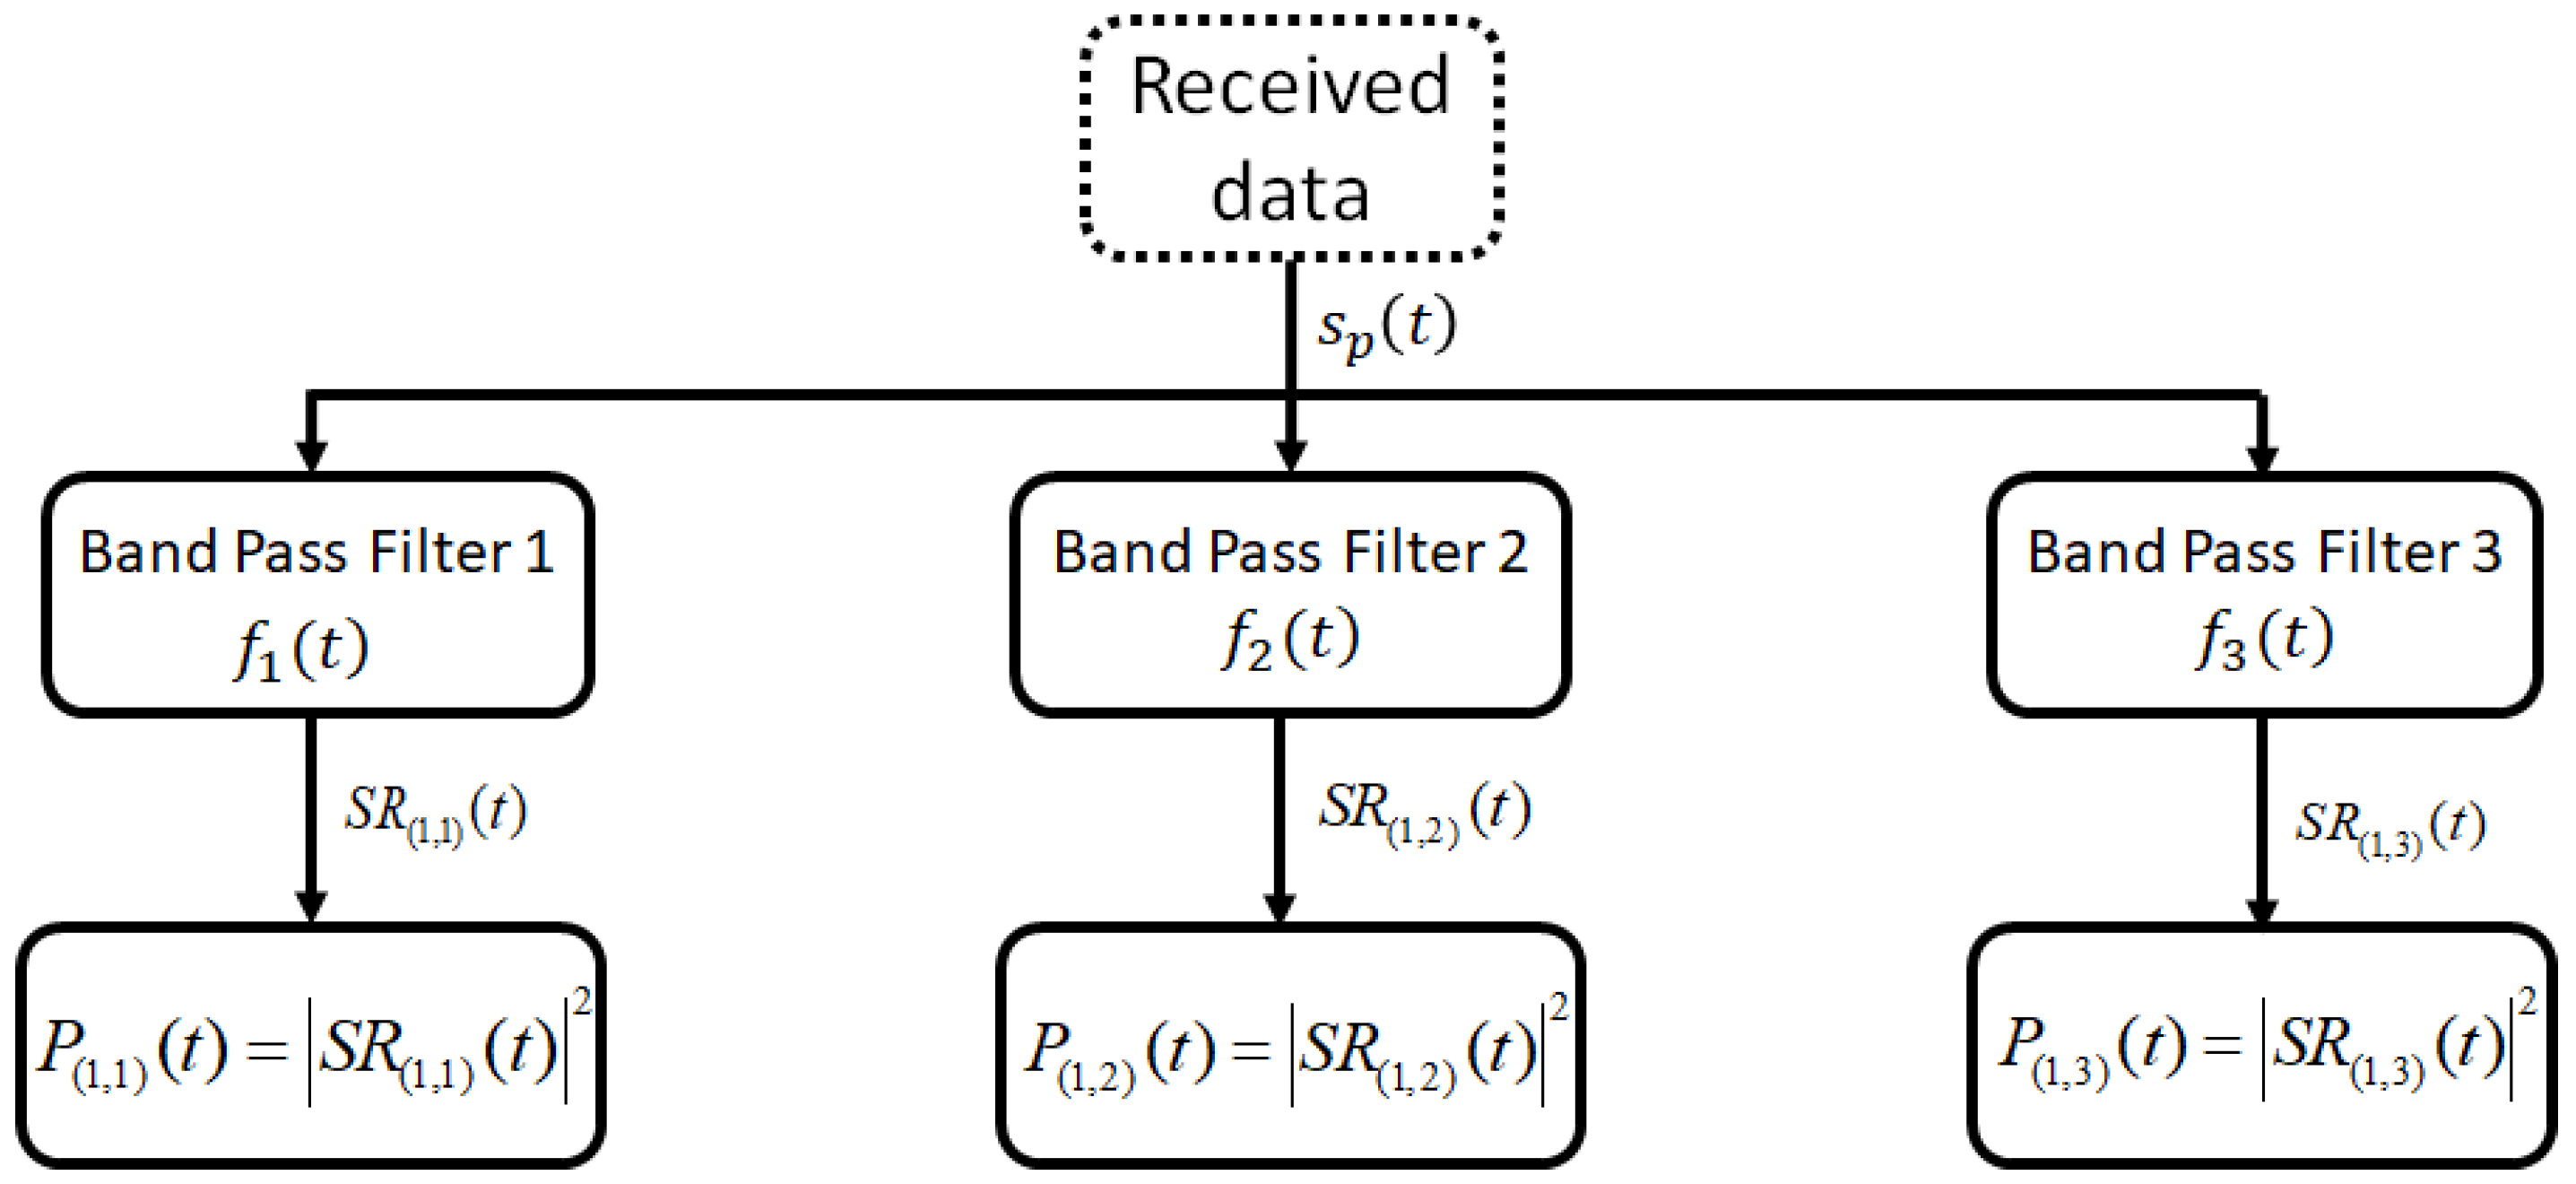
The proposed localization algorithm is based on the estimated power of the received signal of each carrier tone.
Figure 4 shows the basic steps of the localization algorithm in the receiver side. The received signal by the photodetector is the superposition of three LED signals, and each LED transmits the data on a different carrier tone. Therefore, a proper method to separate the signals in the photodetector consists on the use of a bank of FIR filters in the frequency-domain bank. Next, the power of each carrier tone is calculated because the localization method is based on the estimated power of each LED. Then, a sphere can be considered, and it is centered in the location of the LED for which all points in the sphere have the same power as the photodetector. This process is done for the two other carrier tones because the received signal in the photodetector is the superposition of the three LEDs. Finally, three spheres are plotted by centering of locations of the LEDs based on the power calculation of the received signals. In the ideal case, these three spheres should have intersection in just one point, and it should be in the location of the photodetector. But these three spheres have an intersection area, not just a point, because of noise and reflection in the environments. The point in this area, which has the closest distance to all of the three spheres, is considered as the estimated location of the photodetector. The localization error is described as the euclidean distance between this estimated location and the real one.
The received signal in the photodetector after passing through the channel impulse response
is defined as:
where
is the transmitted signal,
is the channel impulse response,
is the received signal by the photodetector, and ∗ denotes the convolution operator. Further, the modulated signal by a carrier tone of the LED is described as:
The received signal by the photodetector is the superposition of three transmitted signals after passing through the channel impulse response is given as:
If the purpose of the system is the localization of
n users, then it can be extended to three LEDs and
n photodetectors. Therefore, the received signal in the place of each photodetector is the superposition of the three LED signals related to different channel impulse responses. The received signals of
n photodetectors are described as:
In Equation (
13),
,
and
are the channel impulse responses between the
n-th modulated signal and the first, second and third LED, respectively. Therefore, the signal
is considered as the input of the localization algorithm based on the previously defined scenario of three LEDs and one photodetector. Three band pass filters (BPF) are implemented to the signal
to separate the three carrier tones transmitted in different frequencies as follows:
where
,
and
are the filtered signals in frequencies
,
and
, respectively. The power of the received signals is calculated as follows:
In Equation (
15),
is the calculated power in the location of the first photodetector for LED
i. The diameter of the sphere is estimated based on the calculated power of all three received carrier tones. The relation between the transmitted power (
), the received power (
), and the distance between transmitter and receiver (
d) is determined as
. The parameter
is an adjustment factor estimated as
based on different positions between the LED and photodetector for different distances. For example, in simulated conditions the LED is placed in a fixed position. Whereas the position of the photodetector changes; therefore, the received power varies according to its position. The parameter
is determined by knowing the transmitted power, received power, and the distance between the transmitter and receiver. Hence, the diameter
d is estimated based on the calculated power in the position of the photodetector, which is the diameter of the sphere centralized in the location of the LED. The parameter
d should be calculated separately for all three LEDs to allow the plotting of the three spheres with the LEDs centering and their intersections, which is considered as the location of the photodetector. The most important challenge is the calculation of the intersection between the three spheres. This intersection can be find by writing the mathematical formulation of each sphere based on Cartesian coordinates
and finding the intersection. The center of the (1st) sphere is considered as the reference point, whereas the two other spheres are located in the same plane as the (1st) sphere to have the coordinate
z as
. This is the basic assumption for the simplification of the localization process. Whereas for the general case, the spheres are not in the same plane. Then, a coordinate transform system is needed to solve the problem, and finally we need another transformation to come back the original coordinate. The basic assumption assumed in this manuscript is used to simplify the coordinate transformation. For this simplified version, the (1st), (2nd), and (3rd) spheres are centered at
,
, and
, respectively. Then, the mathematical formulation of the three spheres is expressed as follows:
The
x value can be calculated based on
,
, and
d by subtraction of the first and second equation as follows:
If the obtained
x value is substituted in the equation for the first sphere, then:
It is clear from Equation (
18) that the intersection between two spheres is a circle with radius as follows:
By considering
, and substituting it in the expression of the third sphere, the
y value is determined as:
Finally, the
z value is calculated by substituting the
x and
y values in the equation for the first sphere as:
The final result appears as the intersection between this circle (obtained by the intersection between (1st) and (2nd) sphere), and the (3rd) sphere. If the (3rd) sphere touches this circle in just one point,
is considered for this condition. If the intersection between the circle and sphere is two points, the root of the positive value in Equation (
21) is selected. At the end, if this circle is bigger or smaller than the sphere that appears inside or outside of the sphere (without any intersection), this problem does not have any solution and it is considered as an error of the environmental noise. A (4th) LED can be considered to prevent this condition, which triples the possible combination of spheres (
,
,
, and
) to solve the problem. Further, when we have two intersections between the circle and sphere, one point can be eliminated (outside of the room dimension) by evaluating the size of the room.
5. Results and Discussion
This section shows the performance of the proposed system in terms of location estimation error. Within the simulations, a total of 100 repetitions for three different scenarios to be estimated were randomly generated following a uniform distribution. The localization estimation error is calculated based on the averaged euclidean distance between the estimated and real location as:
where
is the real location of the photodetector (miner) and
is the estimated location.
Simulation param are summarized in
Table 1. The dimensions of the tunnel and the positions of the transmitters were chosen to generate a coherent simulation space. The tunnel dimension is selected as (5, 5, 5) m. Also, the transmitted power for all three LEDs and the filter gain are determined as 70 W and 1, respectively. The characteristics of the LEDs, as well as the photodetector were obtained from the different technical data-sheets [
10,
44,
45]. The simulations were done in three different scenarios (photodetector and LEDs locations). The position of the LEDs and photodetector are also shown in
Table 1 for the three scenarios.
The transmitters (LEDs) are located on the ceiling, whereas the receiver (photodetector) is located within the tunnel. The LOS channel model is considered for the VLC system between the transmitter and receiver. The Lambertian model with mode number equal to 1 is used for simulations in this paper. The semi angle for half power is selected as
for the LEDs and photodetector. Further details of the param used in the simulation are found in
Table 1.
Based on the proposed method, the channel impulse responses are calculated between LEDs and the photodetector. Then, a convolution between these impulse responses and the signals to be transmitted by the LED is done. The received signal by the photodetector is the superposition of three LED signals with their respective channel impulse responses. The frequencies of the three carrier tones for the LEDs are selected as (3.5 MHz), (8.5 MHz) and (13.5 MHz), respectively. The FIR band pass filters (BPFs) are designed in the photodetector side with bandwidths of (2.5–4.5 MHz), (7.5–9.5 MHz), and (12.5–14.5 MHz), respectively to separate the carrier tone of each LED. Then, the received powers are calculated for each filtered signal based on the proposed algorithm to estimate the d param as the diam of spheres with powers and .
Three spheres are plotted based on the estimated
d param and by centering the LEDs locations based on the proposed method. Then, the
x,
y, and
z param are calculated based on Equations (
17), (
20) and (
21), respectively. Sometimes there are two estimated values for the
z parameter, and the value that corresponds to the dimensions of the tunnel is selected. Generally the other value does not correspond to the dimensions of the tunnel. If both
z values are with the dimensions of the tunnel, the algorithm considers the next time frame to eliminate this error.
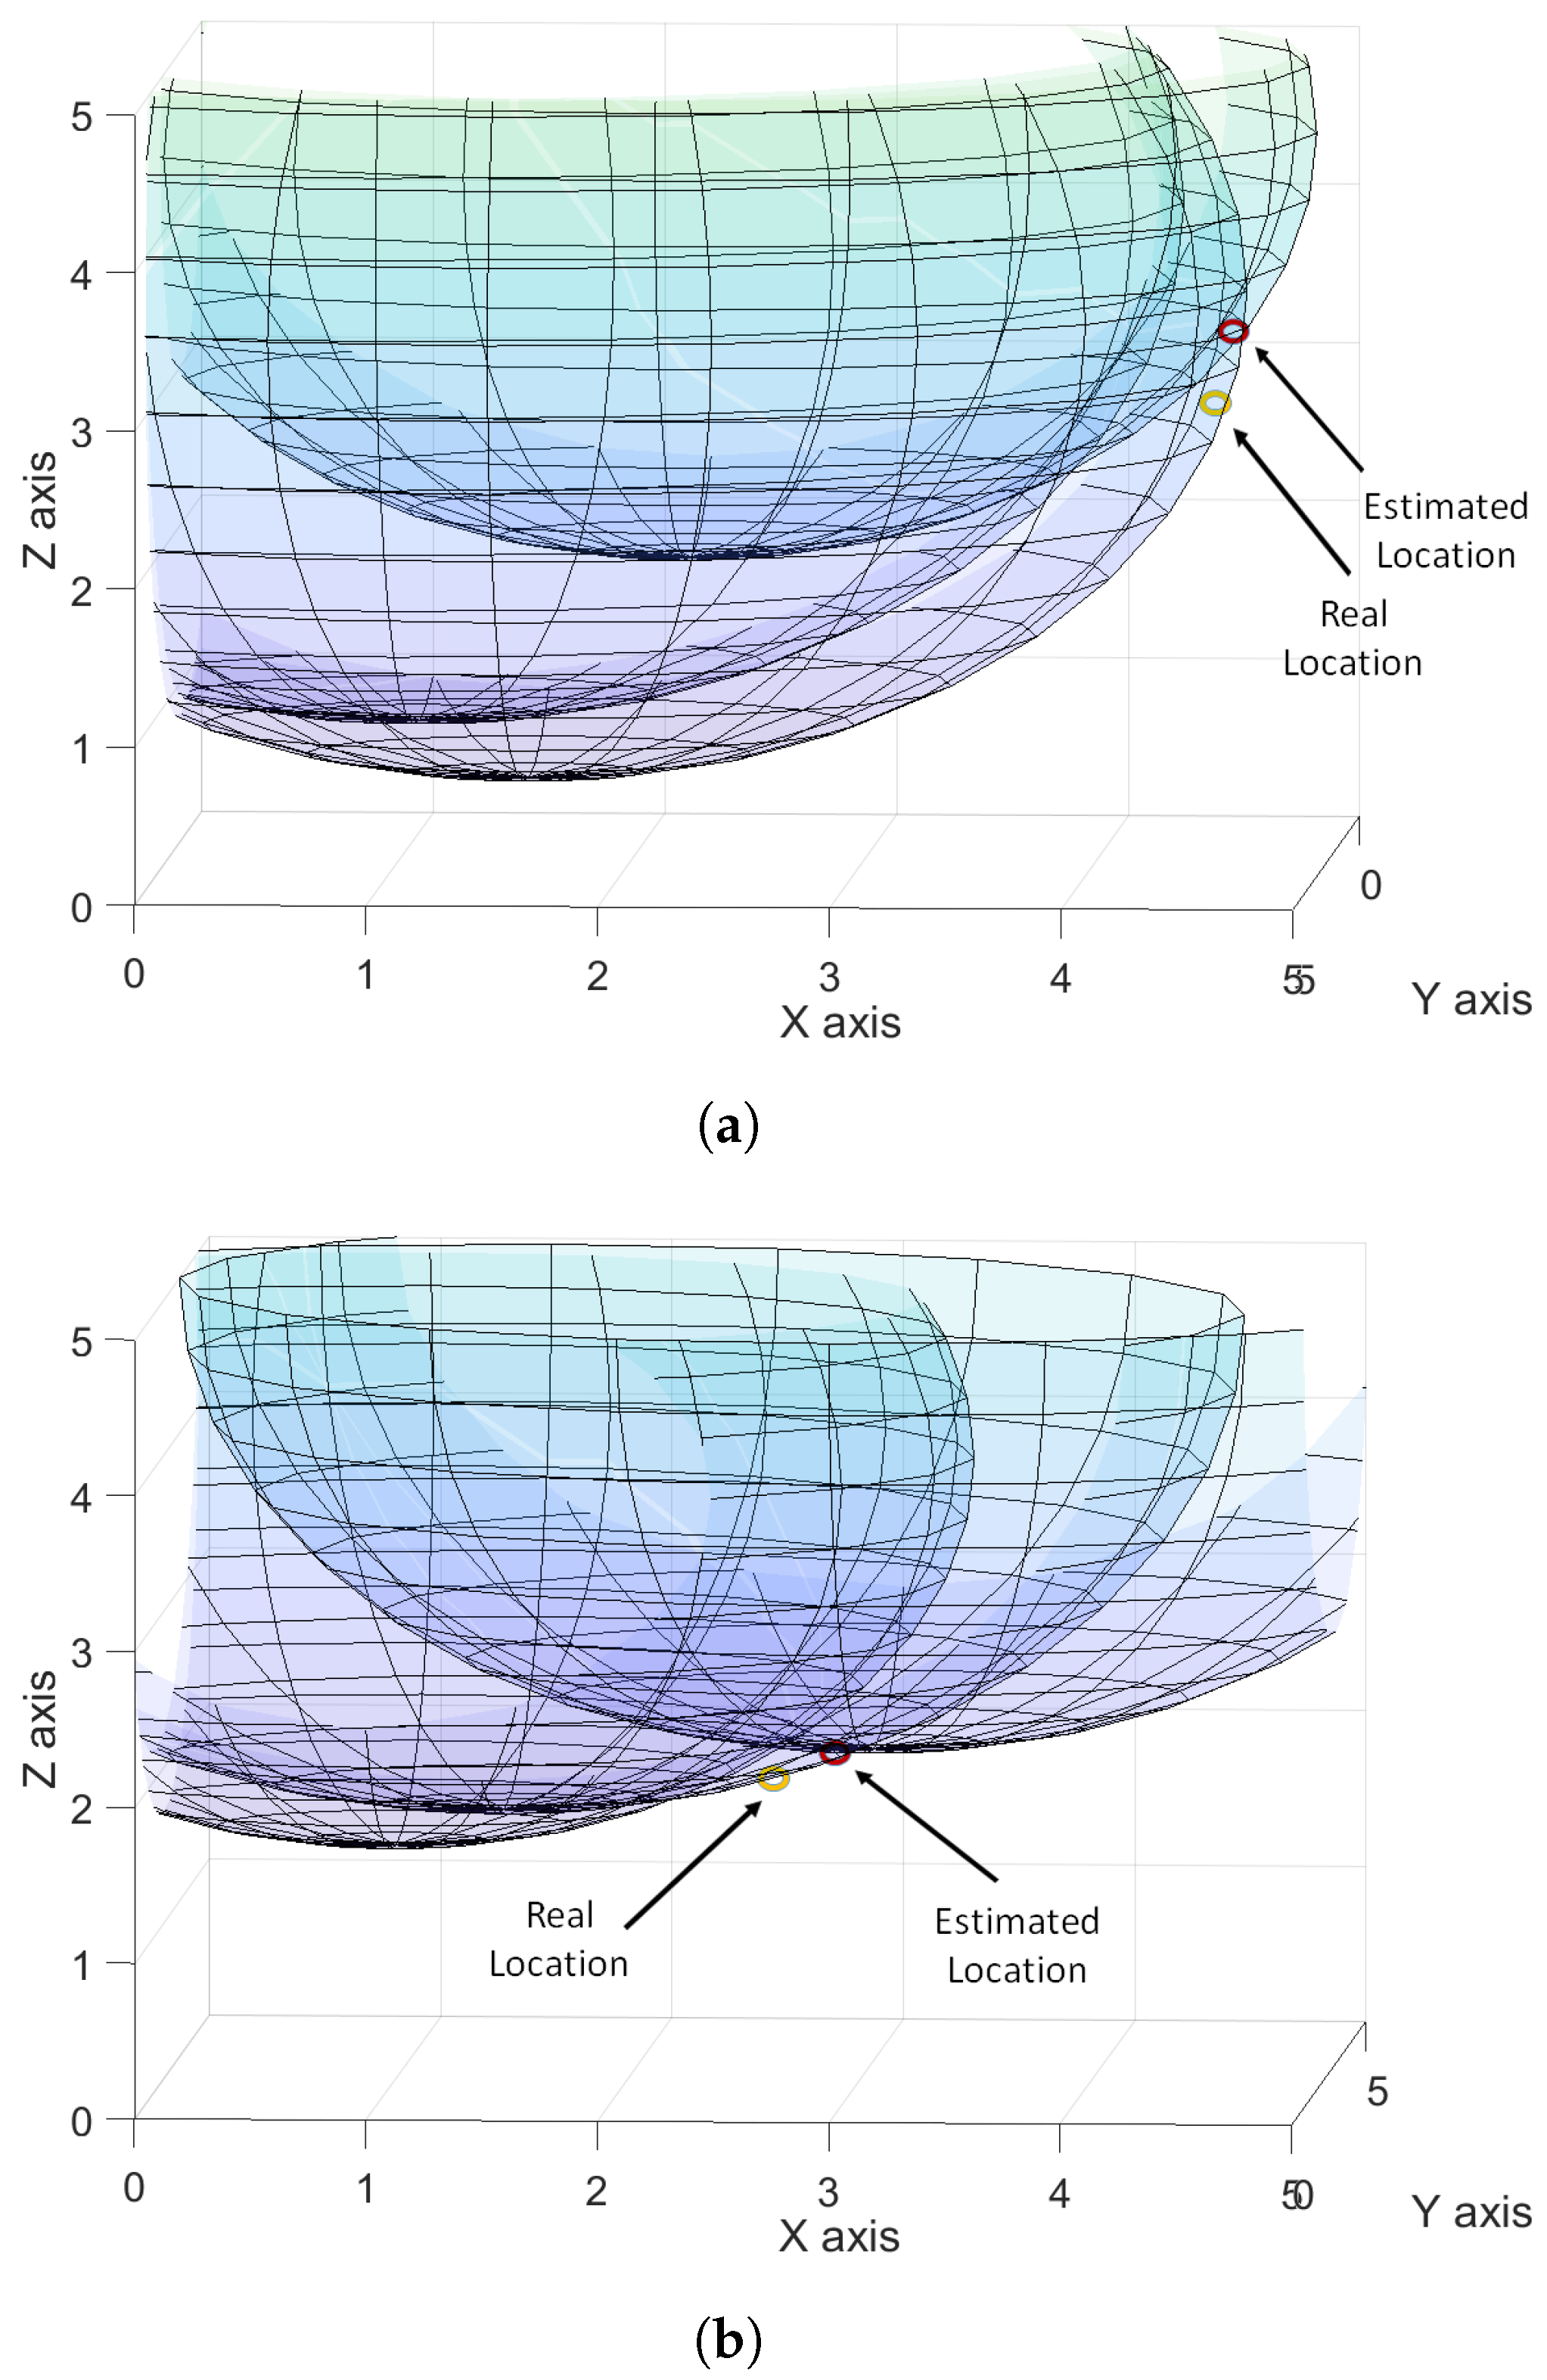
As seen in
Table 1, there are three scenarios in the simulation. In the first scenario, the location of the photodetector is selected in a corner and it is far away from the LEDs. It receives enough power just from one LED, but does not receive enough power from the two other LEDs. This generates a large localization estimation error equal to (16.4 cm). This is the averaged error value for 100 algorithm repetitions. The second scenario is related to the photodetector position closer to two LEDs and far away from the third LED. Then, it receives enough power from two LEDs and less power from the other LED. The averaged localization error is better than the first scenario, and it is equal to (10.6 cm). The last scenario is for the photodetector exactly located behind and close to the three LEDs; hence, the photodetector receives enough power from the three LEDs. Therefore, the estimated spheres and
d param are more accurate and the localization error is better than the two other scenarios. The averaged localization error is dependent on the power emitted by the LED, and by the distance between LEDs and photodetector. For the cases when the photodetector is far away from the LEDs, then it receives less power and the localization error is high. But for the condition in which the photodetector is closer to the LEDs, it receives more power and the localization error is lower.
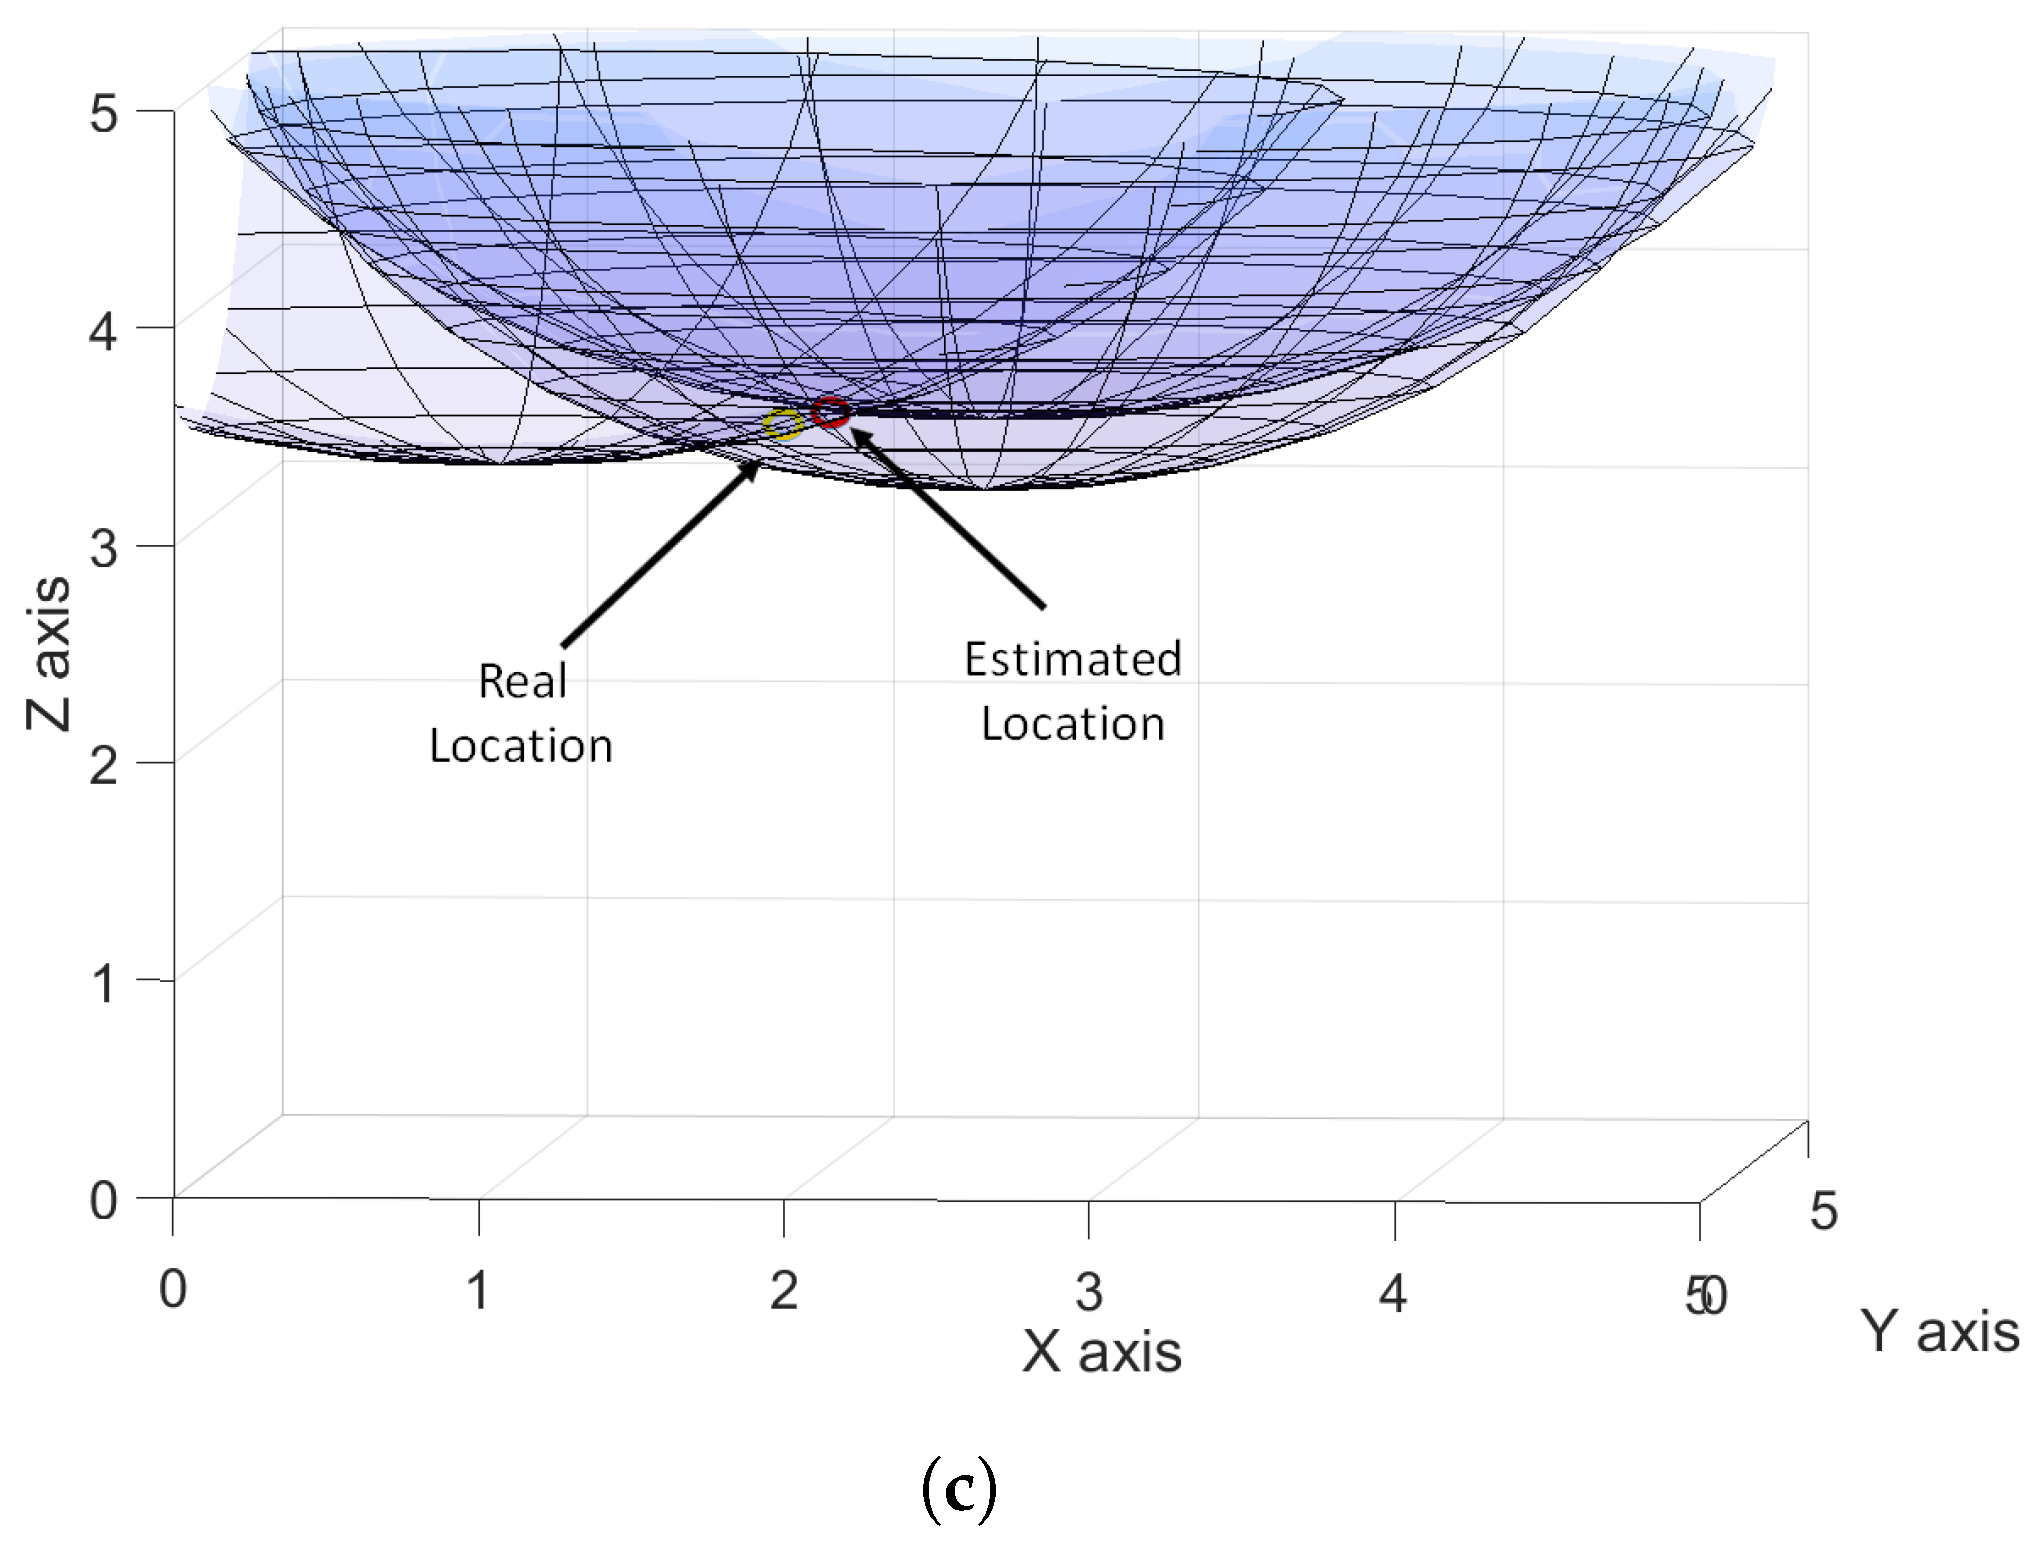
Figure 5 shows the intersection between these three spheres for the evaluated scenarios. This figure has been plotted for three scenarios. Also, the intersection between three spheres is specified in this figure. As seen, when the photodetector place is far from the LEDs position, the estimated location is farther away from the real location. When the photodetector is closer to the LEDs, the real and estimated locations are almost identical.
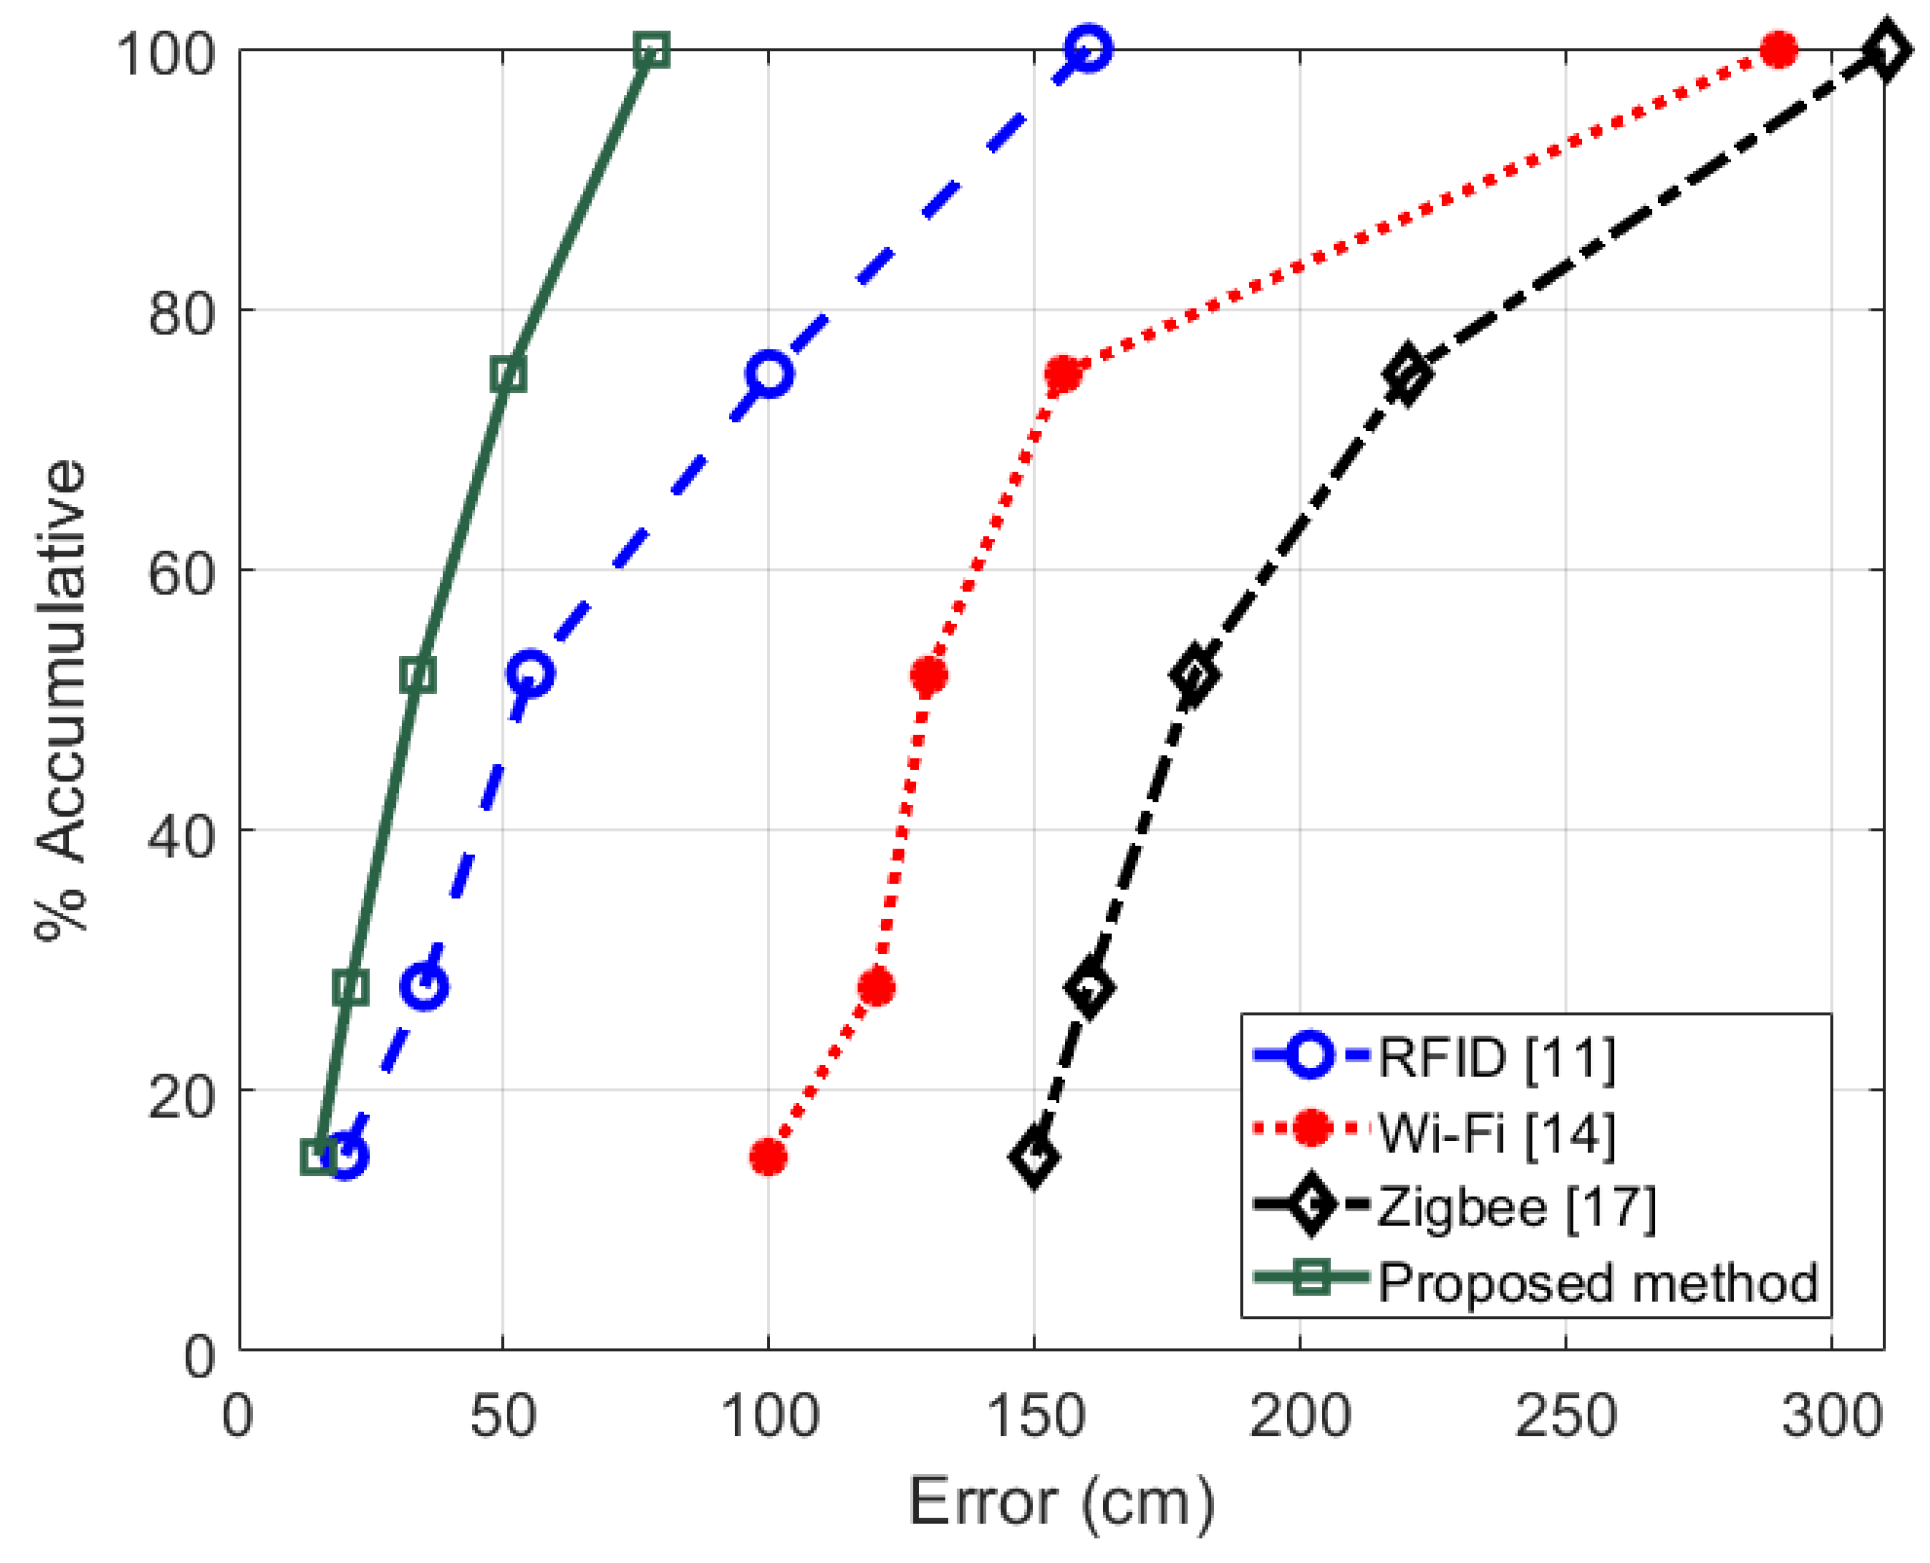
Figure 6 shows the performance of the proposed system and the traditional radio frequency technologies normally used for localization in underground mining in terms of the average localization estimation error. In general, the proposed system completely outperforms other traditional RF technologies. The average localization error for the proposed system is just (10 cm), and
of the time the localization error does not exceed (20 cm). That is to say, only
of the time the system generates an error of more than (20 cm).

 ,
, 


