Abstract
Maintaining nitrate-N and orthophosphate (dissolved reactive phosphorus) concentrations in a water sample over time is critical for water quality research. This study investigated the ability of current preservation methods to maintain nitrate-N and orthophosphate concentrations in environmental water samples over a period of up to 14 days. The United States Environmental Protection Agency (US EPA) currently recommends adding sulfuric acid for nitrate-N and filtering the water sample at the time of collection for orthophosphate. This study compared these recommended methods to baseline control concentrations in subsurface tile drainage water, pond water, and stream water. In addition, sodium omadine was tested as a potential alternative preservative. Across the three sources of water tested, sulfuric acid was the most reliable preservation method for both nitrate-N and orthophosphate, with percent changes from the baseline concentrations on Day 14 ranging from 2.30–3.27% for nitrate-N and 1.94–8.48% for orthophosphate. The control samples also maintained the baseline concentrations quite well, with percent changes on Day 14 ranging from 0.09–6.68% for nitrate-N and 2.63–11.87% for orthophosphate. When sodium omadine was added to the water samples, the nitrate-N concentrations had percent changes of 0.13–6.10% from the baseline concentration on Day 14. In contrast, sodium omadine was less effective for maintaining orthophosphate concentrations, with percent changes of 8.86–13.06% from the baseline concentration on Day 14. However, there were no significantly different orthophosphate concentrations when sodium omadine was added to stream water, showing a promising alternative for this scenario. Depending on the objective, researchers may need to consider the source water and length of storage of water samples to determine what, if any, preservative is necessary.
1. Introduction
Water quality monitoring at remote field sites often entails the collection of water samples using automated water samplers and periodic retrieval of the water samples for laboratory analysis. Therefore, one of the most important issues for researchers dealing with water monitoring is how to preserve water samples while stored in the automated water sampler while awaiting retrieval. Water quality parameters that have the potential to change over time include nitrate-N and orthophosphate. The United States Environmental Protection Agency (US EPA) suggests methods to help obtain an accurate reading of concentrations in water samples. This includes preserving the sample immediately after on-site collection by placing samples in cool temperatures, adding chemical solutions, or altering the pH of the sample [1]. The US EPA recommended methods for preserving water samples for nitrate-N and orthophosphate are listed in Table 1.

Table 1.
United States Environmental Protection Agency (US EPA) water sample preservation methods [1].
These preservation methods slow factors that can lead to changes in water quality concentrations. By limiting biological activity, chemical hydrolysis, and absorption effects [1], there can be a longer time delay between collecting the sample and analyzing it. Several chemical and physical interferences have been used as potential preservation methods. The most traditional forms include chemical addition, pH control, freezing, and refrigerating the sample [1]. For example, chloroform has been explored as a preservation but produced erratic results for both nitrate-N and orthophosphate, with large increases in concentrations occurring between eight and 16 days after preservation was initiated [2,3].
One of the main challenges with preservation methods is length of time when the sample is stabilized, or preserved. There is often only a short period of time before concentrations within the sample begin to change. For example, in a study where water samples were not filtered immediately after collection (10-day delay) and then stored in refrigerated conditions for 107 days, both nitrate-N and orthophosphate showed significant increases, by as much as a 3.7-fold increase for nitrate-N and a 1.8-fold increase for orthophosphate [4].
In other studies [5,6], it was determined that, while methods such as those listed in Table 1 can be effective for one target parameter, it is difficult, if not impossible, to find a method that is effective for preserving multiple parameters. The variability in concentrations within a water sample over time can be caused by factors like location, chemical make-up of the water, and the microbiology of the water. As a result, the ultimate problem with a universal preservation method is there are too many variables that can influence changes. These variables lead to difficulty in finding a perfect preservation method that holds all water quality levels constant [7]. The US EPA; therefore, recommends preservation methods for different parameters to make testing as reliable as possible. However, even with these techniques, there is still a possibility of fluctuating measurements.
Some studies have tested current preservation methods, like freezing, acidification by sulfuric acid, refrigeration, and regular storage-affected nitrogen and phosphorus levels, and then compared the abilities of these methods to maintain concentrations [8,9,10,11,12,13,14,15]. A study using tile drainage water, river water, and surface runoff water in Indiana found that freezing at subzero temperatures was the best overall method for preserving water samples for orthophosphate and nitrogen (nitrate-N and ammonium) [8]. However, filtering of the water sample may be needed if the sample contains high levels of sediment. In contrast, a study found that while refrigeration and filtration were necessary, acidification was the most effective preservation method for nitrate-N [9]. Sulfuric acid can serve as a sufficient preservative for maintaining nitrate-N and total N concentrations for up to seven days [10], but may be unsuitable for samples containing high concentrations of nitrite because sulfuric acid can cause the chemical conversion to nitrate [11]. Furthermore, a study in California, USA, found that long-term freezing can serve as a viable method, as it did not have a significant effect on concentration [12]. A study looking at samples from Lake Ontario found that storage at 4 °C produced variable results, with orthophosphate concentrations decreasing by as much as 13% and nitrate-N by as much as 7% after eight days [13]. In contrast, a study in New York found that soil water samples maintained stable nitrate-N concentrations for at least one week, with only slight changes after three to 16 weeks of storage at 4 °C [14]. A study by Maher et al. [15] looked at using slow freezing in addition to chemicals. This study determined that, while room temperature storage can be used for a short period of time, there needs to be an additional preservation method.
Sodium omadine is traditionally used as a preservative or additive in manufacturing materials and process fluids. In 1968, the chemical was registered originally as a biocide to reduce the growth of bacteria and fungi in various industrial products. Today, these products include lubricants, latex products, and various cleaners. It has not been used as a preservative for water-based chemicals, or for water concentrations [16]. Since there has been no study focusing on sodium omadine in preserving nitrate-N and orthophosphate levels in water samples, this will be the first study to determine the impacts this chemical has.
This research is significant because it (1) compares existing recommended preservation methods for water samples containing both nitrate-N and orthophosphate, and (2) looks at a new preservation option that has not been previously used for this purpose. This study mimics water monitoring that includes collecting samples from a field site, using an automated water sampler and retrieving the samples up to 14 days after initial collection.
The objective of this study is to determine the impact of three different preservation methods on nitrate-N and orthophosphate concentrations: (1) Filtration, as it is the US EPA recommended method for preserving water samples for orthophosphate; (2) addition of sulfuric acid to the water sample, as this is the US EPA recommended method for preserving water samples for nitrate-N; and (3) addition of sodium omadine to the water sample, as a possible alternative to currently recommended methods.
2. Materials and Methods
Since water types vary by source and location, three different source waters were collected and used in this study: (1) Tile water from an agricultural production field in Crawford County, IL, USA; (2) pond water collected from a retention basin on near the intersection of Windsor Road and First Street in Champaign, IL, USA; and (3) stream water from the Embarras River just south of Urbana, IL, USA. A five-gallon bucket was used to collect water from each location. The source water samples were refrigerated upon collection.
Additional measurements were taken to determine the pH, turbidity, and conductivity of each source water. To test the pH of the water samples, an Oakton pH/mV/°C/°F meter (Oakton Instruments, Vernon Hills, IL, USA) was used after standard calibration was completed using pH standards. For turbidity testing, the Hach DR 900 colorimeter (Hach, Loveland, CO, USA) was used. To measure turbidity, 10 mL of the sample was transferred to a smaller vile where it was then shaken and placed into the colorimeter. Conductivity was measured using the Hach Pocket Pro Tester (Hach, Loveland, CO, USA). The device was calibrated using the Singlet Conductivity Solution, which consisted of KCI 12.88 mS/cm Standard Solution at 25 °C.
To ensure detectable concentrations of nitrate-N and orthophosphate, all source water was spiked with 10 ppm nitrate-N and 1 ppm orthophosphate. A 100 mL volume of the spiked source water was distributed into a 125 mL Nalgene bottle, labelled with corresponding names for the source water, time-period to be tested, and which preservation method was used.
After the source water was distributed into the bottles, the respective preservation method was applied to each sample. The control for each water source received no preservation. The samples receiving sulfuric acid received 0.2 mL of sulfuric acid in each 100 mL sample. The samples receiving sodium omadine received 0.25 mL of sodium omadine in each 100 mL sample. The bottles were capped and distributed into three automated water samplers, separated based on water source, in the shaded area adjacent to the Agricultural Engineering and Sciences Building at the University of Illinois at Urbana-Champaign (Figure 1), to mimic outdoor field conditions without refrigeration. Nitrate-N and orthophosphate concentrations were measured on the following time points: Day 0 (when the respective preservation method was applied to the samples), Day 0.5, Day 1, Day 2, Day 5, Day 7, and Day 14 after preservation, resulting in seven time points. Each sample was prepared and analyzed in triplicate.
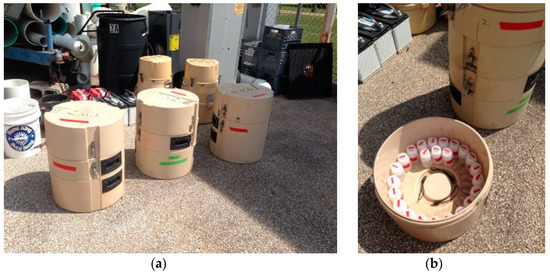
Figure 1.
Autosamplers holding the samples, separated by water source. (a) autosamplers, with enclosures, used in this study; (b) inside of autosampler carousel that housed sampling bottles.
At each time point, the corresponding samples were taken from the autosamplers into the lab. The control samples as well as those receiving sulfuric acid and sodium omadine were immediately placed in the freezer. The filtered samples from each water source were filtered by pouring the water sample through a 0.45 µm filter on top of an Erlenmeyer flask (Figure 2). A vacuum was used to expedite the filtration process. Upon completion of filtration, samples were placed in the freezer. At the completion of the 14 days, all samples were thawed and analyzed for nitrate-N and orthophosphate.
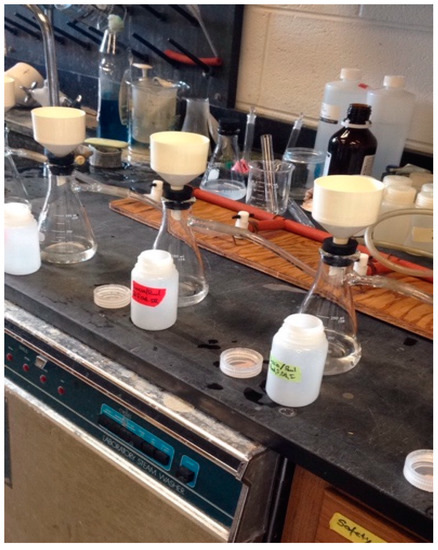
Figure 2.
Filtering set up.
2.1. Nutrient Analyses
Nutrient analyses were completed by the Water Quality Laboratory in the Department of Agricultural and Biological Engineering at the University of Illinois, Urbana-Champaign, USA. The acidity of each sample was first tested and adjusted accordingly. This type of adjustment was only performed on the sulfuric acid preservation samples. Samples were then analyzed for nitrate-N using the automated hydrazine reduction method (Standard Methods 4500-NO3-H, National Environmental Methods Index) and for orthophosphate using the ascorbic acid reduction method (Standard Methods 4500-P-F, National Environmental Methods Index). Spiked samples, duplicate samples, and standard solutions were incorporated into nutrient analyses for quality control.
2.2. Statistical Analysis
Differences between the treatments were analyzed for significance using a one-way analysis of variance (ANOVA) with post-hoc Tukey honestly significant difference (HSD) for comparing multiple treatments. When sample sizes were unequal, the Tukey–Kramer method was used.
3. Results and Discussion
3.1. Source Water Characterization
The three source waters were chosen to represent a range of types of water in the Midwestern US. The pH, conductivity, and turbidity of each source water were measured and are shown in Table 2.
Table 2.
Water source characterization for each water source.
The pH of the pond water was approximately 8% higher than the tile water and approximately 1.5% higher than the stream water. The pond water had a 78% and 63% higher conductivity than tile or stream water, respectively. The pond water had the highest turbidity, 3.25 times and 4.3 times greater than tile and stream water, respectively.
3.2. Nutrient Concentrations from Preserved Samples
Nitrate-N and orthophosphate analyses were completed for seven time points ranging from time zero to 14 days.
3.2.1. Nitrate-N Results
The nitrate-N concentrations are presented along with the percent change from the baseline concentration in Table 3. The baseline concentration is the concentration of the spiked source water, receiving no preservation, at time zero. The high and low daily temperatures are also presented for each of the time points collected. Nitrate-N concentrations are graphically presented in Figure 3, with error bars to represent the standard deviation from the mean of the three samples at each time point and for the respective preservation method.
Table 3.
Daily high and low temperature that water samples were exposed to, as well as the nitrate-N concentrations and % change from the baseline concentration. The baseline concentration is the Day 0 Control for each water source.
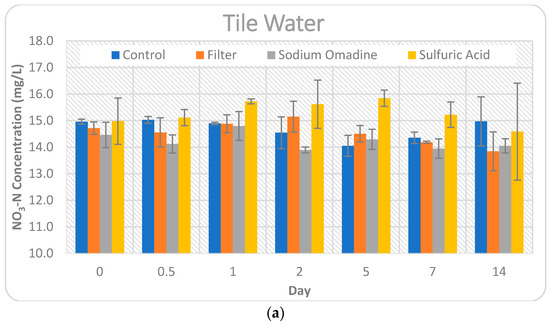
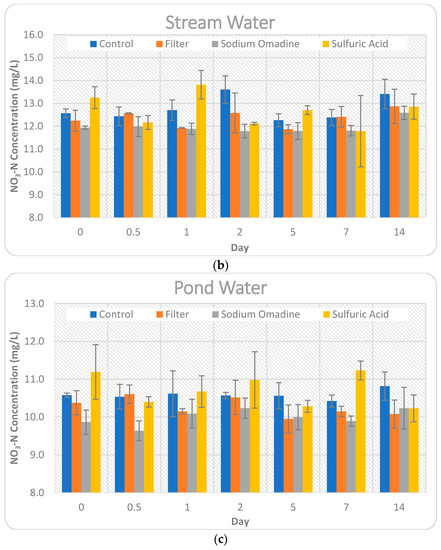
Figure 3.
Comparison of the impact of the four preservation methods on nitrate-N concentrations for Day 0–14. Error bars represent +/− one standard deviation from the mean. Note the y-axis values are not the same for each water source for visual clarity. (a) Tile water; (b) Stream water; (c) Pond water.
The high and low daily temperatures remained quite consistent throughout this study. The control treatment for tile water, which received no preservation, maintained the nitrate-N concentration quite well for the 14-day period. At the end of the study period, nitrate-N showed only a very slight increase (0.09%) in concentration. However, there was a greater variation throughout the 14 days. Nitrate-N concentrations tended to decrease, by as much as 6.07% on Day 5, showing that some heterogeneity in individual samples existed and denitrification could have impacted the stability of the samples, as microbial activity was not inhibited. The control treatment for pond water was also quite stable, showing a 2.27% increase in nitrate-N concentration at the end of the 14-day period, with only slight variations (0.06–1.44%) throughout the period. Stream water showed the highest change in nitrate-N concentration for the control treatment, increasing by 6.68% at the end of the 14-day study period.
The filtered treatment for the tile water showed the largest Day 14 change (7.47% decrease) of any preservation method and water source tested in this study. Since the concentrations all decreased relative to the baseline, except for Day 2, it is possible that denitrification was occurring, as the sample was non-preserved up until the time of collection, at which time it was filtered. The filtered pond water showed a similar trend as the tile water. All nitrate-N concentrations decreased, with the exception of Day 0.5. In the case of the pond water, processes like adsorption to particulate matter may have caused variation in addition to denitrification, since the pond water had the highest conductivity and turbidity of the three source waters tested in this study. The filtered stream water held the baseline concentrations the best of the three source waters, with a 2.38% increase in nitrate-N concentration on Day 14. All time points, except Day 2 and Day 14, showed a decrease in concentration for the stream water. The tendency of concentrations to decrease with the filtration method is in contrast to other studies, where nitrate-N concentrations increased by as much as 3.7-fold when samples went unfiltered for 10 days [4].
The sulfuric acid preservation method is intended to eliminate microbial activity and lower the pH to less than two. Therefore, processes like denitrification or immobilization should not have impacted nitrate-N concentrations for this method. With the exception of Day 14, the tile water concentrations all increased. This increase could be due to organic and particulate matter being broken into soluble forms of nitrogen from the sulfuric acid. Additional soluble nitrogen, in the form of nitrate-N, would then cause an increase in concentration, but would not be represented in the initial concentration of nitrate-N at Day 0. The concentrations for both pond and stream water were variable, increasing by as much as 9.92% on Day 1 for stream water and decreasing by as much as 6.25% on Day 7 for stream water. Overall, the findings in this study are in agreement with other studies that found sulfuric acid to be a sufficient preservative for nitrate-N for up to seven days [10]. However, this study indicates suitability of sulfuric acid to preserve samples for up to 14 days.
Sodium omadine is a salt that had not been previously studied for preservation of nitrate-N in water samples. Day 0 showed decreases in nitrate-N concentrations, ranging from 3.35% for tile water to 6.72% for pond water. This immediate decrease in concentrations shows an instant reaction in the water sample that is impacting the stability of nitrate-N. Every time point for all three source waters showed a decrease in nitrate-N for the sodium omadine preservation method, with the exception of Day 14 for stream water, which showed a slight increase of 0.13%. Table 4 compares the nitrate-N concentrations over time and presents significant differences (p < 0.05) between the concentration on each day and the baseline concentration.
Table 4.
Significant differences between methods for nitrate-N measurement were calculated using Tukey honestly significant difference (HSD) method and the p-values are presented for each treatment comparison and day. Significant differences (p < 0.05) are highlighted in yellow for convenience.
It is noteworthy that the control samples were not significantly different from the baseline concentration for any of the source waters or time points tested. Meanwhile, there were significant differences between the three preservation methods and the baseline concentration. For the sulfuric acid preservation method, there was a significant difference for the pond water on Day 7 (p = 0.003) and for the stream water on Day 1 (p = 0.014). The filtered samples were significantly different from the baseline concentration on Day 7 of the tile water (p = 0.044) and pond water (p = 0.046). The samples containing sodium omadine were significantly different from the baseline concentration on Day 7 of the tile water (p = 0.019), Days 0.5 and 7 of the pond water (p = 0.003 and 0.002, respectively), and Day 5 of the stream water (p = 0.032). The addition of sulfuric acid is the US EPA recommended preservation method for nitrate-N. There was no significant difference from the baseline concentration for tile water, and only one instance each of when it was different for the pond and stream water. Therefore, sulfuric acid proved to be a reasonably good preservation method for nitrate-N over a period of 14 days. While the addition of sodium omadine showed some ability to maintain nitrate-N concentrations, it did not perform as well as the addition of sulfuric acid or the control.
3.2.2. Orthophosphate Results
The orthophosphate concentrations are presented along with the percent change from the baseline concentration in Table 5. Again, the baseline concentration is the concentration of the spiked source water at time zero. The high and low daily temperatures are also presented for each of the time points collected. Orthophosphate concentrations are graphically presented in Figure 4, with error bars to represent the standard deviation of the three samples at each time point and for the respective preservation method.
Table 5.
Daily high and low temperature that water samples were exposed to, as well as the orthophosphate concentrations and % change from the baseline concentration. The baseline concentration is the Day 0 Control for each water source.
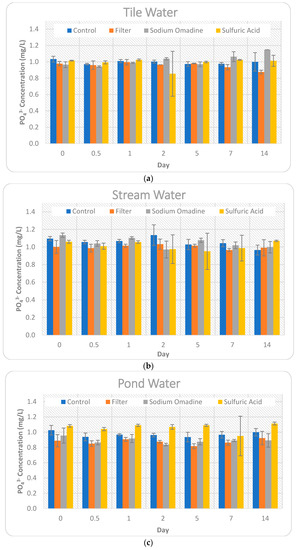
Figure 4.
Comparison of the impact of the four preservation methods on orthophosphate concentration for Day 0–14. Error bars represent +/− one standard deviation from the mean. (a) Tile water; (b) Stream water; (c) Pond water.
For orthophosphate, the baseline concentration was approximately 1 ppm. Therefore, the slightest variation in concentration resulted in a large percent difference from the baseline. It is important to consider this when determining what is an acceptable change in concentration for a given research study objective.
The control treatment maintained relatively constant orthophosphate concentrations for all three source waters. Stream water showed a large decrease (11.87%) on Day 14, but much smaller variations (2.56–6.12%) leading up to Day 14.
The filtered treatment showed decreases in orthophosphate concentrations for every time point and large variations between source waters on Day 14, ranging from a 9.50% decrease for stream water to a 15.30% decrease for tile water. Processes like adsorption and immobilization may have converted some portion of the orthophosphate into particulate forms, which would have been removed by the filtering process and caused a decrease in concentrations. Similar to the nitrate-N findings, the consistent decrease in orthophosphate concentrations is in contrast to other findings where orthophosphate concentrations increased by as much as 1.8-fold when samples were left unfiltered for 10-days [4].
As discussed previously, the sulfuric acid preservation method is intended to eliminate microbial activity. Therefore, processes like mineralization or immobilization should not have impacted orthophosphate concentrations for this method. While the sulfuric acid treatment had large variations in orthophosphate concentrations throughout the 14 days of study, it performed quite well on Day 14 for both tile water (1.94% decrease) and stream water (2.37% decrease). The decreasing concentrations for the sulfuric acid method are in contrast to the findings from Fishman et al. [3], who found that orthophosphate concentrations increased by as much as 68% when sulfuric acid was used as a preservative. Pond water showed an 8.48% increase, which is a greater change from the baseline concentration than the control, but a smaller change than the filtering or sodium omadine treatments.
Similar to the nitrate-N results, orthophosphate showed an initial reaction with the sodium omadine, with tile water and pond water decreasing by 6.58% and 6.82%, respectively. Stream water showed a Day 0 increase in orthophosphate concentration of 3.56%. By Day 14, the sodium omadine treatment concentrations had increased by 11.13% for the tile water and decreased by 8.86% and 13.06% for the stream water and pond water, respectively. Table 6 compares the orthophosphate concentrations over time and presents significant differences (p < 0.05) between the concentration on each day and the baseline concentration.
Table 6.
Significant differences between methods for orthophosphate measurement were calculated using Tukey HSD method and the p-values are presented for each treatment comparison and day. Significant differences (p < 0.05) are highlighted in yellow for convenience.
The orthophosphate concentrations were only different from the baseline on Day 5 of the tile water (p = 0.028) and Day 2 of the pond water (p = 0.022) for the Control. When filtering of the samples occurred, the orthophosphate concentrations were different for eight different time points across the three source waters. The addition of sulfuric acid only produced a concentration that was significantly different from the baseline concentration on Day 0.5 of the stream water (p = 0.037). The addition of sodium omadine was not significantly different than the baseline concentration for any time point of the stream water, but was different for six of the 14 time points of the tile and pond water. The addition of sulfuric acid was the best performing method for preserving orthophosphate over the full 14-day period in this study. The addition of sodium omadine was quite good at preserving stream water samples, but significantly varied for several time points for tile and pond water samples. While filtering is the US EPA recommended preservation method for orthophosphate in water, it was significantly different from the baseline concentration for more sampling points than the other methods.
3.3. Summary of Findings
This study compared currently recommended preservation methods in order to assist with studies that are not able to analyze samples immediately after collection. In practice, this study investigated the effectiveness of currently recommended methods for preserving samples collected by automated water samplers at remote field sites. This type of scenario prevents filtering from occurring until a person arrives onsite to retrieve samples. A new method of adding sodium omadine to the water samples was also investigated. By comparing the three different source waters and three different preservation methods, it is apparent that the addition of sulfuric acid is the most consistent for preserving both nitrate-N and orthophosphate and for all three source waters, significantly differing from the baseline concentration for only two time points for nitrate-N and only one time point for orthophosphate. In addition, the percent changes from the baseline on Day 14 were the smallest, ranging from 2.30–3.27% for nitrate-N and 1.94–8.48% for orthophosphate. However, it is worth noting again that the control samples maintained the baseline concentrations quite well for all source waters and time points tested. When sodium omadine was added to the water samples, the nitrate-N concentrations were only significantly different from the baseline concentration for four time points for nitrate-N. In contrast, sodium omadine was less effective for maintaining orthophosphate concentrations. Orthophosphate concentrations were significantly different from the baseline concentration for two time points for tile water and four time points for pond water. However, there were no significantly different orthophosphate concentrations when sodium omadine was added to stream water, showing a promising alternative for this scenario. The findings from this study show that if water samples need preservation for both nitrate-N and orthophosphate, the addition of sulfuric acid is the most effective method. However, if a study only needs to preserve stream water for nitrate-N, for example, sodium omadine may be the best option (0.13% change from baseline on Day 14). When possible, preliminary experiments should be conducted with a source water of interest to determine if preservation is necessary. Adding a preservative when it is not necessary could cause more variation than not adding a preservative at all.
Author Contributions
Conceptualization, P.D., S.V., and L.D.; data curation, L.D.; formal analysis, P.D.; investigation, P.D. and L.D.; methodology, P.D.; project administration, P.D.; supervision, S.V.; writing—original draft, L.D.; writing—review and editing, P.D. and S.V.
Funding
This research received no external funding.
Acknowledgments
The authors thank Waterborne Environmental, Inc. for supplying the sodium omadine used in this study.
Conflicts of Interest
The authors declare no conflicts of interest.
References
- Environmental Protection Agency, Environmental Monitoring and Support Laboratory, Research and Development. Handbook for Sampling and Sample Preservation of Water and Wastewater, 82nd ed.; National Service Center for Environmental Publications: Cincinnati, OH, USA, 1983; Volume 4, pp. xv–xx.
- Rainwater, F.H.; Thatcher, L.L. Methods for Collection and Analysis of Water Samples; U.S. Department of the Interior, Geological Survey Govt. Print. Off.: Washington, DC, USA, 1960; pp. 30–32.
- Fishman, M.J.; Schroder, L.J.; Shockey, M.W. Evaluation of methods for preservation of water samples for nutrient analysis. Int. J. Environ. Stud. 1986, 26, 231–238. [Google Scholar] [CrossRef]
- Lentz, R.D. Delayed sample filtration and storage effects on dissolved nutrients measured in agricultural runoff. Commun. Soil Sci. Plant Anal. 2013, 44, 2952–2960. [Google Scholar] [CrossRef][Green Version]
- Worsfolda, P.J.; Gimberta, L.J.; Mankasingha, U.; Omakaa, O.N.; Hanrahanb, G.; Gardolinskic, P.C.; Haygarthd, P.M.; Turnere, B.L.; Keith-Roacha, M.J.; McKelvief, I.D. Sampling, sample treatment and quality assurance issues for the determination of phosphorus species in natural waters and soils. Talanta 2005, 66, 273–293. [Google Scholar] [CrossRef] [PubMed]
- Gardolinski, P.C.; Hanrahan, G.; Achterberg, E.P.; Gledhill, M.; Tappin, A.D.; House, W.A.; Worsfold, P.J. Comparison of sample storage protocols for the determination of nutrients in natural waters. Water Res. 2001, 35, 3670–3678. [Google Scholar] [CrossRef]
- Jarvie, H.P.; Withers, J.A.; Neal, C. Review of robust measurement of phosphorus in river water: Sampling, storage, fractionation and sensitivity. Hydrol. Earth Syst. Sci. 2002, 6, 113–131. [Google Scholar]
- Klingaman, E.D.; Nelson, E.D. Evaluation of methods for preserving the levels of soluble inorganic phosphorus and nitrogen in unfiltered water samples. J. Environ. Qual. 1976, 5, 42–46. [Google Scholar] [CrossRef]
- Kotlash, A.R.; Chessman, B.C. Effects of Water Sample Preservation and Storage on Nitrogen and Phosphorus Determinations: Implications for the Use of Automated Sampling Equipment. Water Res. 1998, 32, 3731–3737. [Google Scholar] [CrossRef]
- Burke, P.M.; Hill, S.; Iricanin, N.; Douglas, C.; Essex, P.; Tharin, D. Evaluation of preservation methods for nutrient species collected by automatic samplers. Environ. Monit. Assess. 2002, 80, 149–173. [Google Scholar] [CrossRef] [PubMed]
- Howe, L.H.; Holley, C.W. Comparisons of mercury(II) chloride and sulfuric acid as preservatives for nitrogen forms in water samples. Environ. Sci. Technol. 1969, 3, 478–481. [Google Scholar] [CrossRef]
- Avanzino, R.J.; Kennedy, V.C. Long-term frozen storage of stream water samples for dissolved orthophosphate, nitrate plus nitrite, and ammonia analysis. Water Resour. Res. 1993, 29, 3357–3362. [Google Scholar] [CrossRef]
- El-Shaarawi, A.H.; Neilson, M.A. Changes in nutrient levels of lake water stored at 4C. Can. J. Fish. Aquat. Sci. 1984, 41, 985–988. [Google Scholar] [CrossRef]
- Yorks, T.; McHale, P.J. Effects of cold storage on anion, ammonium, and total nitrogen concentrations in soil water. Commun. Soil Sci. Plant Anal. 2000, 31, 141–148. [Google Scholar]
- Maher, W.; Woo, L. Procedures for the Storage and Digestion of Natural Waters for the Determination of Filterable Reactive Phosphorus, Total Filterable Phosphorus and Total Phosphorus. Anal. Chim. Acta 1998, 375, 5–47. [Google Scholar] [CrossRef]
- Environmental Protection Agency. R.E.D. Fact Sheet: Sodium Omadine; United States Environmental Protection Agency: Washington, DC, USA, 1996; pp. 1–8.
© 2019 by the authors. Licensee MDPI, Basel, Switzerland. This article is an open access article distributed under the terms and conditions of the Creative Commons Attribution (CC BY) license (http://creativecommons.org/licenses/by/4.0/).