Article

Shear Capacity of Textile-Reinforced Concrete Slabs without Shear Reinforcement

Institute of Structural Concrete, RWTH Aachen University, 52074 Aachen, Germany
*
Author to whom correspondence should be addressed.
Appl. Sci. 2019, 9(7), 1382; https://doi.org/10.3390/app9071382
Submission received: 13 March 2019 / Revised: 25 March 2019 / Accepted: 27 March 2019 / Published: 1 April 2019

Abstract

:
A reliable and economic utilization of textile-reinforced concrete in construction requires appropriate design concepts. Unlike designs for bending, the development of models for shear is still the subject of current research. Especially for thin slabs, systematic experimental investigations are lacking. In this paper, the results of an experimental campaign on 27 carbon-textile reinforced slab segments tested in three-point bending are presented. The shear-span to depth ratio and member size were key variation parameters in this study. Increasing the structural depth of members led to a reduction in relative shear strength, while variation of shear slenderness controlled the efficiency of direct stress fields between load introduction and support. Interestingly, direct load transfer was activated up to a shear slenderness ratio of 4, which is significantly higher than in reinforced concrete (a/d < 2.5–3) and may result from the bond characteristics of the textile reinforcement. The experimental shear strengths were compared to predictions from existing models for shear of fiber-reinforced polymer (FRP)-reinforced concrete. The study shows that these FRP calculation models also predict the ultimate shear force for textile-reinforced concrete (TRC) tests presented in this paper with sufficient accuracy. Existing approaches for the size effect seem transferable as well. In order to validate the models for general use in TRC shear design, a compilation and comparison with larger experimental databases is required in future works.

1. Introduction

Textile-reinforced concrete (TRC) combines high-performance non-metallic textile grids as aligned internal reinforcement with state-of-the art concrete technology. The resulting composite material makes a re-thinking of established construction methods possible [1,2,3,4]. The resistance to corrosion of the textiles permits reduced concrete covers and structural depths and supersedes additional protective polymeric layers (e.g., [5,6,7]). The higher tensile strength of reinforcement fibers, such as carbon, compared to typical reinforcement steel allows for further optimization of cross-sectional designs. With smart use of these materials, large resource savings can be realized in specific areas of concrete construction [8,9]. However, successful dissemination of TRC in practice depends on the availability of accurate and reliable, yet easy-to-use, design models [10].
In contrast to design for bending, both engineers and researchers are still confronted with fundamental questions regarding shear design of textile reinforced concrete for new constructions. While numerous applications [11,12,13,14] and first general approvals for thin façade panels exist [15], there is no design model for thicker TRC slabs between 5 cm and 20 cm with substantial shear loads, e.g., due to concentrated loads near supports. Slabs with such dimensions have high potential, both for bridges and in high-rise construction. Recent projects in Germany show the application for pedestrian bridges [16,17,18,19] as well as for small road bridges [20], especially in the transversal structural system. TRC slabs do not require additional protective layers (e.g., epoxy coating or bitumen) and thus the concrete can be driven or walked on directly. In high-rise construction, a promising application for TRC slabs are multi-storey car parks [21], where the question of corrosion-resistance because of exposition to deicing-salt as well as the maximization of clear floor height without increasing the building height dominate the design—both are strong arguments for the use of TRC.
The ongoing research on fundamental shear design models [22,23,24,25,26,27] and the numerous current research projects on shear in Europe [28,29,30,31,32,33,34,35,36,37] indicate that this topic is far from being solved for steel reinforced concrete. This foreshadows the long and tedious way toward an adequate level of knowledge on shear design of TRC.
TRC distinctly differs from fiber reinforced polymer (FRP) bar reinforced concrete, which is much more comparable to conventional concrete in component size, reinforcement diameter, stiffness in transversal direction, and shape. For FRP, extensive research exists on elements without (e.g., [38,39,40,41,42,43,44,45,46] and with (e.g., [47,48,49,50,51]) transversal reinforcement. Due to the great experience in research and practice, there are design provisions in several international codes (e.g., [52,53,54]). However, in contrast to FRP-reinforced concrete, research on TRC is still in its infancy. The existing models for FRP are an excellent starting point, but research on TRC should check unbiasedly fundamental assumptions on load-bearing mechanisms in order to avoid fallacies in design. The “riddle of shear” (Kani’s famous dictum in [55]) for TRC is one of those fundamental topics targeted in a large-scale coordinated research program on TRC and carbon reinforced concrete in Germany named “Carbon Concrete Composites (C3)-Project” [56]. In the subproject C3-B3 [57], experimental and theoretical investigations on shear were performed by the Institute of Structural Concrete at RWTH Aachen University. Meanwhile, other researchers in Europe are investigating similar issues on shear capacity of filigree TRC beams [3,58] or the capacity of 3D textile reinforced elements [59].
The aim of the present article is to give insight on fundamental questions for shear design of TRC without shear reinforcement. Using the results of a systematic experimental investigation on slab segments, the influence of the component’s height and the effect of shear slenderness are discussed. The comparison of shear capacity predictions from selected existing models to the test results indicates that TRC with epoxy-impregnated carbon textiles as longitudinal reinforcement exhibits a similar shear behavior compared to steel- or FRP-reinforced concrete components. This is the first step toward the transfer or adaption of existing shear design models to TRC.

2. Experimental Investigation on Shear Capacity

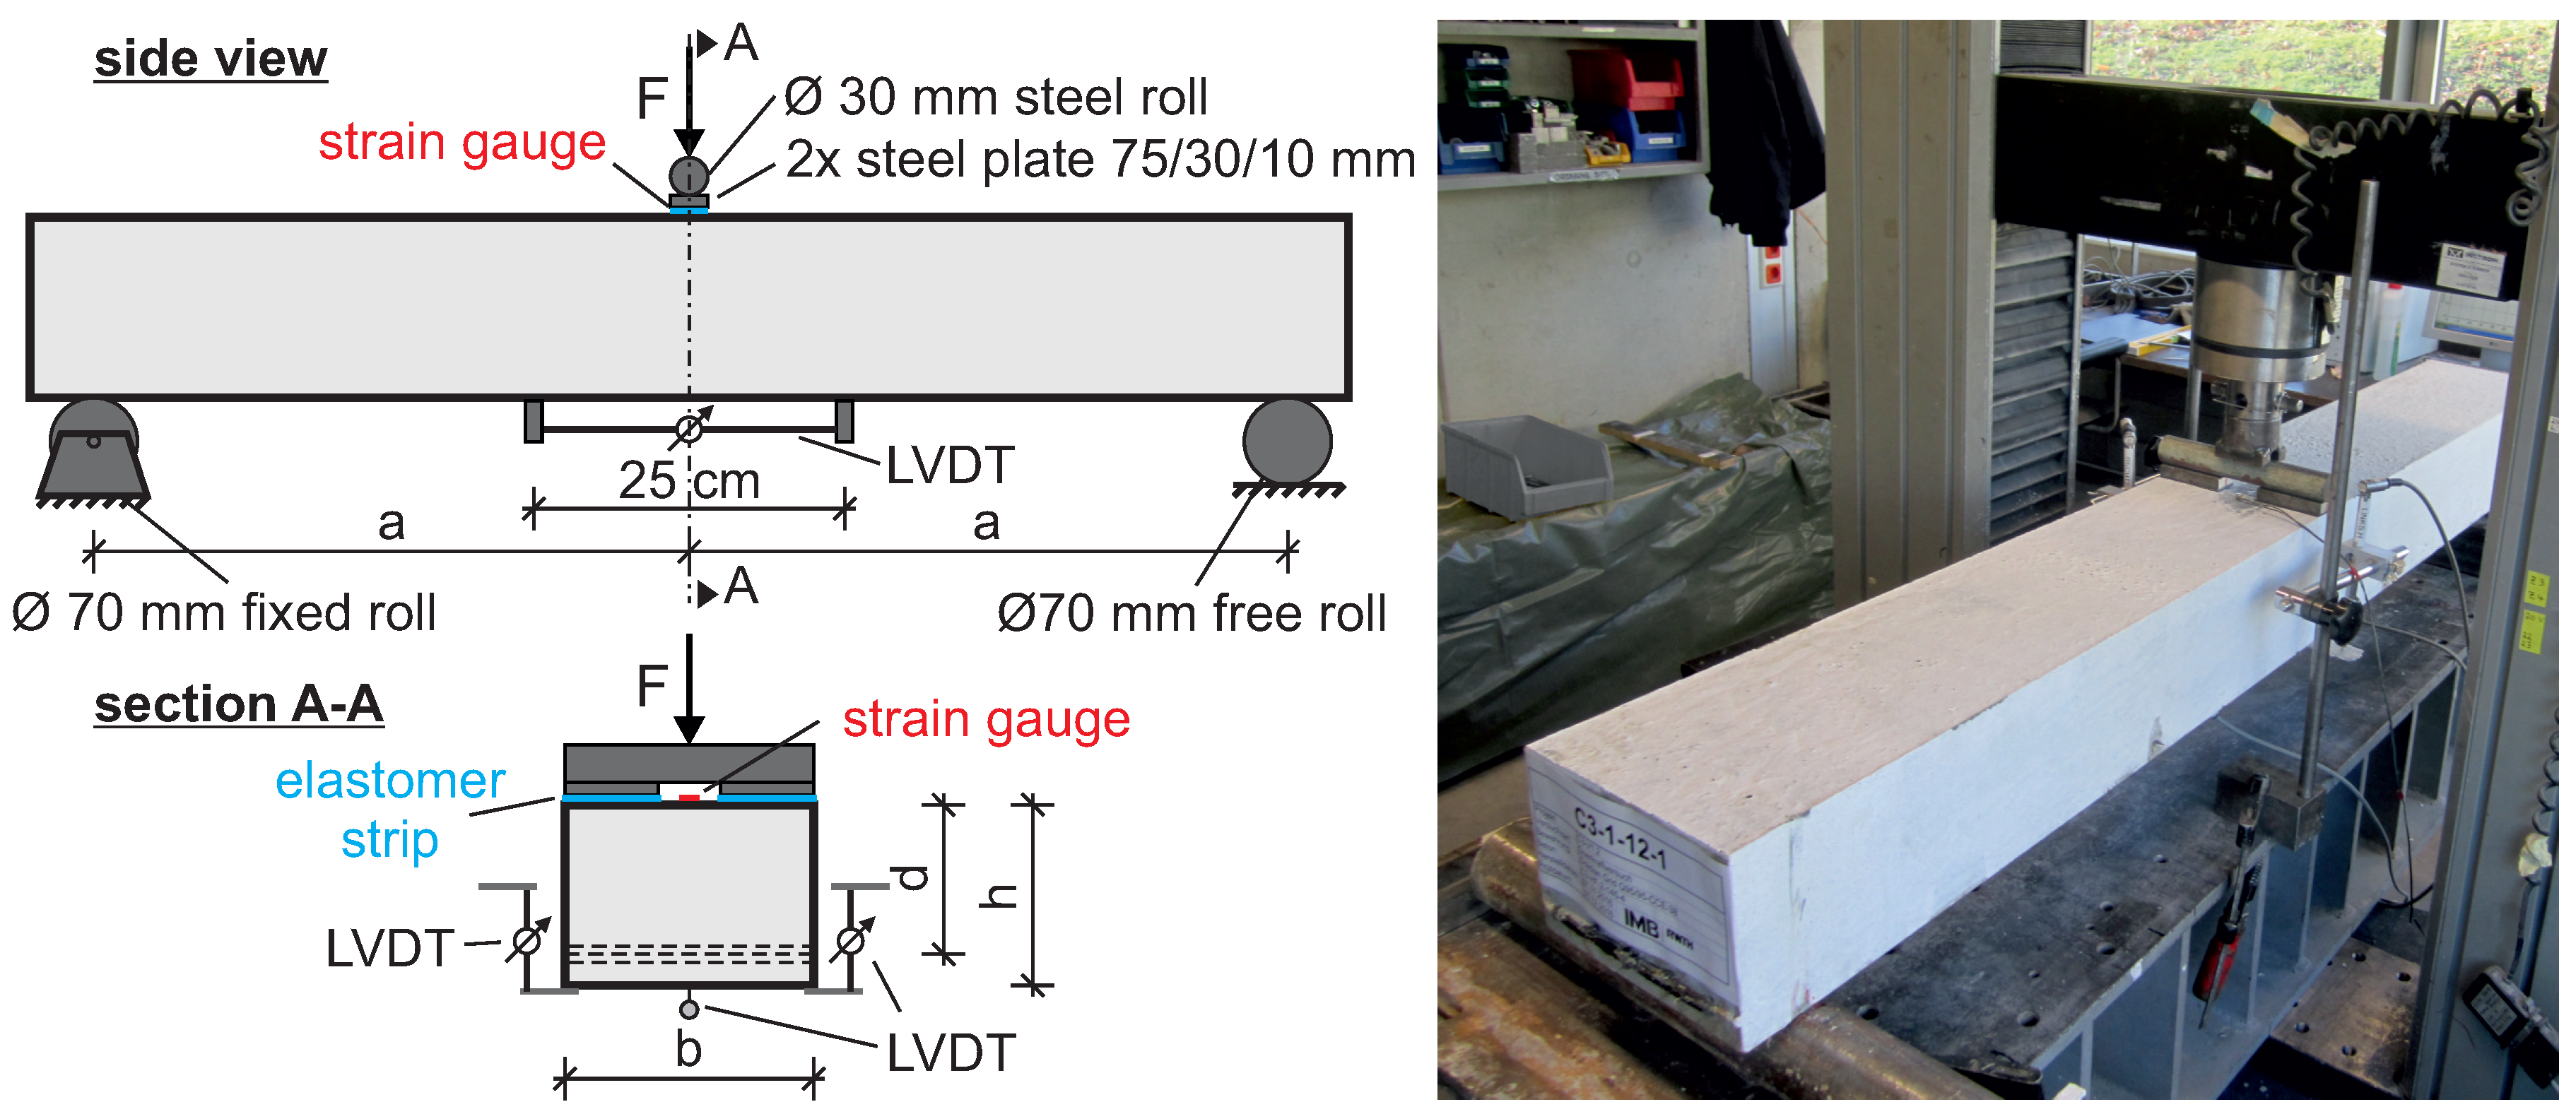
2.1. Test Setup and Instrumentation

For the experimental study of the shear capacity, single-span slab segments with single loading in mid-span were tested. The test setup was variable and scalable, which allowed a systematic parameter study. Figure 1 shows the test setup. The load was introduced under displacement control by means of a steel roll along the width of the specimen. An elastomer strip prevented local stress concentration on the upper surfaces of the specimens. The load rate was chosen to 1 mm/min. One fixed and one free roll were used to guarantee vertical support without horizontal constraints.
The vertical displacements were measured by two linear variable displacement transducers (LVDT) at mid-span. The longitudinal strain was tracked by a concrete strain gauge on top of the specimen in mid-span between two steel load-introduction plates and by an LVDT with a measuring length of 25 cm fixed to the bottom of the specimen. The load was measured continuously by a built-in load cell of the electric testing machine (100 kN maximum load capacity).

2.2. Variation of Parameters

The experimental program focused on the investigation on the variation of two parameters, the shear slenderness a/d and the effective depth d (Table 1). By varying the shear slenderness, one could investigate the increase in shear capacity due to concentrated loading near the supports and the formation of direct compression stress fields. The variation of the effective depth allowed for analysis of the size effect. All other parameters with an assumed influence on the shear capacity were kept constant. The geometrical ratio of longitudinal reinforcement ρ (cross-sectional area of reinforcement divided by effective depth and width) was chosen as ~0.24%, aiming at avoiding bending failure. Note that this reinforcement ratio is still typical for TRC plates in this depth range. This is relevant, because over-reinforced cross-sections may show a disproportionate amount of dowel action as shear transfer mechanism. The concrete compressive (and tensile) strength chosen for this study resulted from the idea of matching suitable high-performance materials, i.e., to be able to fully use the high tensile and bond strength of the non-metallic reinforcement. Details are given in Section 2.4. The width of 20 cm was chosen for all specimens considering the maximum specimen height, the maximum grain size, the number of reinforcement elements per layer resulting from the reinforcement grid spacing, and the maximum test load and dimensions of the test machine.

2.3. Reinforcement

Non-metallic textile reinforcement can be categorized in different ways, regarding its fiber material, its impregnation material, or its geometry. As fiber materials, carbon, alkali resistant (AR-) glass, aramid, and basalt are usually utilized. Carbon and AR-Glass are the most common and there are several commercially available products world-wide. As impregnation materials, elastic rubber-based systems such as styrene-butadiene-rubber, as well as stiffer types based on epoxy resin or polyacrylate, are widespread. Nowadays, non-impregnated textiles (e.g., used in the construction of shell structures in [5] or [60]) are less common for new constructions due to the low efficiency and the low stiffness, which complicates the handling during manufacturing of TRC members. However, they are still used for repair and external retrofitting, especially for masonry walls. Regarding the geometry, one can distinguish the following types: Planar 2D textiles (biaxial or multiaxial), preformed 3D elements made from 2D textiles, and full 3D textiles (see e.g., [59]). Due to the variety of available products and combinations, a detailed characterization of the material properties of the reinforcement is indispensable for an experimental campaign on textile-reinforced concrete. It is interesting to note that the mechanical properties of FRP and textile reinforcement are related to different geometrical bases. For textile reinforcement, typically only the filament area without impregnation resin is counted. Reasons for this approach are the non-uniform geometrical cross-section along the axis of individual yarns (Figure 2) and the rather difficult determination of the cross-sectional area due to the small size. As the titer and the filament count of the individual non-impregnated rovings used in production of the textiles are known, the determination of the total filament area per meter is very simple. This is a significant difference to FRP bars or stirrups, for which the geometrical area given by the manufacturer includes the polymeric matrix. In consequence, area-related material characteristics such as stress or modulus of elasticity of impregnated textiles appear higher than for FRP bars, despite similar basis materials and similar compactness.
In this study, an epoxy-impregnated biaxial carbon grid was utilized as longitudinal reinforcement. The epoxy-resin was applied and hardened during production by the reinforcement manufacturer. Due to the high stiffness of the mesh, it could not be rolled on regular-sized reels. Hence, in this case, it was delivered in 5 m × 1.2 m planar panels. Figure 2a shows the biaxial open grid structure with a 38 mm axial spacing of the yarns, both in longitudinal (warp) and transversal (weft) direction of the fabric. The cross-sectional area of this reinforcement was symmetrical, with 95 mm2/m in both directions. The reinforcement layout for this study aimed toward achieving a similar reinforcement ratio for different effective depths. In consequence, the specimens had one to three layers of reinforcement mesh strips of 5 yarns each (Figure 2c). During production, the bottom layer passed beyond the formwork in order to apply a slight prestressing to avoid sagging of the reinforcement (Figure 2b). All layers were aligned so each layers’ weft and warp yarns stacked directly on top of each other. This resembles the typical production in practice, as the alignment of openings allows the concrete to pass. In mid-span, an additional fixation for one transversal yarn guaranteed the necessary concrete cover. Furthermore, due to the lower density of the impregnated carbon compared to fresh concrete, the buoyancy could be effectively controlled. Conventional spacers made from fiber-reinforced mortar or plastic could function as a suitable alternative but were avoided here to minimize the risk of floating up of the reinforcement and to eliminate a possible influence on the cracking process.
The material characteristics of non-impregnated textiles and textiles with partial impregnation (surface coating) needed to be determined with composite specimens via uniaxial tensile tests [10,61,62,63]. For fully impregnated textiles with a homogenous stress distribution over the yarn area and simultaneous activation of all filaments, the properties could be determined on the textile without surrounding concrete [64]. Table 2 lists the material properties. The ultimate stress and modulus of elasticity were analyzed in uniaxial single yarn tests according to the setup described in [65], where individual yarns were extracted from the hardened grid and connected to the testing machine with an variable pressure along the clamping length. Note that, due to the well-known statistical effects for a bundle of linear-elastic yarns with brittle failure, the strength of a single yarn does not equal the strength of the fabric [66,67]. This can be taken into account by a reduction factor which depends on the number n of yarns [68]. For the reinforcement used in this study, a reduction factor of 0.85 for n = ∞ was proposed by Rempel [64].
The bond properties of the reinforcement were analyzed in a companion investigation [69]. In contrast to non-impregnated textiles or textiles with soft impregnation, the full and hard epoxy impregnation led to form closure with longitudinal splitting of the concrete as a bond failure mechanism, rather than pull-out or jamming of the yarns. The mean length required for full anchorage was determined to be 78 mm for a concrete cover of 20 mm in the same cementitious matrix with equal tensile and compression strengths, as used in the present paper [69]. A free length of 50 mm behind the supports on both ends of the specimens proved to be sufficient to anchor the respective forces from shear and bending. All layers of reinforcement continued to the end of the specimen. Up to the point of ultimate failure, no longitudinal cracks ran up to the supports or up to the ends of the specimen. This allowed for the conclusion that no anchorage failure occurred in this study.

2.4. Cementitious Matrix

The cementitious matrix utilized in this study was specifically designed within the C3 project to meet the requirements of textile reinforced concrete [70]. The mixture was based on [70], but adapted with locally available aggregates. Details can be found in Table 3. The maximum diameter of the crushed quartz aggregate (4 mm) matched the size of the grid openings. The high content of fine particles in the cementitious binder compound and the fine sand paired with the high-performance superplasticizer led to self-compacting properties of the fresh mix. During production, no external or internal compaction was required to achieve a dense matrix without cavities or gravel pockets.
According to DIN EN 206 [71], the mixture was no standard concrete due to its small aggregate size and its high content of fine particles. As it was produced and applied just like concrete as matrix, the term “concrete” is used in this paper and generally in the context of textile reinforced concrete for new constructions. This allows a distinction to be made from repair and retrofitting, where the term mortar is more common.
The hardened concrete exhibited high strength, both in compression and in tension. The bending tensile strength was determined on prism specimens (40 × 40 × 160 mm), according to the standard test method for mortar [72]. The mean value of all experiments (age 27 to 32 days) was 15.1 MPa with a coefficient of variation (COV) of 21.6%. The mean modulus of elasticity of the cementitious matrix was tested on cylindrical specimens (d/h = 150/300 mm) to 44595 MPa (COV 2.1%) with the method described in [73]. The mean compressive strength reached 127.6 MPa (COV 4.2%) for 150 mm cubes [74], 105.4 MPa (COV 4.7%) for cylinders (d/h = 150/300 mm, [74]), and 122.5 MPa (COV 5.1%) for the prism halves [72]. Due to the high strength of the cementitious matrix, cracks usually ran through the aggregates. The ultimate compressive strain of this concrete has been determined on two cylinders with external concrete strain gauges to 2.92‰ at the age of 28 days.

3. Results

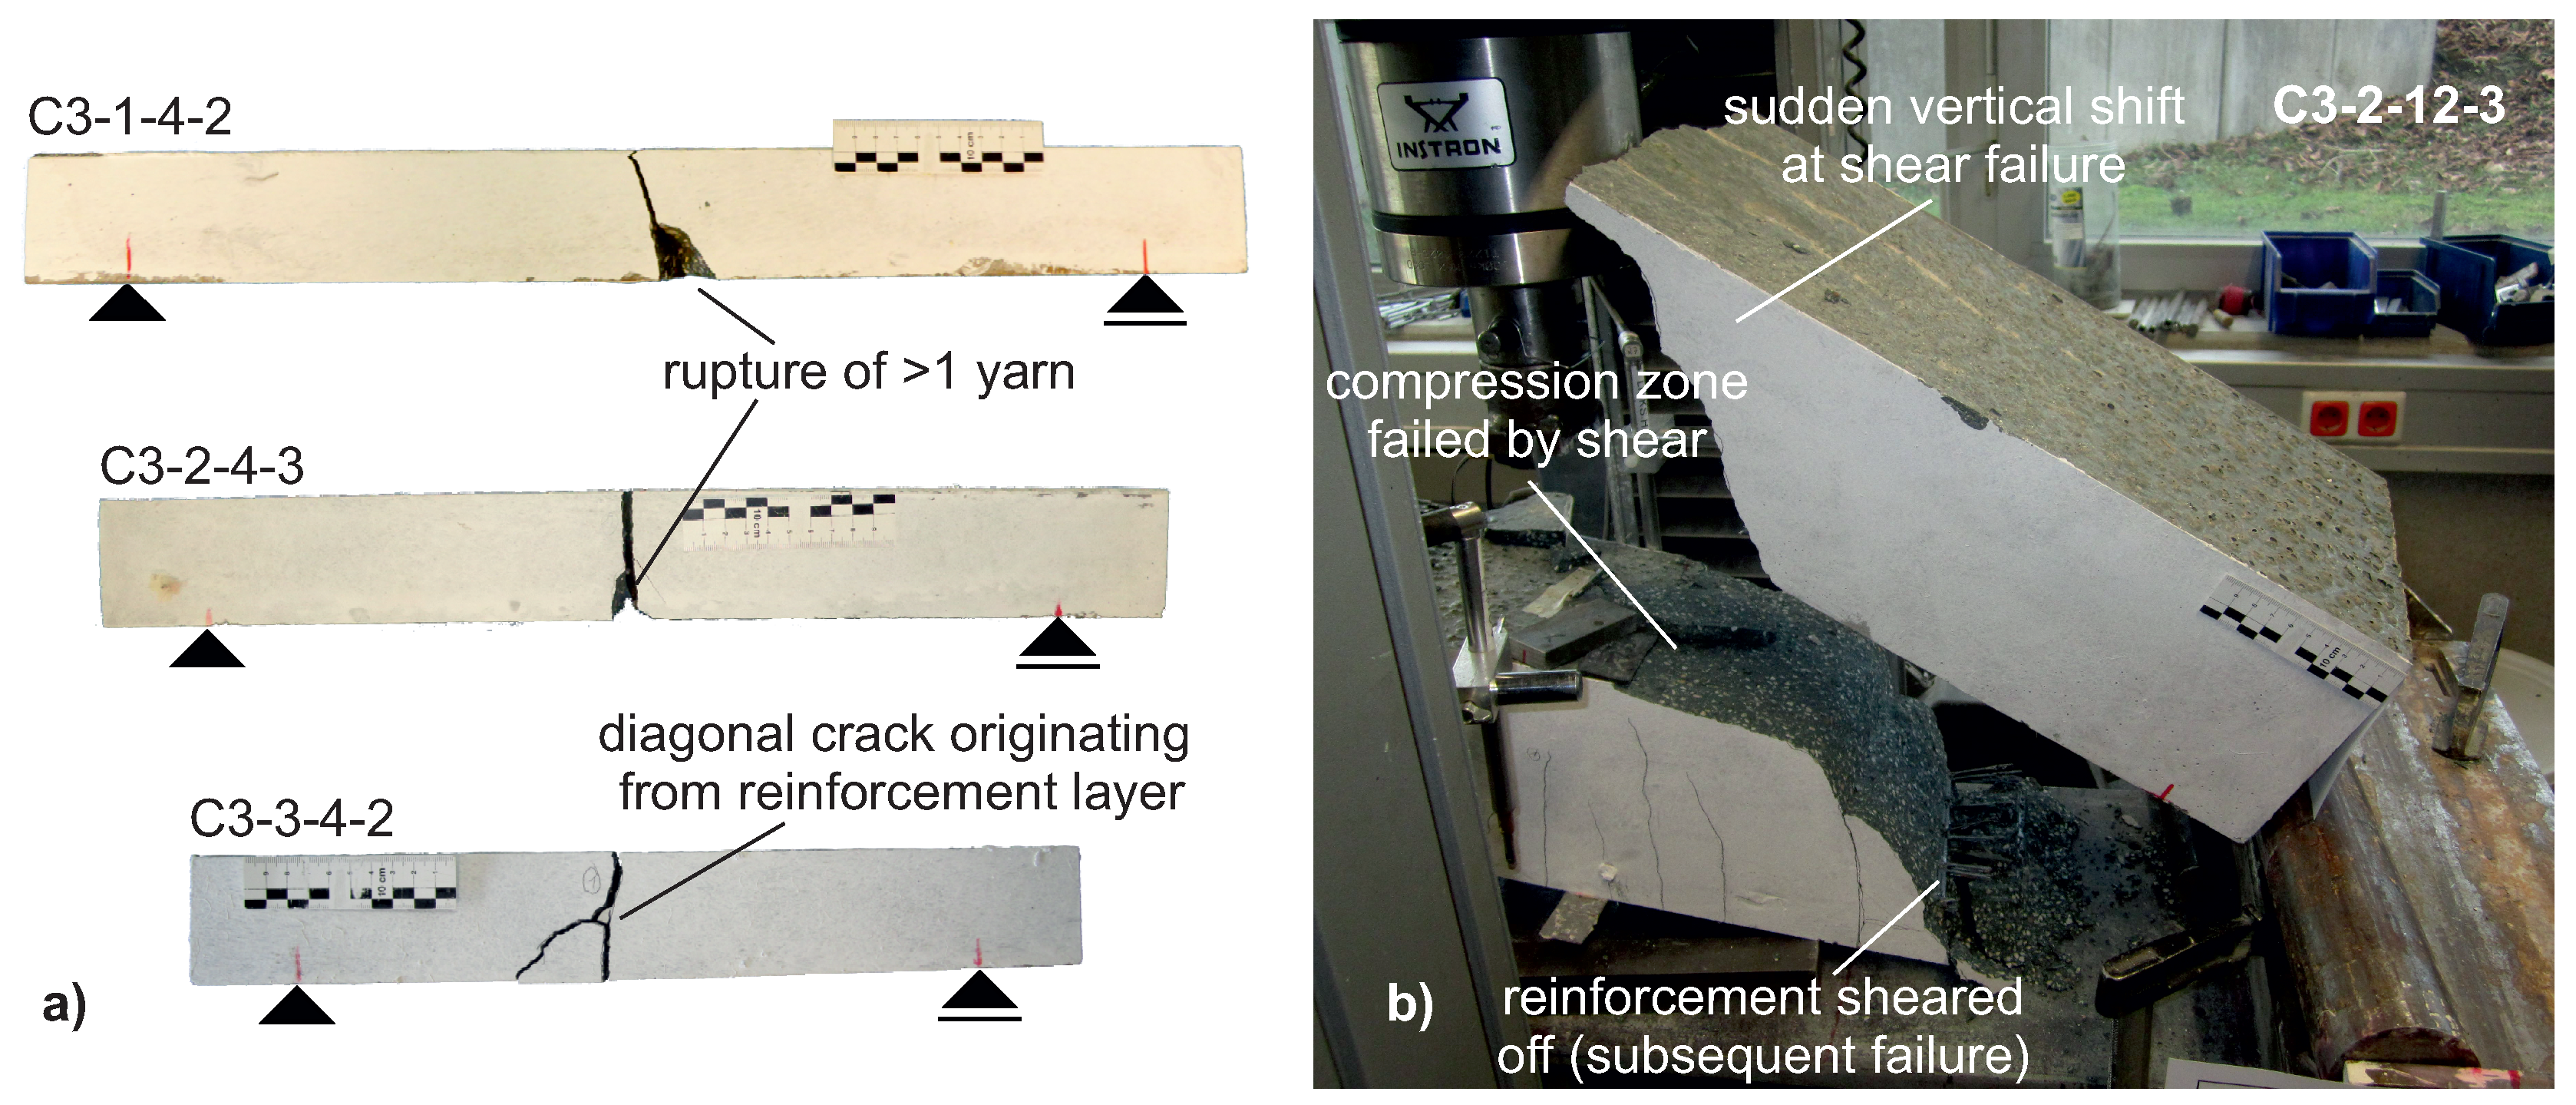
3.1. Failure Mechanisms

In the experimental program, two main different failure mechanisms were observed, bending and shear failure. The smallest specimens with a cross-sectional height of about ~60 mm and an effective depth of ~40 mm failed in bending by rupture of one or several yarns. Figure 3a shows three representative examples for the three different load-support-distances (span lengths). For some specimens, a diagonal crack originating from the layer of reinforcement occurred prior to failure. However, this crack was not the ultimate reason for failure. Three specimens (C3-1-4-1, C3-3-4-1, and C3-3-4-3) showed significant crack formation along the layer of reinforcement prior and subsequent to rupture of one yarn. Their failure mechanism is therefore described as bending failure with subsequent shear failure.
All specimens with an effective depth of 80 and 120 mm failed in shear. Because their compression zone was further constricted by the critical shear crack prior to failure, the term shear compression failure is utilized. Figure 3b illustrates a typical failure phenomenon which occurred for several specimens. The sudden propagation of the shear crack into the compression zone led to the brittle failure. The sudden release of stored energy resulted in a mutual sliding and a vertical shift of one half of the specimen. Note that the reinforcement in the tension zone was sheared at the crack in all layers without adding significant resistance and ductility to the failure mechanism. This is typical for the anisotropic fiber-reinforcement material, but even more pronounced for textile reinforcement due to the relatively low transversal stiffness of the individual yarns.
For all specimens, one can observe that the residual compression zone in mid-span is only few millimeters deep. This can be explained by the high compressive resistance of the concrete and the good compaction of the concrete resulting in a dense and tough uppermost cementitious layer. The shear cracks passed through the aggregate grains. At failure, the constricted compression zone often buckled in the vertical direction. The high utilization of the concrete in this zone is shown in Figure 4 exemplary for three specimens, all having an effective depth of 80 mm but with different a/d-ratios.
All specimen showed a linear-elastic branch in their load-deflection curve up to a high first-cracking load. This high load and the severe drop after first cracking are not surprising for the high-strength concrete with its corresponding stiffness. Subsequent bending cracks are clearly visible in the diagram. The end of the test was marked by a sudden drop of the load without residual capacity. At this point, the compressive strain directly below the load introduction at mid-span reached or even exceeded the ultimate strain of the concrete taken from uniaxial compression tests on cylinders. Next to the observations of the crack pattern after failure, this additionally confirms the hypothesis of shear compression failure. The highest compressive strains were reached for the smallest shear slenderness (a/d = 4.1 for C3-3-8-2 in Figure 4b). One explanation for this observation is the superposition of compressive stress from beam action and from direct stress fields. This is a first indication towards an influence of increased arch action for the smaller shear slenderness.

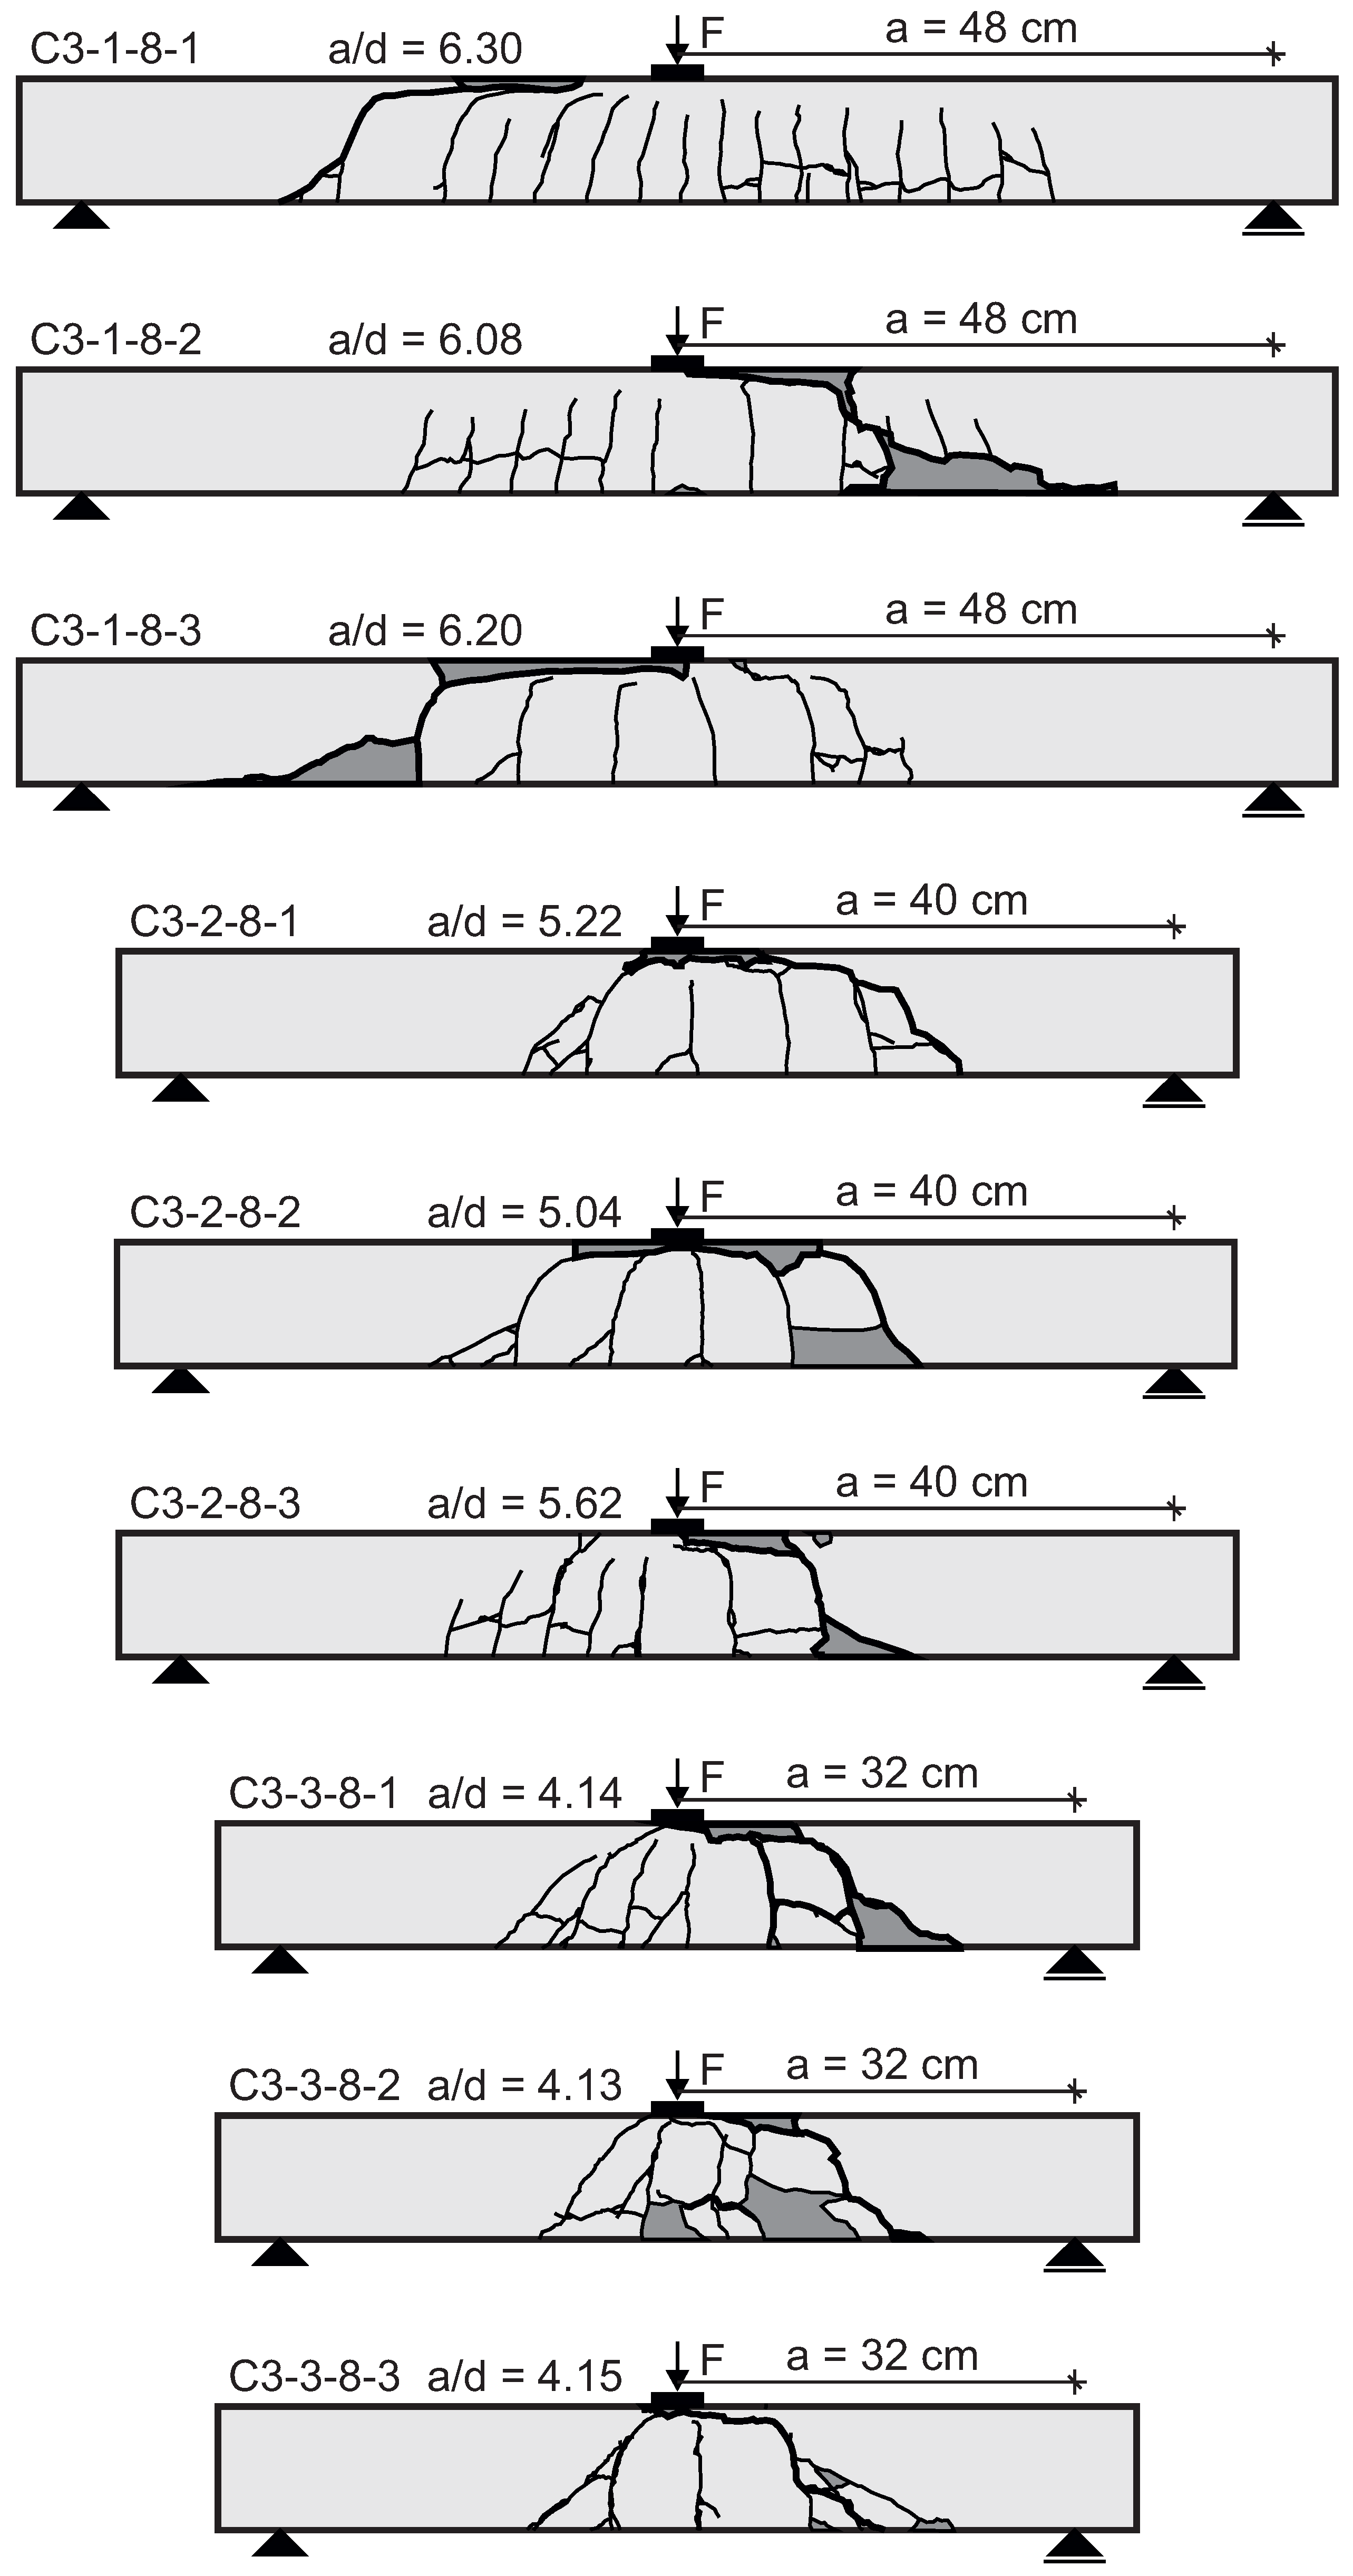
3.2. Crack Pattern and Critical Shear Crack

The characteristic crack pattern of specimens without shear reinforcement failing in shear is highly relevant for the assessment of their failure mode and their ultimate resistance. In Figure 5 and Figure 6, the crack patterns after failure are shown for the specimens with 120 mm and 80 mm effective depth, respectively. The critical shear crack is highlighted with a bold black line. The series with 40 mm is not shown, as there was usually only one bending crack, sometimes with a single longitudinal or diagonal crack originating from the layer of reinforcement.
If a full separation of the specimens’ halves at shear failure occurred, both halves were digitally rejoined for better comparison of the shear crack form. The dark-grey zones indicate concrete spalling, which occurred both in the compression zone (e.g., C3-1-12-1, C3-3-12-2, C3-1-8-3) and in the tension zone (e.g., C3-1-12-3, C3-2-12-2, C3-1-8-2). For almost all specimens, the critical shear crack propagated from a bending crack up to the area of introduction of the concentrated load. Table 4 gives detailed information on all experiments. The comparatively high scatter of the three results with an effective depth of d = 12 and a shear slenderness of a/d = 4 should be highlighted at this point. The low inclination of the critical shear crack for C3-2-12-1 and C3-2-12-2 indicates a dominating direct compressive strut towards the support. In contrast to this, the identically reinforced C3-2-12-3 has a steeper critical shear crack and thus a reduced direct load transfer. Due to the significantly lower ultimate force, fewer bending cracks and fewer longitudinal cracks are visible for this last specimen (Figure 5).

4. Discussion

Although the observations allow for discussion of several phenomena of shear behavior of TRC, only the influence of shear span and size effect are briefly discussed in this paper. Furthermore, the prediction of selected current design provisions for shear capacity of FRP or steel reinforced concrete are compared to the own experiments.

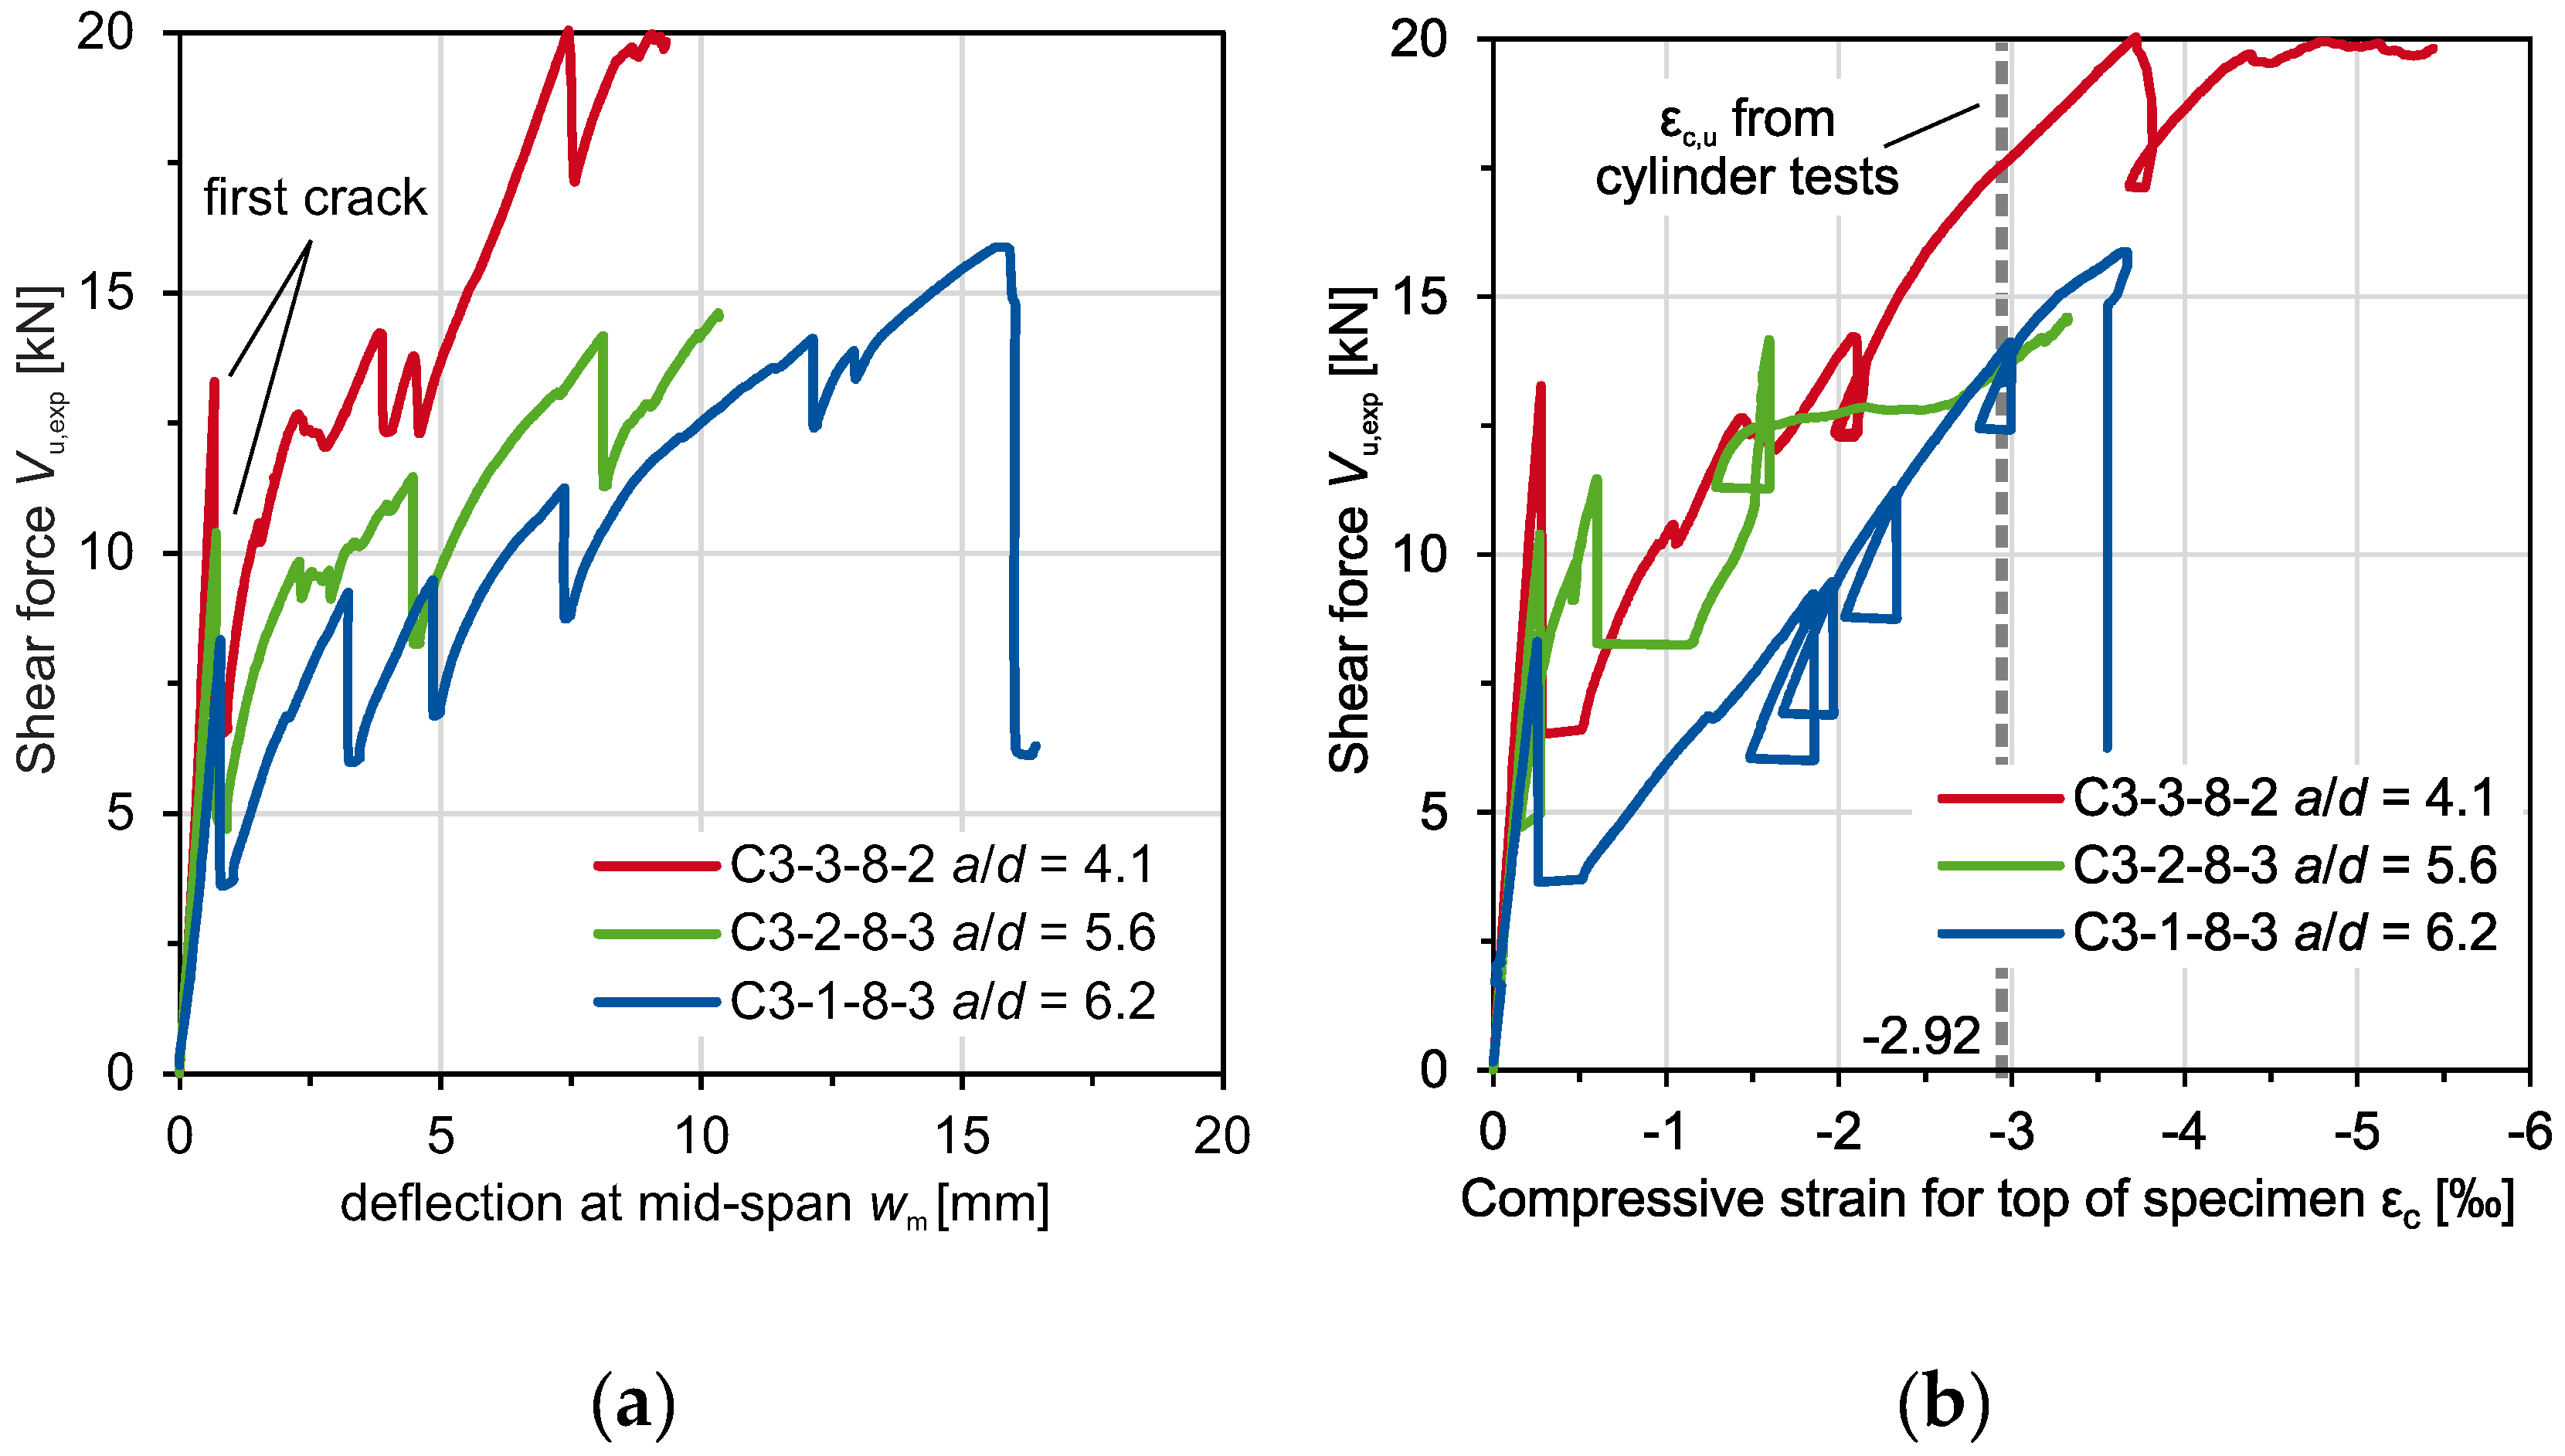
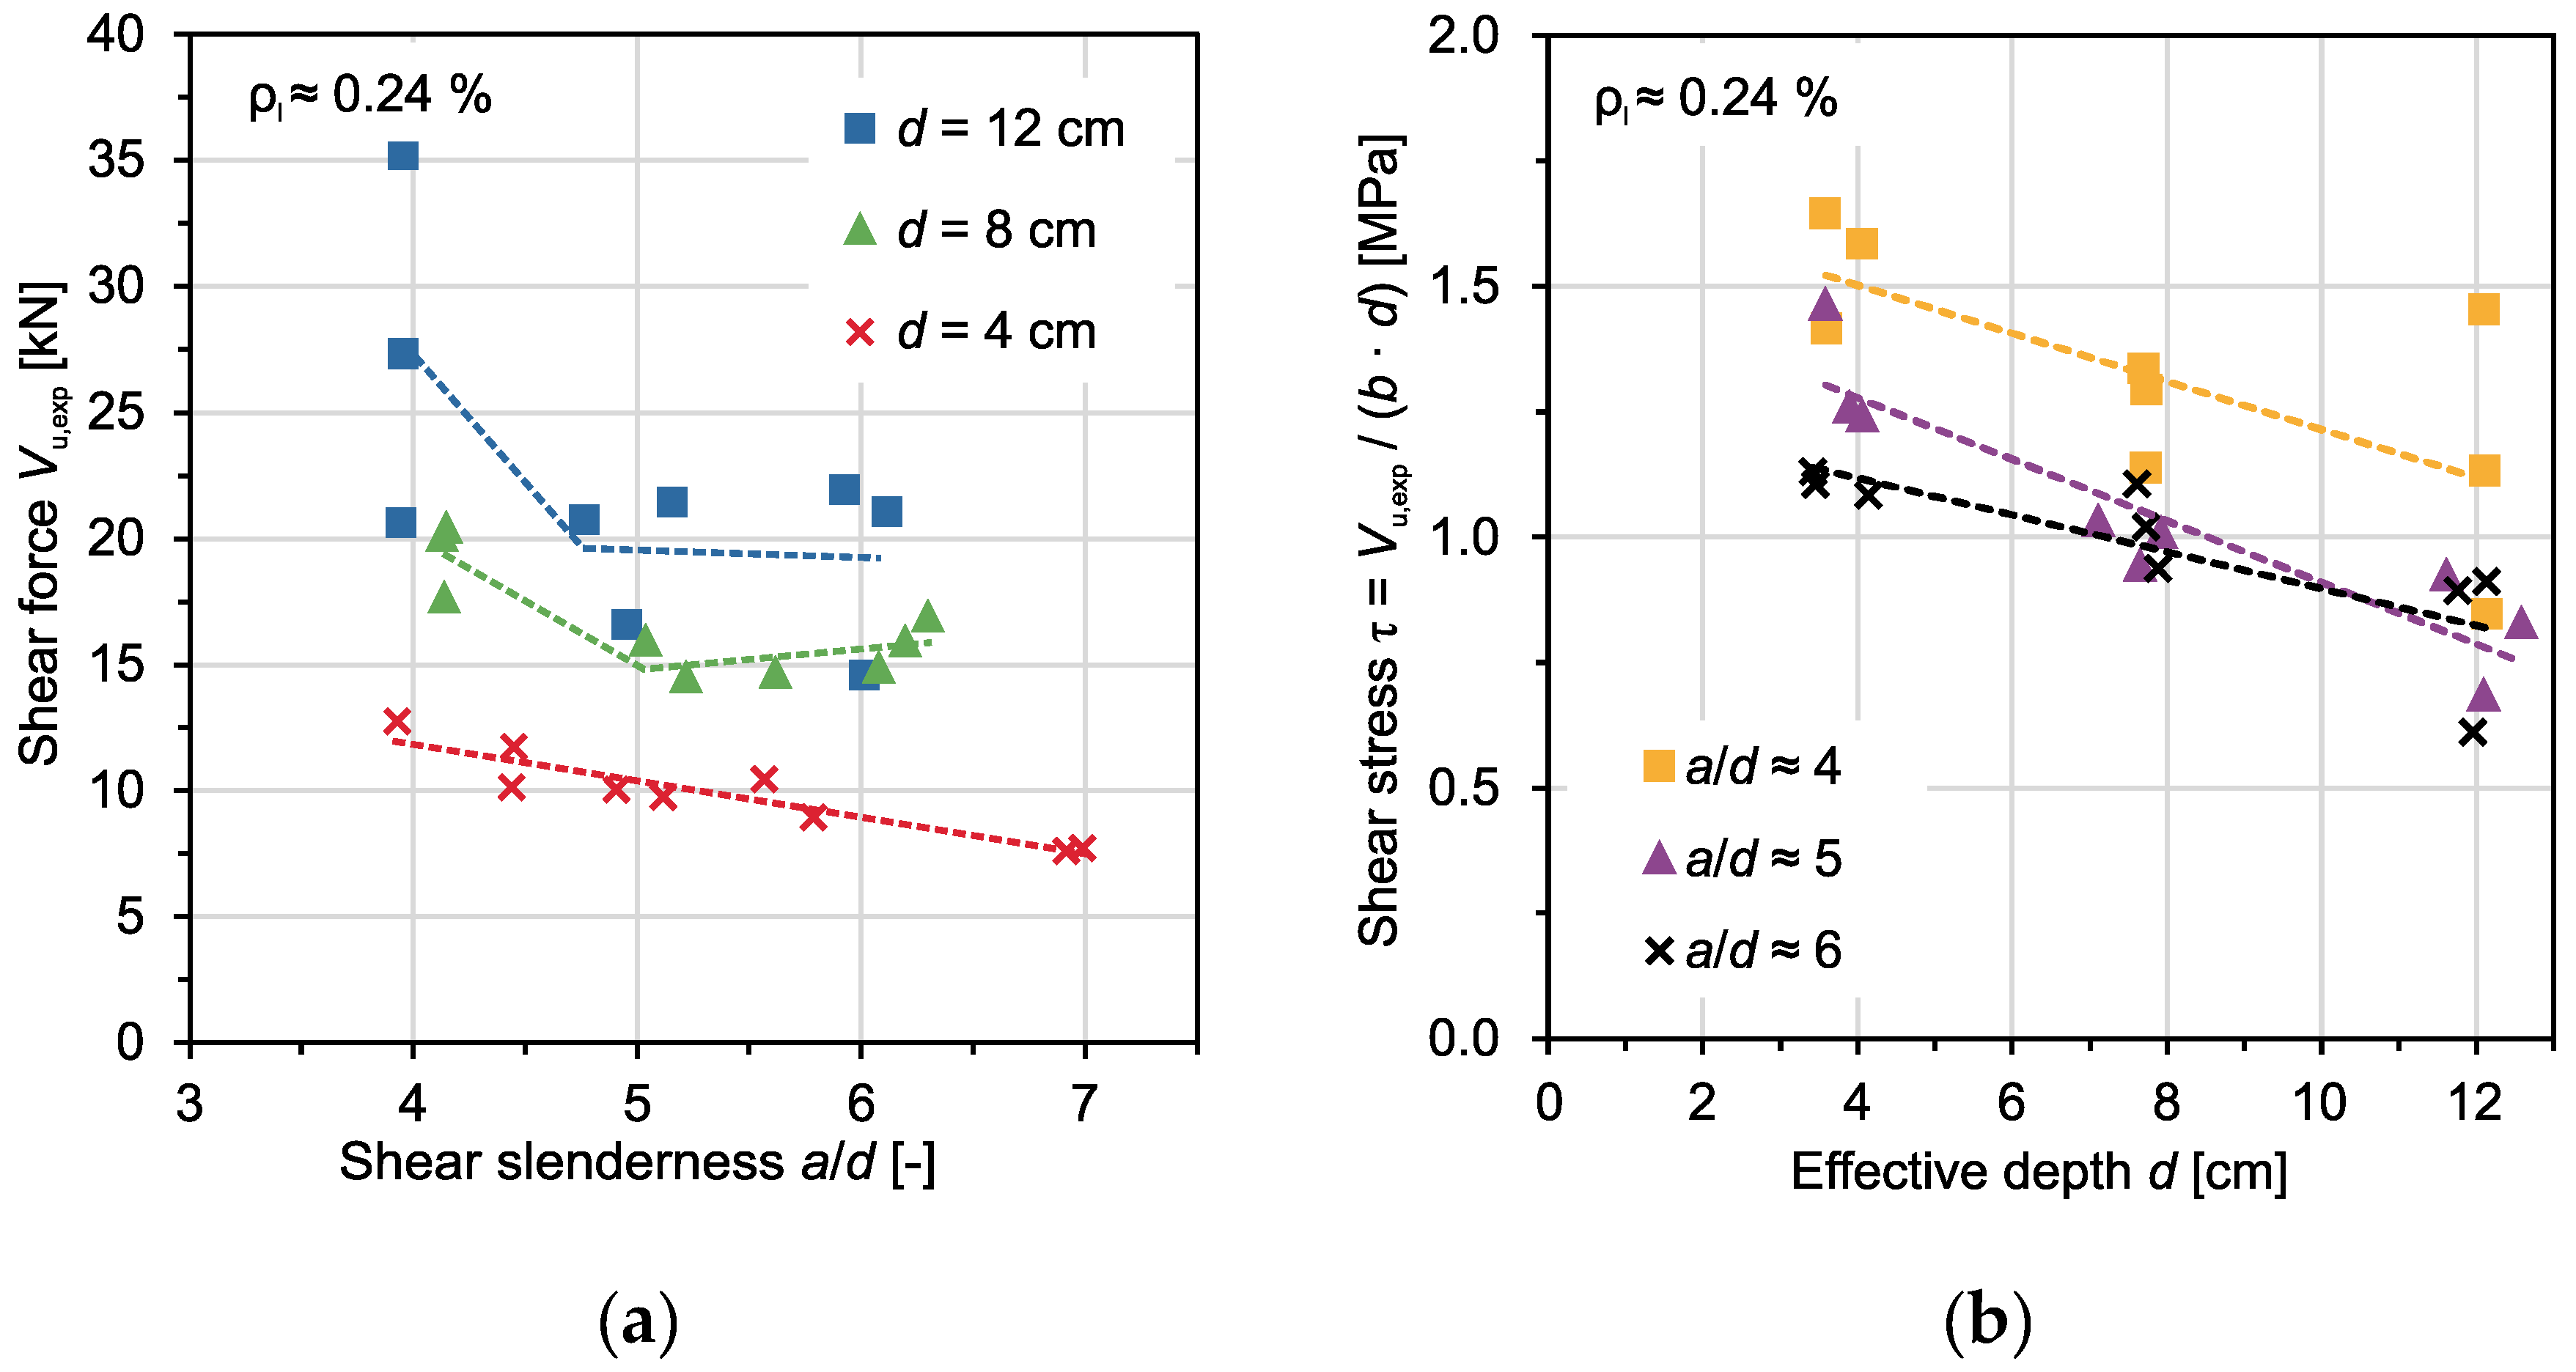
4.1. Effect of Shear Span Length
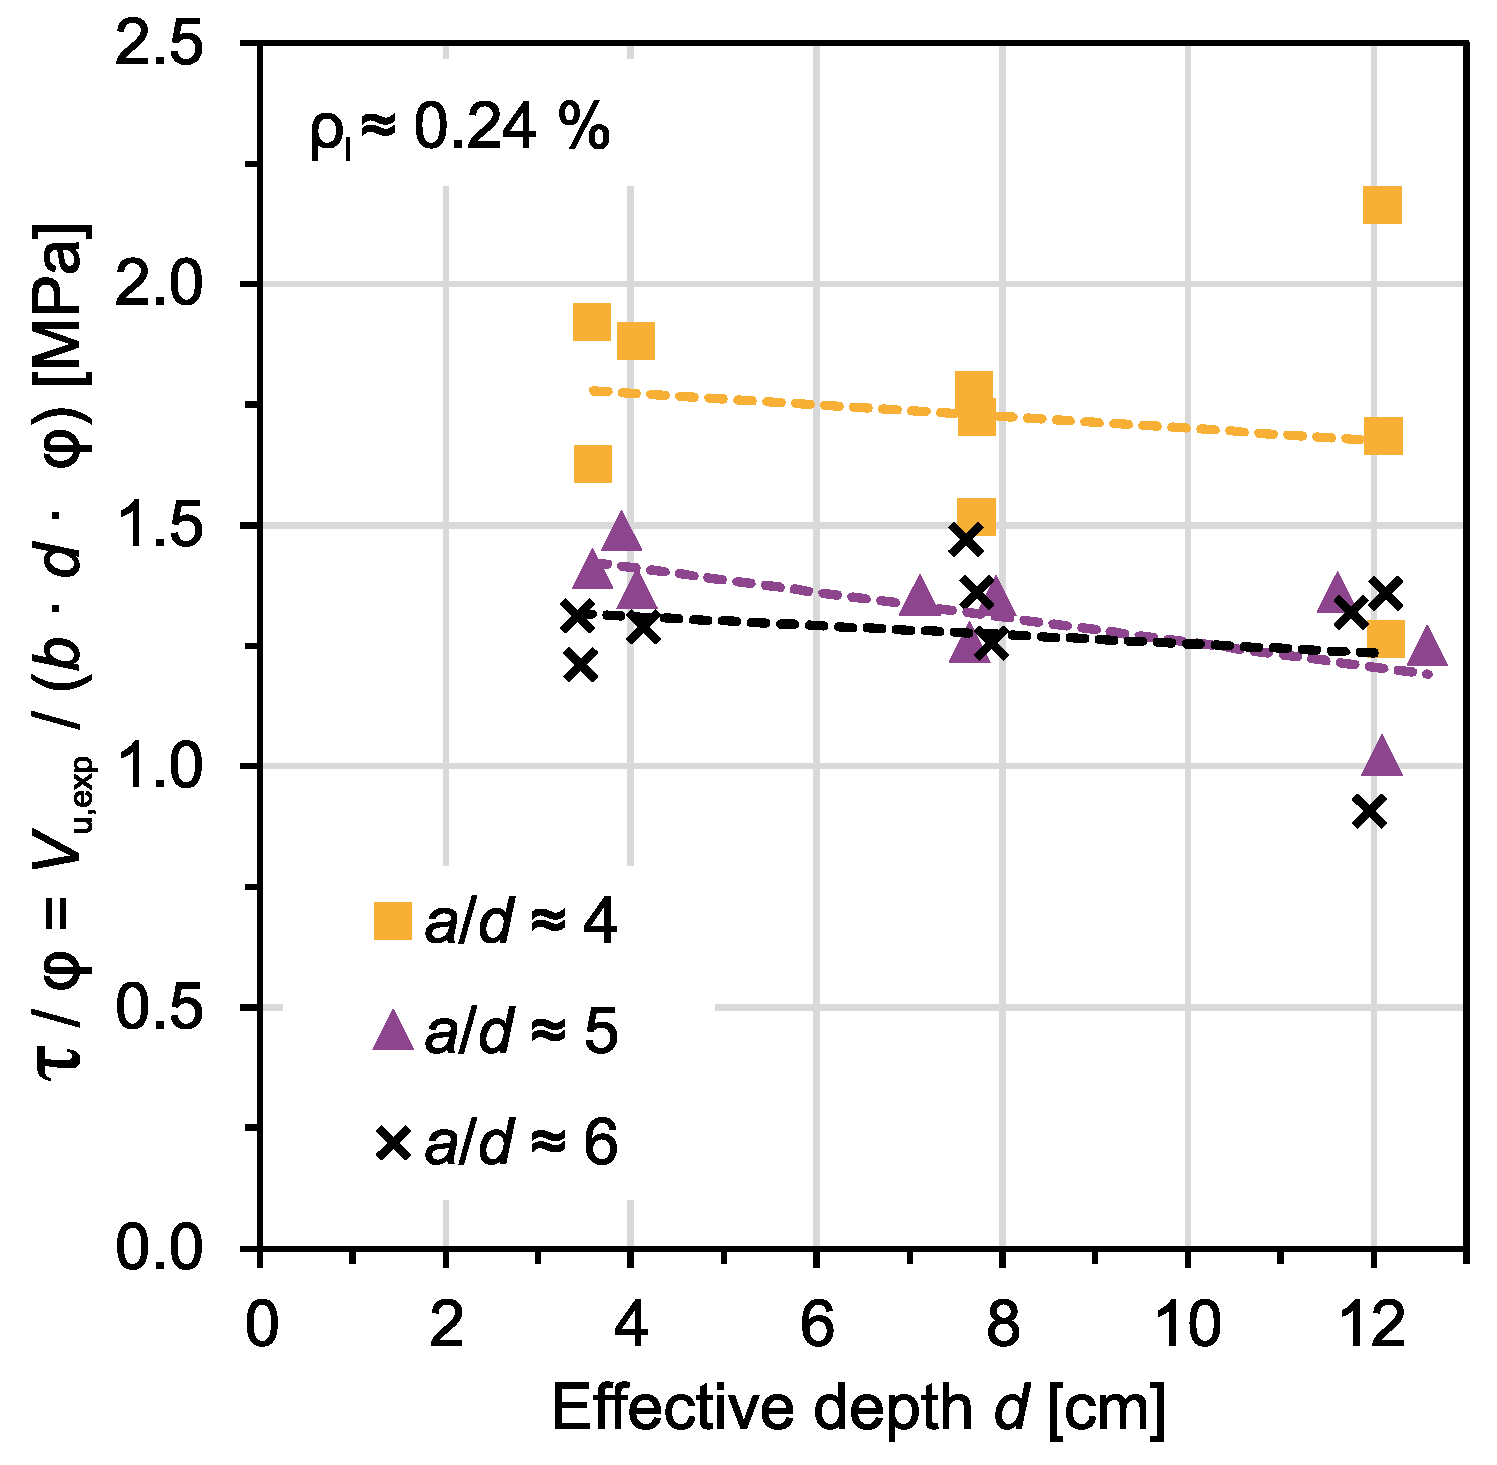
The question of an influence by the shear slenderness on shear capacity is of high interest for both researchers and for design in practice. Researchers need to design future experiments with an appropriate load-to-support distance to avoid overestimation of the shear capacity. On the other hand, engineers in practice exploit the direct stress transfer of concentrated loads near supports by reduction of the design shear force according current design provisions.
Figure 7a shows the ultimate shear force from all experiments in relation to shear slenderness. The shear force caused by self-weight of the specimens is neglected, because it differs along the shear span and along the critical shear crack. All results are displayed regardless of their failure mechanisms (a usual procedure, see for example in [75]). As discussed before, the specimens with d = 4 cm failed in bending. These results are therefore to be considered and compared with caution.
The highest shear forces in this test series occurred for an a/d-ratio of 4. It is noteworthy that there, the scatter for the three identical beams with the largest effective depth is highest. With increasing a/d, the shear resistance diminishes. This general observation is not surprising and well-known from steel-reinforced concrete [75] and concrete with FRP-reinforcement [76,77]. However, it should be highlighted that usually, an influence of a direct compression field is assumed up to a/d = 2.5–3. Here, the significant difference of shear resistance between a/d = 4 and 5 (while all other experimental parameters are kept the same) indicates a direct load transfer between load introduction and support, at least up to the shear slenderness of 4. There is no significant difference between a/d = 5 and 6, as indicated by the red and green dashed trend lines. The red dashed linear trend line for an effective depth of 4 cm is significantly influenced by the three values at a/d = 7, where earlier bending failure due to the higher moment governed. One possible explanation for the phenomenon of increased direct load transfer might be the influence of longitudinal cracking in the layer of reinforcement. The crack patterns in Figure 5 and Figure 6 clearly show longitudinal cracks (resulting from high local bond stress introduced by the reinforcement) at the level of one layer of reinforcement, which connect individual bending cracks. Those longitudinal cracks lead to a reduction or even a total loss of local bond between reinforcement and matrix. Yet, the end-anchorage was sufficient, as the longitudinal cracks did not propagate to or beyond the supports. In consequence, the tension stress in the reinforcement is constant in the center part along the beam length, resulting in a more efficient tied arch action. The analysis of the crack pattern of the beams with the highest loads (C3-2-12-1, 27.3 kN and C3-2-12-2, 35.2 kN) underlines this hypothesis. There, longitudinal cracks are present almost all the way to the support, whereas for C3-2-12-2 with its 71% lower resistance (20.6 kN), fewer longitudinal cracks were visible. The first two specimens’ shear resistance seems to be significantly influenced by tied arch action rather than beam action.

4.2. Size Effect

An influence of the effective depth on the shear resistance (size effect) can be derived from Figure 7b. A clear trend of diminishing shear resistance for increasing effective depths is visible. Once again, all results are presented regardless of their failure mechanism. Note that despite bending failure, the specimens with a d of ~40 mm bear the highest shear stresses. The size effect has been described extensively in literature by various researchers, of whom Bazant is arguably the most renown (see the extensive compilation in [78]). Especially for shear, current design provisions consider the size effect either directly (by a reduction factor as Eurocode 2 [79]), incorporated in the strain (e.g., in the Modified Compression Field Theory [80] and the Critical Shear Crack Theory [22,23]), or in a combined factor as in [27].
Bazant and Kim [81] describe the structural size effect according to Equation (1)
ϕ ( d ) = 1 1 + d λ 0 · d a
where d = effective depth, λ0 = empirical constant, and da = maximum aggregate size. For steel reinforced concrete beams, an empirical value of 25 was determined from a large set of experiments [81]. For the typical lower limit for the maximum aggregate size in normal concrete of 8 mm, the term λ0·da leads to a constant value of 200, which is often used in shear prediction models (e.g., [26]). Although the data set in this study is too small to properly adjust an empirical constant for TRC, the linear trend lines in Figure 8 indicate that the first approach with λ0 = 25 and da = 4 mm already led to satisfying results. It should be mentioned that in the present study, the concrete cracks passed through the aggregate grains rather than around them and thus the influence of aggregate size is debatable.
In contrast to the size effect law in (1), Eurocode 2 [79] limits the influence of size effect to a lower boundary of d = 200 mm. This derives both from the typical slab or beam dimensions and the typical minimum aggregate sizes of 8 mm. For TRC, smaller aggregate sizes as well as reduced depth are typical and intended. Thus, a lower limit is considered critical and more general approaches should be used for TRC. For future research, it could be advisable to additionally test specimens with doubled effective depth in logarithmic scale (10 times the current depth) in order to validate the fit of chosen size effect factors. Alternatively, nonlinear finite element modeling can be used to validate the size effect laws (e.g., [82]).

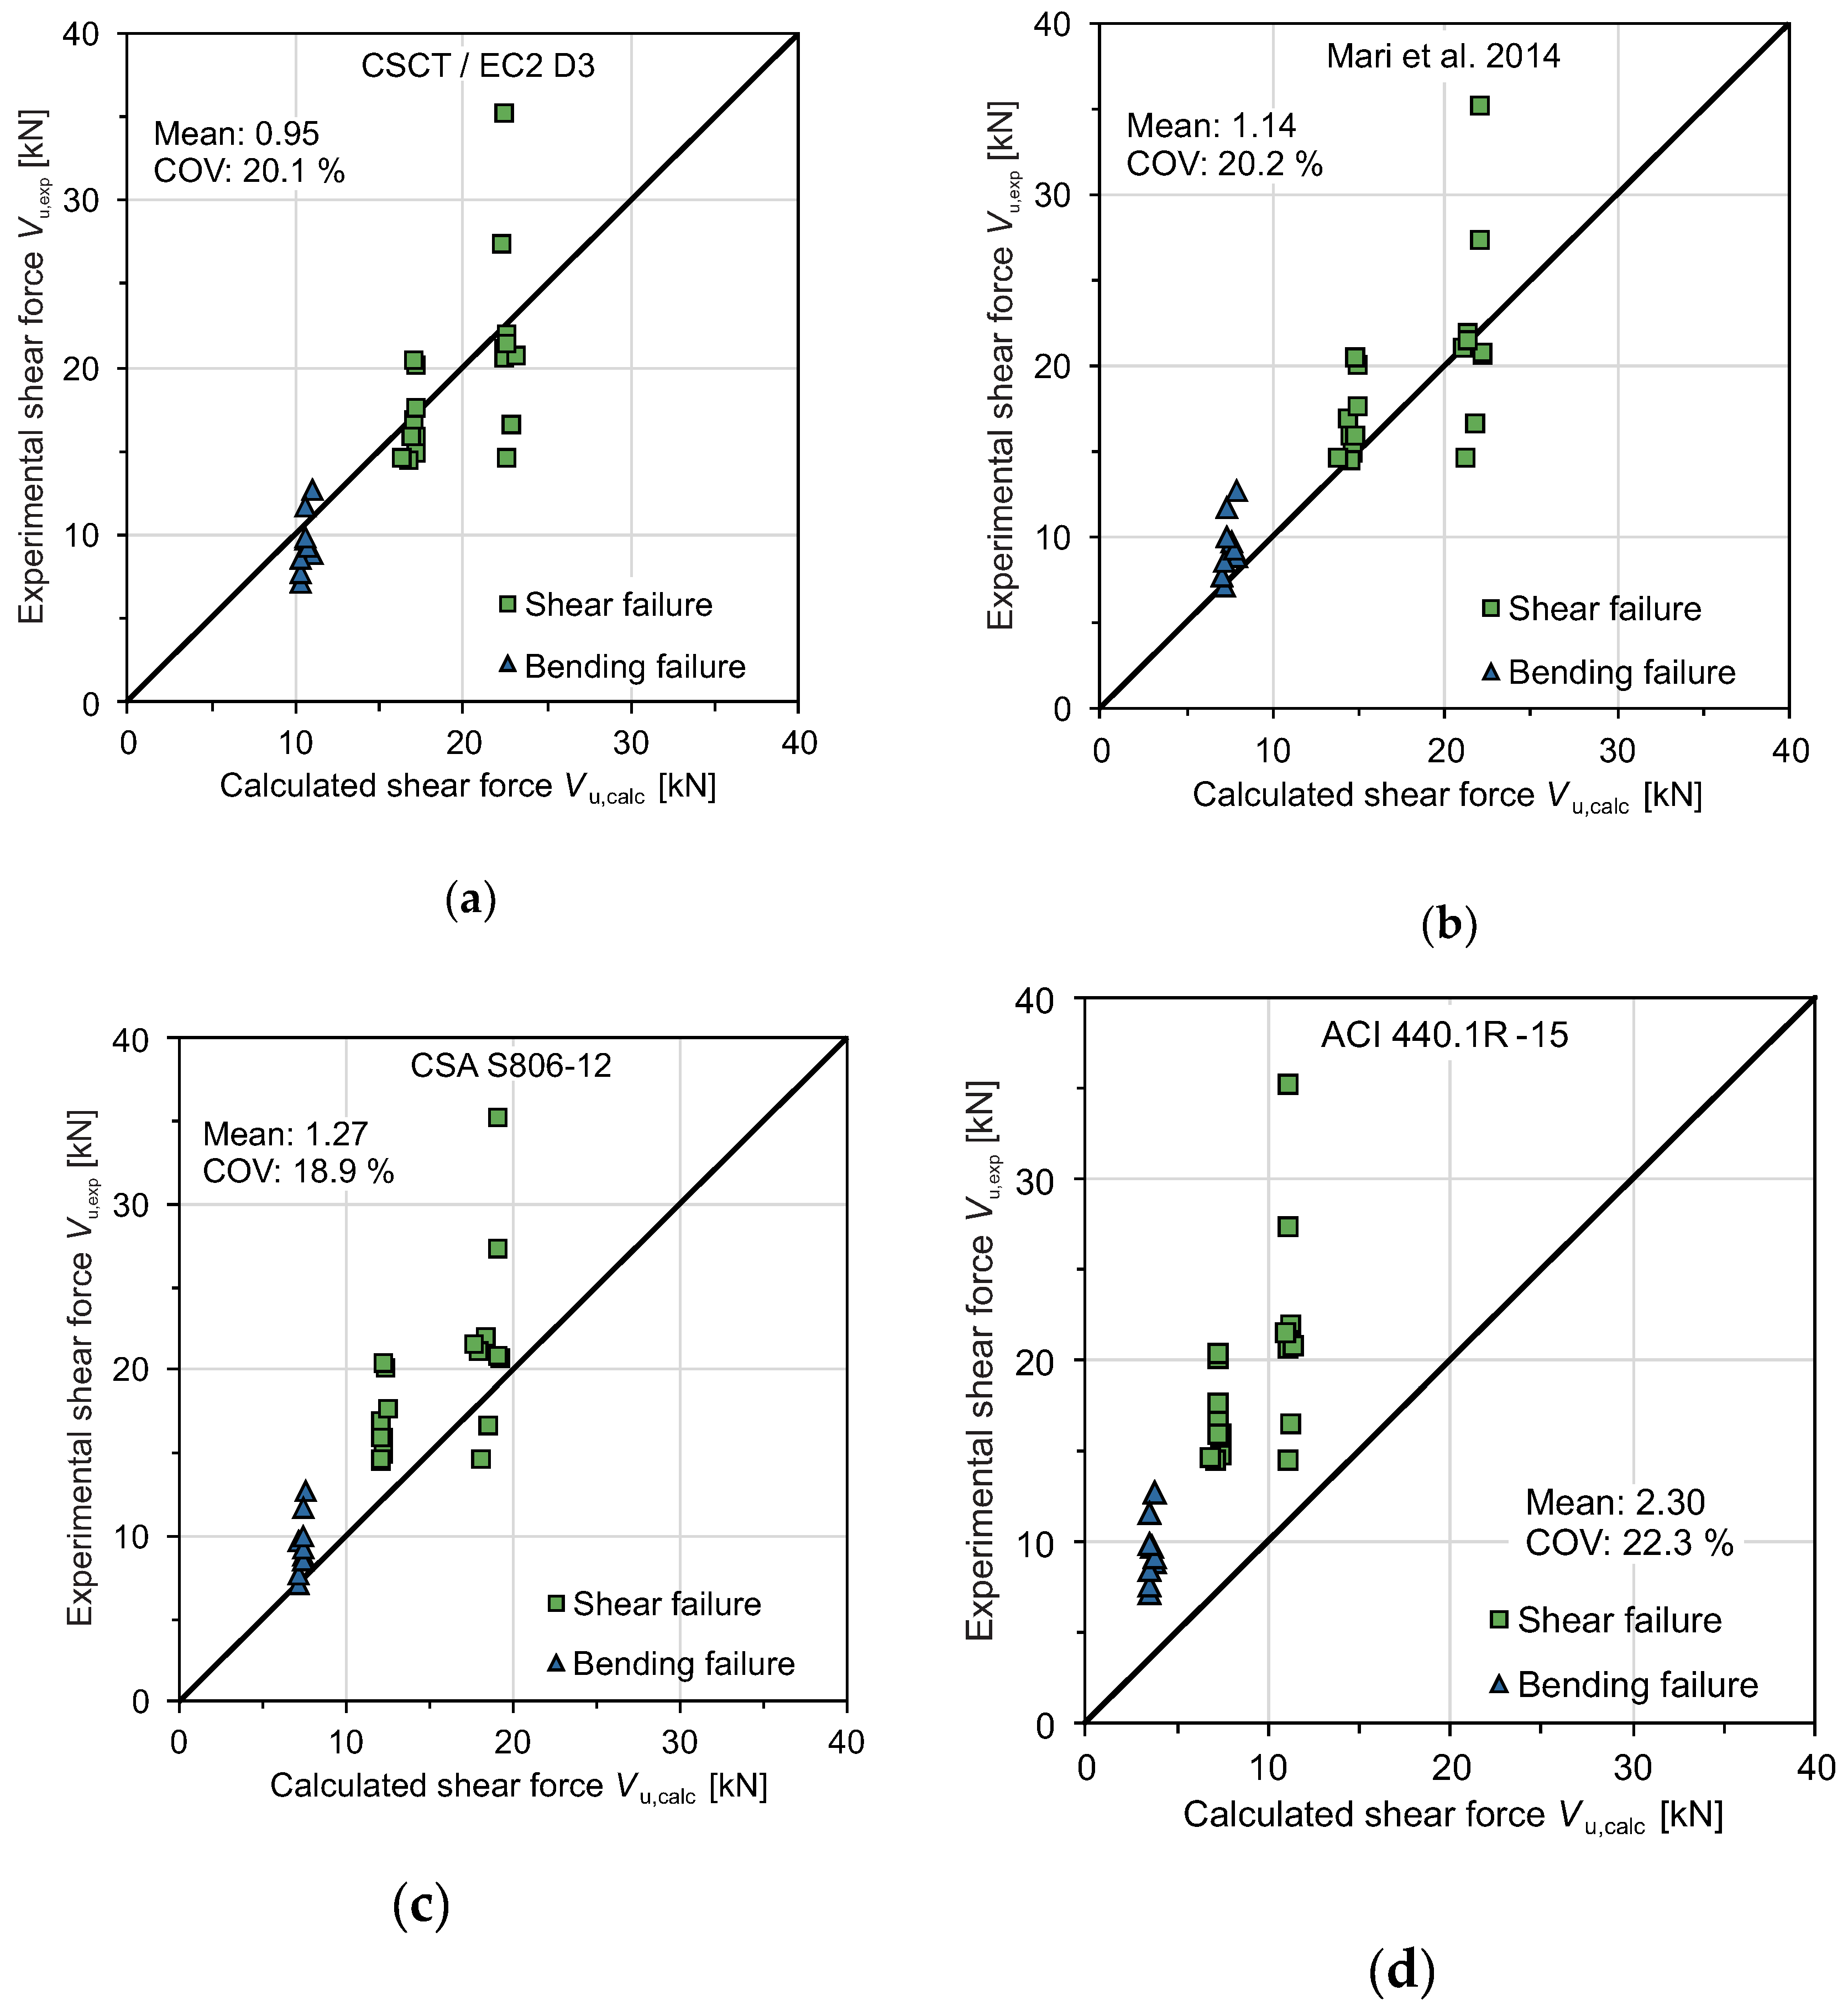
4.3. Comparison to Existing Models and Current Design Provisions

For beams and slabs with FRP-longitudinal reinforcement without shear reinforcement, engineering models and design formulas have been derived and validated by various researchers. Whether these models are directly applicable to the non-metallic grid-like carbon textile reinforcement in slabs or slab segments is discussed in this section. Due to the limited variation in key parameters such as reinforcement ratio, reinforcement ultimate strength, reinforcement modulus of elasticity, and concrete strength, no generalizable statement on transferability is possible. However, the comparison of the experimental results to predicted values enables a first assessment of the applicability of existing models and thus prepares future work.
Two models and two design provisions were chosen for calculation. The model of Mari et al. [46] has been developed specifically for FRP reinforcement based on a mechanical approach in combination with evaluation of an extensive database with genetic programming. An even more general (and more recent) model for steel-reinforced members by the same authors, the Compression Chord Capacity Model [27], is based on similar assumptions but differs in the calculation of the size effect factor. Here, however, the original model for FRP reinforcement has been used. The second model is the simplified shear design approach by Cavagnis, Fernandez Ruiz, and Muttoni [83,84] based on the Critical Shear Crack Theory [22,23]. This model is currently part of the discussion for the upcoming revision of Eurocode 2 [85] and can be used for FRP reinforcement by considering the modulus of elasticity of the longitudinal reinforcement. Keeping in mind that using similar approaches towards the shear design procedures for conventional reinforcement and non-metallic reinforcement is of major interest for practice, the application of the model in this paper is justified.
With the American Concrete Institute (ACI) code 440.1R-15 [54] and the Canadian Standards Association (CSA) Code S806-12 [53], American codes provide established models for shear design of FRP-reinforced concrete members. In contrast to European standardization, a longer experience for the use of FRP especially for bridges exist. Both codes follow the respective shear design tradition for reinforced concrete.
In Table 5, the formulae and variables necessary for calculation of the selected models are summarized. The last column gives comments and explanations regarding how the various parameters were specifically set for prediction of the experimental results of this paper.
The results of the comparison for all four models are shown in Figure 9. The mean value of the experimental to theoretical shear force ratio Vexp/Vcalc is an indicator of accuracy, while the COV is used as a measure of precision. Generally, all models except ACI 440.1R-15 show promising results. The best mean value is obtained by the simplified approach based on critical shear crack theory with Vexp/Vcalc = 0.95, while the CSA S806-12-model leads to the lowest COV with 18.9%.
The ACI 440.1R-15 leads to conservative results, with a mean ratio Vexp/Vcalc = 2.3. Furthermore, this model shows the lowest COV with 22.3%. This observation is consistent with those of other researchers, e.g., [46]. For all models, the high scatter of ultimate shear load for the three largest plate segments (C3-1-12) significantly influences the prediction results. The models cannot represent the direct strut action (tied arch action) adequately. However, these first results indicate that the prediction of shear capacity for TRC with suitable existing models for FRP reinforced concrete or TRC is possible. In order to generalize this finding, comparisons to larger experimental data sets are required. Therefore, especially the variation of the modulus of elasticity of the reinforcement, e.g., by the use of impregnated glass textiles, should be focused in future experimental studies.

5. Conclusions

While numerous studies of FRP-reinforced concrete exist, experimental data and systematic studies on shear behavior of TRC are sparse. Despite similar raw materials (glass, carbon), grid-like textile reinforcement features certain differences compared to FRP bars, e.g. the smaller size and thus lower bending stiffness, the fixed transversal yarns, and the possible variation of cross-sectional dimensions in the longitudinal direction. The use of TRC aims at reducing the member sizes compared to conventional reinforced concrete. This leads to a typically reduced thickness in planar members (e.g., slabs), for which fewer experiments exist both in FRP and steel reinforced concrete.
Despite these differences, the results from an experimental program on 27 slab segments show clear parallels in shear behavior. The formation of the critical shear crack from bending cracks and the similar failure mechanism (shear compression failure) are evident. The formation of longitudinal cracks in the layer of reinforcement combined with concrete spalling can be seen as reason for high scatter in otherwise identical members.
By variation of shear span to depth ratio, the influence of direct load transfer from concentrated loads was investigated. It can be concluded that here, with a shear slenderness larger a/d = 5, no significant reduction of shear capacity occurs. However, a significant difference between a/d = 4 and 5 can be seen, which is a significant difference to reinforced concrete where an influence up to a/d < 2.5–3 is typical. This might be a result from the bond characteristics of the textile reinforcement with its significant longitudinal crack formation in the layer of reinforcement.
The variation of member height in the experimental program showed a reduction of relative shear capacity by increasing effective depth. A first approach to transfer models for consideration of size effect indicates that existing models can be used in TRC shear design.
The comparison of the experimental results to predictions from existing models for shear resistance of FRP-reinforced concrete indicates promising results; several current, readily available models are able to predict the ultimate shear force obtained in the experiments presented here with sufficient accuracy. However, this observation is yet to be validated by comparison to larger data sets in future works. There, a systematic variation of the type of reinforcement (grid opening, yarn spacing), the modulus of elasticity and strength of the reinforcement, the reinforcement ratio, and the maximum grain size and compressive strength of the concrete is necessary.

Author Contributions

Conceptualization, J.B. and V.A.; experiments: J.B.; formal analysis, J.B. and M.C.; writing—original draft preparation, J.B.; writing—review and editing, V.A., J.H. and M.C.; visualization, J.B. and V.A.; supervision, J.H. and M.C.; project administration, J.H.; funding acquisition, J.B. and J.H.

Funding

This research was funded by the German Federal Ministry of Education and Research (BMBF), grant number 03ZZ0304I. The APC was funded by German Federal Ministry of Education and Research (BMBF), grant number 16PGF0147.

Acknowledgments

The authors give their thanks to solidian GmbH for donation of the carbon grid reinforcement used for the experiments. The authors are particularly thankful for the work of Mr. Alexander Böning in preparing and testing the specimens.

Conflicts of Interest

The authors declare no conflict of interest. The founding sponsors had no role in the design of the study; in the collection, analyses, or interpretation of data; in the writing of the manuscript, and in the decision to publish the results.

References

  1. Hegger, J.; Curbach, M.; Stark, A.; Wilhelm, S.; Farwig, K. Innovative design concepts: Application of textile reinforced concrete to shell structures. Struct. Concr. 2018, 19, 637–646. [Google Scholar] [CrossRef]
  2. Tysmans, T.; Adriaenssens, S.; Cuypers, H.; Wastiels, J. Structural analysis of small span textile reinforced concrete shells with double curvature. Compos. Sci. Technol. 2009, 69, 1790–1796. [Google Scholar] [CrossRef]
  3. Kromoser, B.; Preinstorfer, P.; Kollegger, J. Building lightweight structures with carbon-fiber-reinforced polymer-reinforced ultra-high-performance concrete: Research approach, construction materials, and conceptual design of three building components. Struct. Concr. 2018, 112, 106. [Google Scholar] [CrossRef]
  4. Hegger, J.; Voss, S. Investigations on the bearing behaviour and application potential of textile reinforced concrete. Eng. Struct. 2008, 30, 2050–2056. [Google Scholar] [CrossRef]
  5. Sharei, E.; Scholzen, A.; Hegger, J.; Chudoba, R. Structural behavior of a lightweight, textile-reinforced concrete barrel vault shell. Compos. Struct. 2017, 171, 505–514. [Google Scholar] [CrossRef]
  6. De Munck, M.; Tysmans, T.; Verbruggen, S.; Vervloet, J.; El Kadi, M.; Wastiels, J.; Remy, O. Influence of Weathering Conditions on TRC Sandwich Renovation Panels. In Strain-Hardening Cement-Based Composites, SHCC4; Mechtcherine, V., Slowik, V., Kabele, P., Eds.; Springer: Berlin/Heidelberg, Germany, 2017; pp. 659–667. ISBN 978-94-024-1193-5. [Google Scholar]
  7. Scheerer, S.; Chudoba, R.; Garibaldi, M.P.; Curbach, M. Shells Made of Textile Reinforced Concrete—Applications in Germany. J. IASS 2017, 58, 79–93. [Google Scholar] [CrossRef]
  8. De Sutter, S.; Remy, O.; Tysmans, T.; Wastiels, J. Development and experimental validation of a lightweight Stay-in-Place composite formwork for concrete beams. Constr. Build. Mater. 2014, 63, 33–39. [Google Scholar] [CrossRef]
  9. May, S.; Michler, H.; Schladitz, F.; Curbach, M. Lightweight ceiling system made of carbon reinforced concrete. Struct. Concr. 2018, 19, 1862–1872. [Google Scholar] [CrossRef]
  10. Bielak, J.; Hegger, J.; Chudoba, R. Towards Standardization: Testing and Design of Carbon Concrete Composites. In High Tech Concrete: Where Technology and Engineering Meet, Proceedings of the 2017 fib Symposium, Maastricht, The Netherlands, 12–14 June 2017; Hordijk, D.A., Luković, M., Eds.; Springer International Publishing: Cham, Switzerland, 2017; pp. 313–320. ISBN 3319594710. [Google Scholar]
  11. Hegger, J.; Kulas, C.; Horstmann, M. Realization of TRC Façades with Impregnated AR-Glass Textiles. KEM 2011, 466, 121–130. [Google Scholar] [CrossRef]
  12. Kulas, C.; Schneider, M.; Will, N.; Grebe, R. Hinterlüftete Vorhangfassaden aus Textilbeton. Bautechnik 2011, 88, 271–280. [Google Scholar] [CrossRef]
  13. Hegger, J.; Horstmann, M.; Shams, A. Load-carrying behavior of sandwich panels at ultimate limite state. In Proceedings of the fib Symposium Prague 2011, Praha, Czech Republic, 8–10 June 2011. [Google Scholar]
  14. Shams, A.; Horstmann, M.; Hegger, J. Experimental investigations on Textile-Reinforced Concrete (TRC) sandwich sections. Compos. Struct. 2014, 118, 643–653. [Google Scholar] [CrossRef]
  15. Hering Bau GmbH & Co. KG. Hering Architectural Concrete: betoshell®. Available online: https://www.heringinternational.com/en/products-services/architectural-concrete/material-concepts/textile-reinforced-concrete/ (accessed on 15 February 2019).
  16. Rempel, S.; Kulas, C.; Will, N.; Bielak, J. Extremely Light and Slender Precast Pedestrian-Bridge Made Out of Textile-Reinforced Concrete (TRC). In High Tech Concrete: Where Technology and Engineering Meet, Proceedings of the 2017 fib Symposium, Maastricht, The Netherlands, 12–14 June 2017; Hordijk, D.A., Luković, M., Eds.; Springer International Publishing: Cham, Switzerland, 2017; pp. 2530–2537. ISBN 3319594710. [Google Scholar]
  17. Helbig, T.; Unterer, K.; Kulas, C.; Rempel, S.; Hegger, J. Fuß- und Radwegbrücke aus Carbonbeton in Albstadt-Ebingen. Beton- und Stahlbetonbau 2016, 111, 676–685. [Google Scholar] [CrossRef]
  18. Hegger, J.; Goralski, C.; Kulas, C. Schlanke Fußgängerbrücke aus Textilbeton. Beton- und Stahlbetonbau 2011, 106, 64–71. [Google Scholar] [CrossRef]
  19. Hegger, J.; Kulas, C.; Raupach, M.; Büttner, T. Tragverhalten und Dauerhaftigkeit einer schlanken Textilbetonbrücke. Beton- und Stahlbetonbau 2011, 106, 72–80. [Google Scholar] [CrossRef]
  20. Rempel, S. Erste Straßenbrücke aus Carbonbeton. In Tagungsband der 9. Carbon- und Textilbetontage; Tudalit e.V. und C3—Carbon Concrete Composite e.V.: Dresden, Germany, 2017; pp. 40–41. [Google Scholar]
  21. Schumann, A.; Michler, H.; Schladitz, F.; Curbach, M. Parking slabs made of carbon reinforced concrete. Struct. Concr. 2018, 19, 647–655. [Google Scholar] [CrossRef]
  22. Cavagnis, F.; Fernández Ruiz, M.; Muttoni, A. A mechanical model for failures in shear of members without transverse reinforcement based on development of a critical shear crack. Eng. Struct. 2018, 157, 300–315. [Google Scholar] [CrossRef]
  23. Cavagnis, F.; Fernández Ruiz, M.; Muttoni, A. Shear failures in reinforced concrete members without transverse reinforcement: An analysis of the critical shear crack development on the basis of test results. Eng. Struct. 2015, 103, 157–173. [Google Scholar] [CrossRef]
  24. Herbrand, M.; Kueres, D.; Claßen, M.; Hegger, J. Einheitliches Querkraftmodell zur Bemessung von Stahl- und Spannbetonbrücken im Bestand. Beton- und Stahlbetonbau 2016, 111, 58–67. [Google Scholar] [CrossRef]
  25. Tue, N.V.; Theiler, W.; Tung, N.D. Schubverhalten von Biegebauteilen ohne Querkraftbewehrung. Beton- und Stahlbetonbau 2014, 109, 666–677. [Google Scholar] [CrossRef]
  26. Herbrand, M. Shear Strength Models for Reinforced and Prestressed Concrete Members. Ph.D. Thesis, RWTH Aachen University, Aachen, Germany, 2017. [Google Scholar]
  27. Cladera, A.; Marí, A.; Bairán, J.M.; Ribas, C.; Oller, E.; Duarte, N. The compression chord capacity model for the shear design and assessment of reinforced and prestressed concrete beams. Struct. Concr. 2016, 17, 1017–1032. [Google Scholar] [CrossRef]
  28. Adam, V.; Herbrand, M.; Claßen, M. Experimentelle Untersuchungen zum Einfluss der Bauteilbreite und der Schubschlankheit auf die Querkrafttragfähigkeit von Stahlbetonplatten ohne Querkraftbewehrung. Bauingenieur 2018, 93, 37–45. [Google Scholar]
  29. Herbrand, M.; Classen, M. Shear tests on continuous prestressed concrete beams with external prestressing. Struct. Concr. 2015, 16, 428–437. [Google Scholar] [CrossRef]
  30. Herbrand, M.; Classen, M.; Adam, V. Querkraftversuche an Spannbetondurchlaufträgern mit Rechteck- und I-Querschnitt. Bauingenieur 2017, 92, 465–473. [Google Scholar]
  31. Fischer, O.; Schramm, N.; Gehrlein, S. Labor- und Feldversuche zur realitätsnahen Beurteilung der Querkrafttragfähigkeit von bestehenden Spannbetonbrücken. Bauingenieur 2017, 92, 465–473. [Google Scholar]
  32. Rombach, G.; Henze, L. Querkrafttragfähigkeit von Stahlbetonplatten ohne Querkraftbewehrung unter konzentrierten Einzellasten. Beton- und Stahlbetonbau 2017, 112, 568–578. [Google Scholar] [CrossRef]
  33. Gleich, P.; Maurer, R. Querkraftversuche an Spannbetondurchlaufträgern mit Plattenbalkenquerschnitt. Bauingenieur 2018, 93, 68–72. [Google Scholar]
  34. Reissen, K.; Classen, M.; Hegger, J. Shear in reinforced concrete slabs—Experimental investigations in the effective shear width of one-way slabs under concentrated loads and with different degrees of rotational restraint. Struct. Concr. 2018, 19, 36–48. [Google Scholar] [CrossRef]
  35. Huber, P.; Kromoser, B.; Huber, T.; Kollegger, J. Experimentelle Untersuchung zum Querkrafttragverhalten von Spannbetonträgern mit geringer Schubbewehrung. Bauingenieur 2016, 91, 238–247. [Google Scholar]
  36. Huber, P.; Kromoser, B.; Huber, T.; Kollegger, J. Berechnungsansatz zur Ermittlung der Schubtragfähigkeit bestehender Spannbetonbrückenträger mit geringem Querkraftbewehrungsgrad. Bauingenieur 2016, 91, 227–237. [Google Scholar]
  37. Javidmehr, S.; Oettel, V.; Empelmann, M. Schrägrissbildung von Stahlbetonbalken unter Querkraftbeanspruchung. Bauingenieur 2018, 93, 248–254. [Google Scholar]
  38. Alam, M.; Hussein, A. Shear Strength of concrete beams reinforced with Glass Fibre Reinforced Polymer (GFRP) Bars. In Fibre-Reinforced Polymer Reinforcement for Concrete Structures, Proceedings of the 9th International Conference (FRPRCS-9), Sydney, Australia, 13–15 July 2009; Oehlers, D.J., Griffith, M.C., Seracino, R., Eds.; University of Adelaide: Adelaide, Australia, 2009; ISBN 9780980675504. [Google Scholar]
  39. Olivito, R.S.; Zuccarello, F.A. On the Shear Behaviour of Concrete Beams Reinforced by Carbon Fibre-Reinforced Polymer Bars: An Experimental Investigation by Means of Acoustic Emission Technique. Strain 2010, 46, 470–481. [Google Scholar] [CrossRef]
  40. El-Sayed, A.K.; El-Salakawy, E.F.; Benmokrane, B. Shear strength of fibre-reinforced polymer reinforced concrete deep beams without web reinforcement. Can. J. Civ. Eng. 2012, 39, 546–555. [Google Scholar] [CrossRef]
  41. Razaqpur, A.G.; Isgor, B.O. Proposed Shear Design Method for FRP-Reinforced Concrete Members without Stirrups. ACI Struct. J. 2006, 103, 93–102. [Google Scholar] [CrossRef]
  42. Kilpatrick, A.; Easden, L. shear capacity of GFRP reinforced high strength concrete slabs. In Developments in Mechanics of Structures and Materials, Proceedings of the 18th Australasian Conference on the Mechanics Structures and Materials (ACMSM-18), Perth, Australien, Dezember 2004; Deeks, A.J., Hao, H., Eds.; CRC Press: Boca Raton, FL, USA, 2004; ISBN 9058096599. [Google Scholar]
  43. Tariq, M. Effects of Flexural Reinforcement Properties on shear Strength of Concrete Beams. Master’s Thesis, Dalhousie University, Halifax, NS, Canada, 2003. [Google Scholar]
  44. Alam, M.S. Influence of Different Parameters on Shear Strength of FRP Reinforced Concrete Beams without Web Reinforcement. Ph.D. Thesis, Memorial University of Newfoundland, St. John’s, NL, Canada, 2010. [Google Scholar]
  45. Matta, F.; Nanni, A.; Hernandez, T.; Benmokrane, B. Scaling of strength of FRP reinforced concrete beams without shear reinforcement. In FRP Composites in Civil Engineering, Proceedings of the 4th International Conference (CICE 2008), Zürich, Switzerland, 22–24 July 2008; Motavalli, M., Ed.; Structural Engineering Research Laboratory EMPA: Dübendorf, Switzerland, 2008; ISBN 9783905594508. [Google Scholar]
  46. Marí, A.; Cladera, A.; Oller, E.; Bairán, J. Shear design of FRP reinforced concrete beams without transverse reinforcement. Compos. Part B Eng. 2014, 57, 228–241. [Google Scholar] [CrossRef]
  47. Kurth, M.; Hegger, J. Zur Querkrafttragfähigkeit von Betonbauteilen mit Faserverbundkunststoff-Bewehrung—Ableitung eines Bemessungsansatzes. Bauingenieur 2013, 88, 403–411. [Google Scholar]
  48. Yost, J.R.; Gross, S.P.; Dinehart, D.W. Shear Strength of Normal Strength Concrete Beams Reinforced with Deformed GFRP Bars. J. Compos. Constr. 2001, 5, 268–275. [Google Scholar] [CrossRef]
  49. Ahmed, E.A.; El-Salakawy, E.; Benmokrane, B. Behavior of concrete beams reinforced with carbon FRP stirrups. In FRP Composites in Civil Engineering, Proceedings of the 4th International Conference (CICE 2008), Zürich, Switzerland, 22–24 July 2008; Motavalli, M., Ed.; Structural Engineering Research Laboratory EMPA: Dübendorf, Switzerland, 2008; ISBN 9783905594508. [Google Scholar]
  50. Okamoto, T.; Nagasaka, T.; Tanigaki, M. Shear Capacity of Concrete Beams Using FRP Reinforcement. Trans. AIJ 1994, 59, 127–136. [Google Scholar] [CrossRef]
  51. Tottori, S.; Wakui, H. Shear Capacity of RC and PC Beams Using FRP Reinforcement. ACI Spec. Publ. 1993, 138, 615–632. [Google Scholar]
  52. FIB. Fib Model Code for Concrete Structures 2010, 1st ed.; Ernst und Sohn: Berlin, Germany, 2013; ISBN 9783433604083. [Google Scholar]
  53. Canadian Standards Association. S806-12 (R2017): Design and Construction of Building Structures with Fibre-Reinforced Polymers; Canadian Standards Association: Mississauga, ON, Canada, 2012. [Google Scholar]
  54. American Concrete Institute. ACI 440.1R-15 Guide for the Design and Constuction of Structural Concrete Reinforced with Fiber-Reinforced Polymer (FRP) Bars; American Concrete Institute: Farmington Hills, MI, USA, 2015. [Google Scholar]
  55. Kani, G. The Riddle of Shear Failure and its Solution. ACI Struct. J. 1964, 61, 441–468. [Google Scholar]
  56. Lieboldt, M.; Tietze, M.; Schladitz, F. C3-Projekt—Erfolgreiche Partnerschaft für Innovation im Bauwesen. Bauingenieur 2018, 93, 265–273. [Google Scholar]
  57. RWTH Aachen, Lehrstuhl und Institut für Massivbau; Hegger, J.; Chudoba, R.; Scholzen, A.; Bielak, J. Carbon Conrete composite—C3. Schlussbericht C3-B3 TP9: Standardisierte Prüfkonzepte zur Bauteilprüfung unter zyklischer Belastung: Laufzeit des Vorhabens: 01.01.2015 bis 30.06.2016; RWTH Aachen University, Lehrstuhl und Institut für Massivbau: Aachen, Germany, 2016. [Google Scholar]
  58. Kromoser, B.; Huber, P.; Preinstorfer, P. Experimental study of the shear behaviour of thin walled CFRP reinforced UHPC structures. In Better, Smarter, Stronger. Proceedings for the 2018 fib Congress, Melbourne, Australia, 7–11 October 2018; Foster, S., Gilbert, I.R., Mendis, P., Al-Mahaidi, R., Millar, D., Eds.; Fédération Internationale du Béton (FIB): Lausanne, Switzerland, 2018; pp. 1744–1750. [Google Scholar]
  59. El Kadi, M. Experimental Characterization, Benchmarking and Modelling of 3D Textile Reinforced Cement Composites. Ph.D. Thesis, Vrije Universiteit Brussel, Brussels, Belgium, 2019. [Google Scholar]
  60. Scholzen, A.; Chudoba, R.; Hegger, J. Thin-walled shell structures made of textile-reinforced concrete: Part I. Struct. Concr. 2015, 16, 106–114. [Google Scholar] [CrossRef]
  61. Hegger, J.; Will, N. Textile-reinforced concrete: Design models. In Textile Fibre Composites in Civil Engineering; Triantafillou, T., Ed.; Woodhead Publishing: Oxford, UK, 2016; pp. 189–207. ISBN 1782424466. [Google Scholar]
  62. Schütze, E.; Bielak, J.; Scheerer, S.; Hegger, J.; Curbach, M. Einaxialer Zugversuch für Carbonbeton mit textiler Bewehrung. Beton- und Stahlbetonbau 2018, 113, 33–47. [Google Scholar] [CrossRef]
  63. Meßerer, D.; Heiden, B.; Bielak, J.; Holschemacher, K. Prüfverfahren zur Ermittlung des Krümmungseinflusses auf die Zugfestigkeit von Textilbeton. Bauingenieur 2018, 93, 454–462. [Google Scholar]
  64. Rempel, S. Zur Zuverlässigkeit der Bemessung von Biegebeanspruchten Betonbauteilen mit Textiler Bewehrung. Ph.D. Thesis, RWTH Aachen University, Aachen, Germany, 2018. [Google Scholar]
  65. Hinzen, M. Prüfmethode zur Ermittlung des Zugtragverhaltens von textiler Bewehrung für Beton. Bauingenieur 2017, 92, 289–291. [Google Scholar]
  66. Vorechovský, M.; Chudoba, R. Stochastic modeling of multi-filament yarns: II. Random properties over the length and size effect. Int. J. Solids Struct. 2006, 43, 435–458. [Google Scholar] [CrossRef]
  67. Vorechovsky, M.; Rypl, R.; Chudoba, R. Probabilistic crack bridge model reflecting random bond properties and elastic matrix deformation. Compos. Part B Eng. 2018, 139, 130–145. [Google Scholar] [CrossRef]
  68. Rempel, S.; Ricker, M. Ermittlung der Materialkennwerte der Bewehrung für die Bemessung von textilbewehrten Bauteilen. Bauingenieur 2017, 92, 280–288. [Google Scholar]
  69. Bielak, J.; Spelter, A.; Will, N.; Claßen, M. Verankerungsverhalten textiler Bewehrungen in dünnen Betonbauteilen. Beton- und Stahlbetonbau 2018, 113, 515–524. [Google Scholar] [CrossRef]
  70. Schneider, K.; Butler, M.; Mechtcherine, V. Carbon Concrete Composites C3—Nachhaltige Bindemittel und Betone für die Zukunft. Beton- und Stahlbetonbau 2017, 112, 784–794. [Google Scholar] [CrossRef]
  71. DIN Deutsches Institut für Normung e.V. DIN EN 206 Beton—Festlegung, Eigenschaften, Herstellung und Konformität; Deutsche Fassung EN 206:2013+A1:2016; ICS 91.100.30; Beuth Verlag GmbH: Berlin, Germany, 2017. [Google Scholar]
  72. DIN Deutsches Institut für Normung e.V. Prüfverfahren für Zement—Teil 1: Bestimmung der Festigkeit; 91.100.10 (DIN EN 196-1); Beuth Verlag GmbH: Berlin, Germany, 2005. [Google Scholar]
  73. DIN Deutsches Institut für Normung e.V. DIN EN 12390-13:2014-06: Prüfung von Festbeton—Bestimmung des Elastitzitätsmoduls unter Druckbelastung (Sekantenmodul). Deutsche Fassung EN 12390-13:2013; 91.100.30; Beuth Verlag GmbH: Berlin, Germany, 2014. [Google Scholar]
  74. DIN Deutsches Institut für Normung e.V. Prüfung von Festbeton—Teil 3: Druckfestigkeit von Probeköpern; 91.100.30 (DIN EN 12390-3); Beuth Verlag GmbH: Berlin, Germany, 2009. [Google Scholar]
  75. Leonhardt, F.; Walther, R. Schubversuche an Einfeldrigen Stahlbetonbalken mit und ohne Schubbewehrung zur Ermittlung der Schubtragfähigkeit und der oberen Schubspannungsgrenze; Schriftenreihe des Deutschen Ausschusses für Stahlbeton No. 151; Ernst: Berlin, Germany, 1962. [Google Scholar]
  76. Kurth, M.C. Zum Querkrafttragverhalten von Betonbauteilen mit Faserverbundkunststoff-Bewehrung. Ph.D. Thesis, RWTH Aachen University, Aachen, Germany, 2012. [Google Scholar]
  77. Niewels, J. Zum Tragverhalten von Betonbauteilen mit Faserverbundkunststoff-Bewehrung. Ph.D. Thesis, RWTH Aachen University, Aachen, Germany, 2008. [Google Scholar]
  78. Bazant, Z.P.; Chen, E.-P. Scaling of Structural Failure. Appl. Mech. Rev. 1997, 50, 593–627. [Google Scholar] [CrossRef]
  79. Deutsches Institut für Normung e.V. DIN EN 1992-1-1:2011-01: Eurocode 2: Bemessung und Konstruktion von Stahlbeton- und Spannbetontragwerken—Teil 1-1: Allgemeine Bemessungsregeln und Regeln für den Hochbau. Deutsche Fassung EN 1992-1-1:2004 + AC:2010; 91.010.30; 91.080.40; Beuth Verlag GmbH: Berlin, Germany, 2011. [Google Scholar]
  80. Bentz, E.C.; Veccio, F.J.; Collins, M.P. Simplified Modified Compression Field Theory for calculating shear strength of reinforced concrete members. ACI Struct. J. 2006, 103, 614–624. [Google Scholar]
  81. Bazant, Z.P.; Kim, J.-K. Size Effect in Shear Failure of Longitudinally Reinforced Beams. ACI J. 1984, 81, 456–468. [Google Scholar]
  82. Herbrand, M.; Kueres, D.; Stark, A.; Claßen, M. Numerische Simulation von balken- und plattenförmigen Bauteilen aus Stahlbeton und UHPC mit einem plastischen Schädigungsmodell. Bauingenieur 2016, 91, 46–56. [Google Scholar]
  83. Muttoni, A.; Fernández Ruiz, M.; Cavagnis, F. From detailed test observations to mechanical models and simple shear design equations. In Towards a Rational Understanding of Shear in Beams and Slabs: Fib Bulletin 85: Workshop in Zürich, Switzerland September 2016; Bayrak, O., Fernández Ruiz, M., Kaufmann, W., Muttoni, A., Eds.; Fédération Internationale du Béton (FIB): Lausanne, Switzerland, 2018; pp. 17–32. ISBN 2883941254. [Google Scholar]
  84. Cavagnis, F. Shear in Reinforced Concrete without Transverse Reinforcement: from Refined Experimental Measurements to Mechanical Models. Ph.D. Thesis, Ecole Polytechnique Fédérale de Lausanne, Lausanne, Switzerland, 2017. [Google Scholar]
  85. CEN European Committee for Standardization. prEN 1992-1-1:2018: Eurocode 2: Design of Concrete Structures—Part 1-1: General Rules, Rules for Buildings, Bridges and Civil Engineering Structures. Draft 3; CEN: Brussels, Belgium, 2018. [Google Scholar]
  86. ACI Committee. Building Code Requirements for Structural Concrete (ACI 318-14); American Concrete Institute (ACI): Farmington Hills, MI, USA, 2014. [Google Scholar]
Figure 1. Test setup and instrumentation for three-point bending tests.
Applsci 09 01382 g001
Figure 2. Reinforcement layout for test series: (a) Planar biaxial grid made of carbon with epoxy impregnation; (b) formwork with bottom reinforcement layer projecting beyond the end; (c) cross-section of the three specimen types.
Applsci 09 01382 g002
Figure 3. Failure mechanisms observed in experimental study (a) bending failure; (b) shear-compression failure.
Applsci 09 01382 g003
Figure 4. Experimental results for three typical specimens with d = 8 cm. (a) Load-deflection diagram; (b) load-compressive strain diagram (strain gauge at the top of the specimen in mid-span).
Applsci 09 01382 g004
Figure 5. Crack pattern and failure mechanism for d = 12 cm shear test series.
Applsci 09 01382 g005
Figure 6. Crack pattern and failure mechanism for d = 8 cm shear test series.
Applsci 09 01382 g006
Figure 7. Results of experimental test program: (a) Influence of the ratio of shear span to effective depth on shear force; (b) Influence of effective depth on shear stress (size effect).
Applsci 09 01382 g007
Figure 8. Relative shear stress considering the size effect factor according to Bazant [81] with λ0 = 25 and da = 4 mm.
Applsci 09 01382 g008
Figure 9. Comparison of experimental results to predicted shear force: (a) Critical shear crack theory (CSCT) [83,84,85]; (b) Model by Mari et al. [46]; (c) Design formula from CSA S8-06-12 [53]; (d) Design formula from ACI 440.1R-15 [54].
Applsci 09 01382 g009
Table 1. Parameter variation for the experimental study.
Shear Slenderness a/dEffective Depth
44 cm
58 cm
612 cm
Table 2. Reinforcement characteristics for solidian Grid Q95/95-CCE-38 (properties of one individual yarn, from [64] with test setup according to [65]).
CharacteristicUnitWarp Direction (0°)Weft Direction (90°)
Modulus of elasticity[MPa]244,835243,828
Mean ultimate stress[MPa]3221 (n = 204 tests)3334 (n = 218 tests)
5% quantile ultimate stress[MPa]27372762
Mean ultimate strain[‰]13.213.7
Axial spacing of yarns[mm]3838
Cross-sectional area per yarn 1[mm2]3.62 13.62 1
Cross-sectional area per meter 1[mm2/m]95 195 1
1 Filament area without epoxy-impregnation.
Table 3. Mix design of cementitious matrix for HF-2-165-4 (mix design adapted from [70]).
SubstanceDensityContent
kg/m3kg/m3
Cementitious binder compound CEM II/C-M Deuna2962707
Fine quartz sand F38 S2650294
Quartz sand 0.1–0.5 mm2630243.2
Quartz sand 0.5–1.0 mm2630201.4
Quartz sand 1.0–2.0 mm2630148.9
Quartz sand 2.0–4.0 mm2630593.5
Superplasticizer (polycarboxylatether-basis) MC-VP-16-0205-02 107015
Water1000165
Table 4. Experimental results of shear tests.
SpecimenTotal LengthSpan LengthWidthHeightEffective DepthShear SpanShear SlendernessNo. LayersNo. YarnsReinforcement Concrete CharacteristicsInitial Crack LoadUltimate Shear LoadUltimate Bending MomentFailure Mode
AreaRatio
ltotlbhdaa/dnlayernyarnAnmρlagefcm,cubefcm,cylfcm,prisfctm,flEcmVcrackVuMu
[mm][mm][mm][mm][mm][mm][-][-][-][mm2][%][d][MPa][MPa][MPa][MPa][MPa][kN][kN][kNm]
C3-1-12-1154014401981451217205.9331554.30.22628127.1106.2119.116.444,01010.0321.9115.77Shear compression
C3-1-12-2154014402001451187206.1231554.30.23128127.1106.2119.116.444,01010.8521.0315.13Shear compression
C3-1-12-3154014401991441207206.0231554.30.22828127.1106.2119.116.444,01010.3214.5510.47Shear compression
C3-2-12-110609601991451214803.9631554.30.22528126.1101.1120.318.145,34616.0727.3012.98Shear compression
C3-2-12-210609602001451214803.9631554.30.22428126.1101.1120.318.145,34617.5035.1916.89Shear compression
C3-2-12-310609602001461224803.9531554.30.22328126.1101.1120.318.145,34617.1520.599.88Shear compression
C3-3-12-1130012001991471266004.7731554.30.21728129.6108.9126.615.544,42912.7020.7312.43Shear compression
C3-3-12-2130012002001431216004.9631554.30.22428129.6108.9126.615.544,42912.7416.569.93Shear compression
C3-3-12-3130012002001451166005.1631554.30.23428129.6108.9126.615.544,42913.7521.4312.85Shear compression
C3-1-8-1106096020099764806.3021036.20.23829127.1106.2116.915.744,0108.7516.868.09Shear compression
C3-1-8-21060960200100794806.0821036.20.22929127.1106.2116.915.744,0108.7814.807.10Shear compression
C3-1-8-31060960201100774806.2021036.20.23329127.1106.2116.915.744,0108.3215.877.62Shear compression
C3-2-8-190080020099774005.2221036.20.23629126.1101.1113.015.145,34610.4214.435.77Shear compression
C3-2-8-2900800199100794005.0421036.20.22929126.1101.1113.015.145,34611.0115.896.35Shear compression
C3-2-8-3900800199100714005.6221036.20.25629126.1101.1113.015.145,34610.3814.605.84Shear compression
C3-3-8-1740640200100773204.1421036.20.23427129.6108.9126.711.944,42913.3317.605.63Shear compression
C3-3-8-274064020099773204.1321036.20.23427129.6108.9126.711.944,42913.2920.046.41Shear compression
C3-3-8-374064019899773204.1521036.20.23727129.6108.9126.711.944,42912.4220.386.52Shear compression
C3-1-4-158048019860352406.921518.10.26430127.1106.2106.715.744,0107.587.151.71Bending (subseq. shear)
C3-1-4-258048019862412405.791518.10.22030127.1106.2106.715.744,0107.988.892.13Bending (yarn rupture)
C3-1-4-358048019859342406.991518.10.26730127.1106.2106.715.744,0106.877.671.84Bending (yarn rupture)
C3-2-4-150040019860392005.121518.10.23432126.1101.1127.617.245,3469.579.731.94Bending (yarn rupture)
C3-2-4-250040019861362005.571518.10.25432126.1101.1127.617.245,34610.418.561.71Bending (yarn rupture)
C3-2-4-350040019861412004.911518.10.22432126.1101.1127.617.245,34610.019.271.85Bending (yarn rupture)
C3-3-4-142032019761411603.931518.10.22629129.6108.9124.210.844,4299.4812.722.03Bending (subseq. shear)
C3-3-4-242032019861361604.441518.10.25429129.6108.9124.210.844,42910.099.931.59Bending (yarn rupture)
C3-3-4-342032019860361604.451518.10.25529129.6108.9124.210.844,4299.9911.691.87Bending (subseq. shear)
Table 5. Summary of design provisions and models used in the study.
Code/ModelShear Strength PredictionComments
CSCT/EC2 D3
[83,84,85]
V R = b w · d · τ R d , c b w · d · τ R d c , m i n with   γ c = 1.0
τ R d , c = 0.6 · ( 100 · ρ l · E s 200,000 · f c · d d g d ) 1 / 3 fc taken as fcm,cyl
ρ l = A s b · d ,   A s :   Area   of   longitudinal   reinforcement   b :   web   width ,   d :   effective   depth
E s :   Modulus   of   elasticity   of   the   longitudinal   reinforcement
d d g = { 16 + D l o w e r 40   [ mm ]   f o r   f c 60   MPa 16 + D l o w e r · ( 60 f c ) 2 40   [ mm ]   f o r   f c > 60   MPa fc taken as fcm,cyl
D l o w e r :   The   smallest   value   of   D m a x   ( coarsest   fraction   of   aggregates ) Here, Dlower is taken as 4 mm
d = { a v = a c s 4 · d      i f   a c s 4 · d d               i f   a c s > 4 · d   w i t h   a c s = | M E d V E d | d Here, av = d/2.
For 3-point loaded single span beams,
|MEd/VEd |= a
τ R d c , m i n = 0.021 E s · f c f y · d d g d Here, fy is taken as mean ultimate reinforcement stress (3221 MPa, Table 2).
fy: Yield strength or strength that has been assumed for the flexural design of the cross-section
Mari et al.
[46]
V u t = f c t , m · ζ · b · d · ( ( 1.072 0.01 · α ) · c l d + 0.036 )
f c t , m = { 0.3 · f c ( 3 2 )   i f   f c 50   N / mm 2 2.12 · ln ( 1 + f c 10 )   i f   f c > 50   N / mm 2 Calculation of fct,m according to EC2,
fc taken as fcm,cyl
ζ = 1.20 0.20 · a d · d a and d in m
α = E r E c ;   E r , E c : modulus   of   elasticity   of   reinforcement   and   concrete Er, Ec taken from experimental data (see Table 4).
c l d = α · ρ r · ( 1 + 1 + ( 2 α · ρ r ) )
ρ r = A s b · d ,   A s :   Area   of   longitudinal   reinforcement
b and d: Web width and effective depth, respectively
CSA S806-12
[53]
V c = 0.05 · λ · k m · k r · k s · ( f c ) ( 1 3 ) · b w · d v with   ϕ c = 1.0
0.11 · f c · b w · d v < V c 0.22 · f c · b w · d v
λ = 1.0   for   normal   concrete
k m = V f · d M f For 3-point loaded single span beams,
Vf/Mf = 1/a
V f ,   M f :   Acting   shear   force   and   moment   at   the   control   section
k r = 1 + ( E F · ρ F f ) 1 3
E F :   Modulus   of   elasticity   of   longitudinal   reinforcement
ρ F f = A F b · d ;   A F : Area   of   longitudinal   reinforcement
k s = 750 450 + d 1.0 d in mm
f c 60   MPa fc taken as
fcm,cyl < 60 = 60 MPa
d v = max ( 0.9 · d ; 0.72 · h )
bw, d, h: Web width, effective depth and member height, respectively
ACI 440.1R-15
[54]
V c = 2 5 f c · b w · k · d Limitation of fc to 10,000 Psi according to [86]
f c 69   MPa
k = 2 · ρ f · n f + ( ρ f · n f ) 2 ρ f · n f
ρ f :   FRP   reinforcement   ratio = A f b w · d
n f = E f E c ;   E f , E c : Modulus   of   elasticity   of   reinforcement   and   concrete
bw and d: Web width and effective depth, respectively

