Machinability of Stone—Plastic Materials During Diamond Planing


Abstract
:
1. Introduction
2. Materials and Methods
2.1. Testing Material
2.2. Cutting Tools
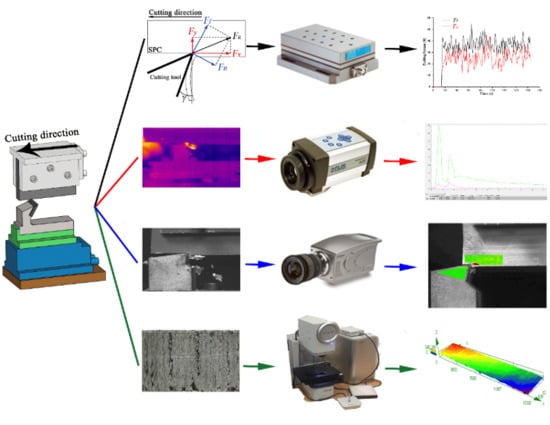
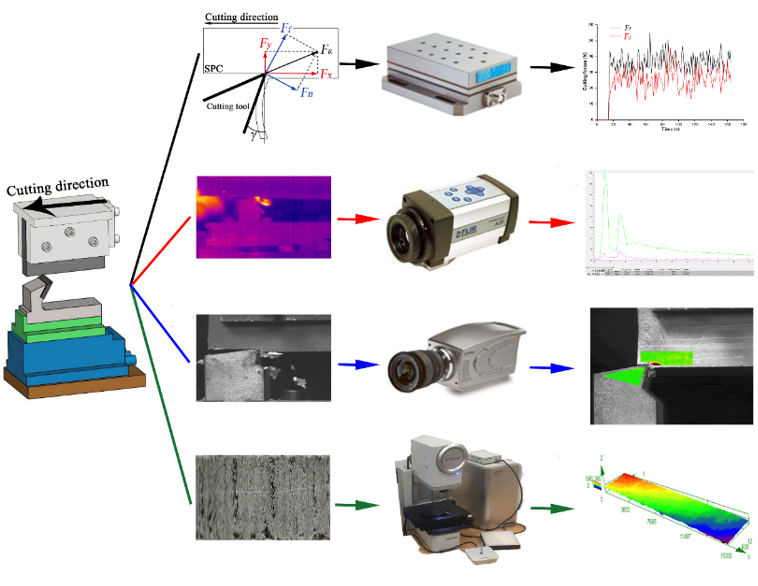
2.3. Experimental Procedure
3. Results and Discussion
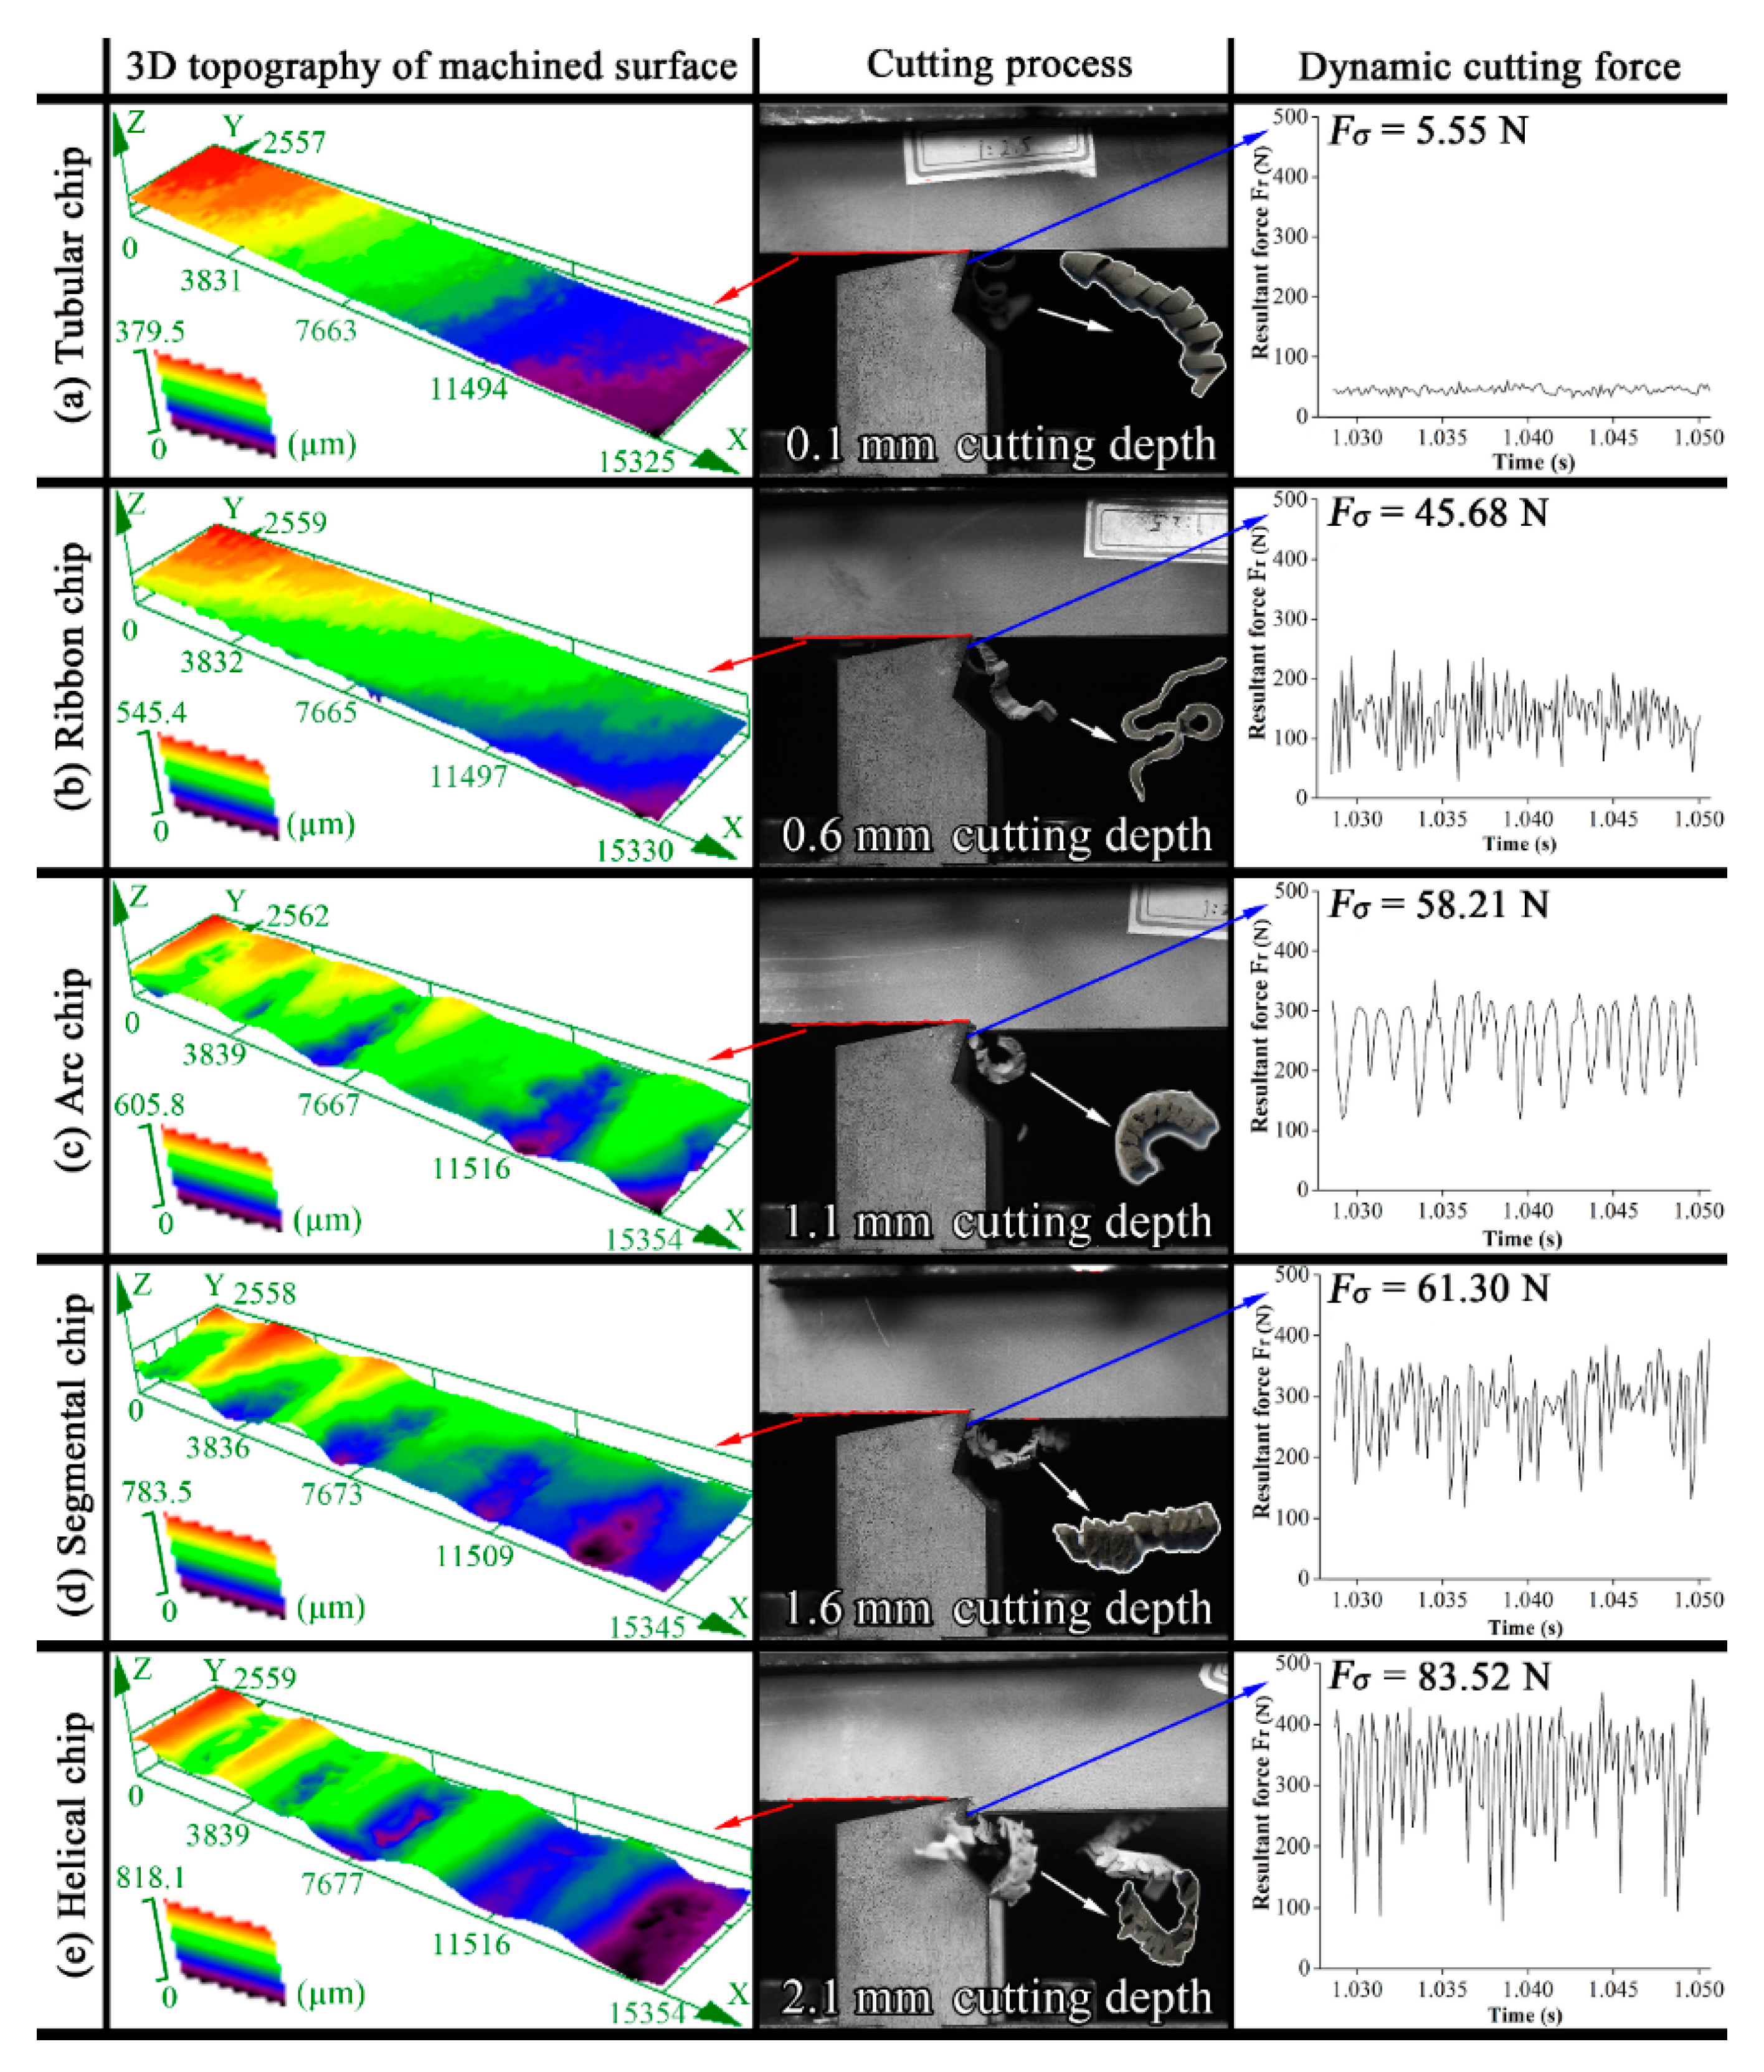
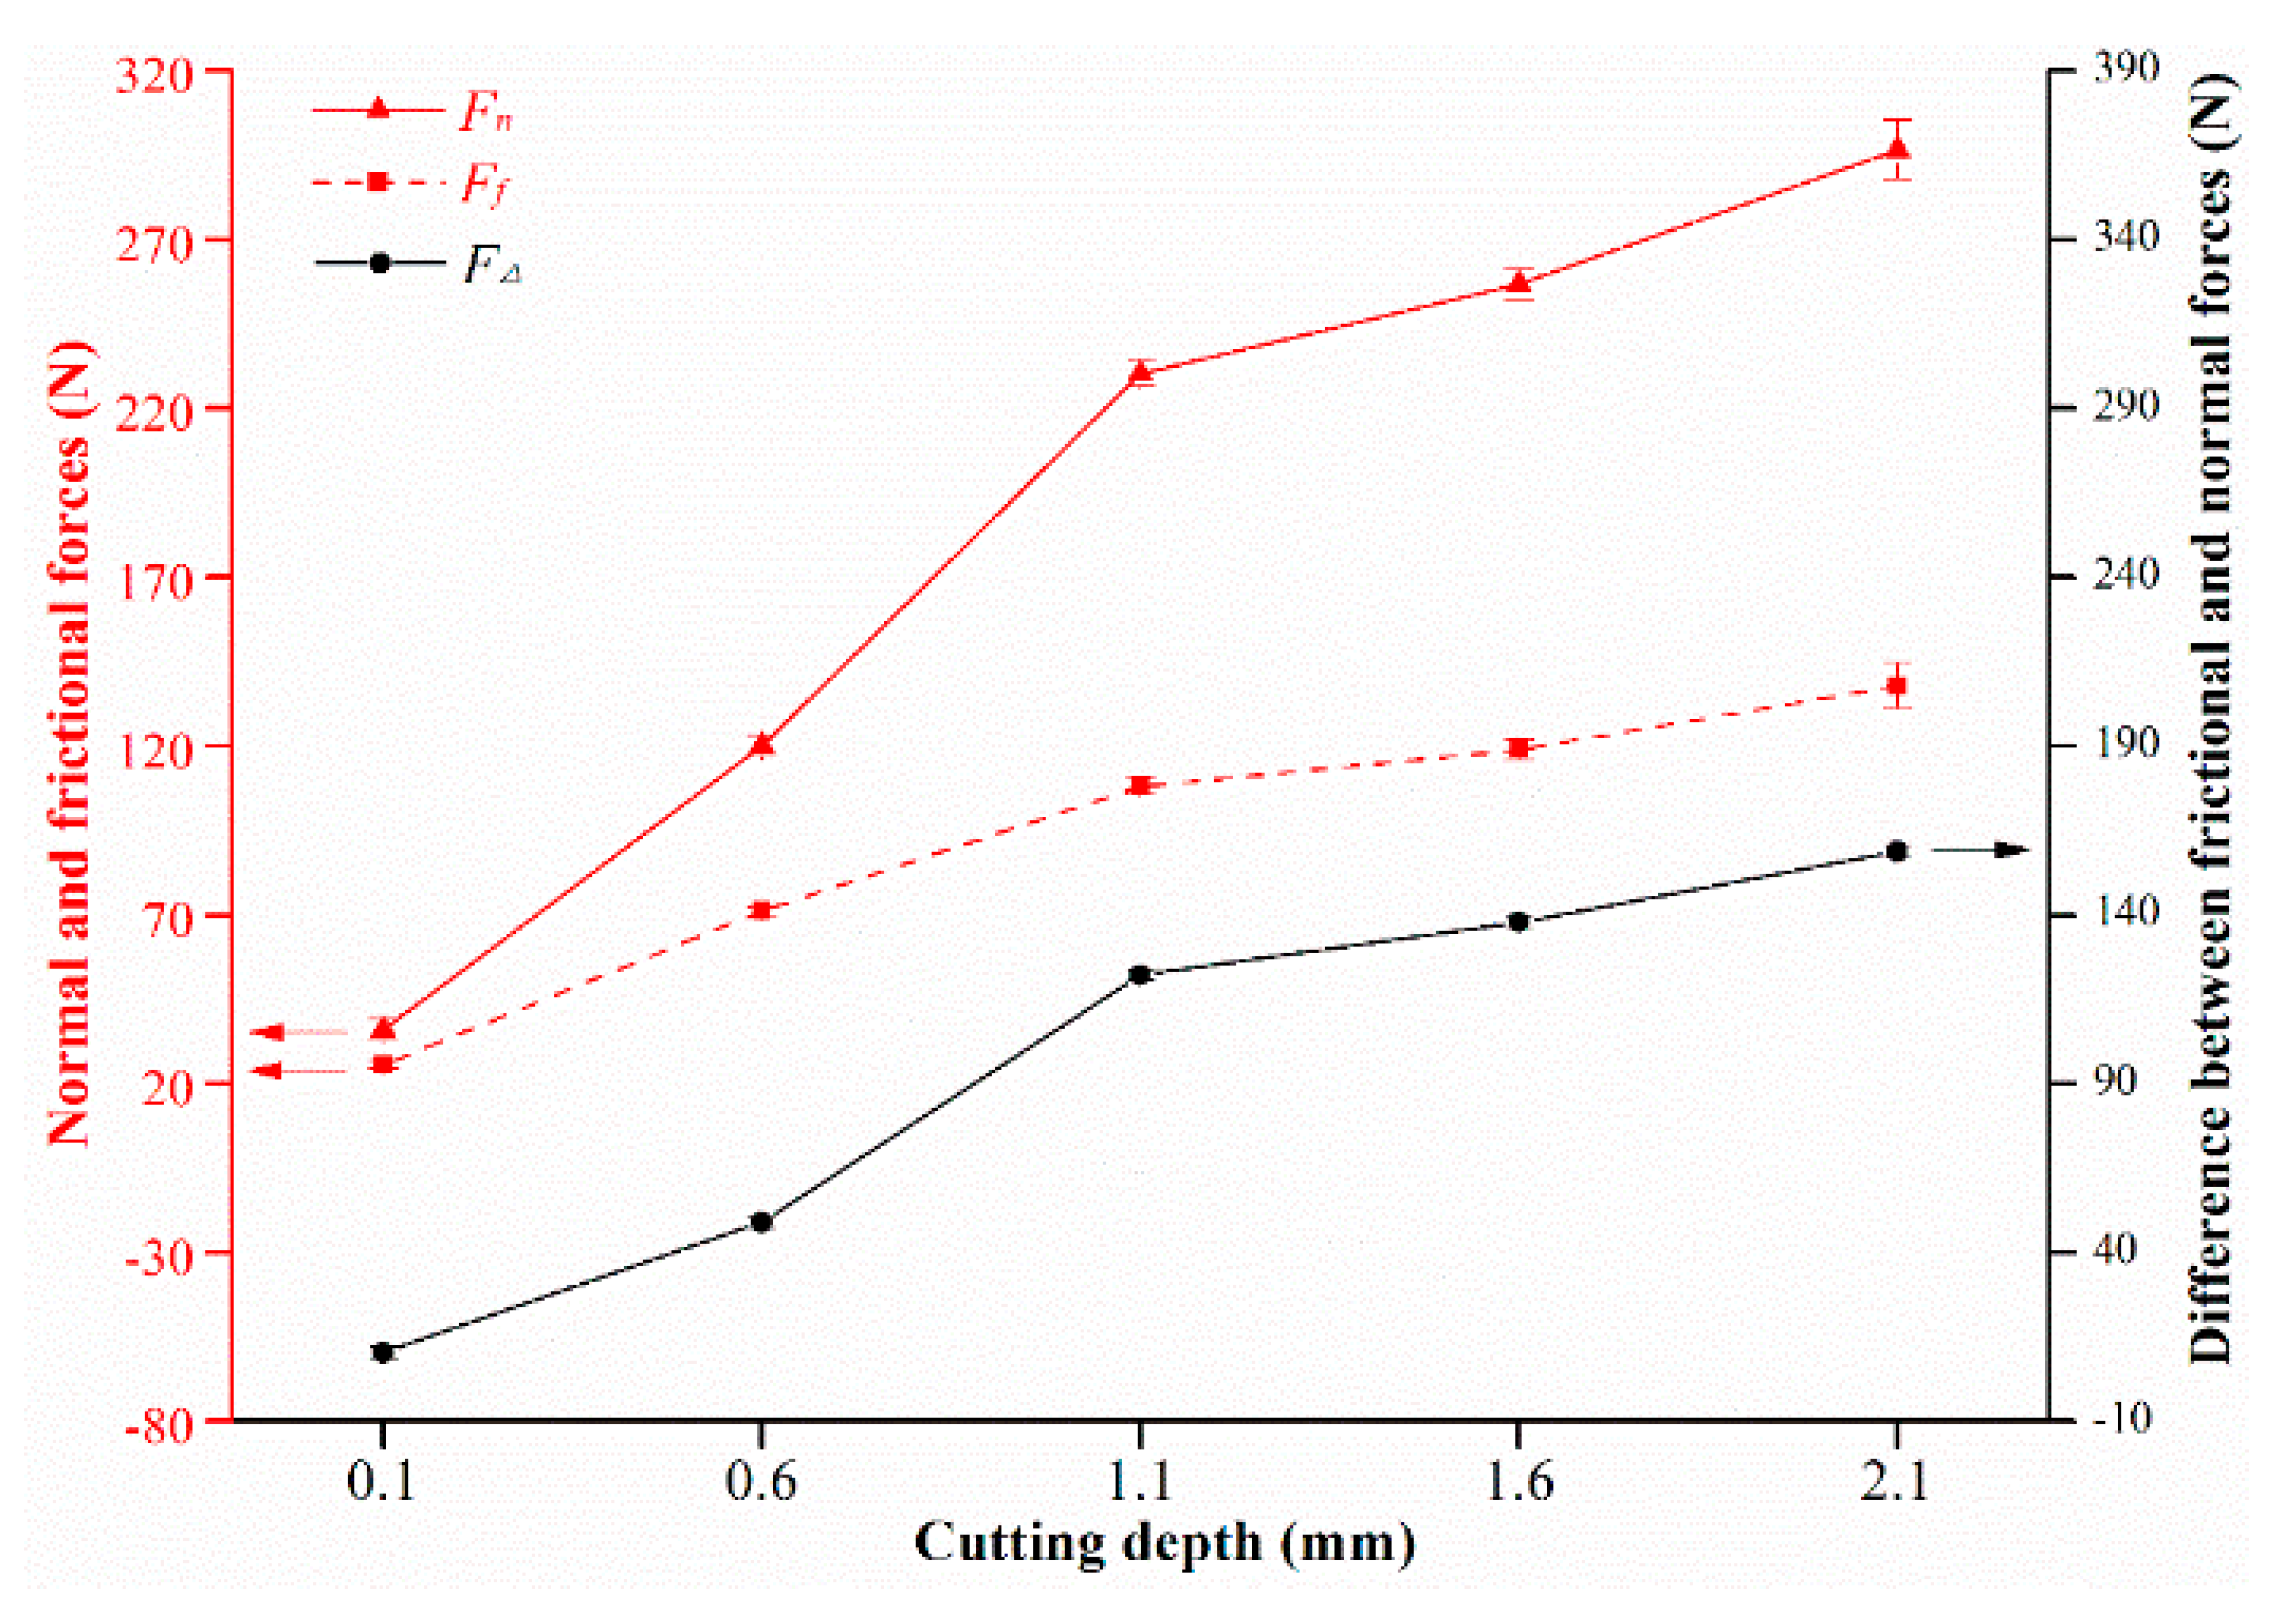
3.1. Cutting Forces
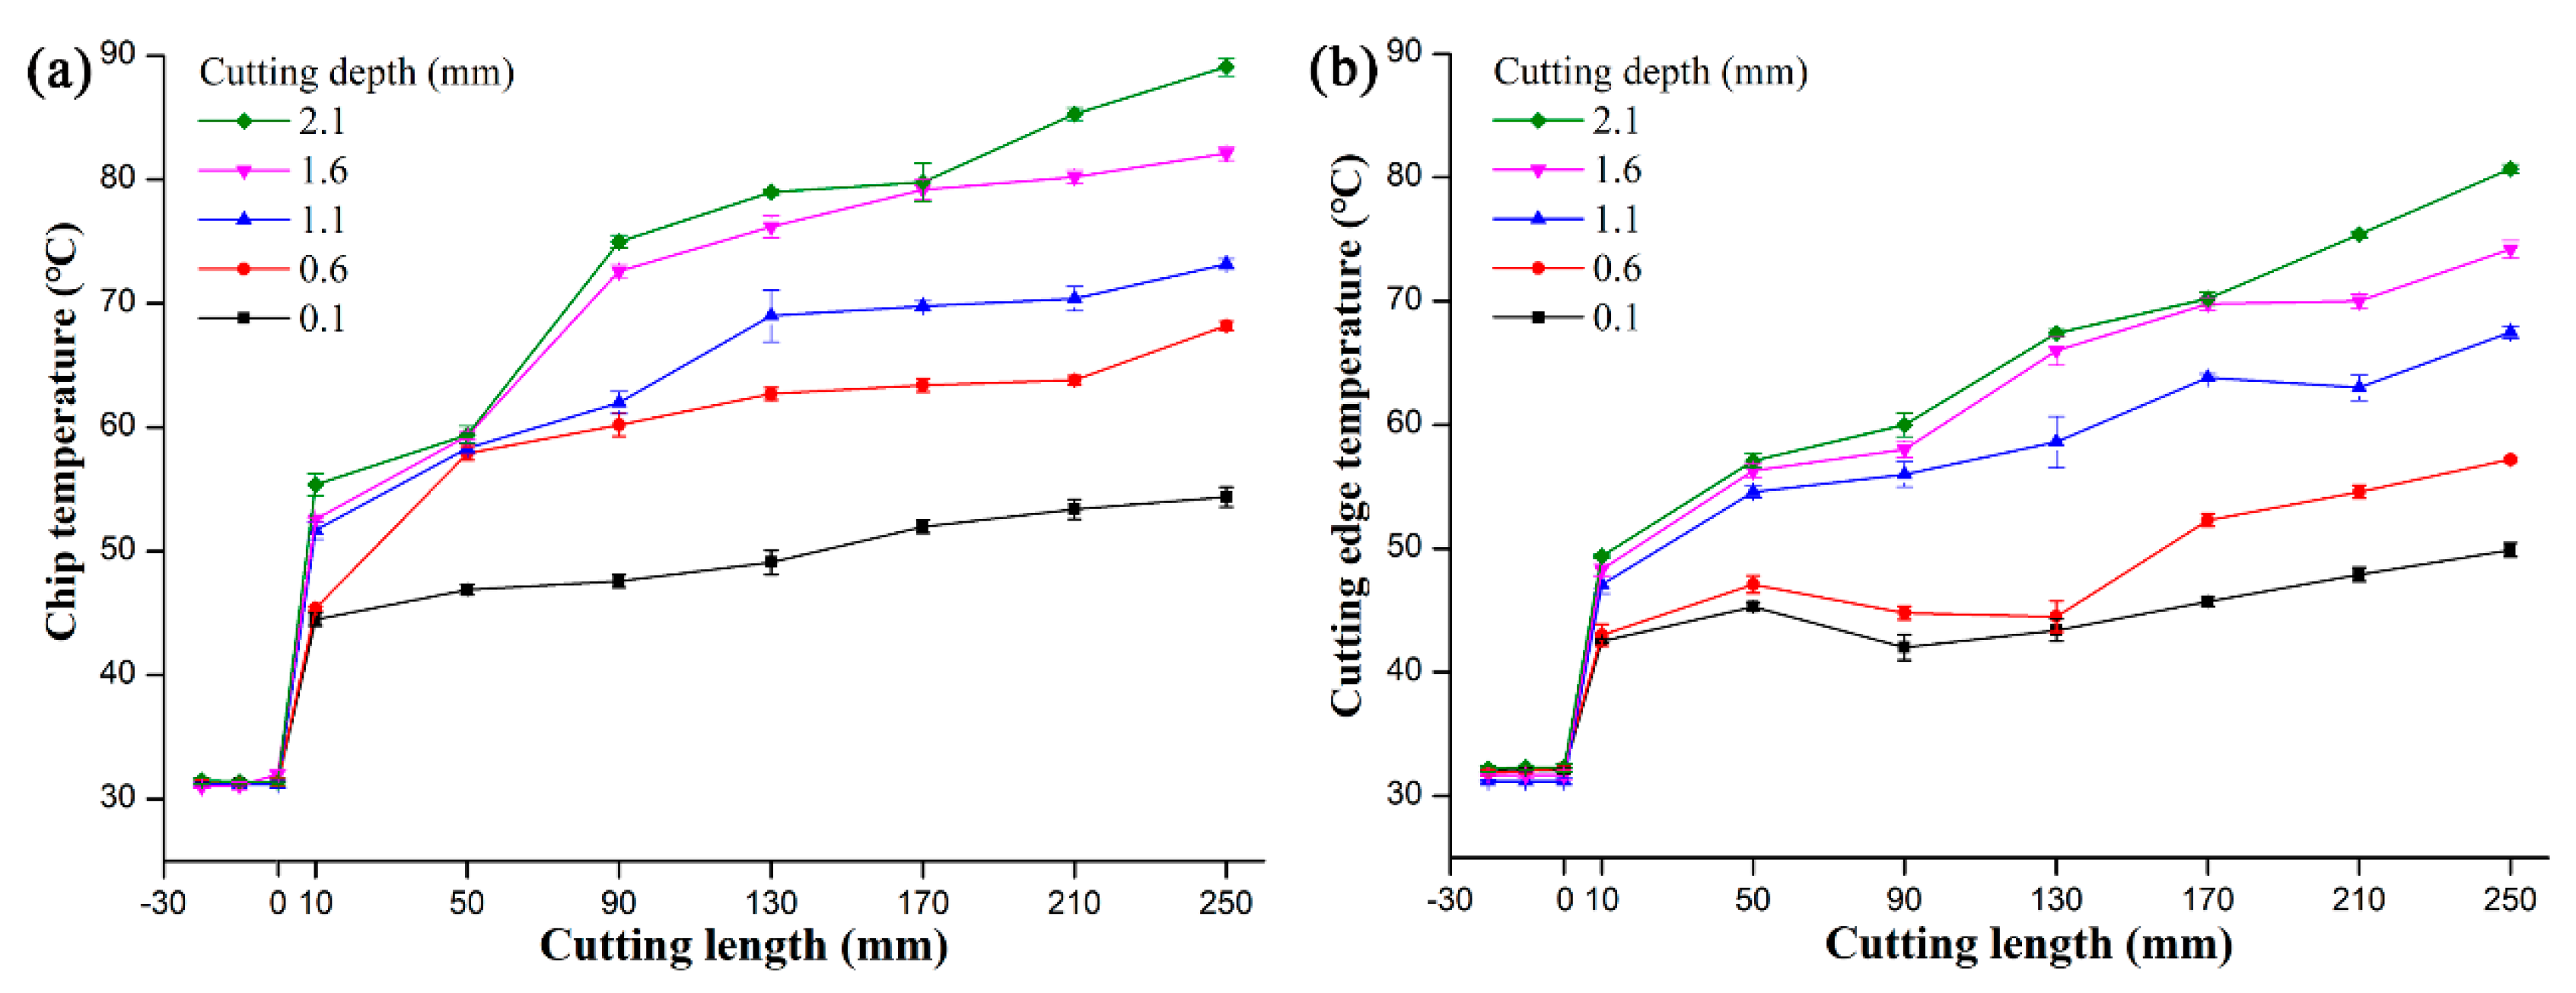
3.2. Cutting Heat
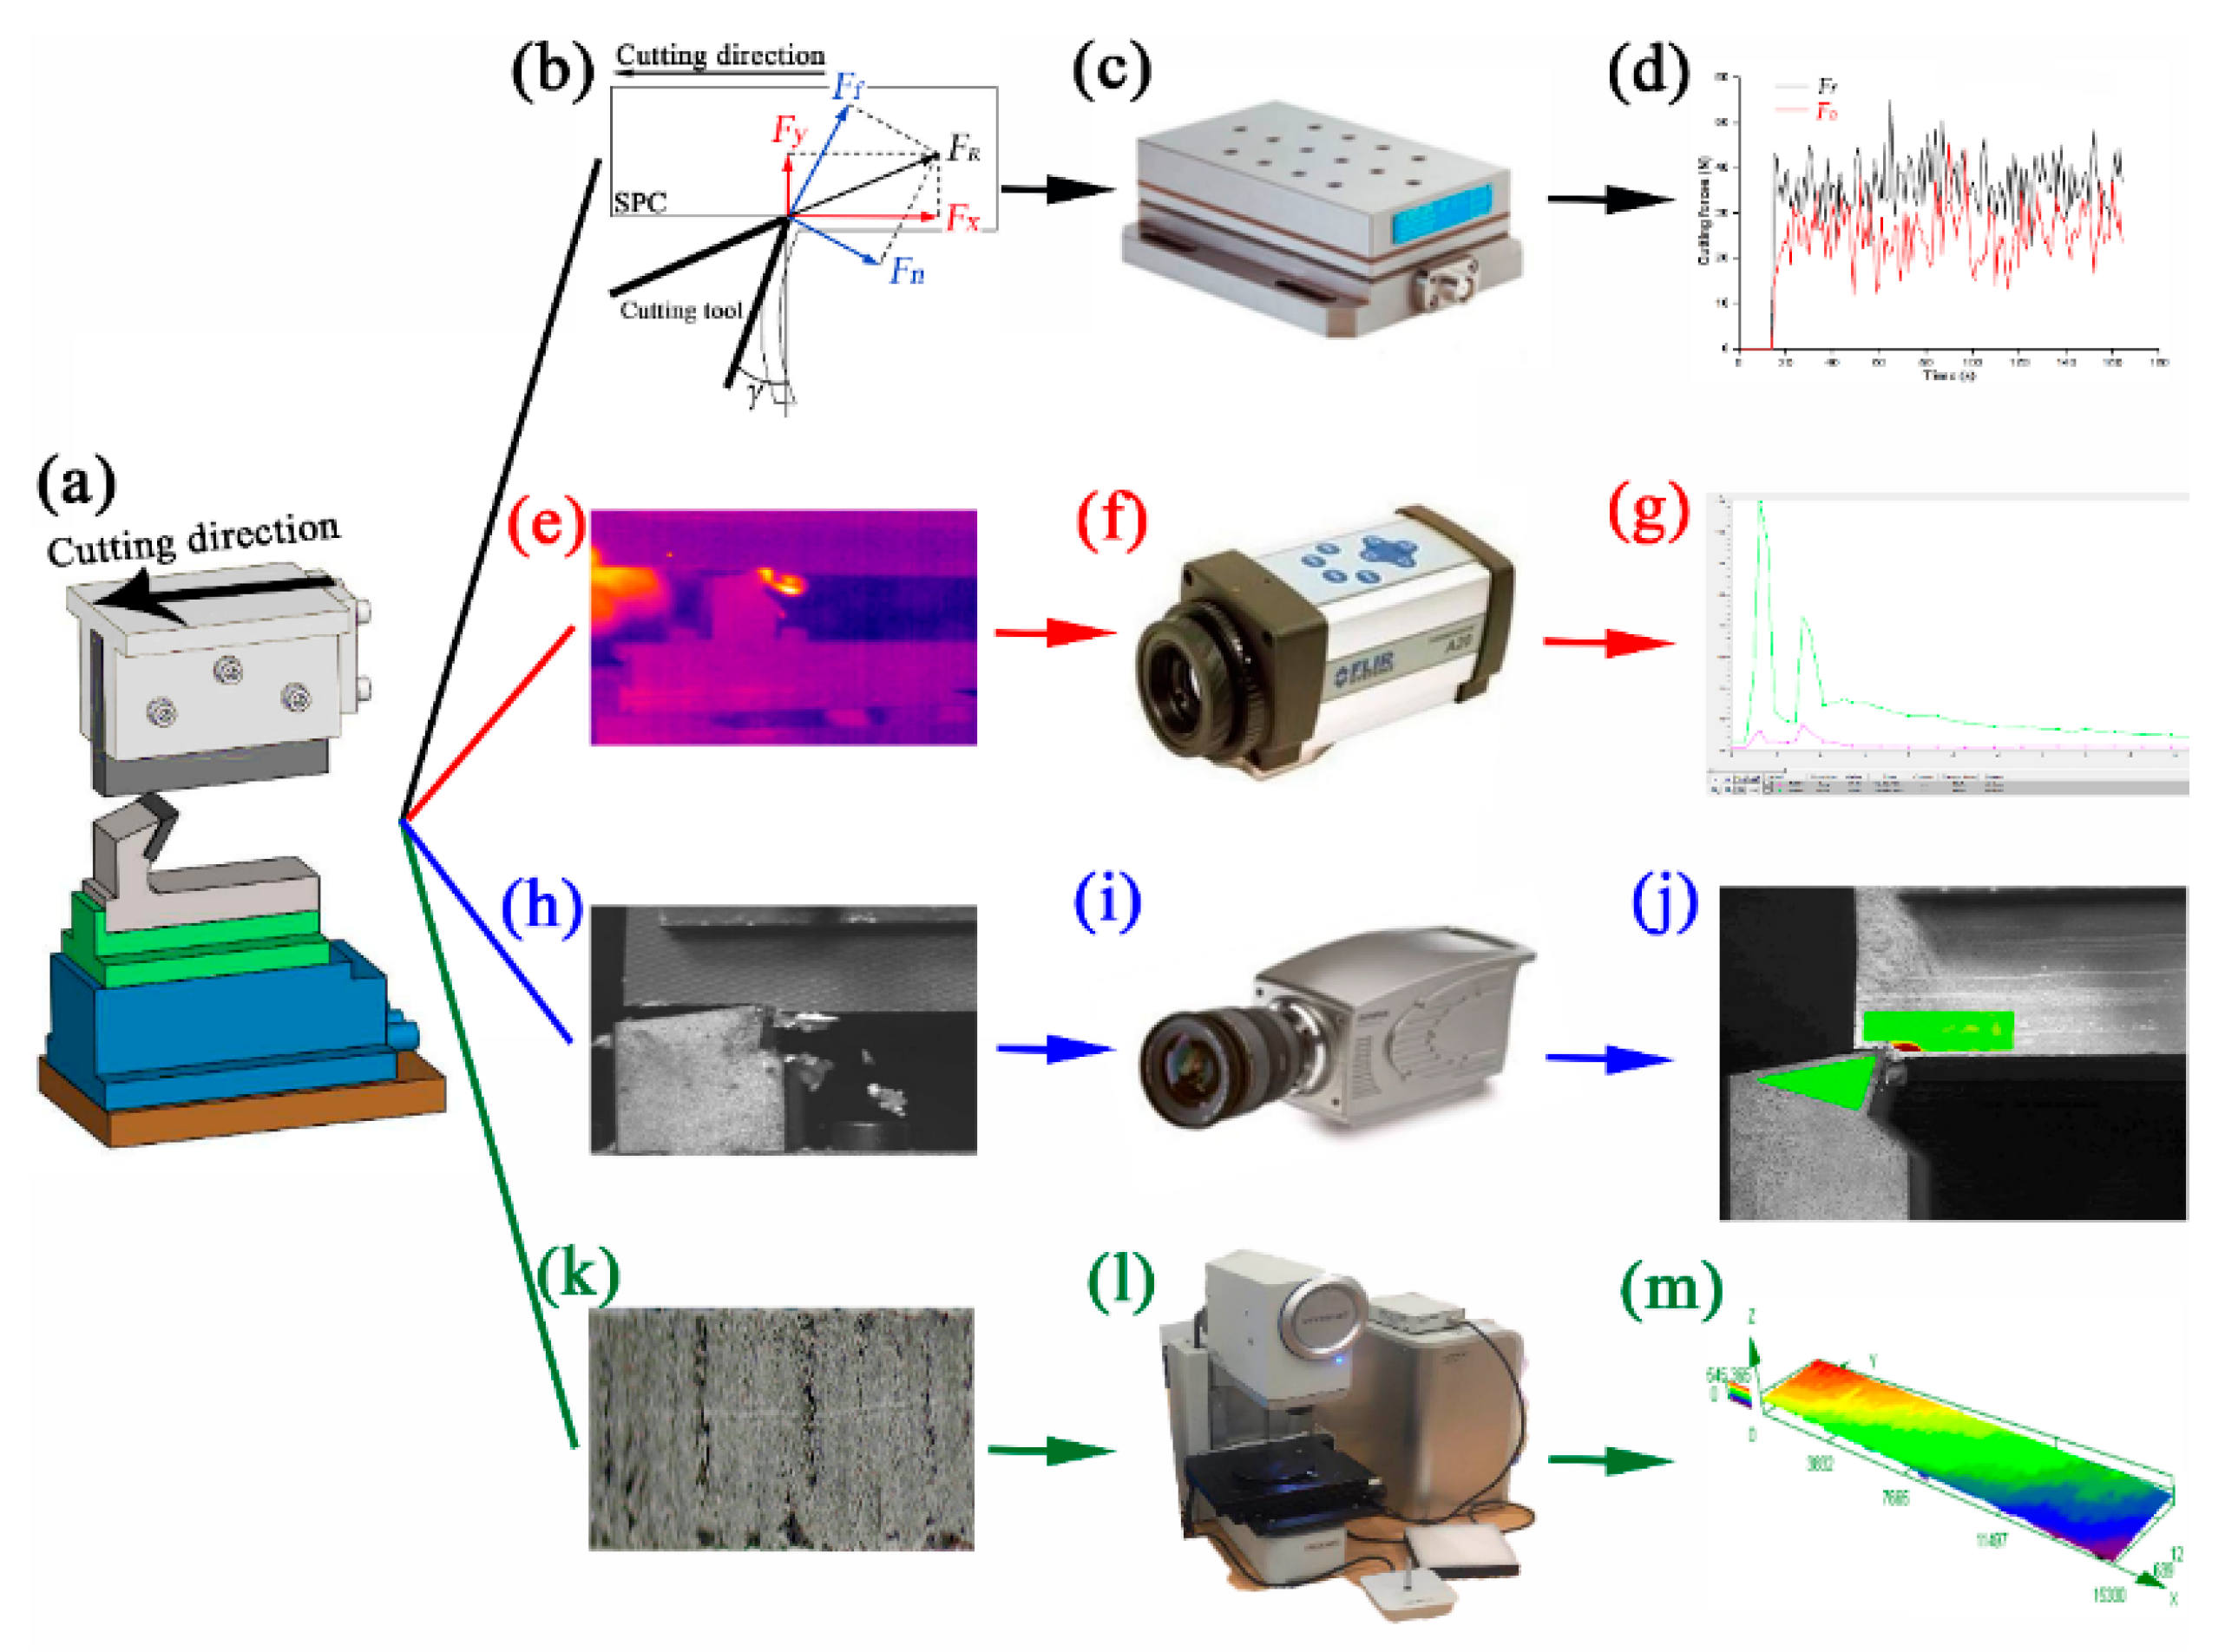
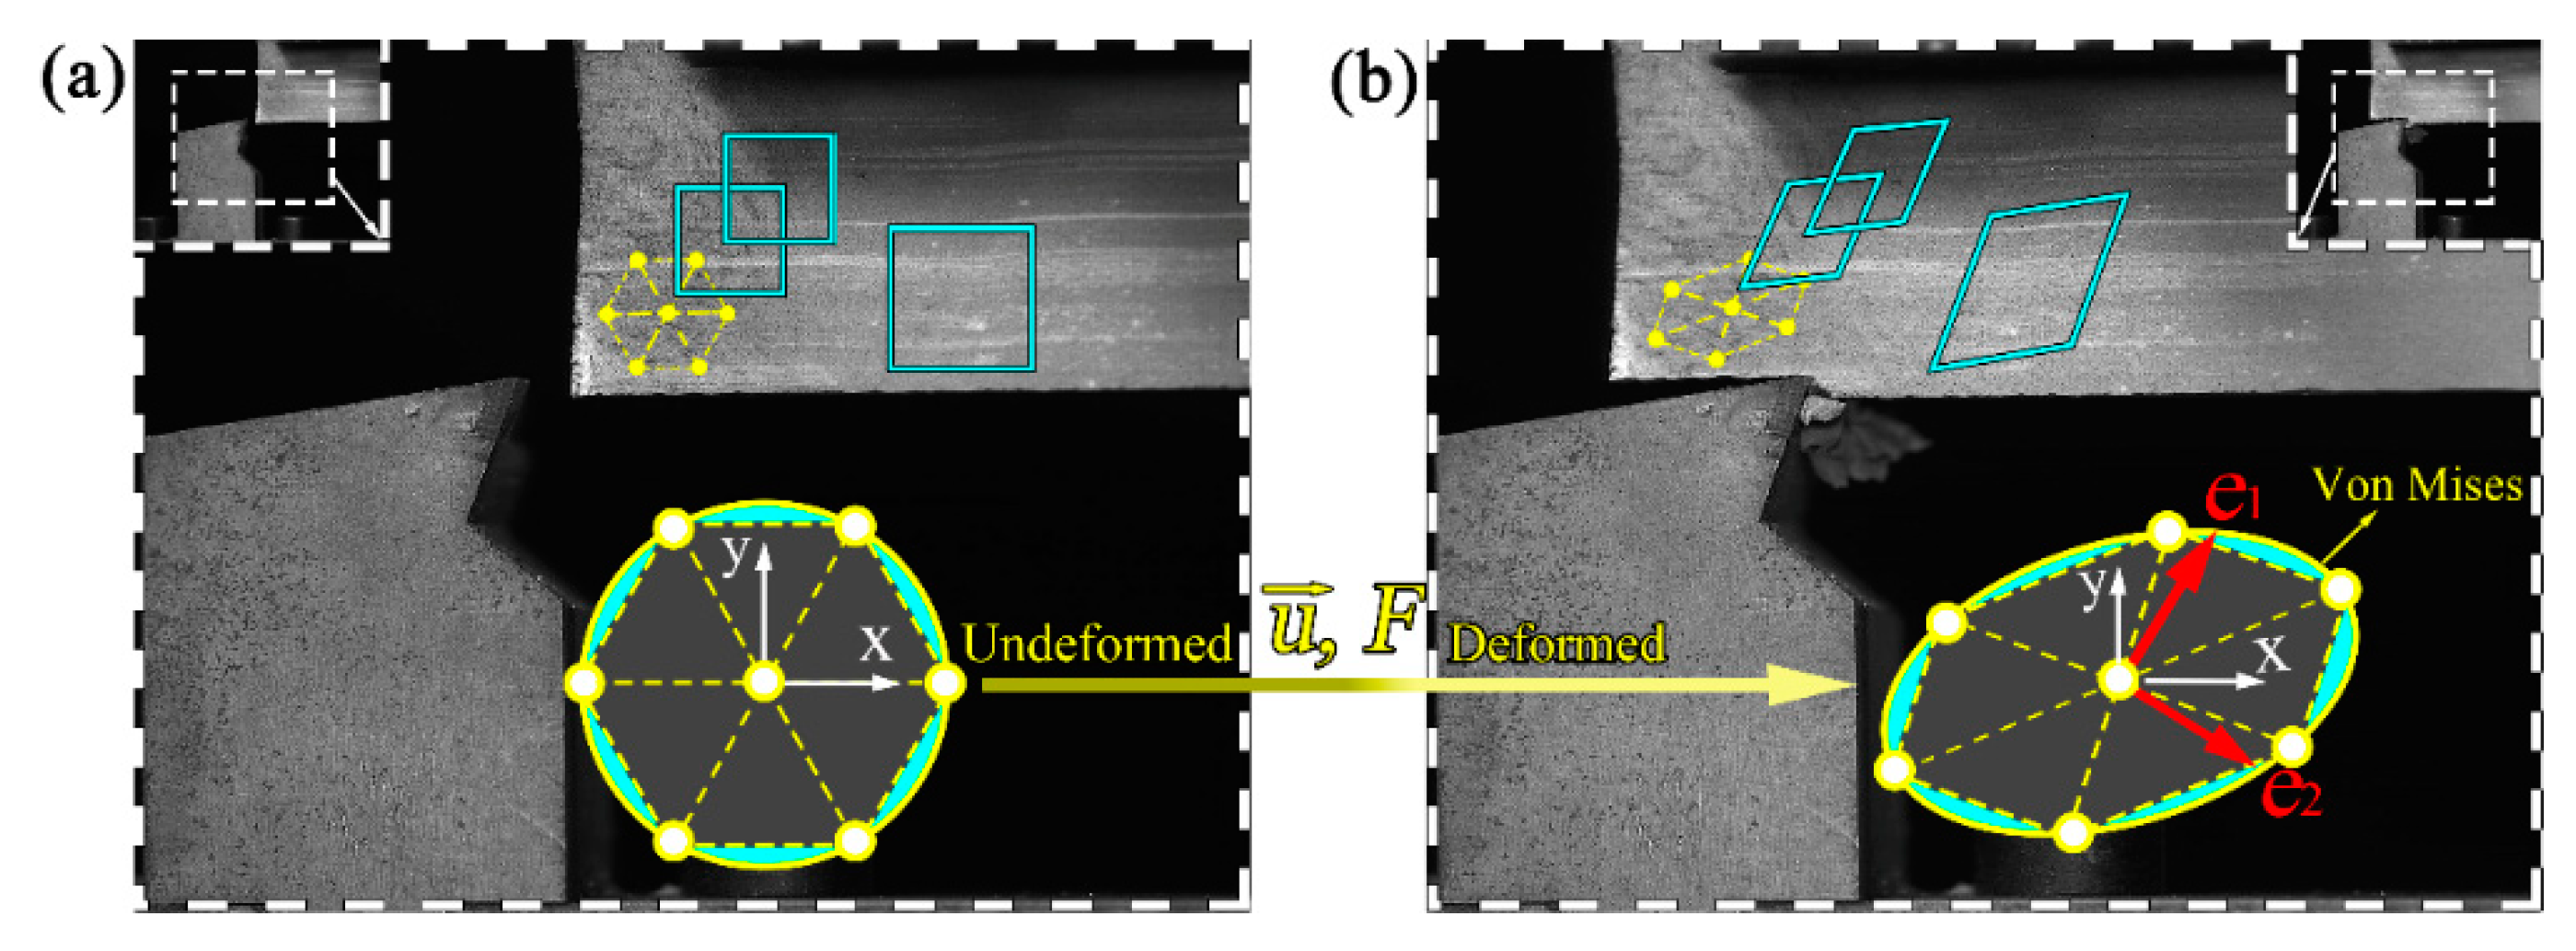
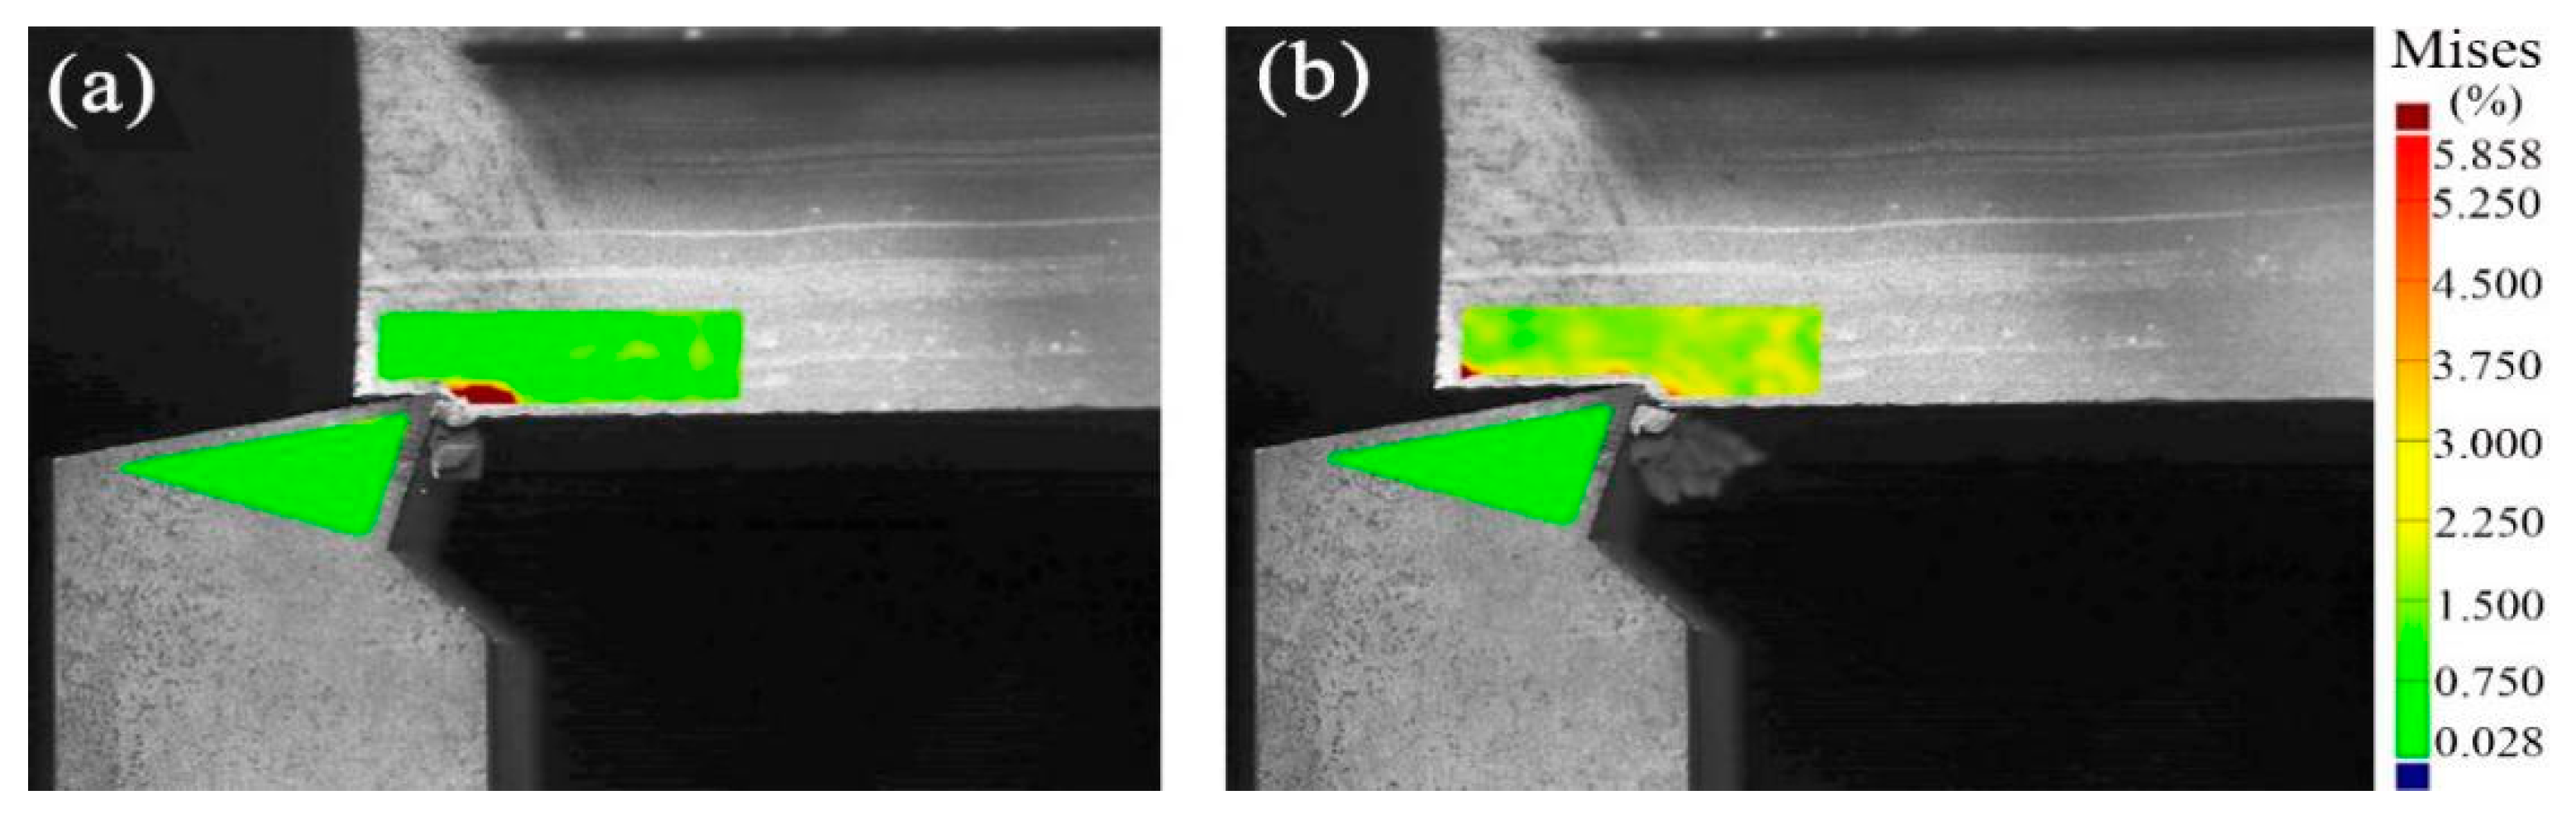
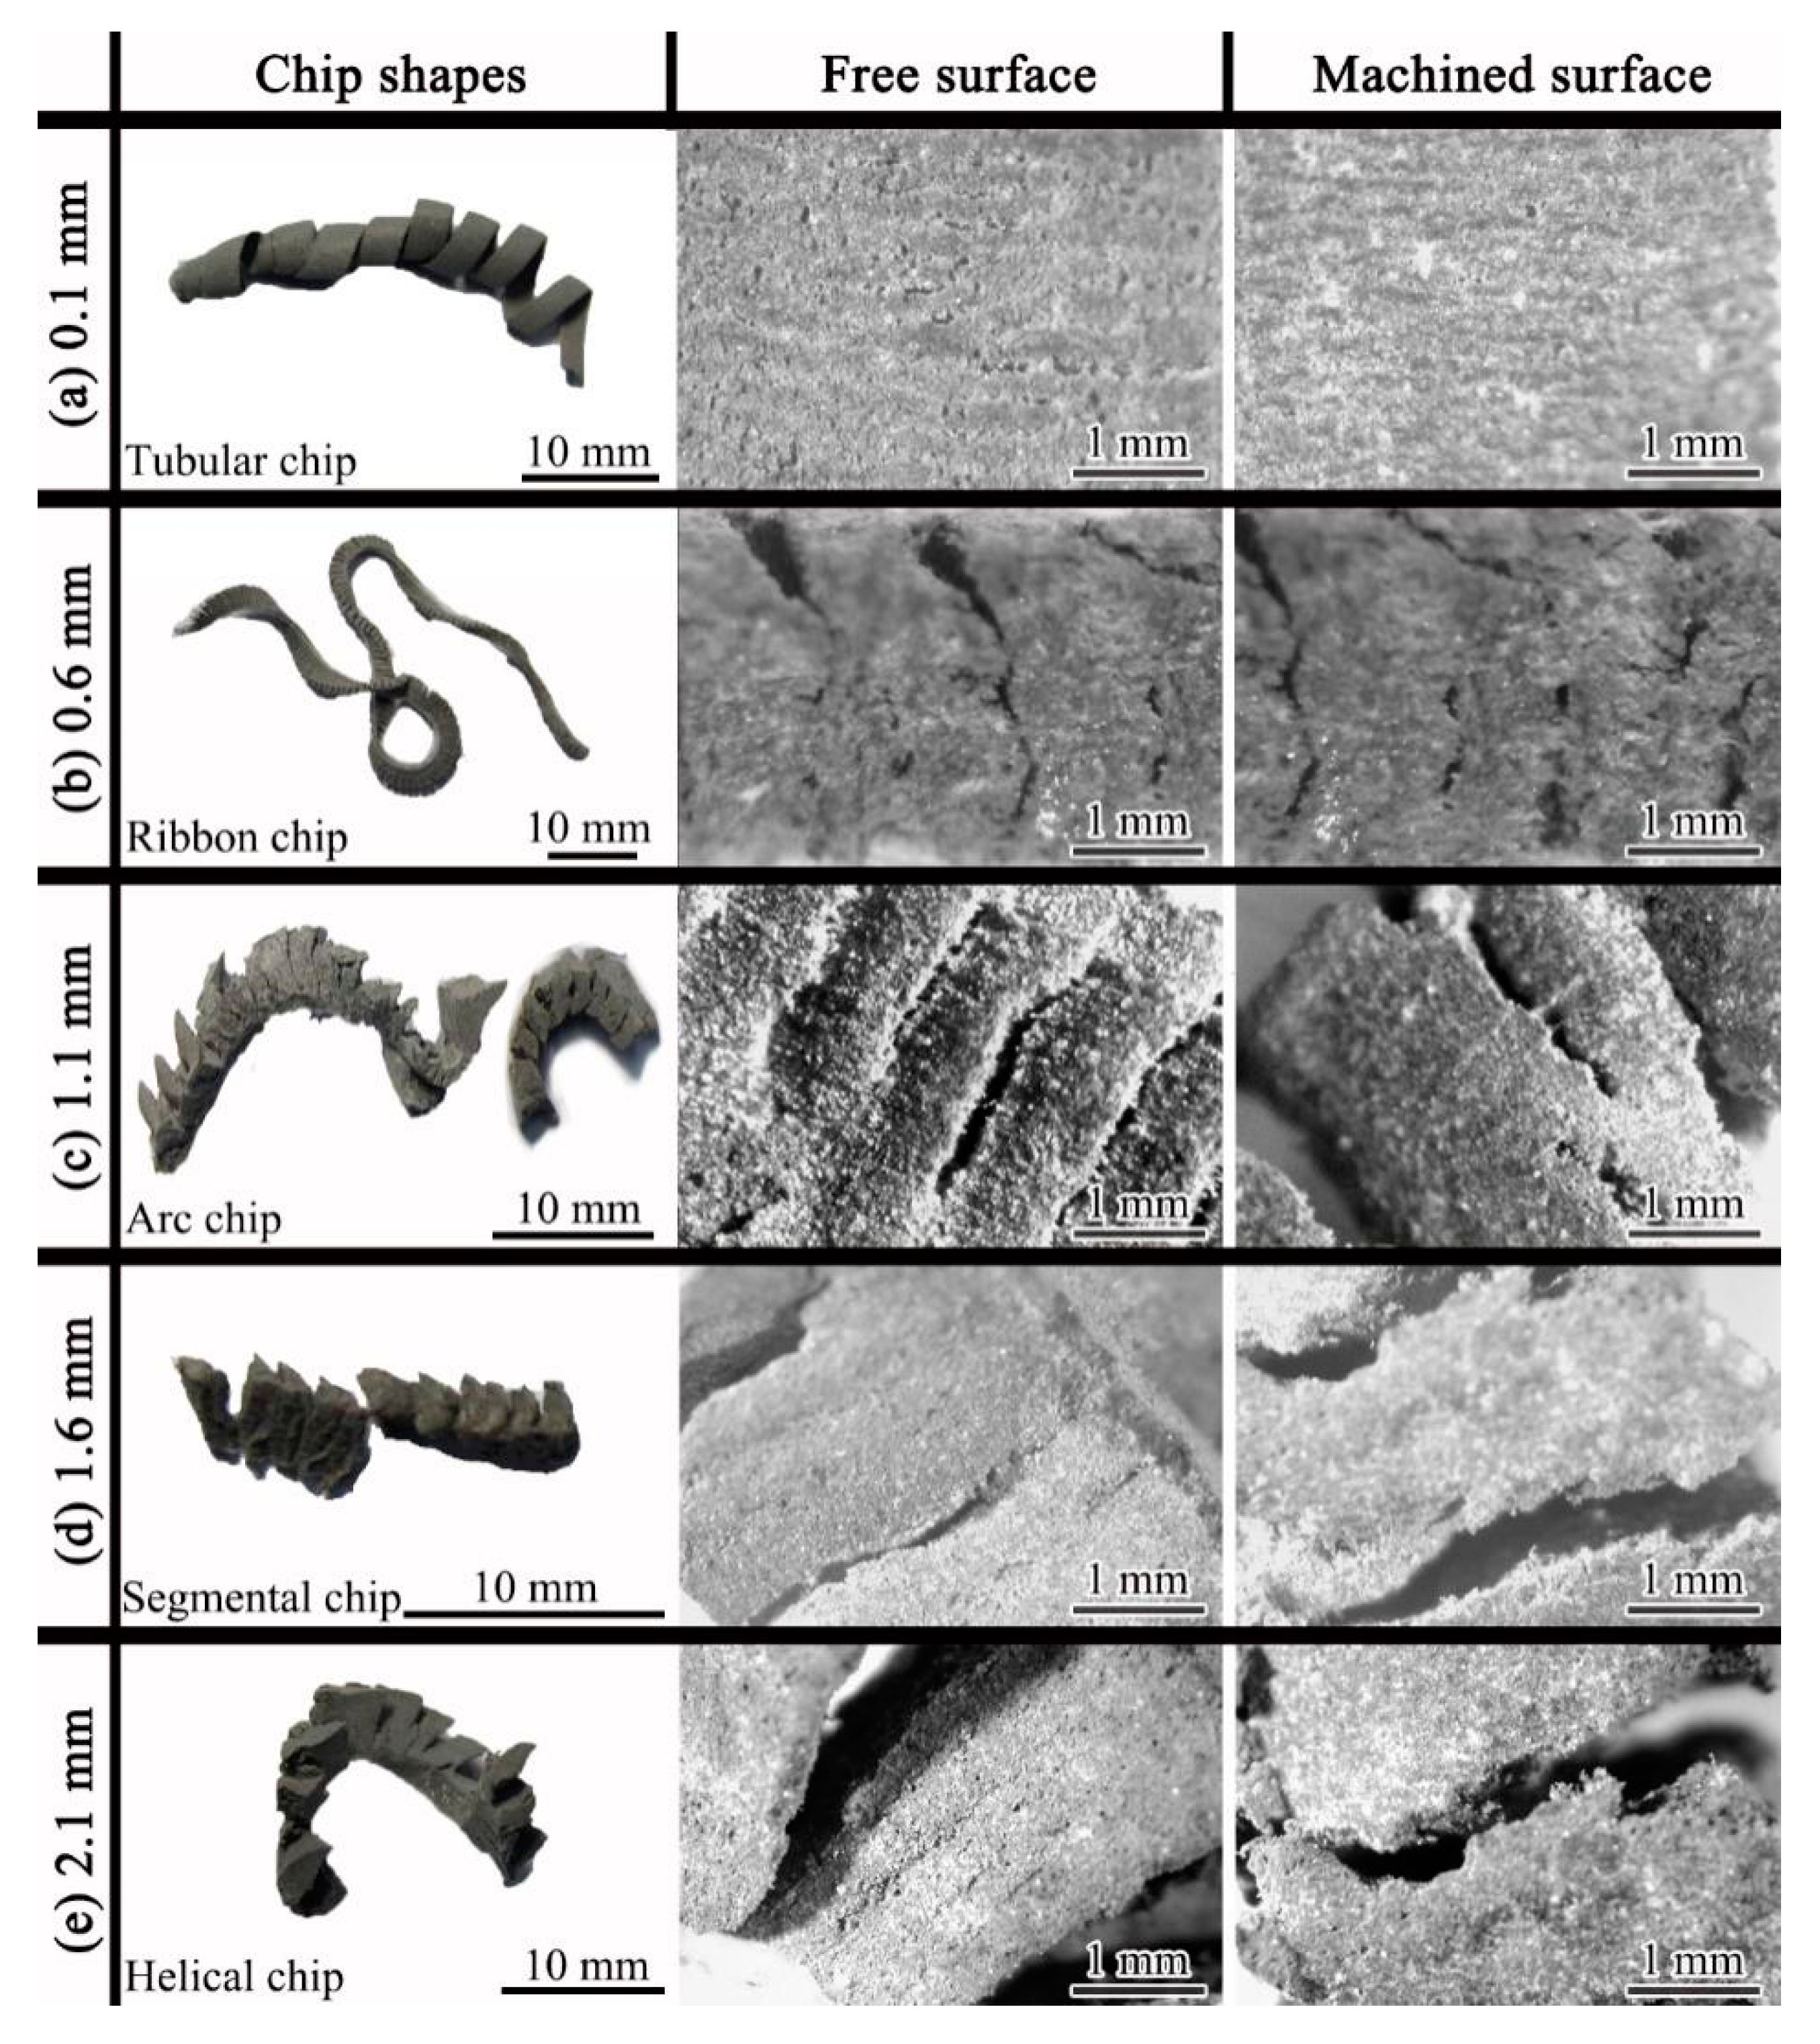
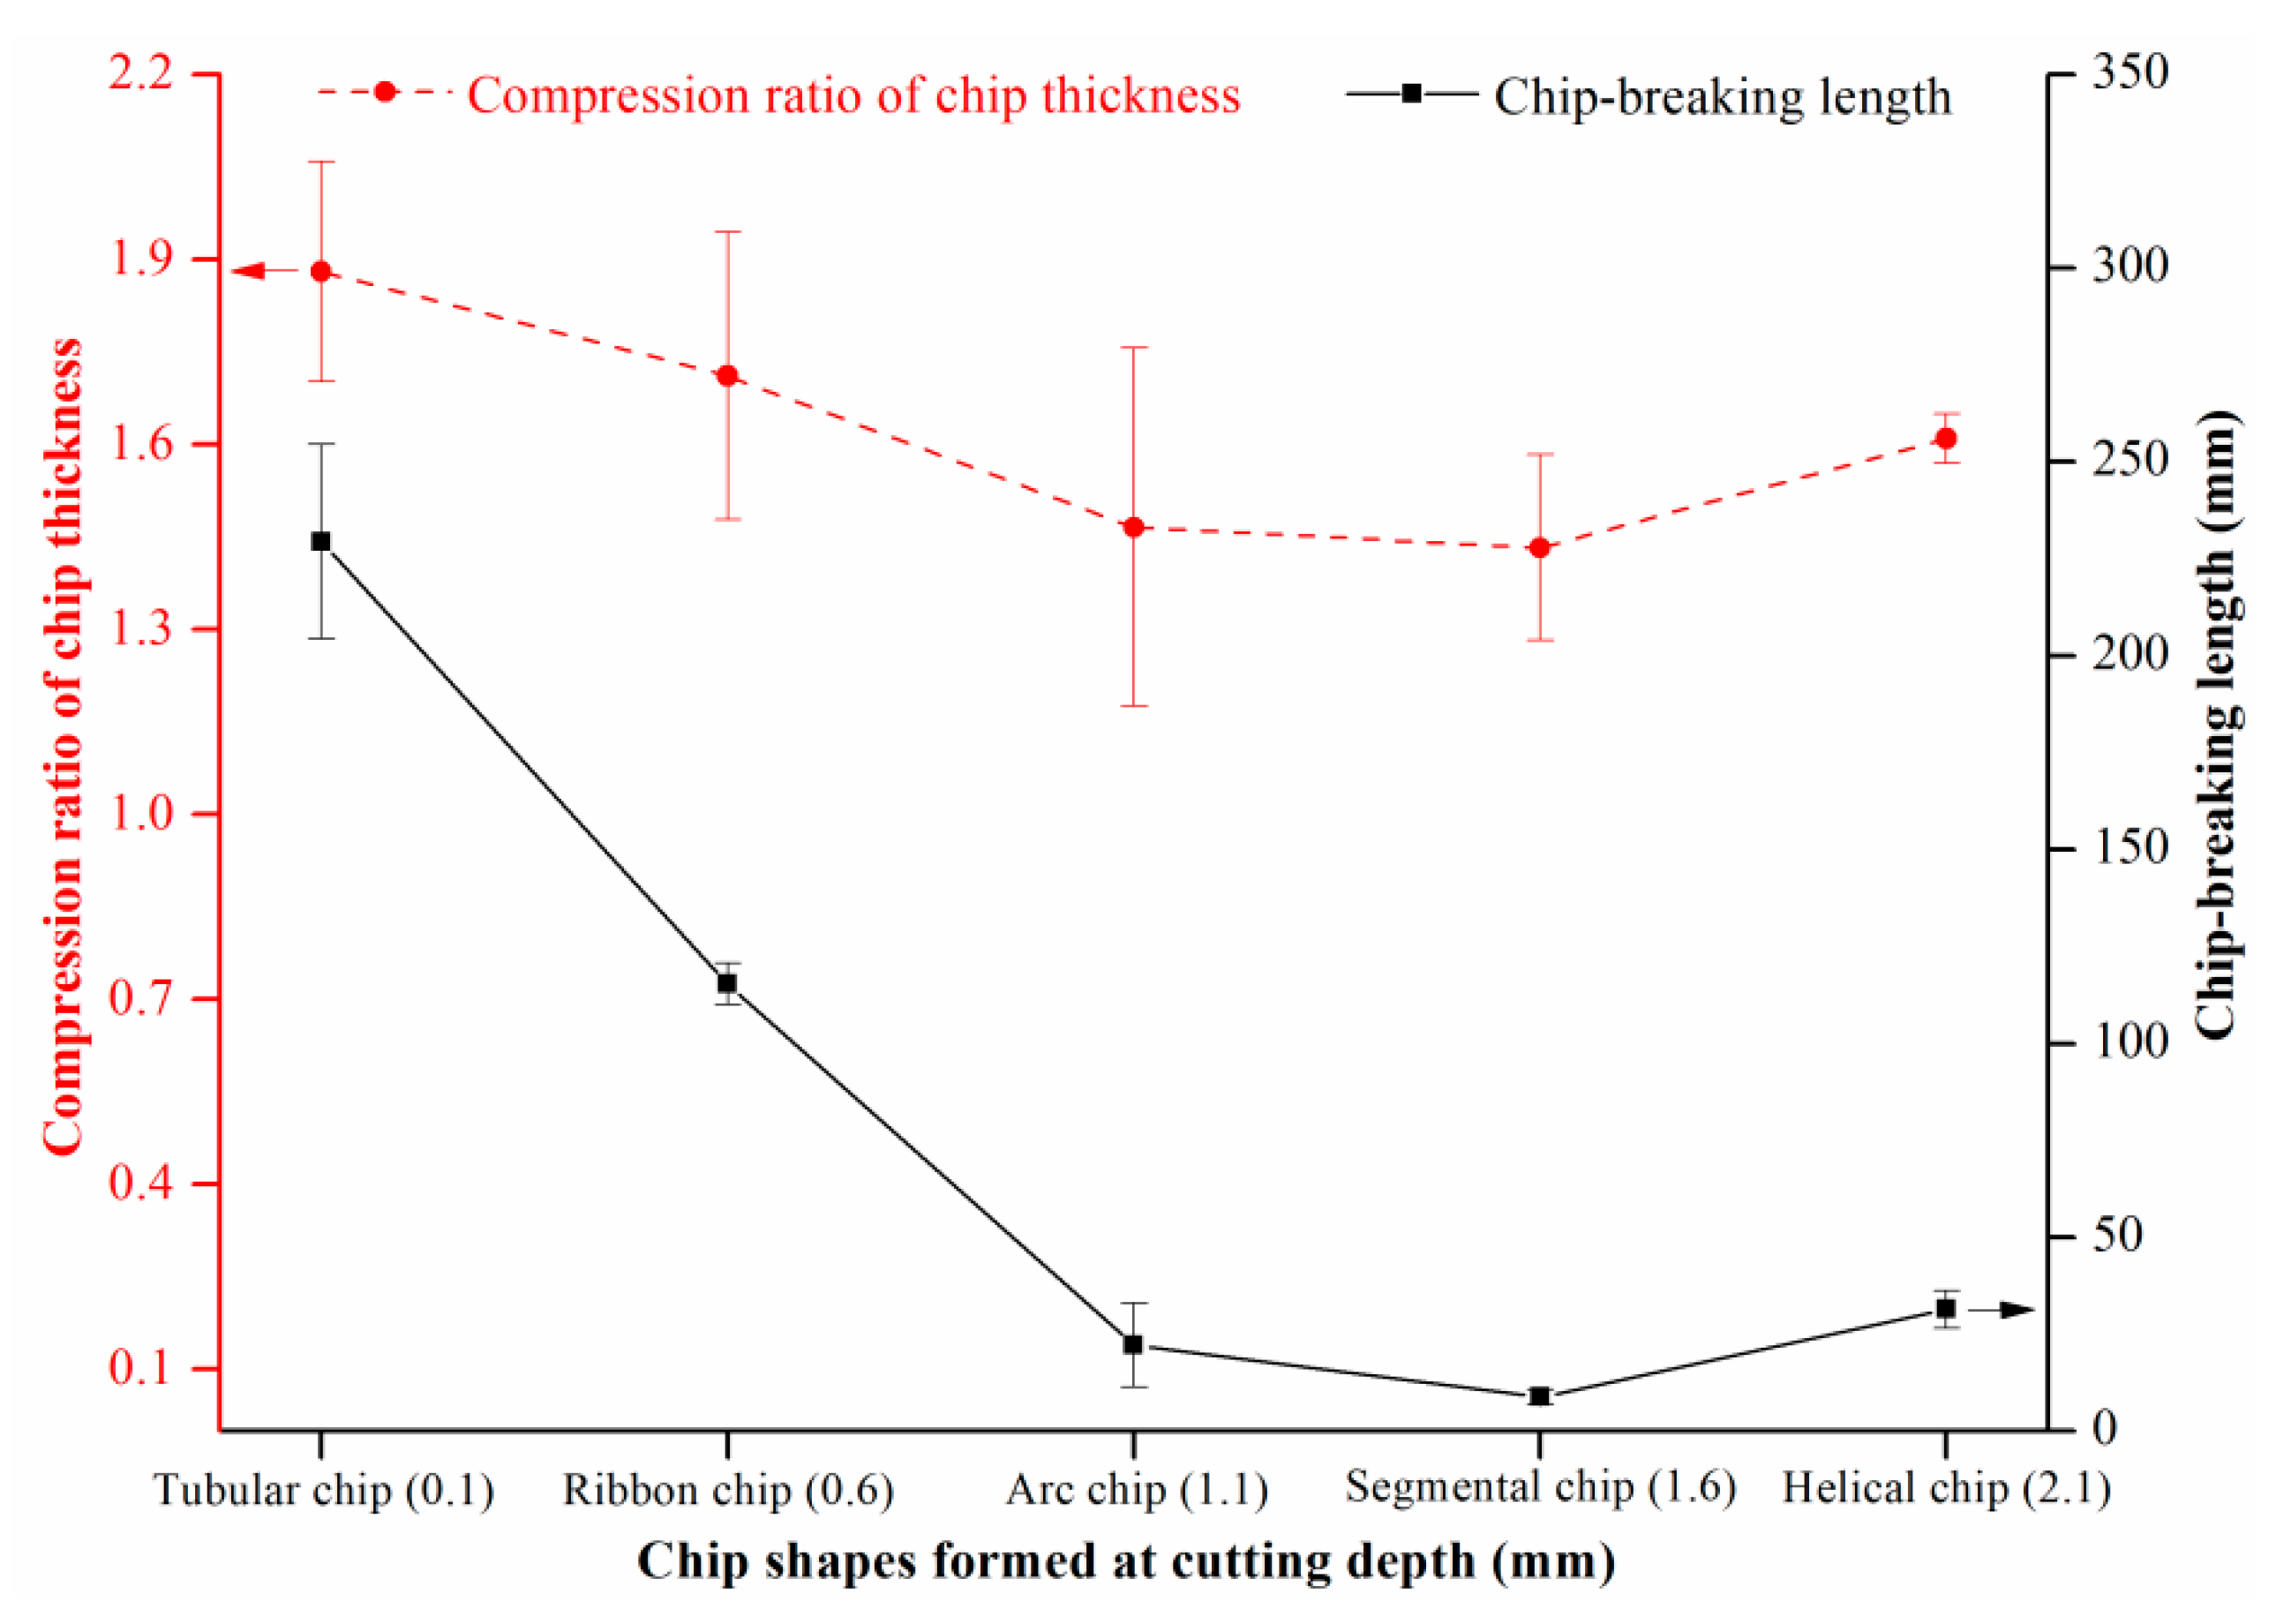
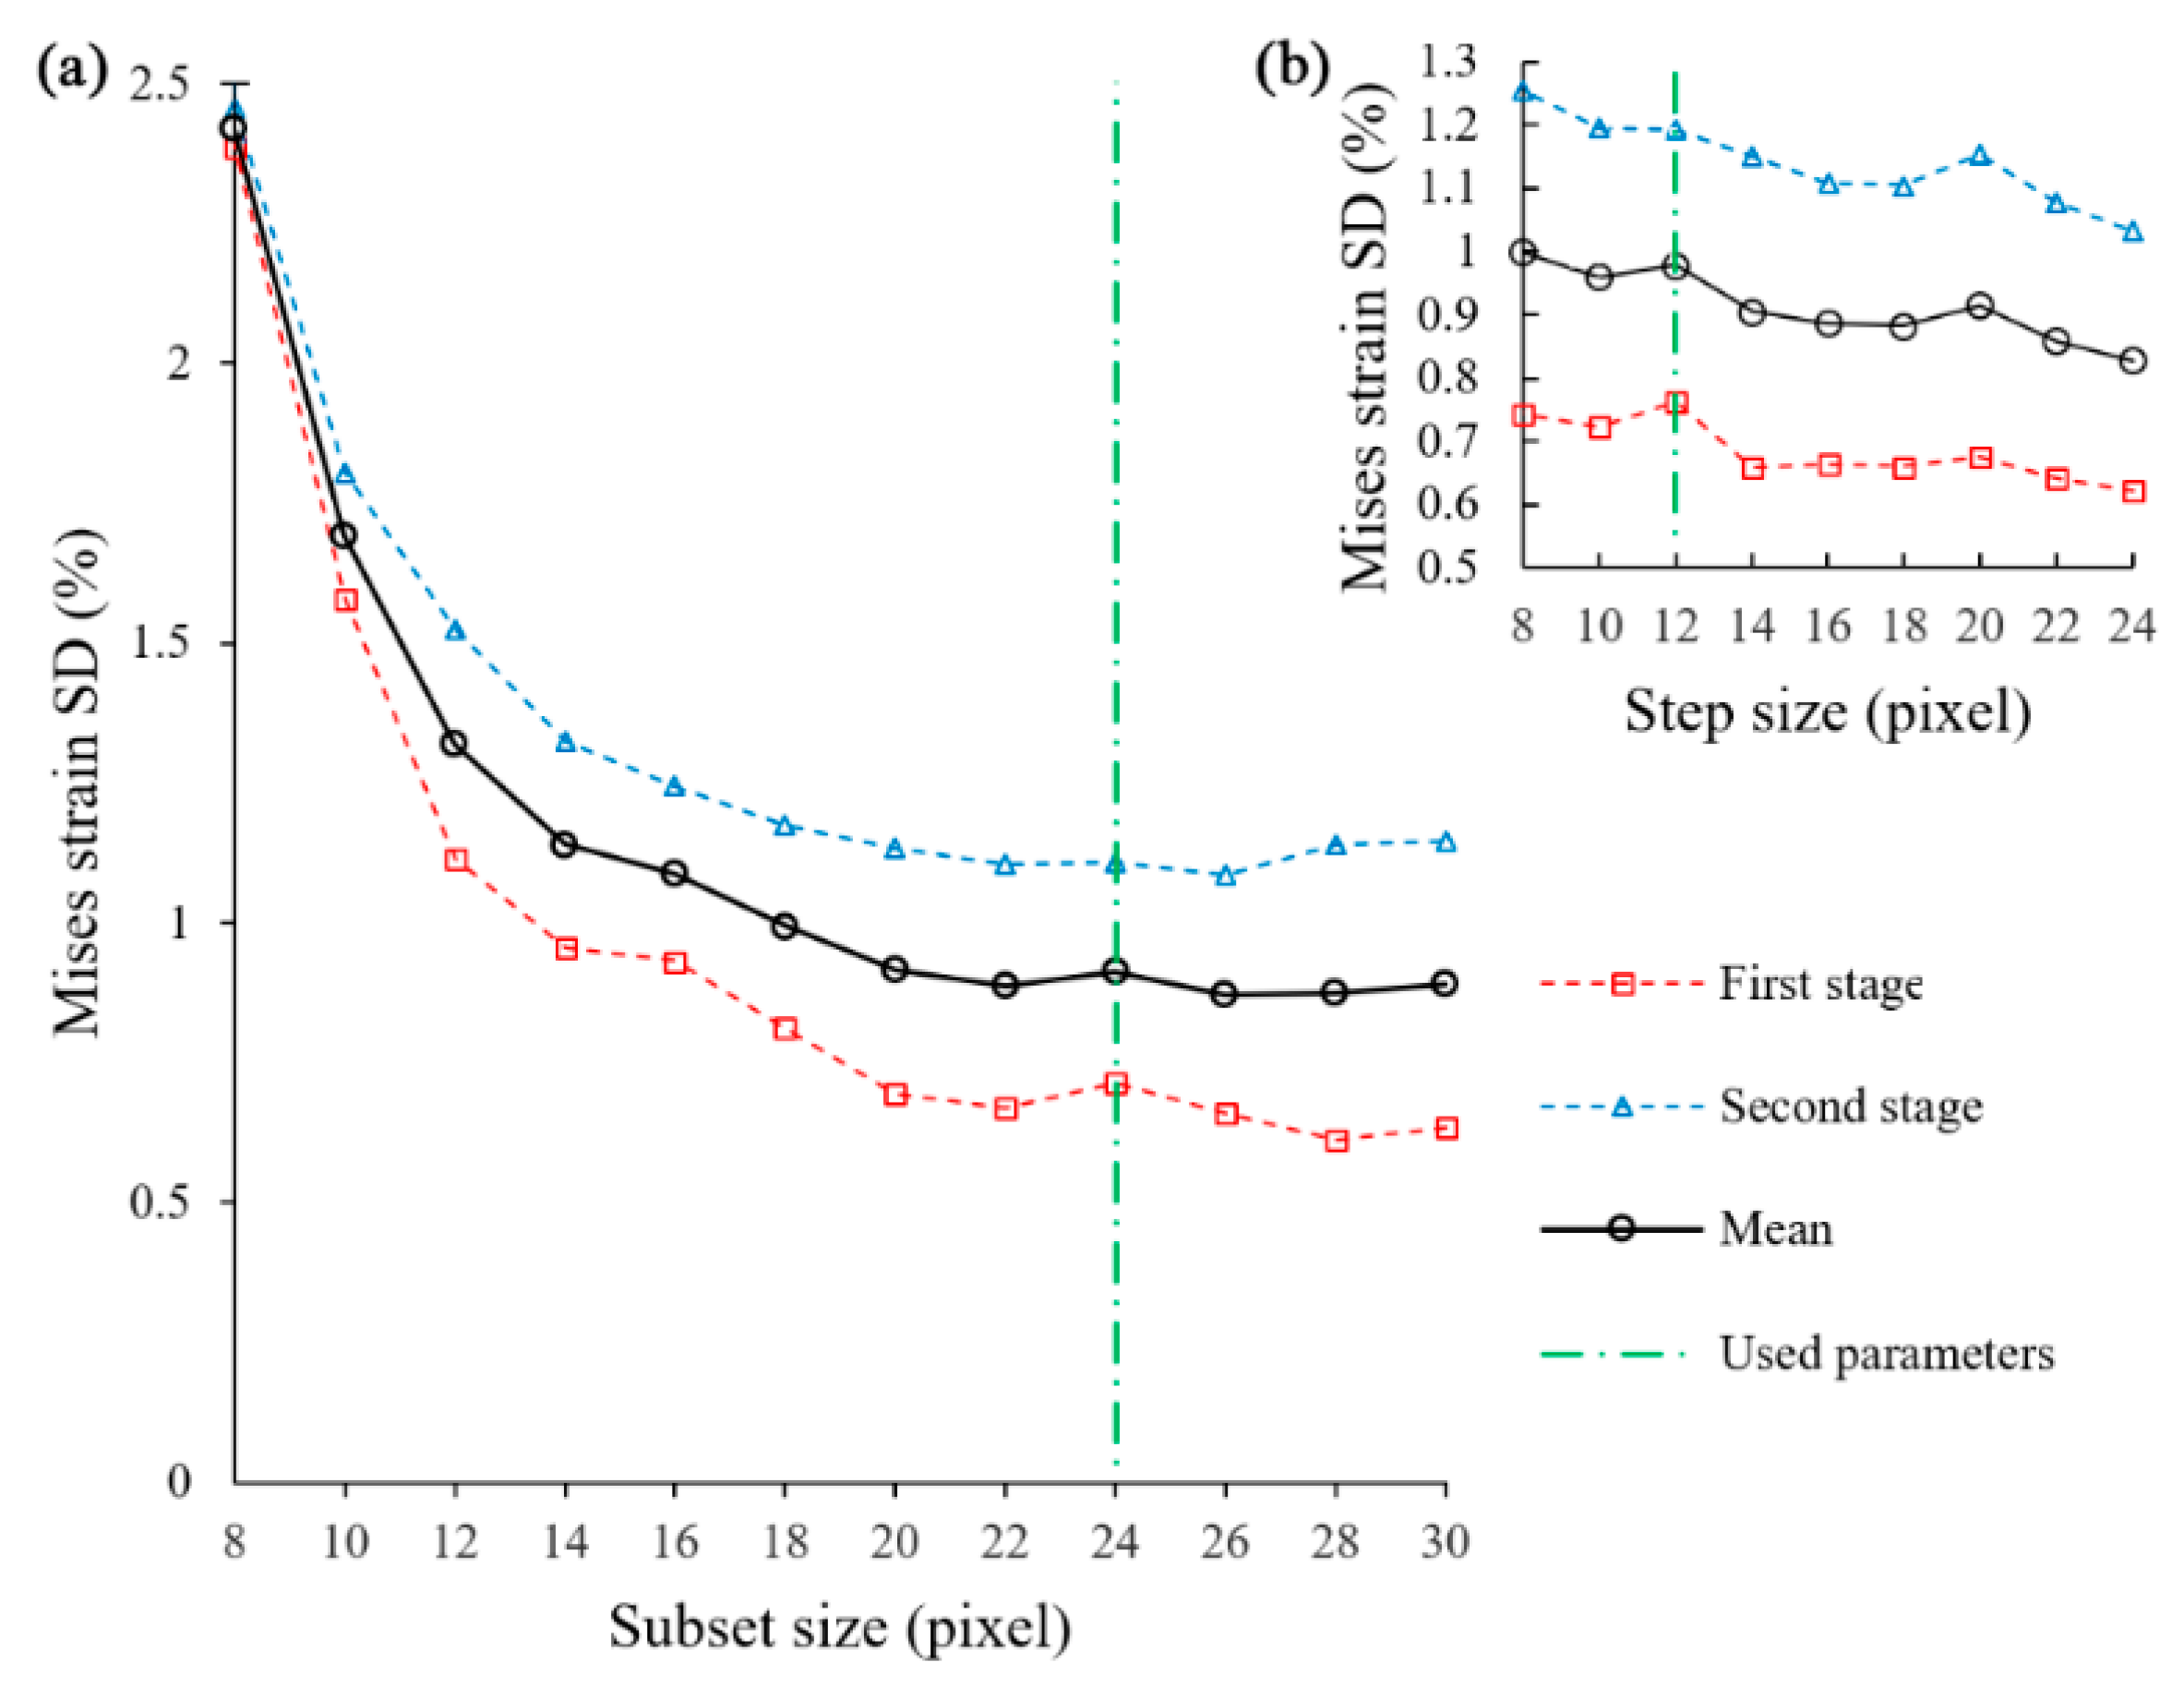
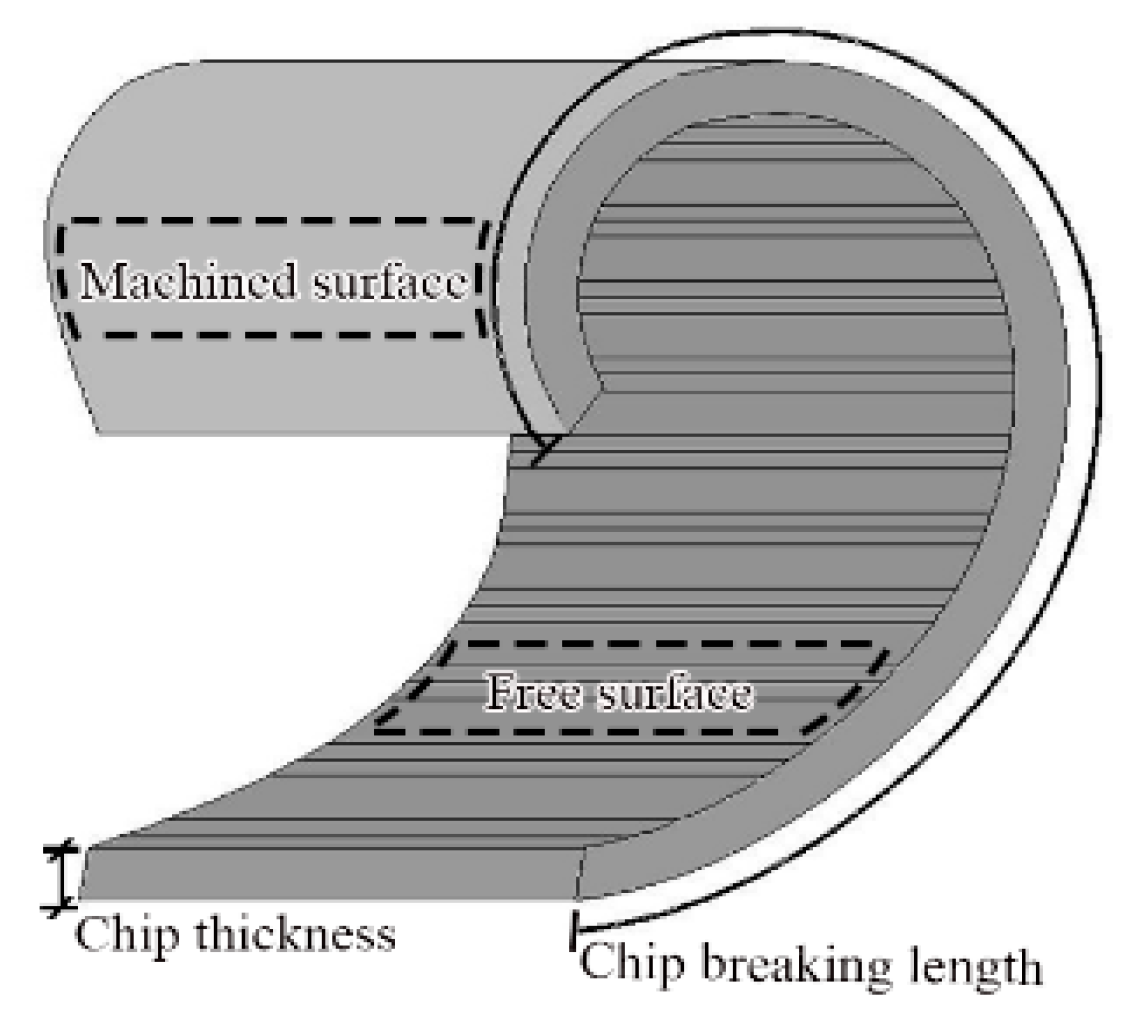
3.3. Chip Deformation
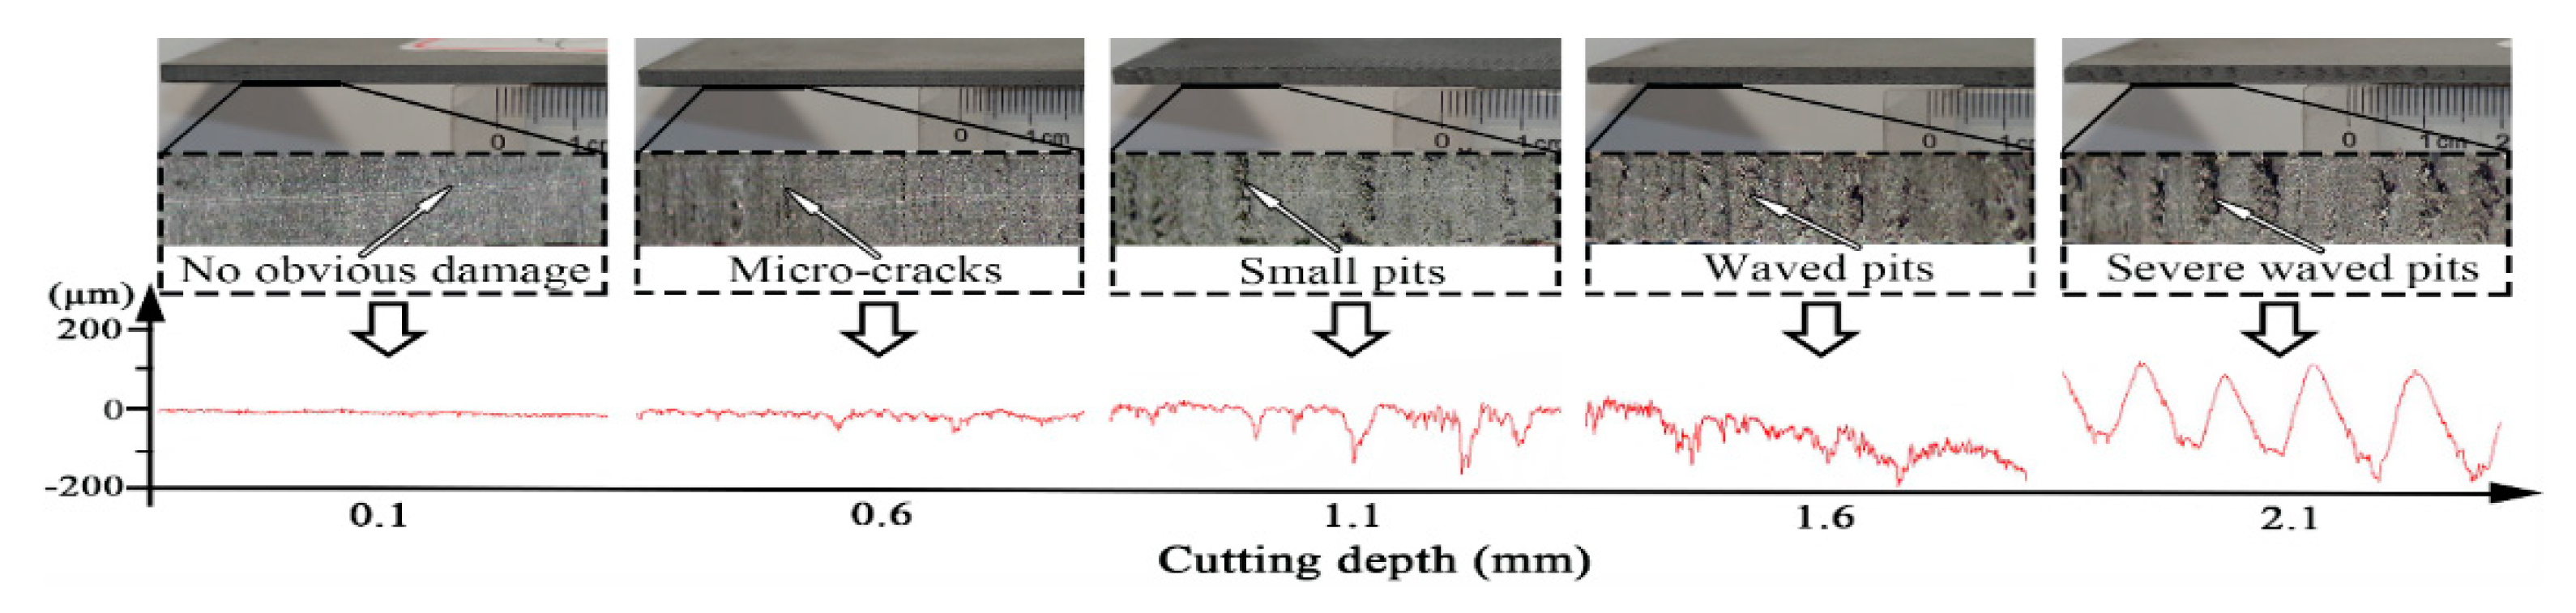
3.4. Cutting Quality
3.5. Relation Between Cutting Depth and Machinability of SPC
4. Conclusions
Author Contributions
Acknowledgments
Conflicts of Interest
References
- Hutyrova, Z.; Harnicarova, M.; Zajac, J.; Valicek, J.; Mihok, J. Experimental Study of Surface Roughness of Wood Plastic Composites after Turning. Adv. Mater. Res. 2014, 856, 108–112. [Google Scholar] [CrossRef]
- Li, Y.Z. PVC Stone Based Material and Its Application. Patent Application No. CN101306927A, 19 November 2008. Available online: https://patents.google.com/patent/CN101306927A/zh (accessed on 25 December 2018).
- Huang, Z.G. Fast-Fixed Stone Plastic Clad Plate. Patent Application No. CN200999444Y, 2 January 2008. Available online: https://patents.google.com/patent/CN200999444Y/en (accessed on 17 December 2018).
- Barletta, M.; Tagliaferri, V.; Trovalusci, F.; Veniali, F.; Gisario, A. The Mechanisms of Material Removal in the Fluidized Bed Machining of Polyvinyl Chloride Substrates. J. Manuf. Sci. E 2013, 135, 11003. [Google Scholar] [CrossRef]
- Yousefi, R.; Gorjizadeh, A.; Mikaeil, R. The Effect of Machining Parameters on Force Signal and Tool Wear in Stone Cutting. Mater. Process. Technol. 2011, 1315, 961–966. [Google Scholar] [CrossRef]
- Kanda, K.; Takehana, S.; Yoshida, S.; Watanabe, R.; Takano, S.; Ando, H.; Shimakura, F. Application of Diamond-Coated Cutting Tools. Surf. Coat. Technol. 1995, 73, 115–120. [Google Scholar] [CrossRef]
- Guo, X.L.; Zhu, Z.L.; Ekevad, M.; Bao, X.; Cao, P.X. The Cutting Performance of Al2O3 and Si3N4 Ceramic Cutting Tools in the Milling Plywood. Adv. Appl. Ceram. 2018, 117, 16–22. [Google Scholar] [CrossRef]
- Zhu, Z.L.; Guo, X.L.; Ekevad, M.; Cao, P.X.; Na, B.; Zhu, N.F. The Effects of Cutting Parameters and Tool Geometry on Cutting Forces and Tool Wear in Milling High-Density Fiberboard with Ceramic Cutting Tools. Int. J. Adv. Manuf. Technol. 2017, 91, 4033–4041. [Google Scholar] [CrossRef]
- Giles, C.; Adriano, C.; Lubambo, A.F.; Cusatis, C.; Mazzaro, I.; Honnicke, M.G. Diamond Thermal Expansion Measurement Using Transmitted X-Ray Back-Diffraction. J. Synchrotron. Radiat. 2005, 12, 349–353. [Google Scholar] [CrossRef] [PubMed]
- Chowdhury, S.; Barra, E.D.; Laugier, M.T. Hardness Measurement of CVD Diamond Coatings on Sic Substrates. Surf. Coat. Technol. 2005, 193, 200–205. [Google Scholar] [CrossRef]
- Romanski, A.; Lachowski, J. Effect of Friction Coefficient on Diamond Retention Capabilities in Diamond Impregnated Tools. Arch. Metall. Mater. 2009, 54, 1112–1118. [Google Scholar]
- Che, J.; Cagin, T.; Deng, W.Q.; Goddard, W.A.; William, A. Thermal Conductivity of Diamond and Related Materials From Molecular Dynamics Simulations. J. Chem. Phys. 2000, 113, 6888–6900. [Google Scholar] [CrossRef]
- Uhlmann, E.; Worner, E.; Brücher, M. More Efficient Cutting Processes Due to the Heat-Spreading Effect of CVD Diamond. Ind. Diam. Rev. 2003, 63, 25–29. [Google Scholar]
- Belmonte, M.; Oliveira, F.J.; Sacramento, J.; Fernandes, A.J.S.; Silva, R.F. Cutting Forces Evolution with Tool Wear in Sintered Hardmetal Turning with CVD Diamond. Diam. Relat. Mater. 2004, 13, 843–847. [Google Scholar] [CrossRef]
- Wang, H.X.; Zong, W.J.; Li, D.; Dong, S. Feed Rate and Depth of Cut Influence on Cutting Forces in Diamond Turning Aluminium Alloy. Mater. Sci. Forum. 2004, 471–472, 634–639. [Google Scholar] [CrossRef]
- Shihab, S.K.; Khan, Z.A.; Mohammad, A.; Siddiquee, A.N. A Review of Turning of Hard Steels Used in Bearing And Automotive Applications. Prod. Manuf. Res. 2014, 2, 24–29. [Google Scholar] [CrossRef]
- Iqbal, M.; Konneh, M.; Ani, M.H.; Abdallah, K.A.; Binting, M.F. Cutting Temperature in High Speed Milling of Silicon Carbide Using Diamond Coated Tool. IIUM. Repos. 2015, 3, 62–66. [Google Scholar]
- Wang, S.J.; Chen, X.; To, S.; Ouyang, X.B.; Liu, Q.; Liu, J.W.; Lee, W.B. Effect of Cutting Parameters on Heat Generation in Ultra-Precision Milling of Aluminum Alloy 6061. Int. J. Adv. Manuf. Technol. 2015, 80, 1265–1275. [Google Scholar] [CrossRef]
- Jared, B.H.; Dow, T.A. Investigation of the Direction of Chip Motion in Diamond Turning. Precis. Eng. 2001, 25, 155–164. [Google Scholar] [CrossRef]
- Che, D.; Zhang, W.; Ehmann, K. Chip Formation and Force Responses in Linear Rock Cutting: An Experimental Study. J. Manuf. Sci. E 2017, 139, 011011. [Google Scholar] [CrossRef]
- Guo, X.L.; Ekevad, M.; Grönlund, A.; Marklund, B.; Cao, P.X. Tool Wear and Machined Surface Roughness During Wood Flour/Polyethylene Composite Peripheral Up milling Using Cemented Tungsten Carbide Tools. Bioresources 2014, 9, 3779–3791. [Google Scholar] [CrossRef]
- Wu, D.; Zhang, P.; Wang, H.; Qiao, Z.; Wang, B. Effect of Cutting Parameters on Surface Quality During Diamond Turning of Micro-Prism Array. Proc. Inst. Mech. Eng. B-J. Eng. 2016, 231, 555–561. [Google Scholar] [CrossRef]
- Jamal, S.A.; Jaby, M. Optimization of Process Parameters in Diamond Abrasive Machining of Carbon Fiber-Reinforced Epoxy. Adv. Manuf. Process. 2014, 29, 1361–1366. [Google Scholar] [CrossRef]
- Wang, H.Y.; Tang, W.J.; Xu, R.Y.; Fang, Q.H.; Bao, J.H.; Yuan, S.F.; Li, Q.; Du, G.B. Effect of Thermo-treatment on Heating Dimensional Change Rate of Formed PVC Composite Wood Floor. Eng. Plast. Appl. 2014, 42, 55–58. [Google Scholar] [CrossRef]
- Zhao, Y.Y. Synthetic Stone–Plastic Flooring. Patent Application No. CN101003425A, 10 December 2007. Available online: http://www.google.com/patents/CN100441535C?cl=zh (accessed on 11 December 2018).
- Shaw, M.C.; Cookson, J.O. Metal Cutting Principles. Tribol. Int. 1985, 18, 55. [Google Scholar] [CrossRef]
- Avril, S.; Bonnet, M.; Bretelle, A.S.; Grédiac, M.; Hild, F.; Ienny, P.; Latourte, F.; Lemosse, D.; Pagano, S.; Pagnacco, E. Overview of Identification Methods of Mechanical Parameters Based on Full-Field Measurements. Exp. Mech. 2008, 48, 381–402. [Google Scholar] [CrossRef]
- He, T.; Liu, L.; Makeev, A.; Shonkwiler, B. Characterization of Stress–Strain Behavior of Composites Using Digital Image Correlation and Finite Element Analysis. Compos. Struct. 2016, 140, 84–93. [Google Scholar] [CrossRef]
- Guo, X.L.; Ekevad, M.; Marklund, B.; Li, R.R.; Cao, P.X.; Grönlund, A. Cutting Forces and Chip Morphology During Wood Plastic Composites Orthogonal Cutting. Bioresources 2014, 9, 2090–2106. [Google Scholar] [CrossRef]


| Blade | Angle Geometries | Material Properties | |||||
|---|---|---|---|---|---|---|---|
| PCD | Rake Angle | Wedge Angle | Clearance angle | Density | Modulus of Elasticity | Hardness | Thermal Conductivity |
| 16° | 62° | 12° | 4110 kg·m−3 | 800 GPa | 8000 HV | 560 W·m−1·K−1 | |
© 2019 by the authors. Licensee MDPI, Basel, Switzerland. This article is an open access article distributed under the terms and conditions of the Creative Commons Attribution (CC BY) license (http://creativecommons.org/licenses/by/4.0/).
Share and Cite
Zhu, Z.; Buck, D.; Guo, X.; Cao, P.; Ekevad, M. Machinability of Stone—Plastic Materials During Diamond Planing. Appl. Sci. 2019, 9, 1373. https://doi.org/10.3390/app9071373
Zhu Z, Buck D, Guo X, Cao P, Ekevad M. Machinability of Stone—Plastic Materials During Diamond Planing. Applied Sciences. 2019; 9(7):1373. https://doi.org/10.3390/app9071373
Chicago/Turabian StyleZhu, Zhaolong, Dietrich Buck, Xiaolei Guo, Pingxiang Cao, and Mats Ekevad. 2019. "Machinability of Stone—Plastic Materials During Diamond Planing" Applied Sciences 9, no. 7: 1373. https://doi.org/10.3390/app9071373
APA StyleZhu, Z., Buck, D., Guo, X., Cao, P., & Ekevad, M. (2019). Machinability of Stone—Plastic Materials During Diamond Planing. Applied Sciences, 9(7), 1373. https://doi.org/10.3390/app9071373