Article

Fatigue Behaviour of Textile Reinforced Cementitious Composites and Their Application in Sandwich Elements

1
Department Mechanics of Materials and Constructions, Vrije Universiteit Brussel (VUB), Pleinlaan 2, 1050 Brussels, Belgium
2
CRH Structural Concrete Belgium nv, Marnixdreef 5, 2500 Lier, Belgium
*
Author to whom correspondence should be addressed.
Appl. Sci. 2019, 9(7), 1293; https://doi.org/10.3390/app9071293
Submission received: 19 February 2019 / Revised: 24 March 2019 / Accepted: 26 March 2019 / Published: 28 March 2019

Abstract

:
Using large lightweight insulating sandwich panels with cement composite faces offers great possibilities for the renovation of existing dwellings. During their lifetime, these panels are subjected to wind loading, which is equivalent to a repeated loading. To guarantee the structural performance of these panels during their entire lifetime, it is necessary to quantify the impact of these loading conditions on the long term. The fatigue behaviour was, therefore, examined in this paper both at the material level of the faces and at the element level as well. plain textile reinforced cementitious composite (TRC) specimens were subjected to 100,000 loading cycles by means of a uniaxial tensile test, while sandwich beams were loaded 100.000 times with a four-point bending test. Results show that the residual behaviour is strongly dependent on the occurrence of cracks. The formation of cracks leads to a reduction of the initial stiffness. The ultimate strength is only affected in a minor way by the preloading history.

1. Introduction

The energy and thermal insulation regulations for both new buildings and renovations become stricter year after year, leading directly to a growing demand for low-energy insulating building solutions. Particularly for renovation, the installation time on site needs to be reduced to the minimum to limit the inconvenience for the current residents. In this context, large lightweight prefabricated sandwich panels offer great possibilities. Renovating and insulating existing dwellings by placing panels with the dimensions of one story facilitates the installation process and reduces the total renovation time to a couple of days.
Nowadays sandwich panels are already widely spread in construction. They are characterized by a large stiffness to weight ratio thanks to the composite action between the two stiff faces and the insulating core. Different materials can be used, both for the core as for the skins [1]. Steel, wood, concrete, etc., have been used as facing material. Precast concrete sandwich panels are commonly used for walls of (industrial) buildings. Typically, these panels consist of steel reinforced concrete faces with a thickness of 60 mm or more, which ensure the load-bearing capacity. The total weight of such panels can be substantially reduced by omitting the non-structural concrete, i.e., the concrete cover necessary to protect the steel rebars against corrosion. This can be achieved by using technical textiles as an alternative reinforcement to steel. Since these textiles are not sensitive to corrosion, no concrete cover is needed, and lightweight sandwich panels with skins of only a few millimeter’s thickness can be achieved. The combination of a cementitious matrix with a textile reinforcement has been widely investigated for different kinds of applications: reinforcing and/or strengthening of concrete and masonry structures [2,3,4,5], construction of pedestrian bridges [6], and as skins for the fabrication of sandwich panels. In addition to an experimental characterization of the bending behaviour of TRC sandwich panels [7,8,9,10], various work has been done on the analytical [11,12] and numerical [13,14,15] modelling of this behavior.
Textile reinforced cementitious composite (TRC) is characterized by a linear behavior in compression and a non-linear behavior in tension. This non-linear tensile behavior was observed in various experiments [16,17,18,19,20]. Parallel to this experimental campaign, different models were elaborated to predict the structural behavior of TRC [21,22,23,24]. Generally, the tensile behavior of the composite can be divided into three different stages (Figure 1). During the first linear stage, fibers and matrix are working together, and the modulus is given by the law of mixtures. For composites with a low fiber volume fraction, the modulus of the matrix is determining for the resulting initial modulus E1. Cracks start forming in the matrix when the ultimate tensile stress of the matrix is exceeded, resulting in a reduction of the modulus. Once a crack is formed, the load is redistributed. This process of the formation of cracks and subsequently redistribution of the load is called the multiple cracking stage and repeats itself until the matrix is fully saturated with cracks. The third and last stage is called the post-cracking stage. In this linear stage, the additional load is only carried by the fibers. The tangential modulus of the composite E3 is determined by the modulus of the fibers and the fiber volume fraction. Finally, failure of the composite material is induced by tensile rupture of the textile at a strain largely exceeding the tensile failure strain of the matrix.
Applied in sandwich panels, the TRC faces are subjected to different loading conditions. One of the determining loading conditions is wind loading, comparable to a repeated loading. The influence of TRC sandwich panels subjected to a repeated loading has been studied little before. Cuypers et al. [25] cyclically loaded sandwich panels with E-glass fiber reinforced cementitious faces up to 2/3rd of their ultimate load. The panels were subjected to ten loading cycles and subsequently loaded up to failure. During the repeated loading an accumulation of the residual deformation was observed. Literature data on the fatigue behavior of TRC itself are limited. Hegger [6] and Mesticou [26] performed cyclic loading tests on TRC coupons, but the number of loading cycles was limited. Remy [27] and Cuypers [28] studied the behavior of TRC specimens, combining an inorganic phosphate cement with E-glass fibers. The specimens were subjected up to 107 cycles for different maximum cyclic loads. By assessing the evolving modulus, it was concluded that the accumulation of damage was not stabilized after 107 cycles. In all the above-mentioned research, samples were loaded and unloaded using a uniaxial tensile test up to a load at which the multiple cracking fully took place. An evaluation of the fatigue behavior of TRC at low load levels, i.e., below the matrix cracking stress is lacking in the literature.
Applied as thin faces in a sandwich panel loaded in bending, TRC will subjected to (nearly) uniform tension or compression and to loading cycles at relatively low stress levels originating from the characteristic wind loadings. The investigation of repeated loading conditions at the lower stress range is crucial and differs from the work done in literature. The formation of cracks at lower stress levels needs to be evaluated. This occurrence of cracks is directly linked to the ingress of aggressive substances and, thus, to durability measures of the façade panels. In addition, the modulus of TRC in the cracked state is significantly reduced. This lowered modulus has a direct impact on the displacements of the panels. A proper comprehension of the tensile fatigue behavior of TRC is, thus, indispensable to evaluate the long-term behavior of the resulting sandwich panels, and this already at low stress levels to account for the serviceability limit state.
This paper describes an extensive experimental study on 27 TRC coupons and 13 sandwich beams with TRC faces. Nine coupons were tested statically to identify the reference tensile behavior. The other 18 samples were divided into three different series. Each series was subjected to 100,000 tensile loading–unloading cycles up to a different predefined stress level, based on the expected loading conditions in serviceability limit state: 0.5 MPa, 1.0 Mpa, and 2.0 MPa. Afterwards, a static tensile test was performed to quantify the residual behavior. From the 13 sandwich beams, five sandwich beams were used as reference beams and loaded up to failure. The eight other beams, divided into two series, were subjected to 100,000 loading–unloading cycles and subsequently loaded up to failure. The maximum cycle load of the first series was equivalent to an elastic tensile stress of 1.0 MPa in the TRC skin, for the second series this was equivalent to an elastic tensile stress of 2.0 MPa. For both the coupons and the sandwich beams, an extensive analysis was performed on the hysteresis curves of the repeated loading tests and on the residual static behavior. In addition to a comparison of the structural behavior, the cracking behavior was also investigated in detail. Conclusions were drawn on the evolution of the parameters of the hysteresis curves and on the degradation of the static behavior.

2. Materials and Methods

2.1. Material Characteristics

To allow a clear comparison between the investigations on the component and the element level, the same materials were used for the coupons and the sandwich faces. For the TRC coupons, a premix mortar was reinforced with multiple layers of alkali-resistant (AR) glass fiber textiles. For the sandwich beams, an expanded polystyrene (EPS) core was covered with the same textile, embedded in the premix mortar. The material properties of both the EPS and the TRC constituents (mortar and textile) are described below.

2.1.1. Mortar

A commercially available Portland cement-based shrinkage-compensated mortar was chosen as the matrix of the TRC. Its maximum grain size was 0.5 mm, and a water to binder mass ratio of 0.15 was considered. Six flexural and twelve compression tests were performed according to the European Standards [29], to characterize the flexural strength fct,f and compressive strength fcc (Table 1).

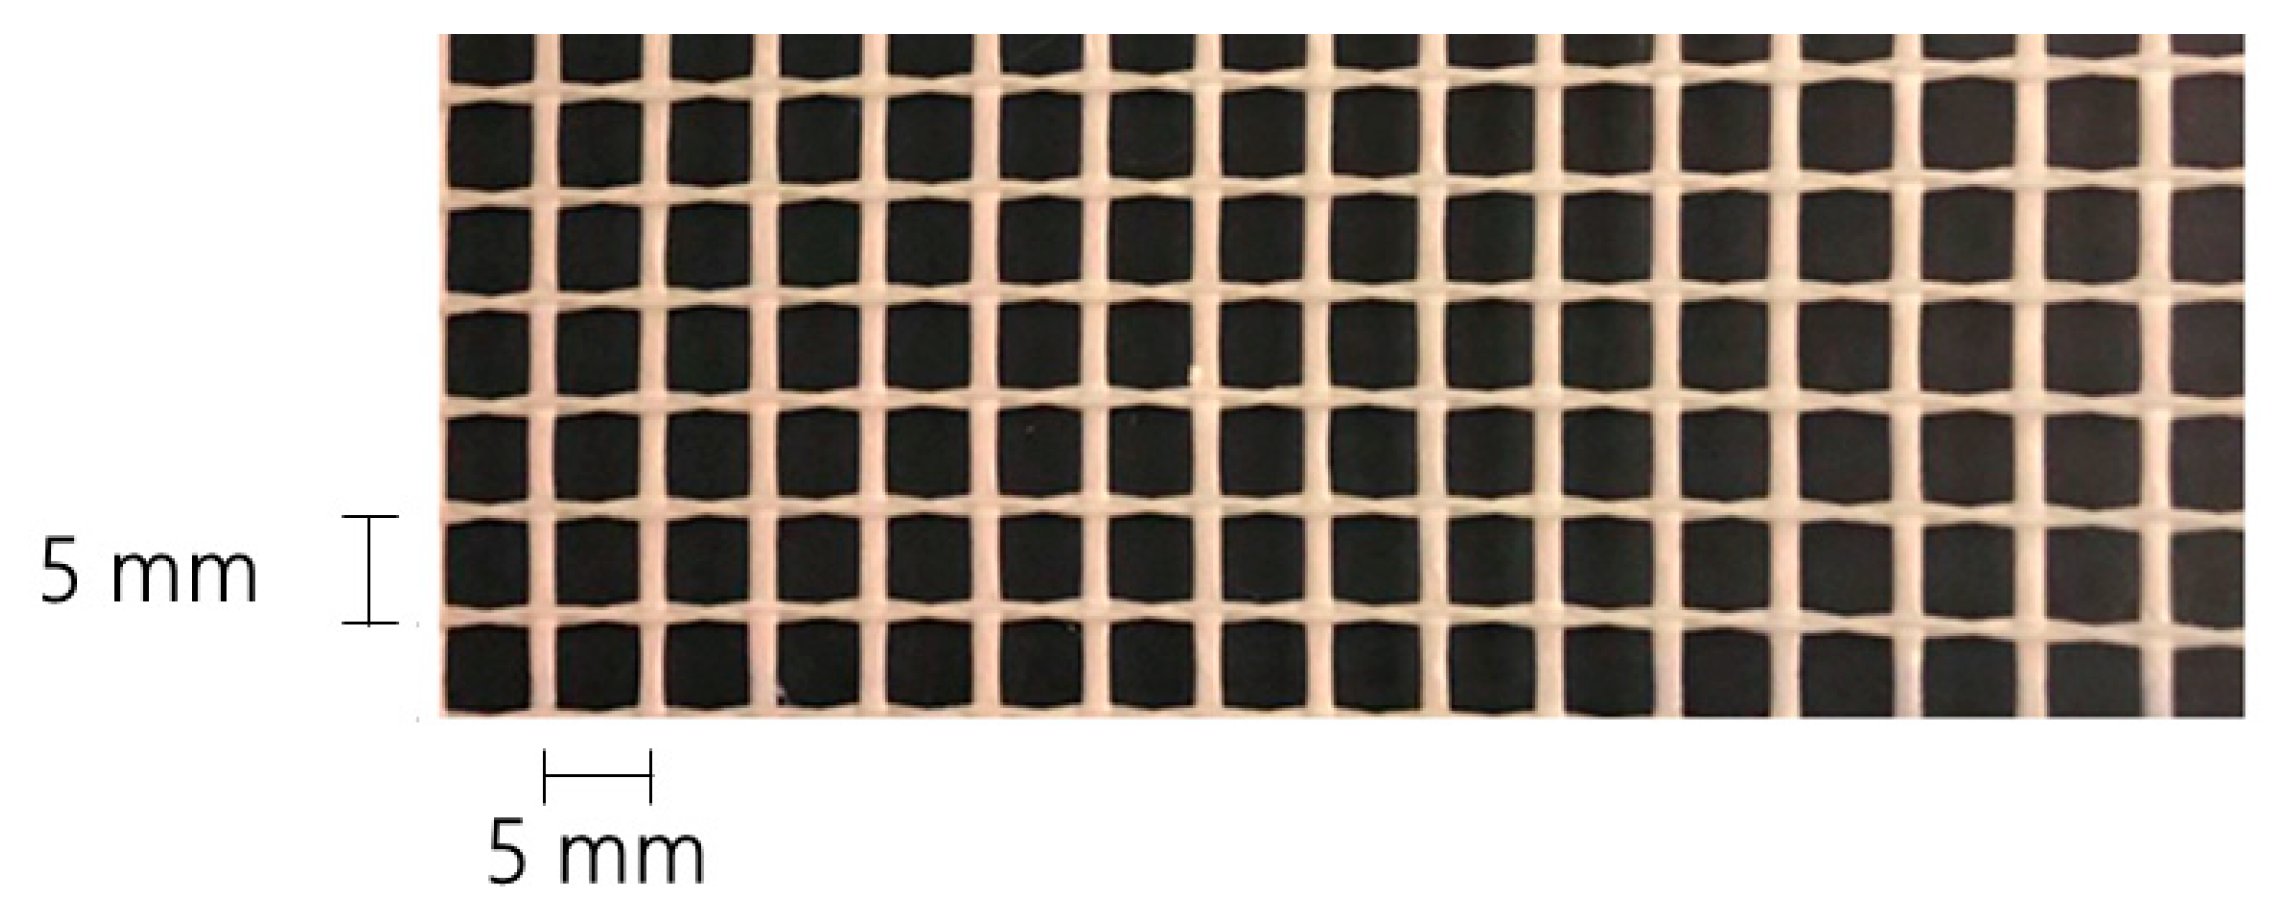
2.1.2. Textile Reinforcement

A technical textile made of AR glass rovings is embedded in the mortar. The textile is polymer coated and woven into an orthogonal mesh. The textile has a nominal tensile strength of 2500 N per 50 mm, a total surface weight of 200 g/m2 (165 g/m2 glass fibers), and a mesh opening of 5 mm in both directions [30] (Figure 2).

2.1.3. Expanded Polystyrene

For the fabrication of the sandwich beams, expanded polystyrene (EPS) was chosen as a rigid insulating core. EPS is not the most performant thermal insulating material, but this is largely compensated by its low cost and low density (15–20 kg/m³). Both cost and density are key parameters for the considered application. The properties of the used EPS 200 are listed in Table 2.

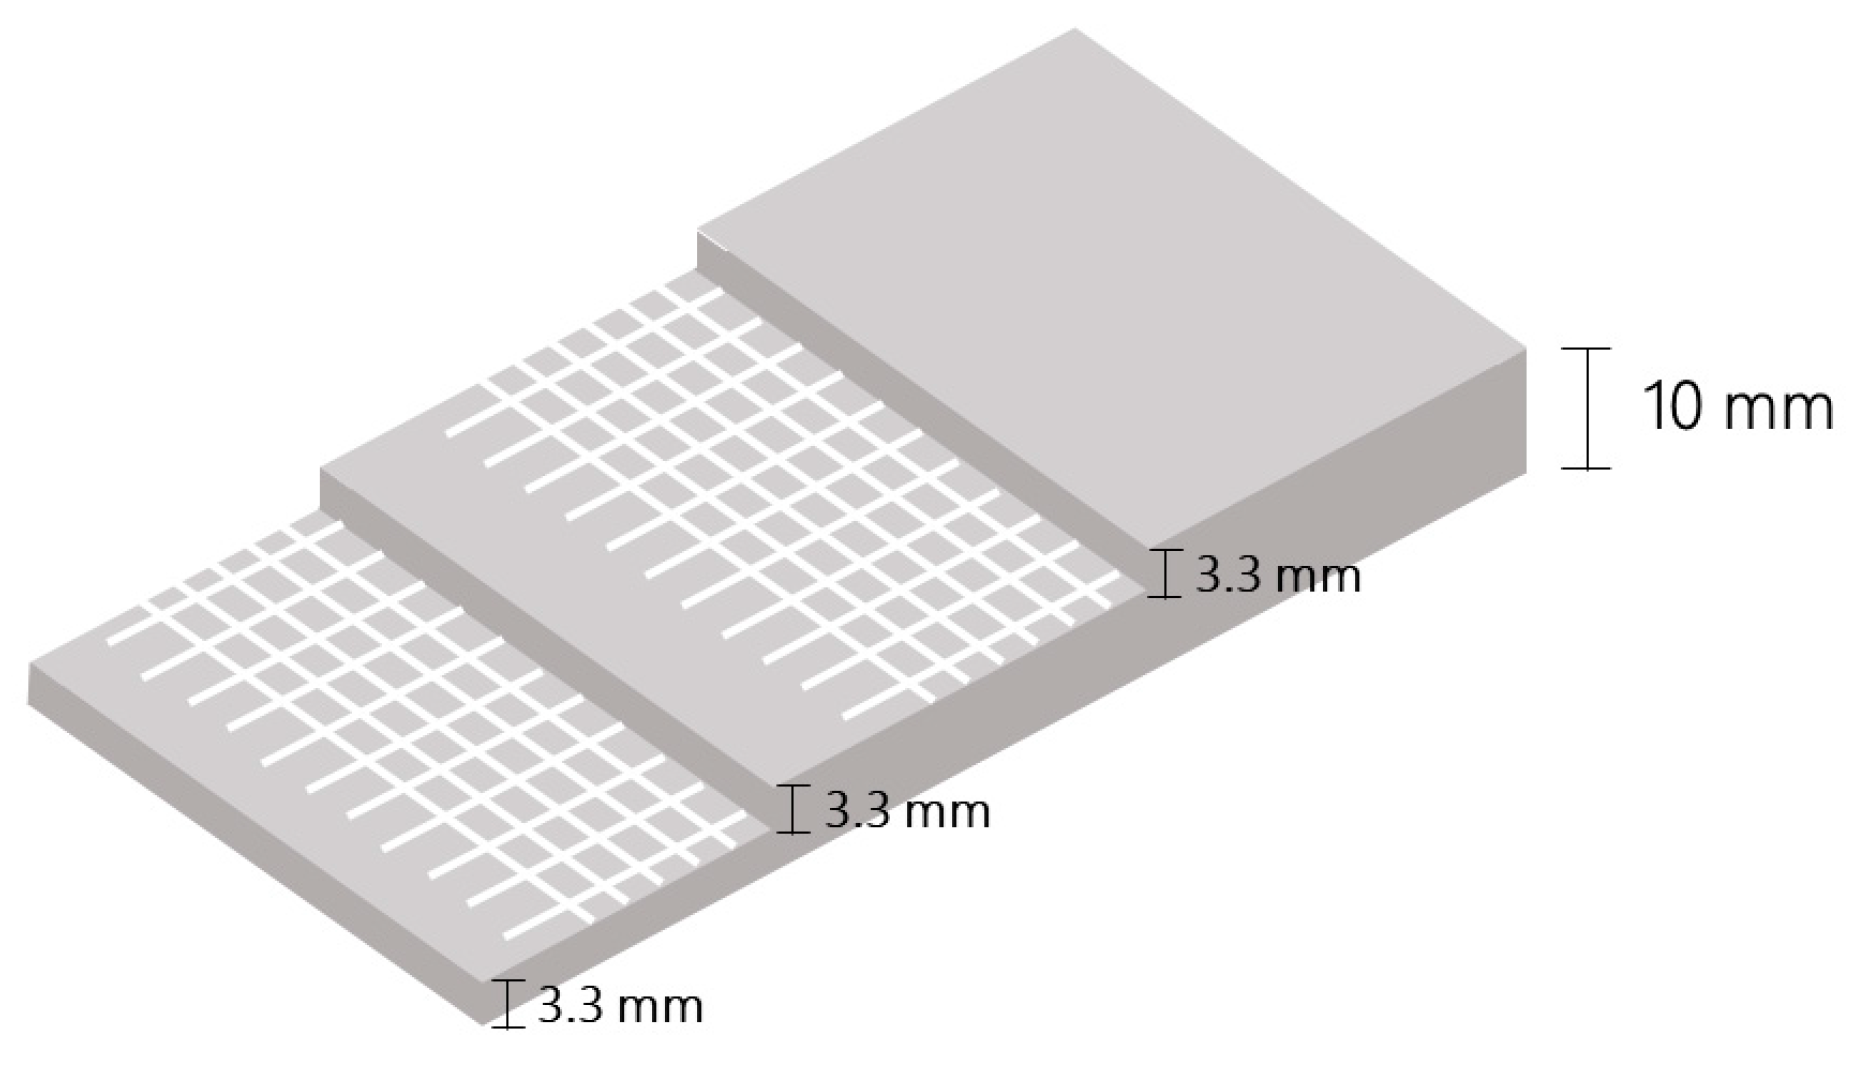
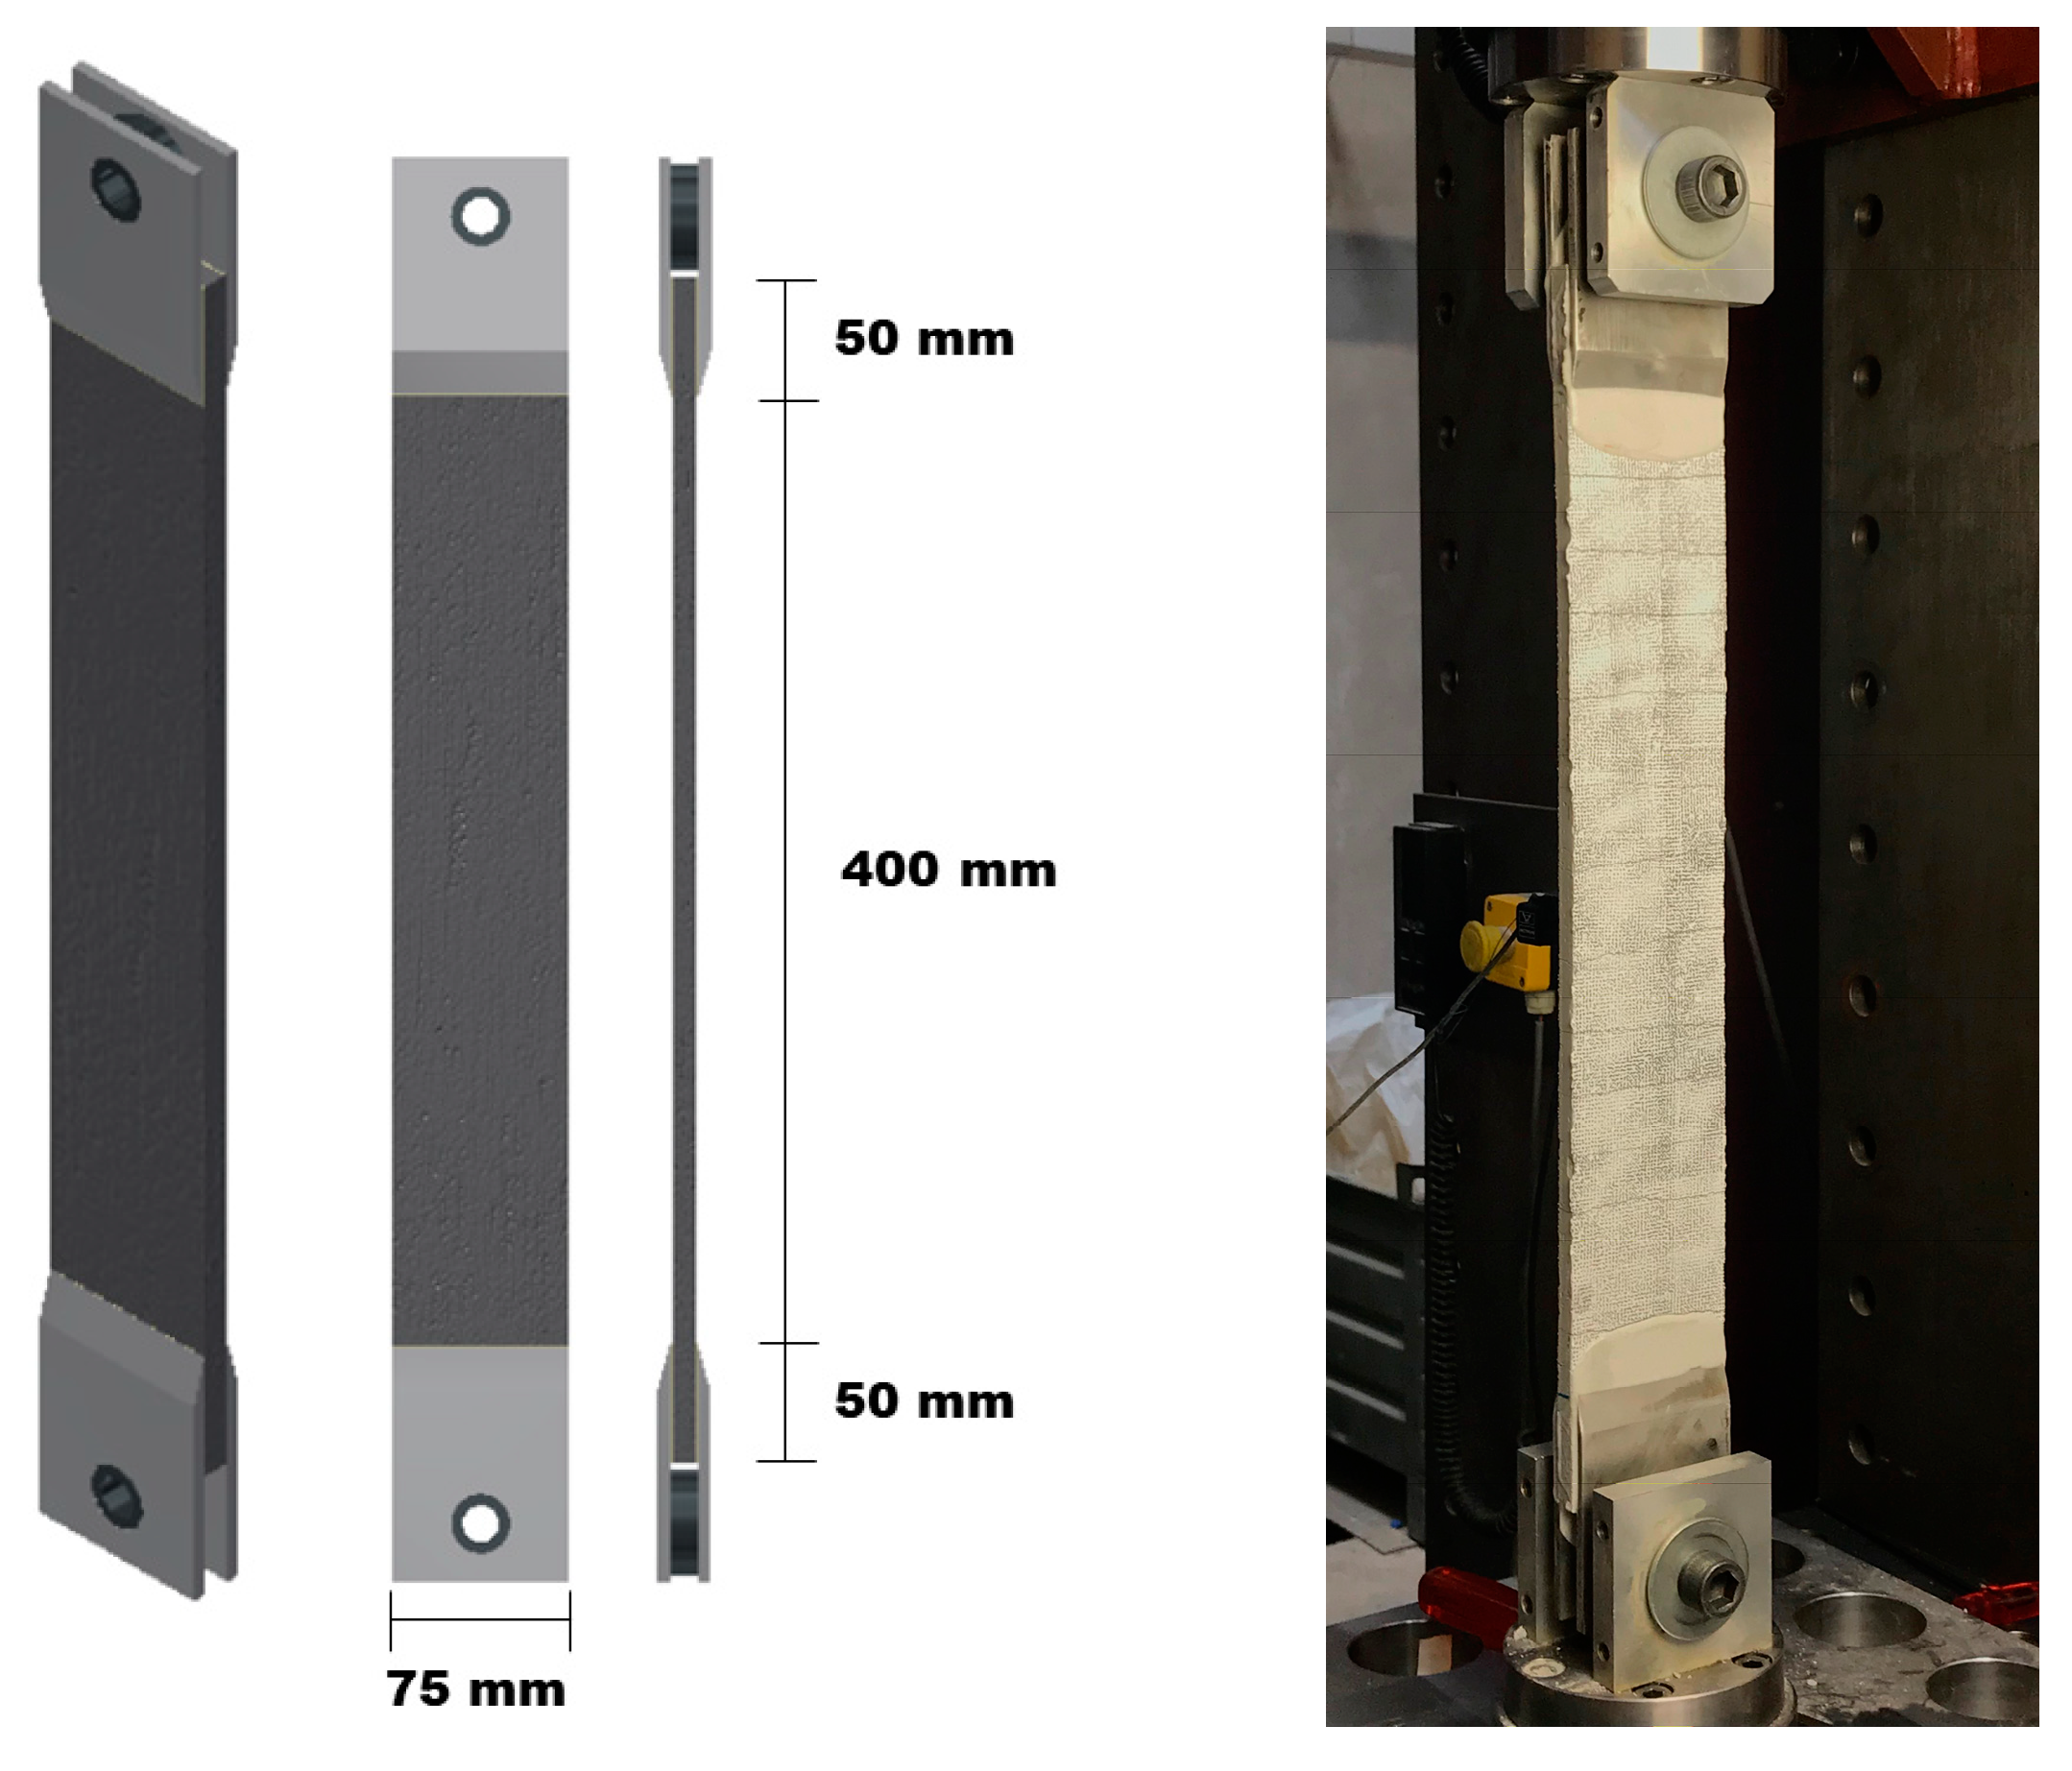
2.2. Specimen Preparation

The experiments on the material level were carried out on prismatic TRC coupons, with a nominal length of 500 mm, a nominal width of 75 mm, and a nominal thickness of 10 mm. All specimens had an identical build-up, reinforced with two layers of textile equally distributed over the height (Figure 3). To do so, they were made separately using a hand lay-up technique; the mortar was cast three times. After spreading out the first layer of mortar, a reinforcement fiber net was placed and impregnated in the mortar (Figure 4). Subsequently, a second layer of mortar and second reinforcement grid were placed. Once the third layer of mortar was cast, a plastic sheet was used to seal the mold and to prevent premature evaporation of the water. All the coupons were demoulded after 24 h and had the same curing process for 28 days; stored at ambient temperature (approximately 20 °C) and a relative humidity of between 45% and 60% for at least 28 days. The resulting fiber volume fraction of the samples was equal to 1.29% (0.65% in the loading direction).
For the element level, sandwich beams with a total length of 2500 mm and a width of 200 mm were fabricated and tested. An EPS core with a thickness of 200 mm was covered on both sides with a 5 mm thick TRC layer using a hand lay-up technique. After spreading out a layer of mortar, the textile grid was embedded in the mortar. The glass fiber volume fraction was equal to that of the coupons, 0.65% in the loading direction. The faces were sealed with a plastic cover to prevent premature evaporation. All beams were stored for at least 28 days at ambient temperature (approximately 20 °C) and relative humidity of between 45% and 60%.

2.3. Test Set-Up

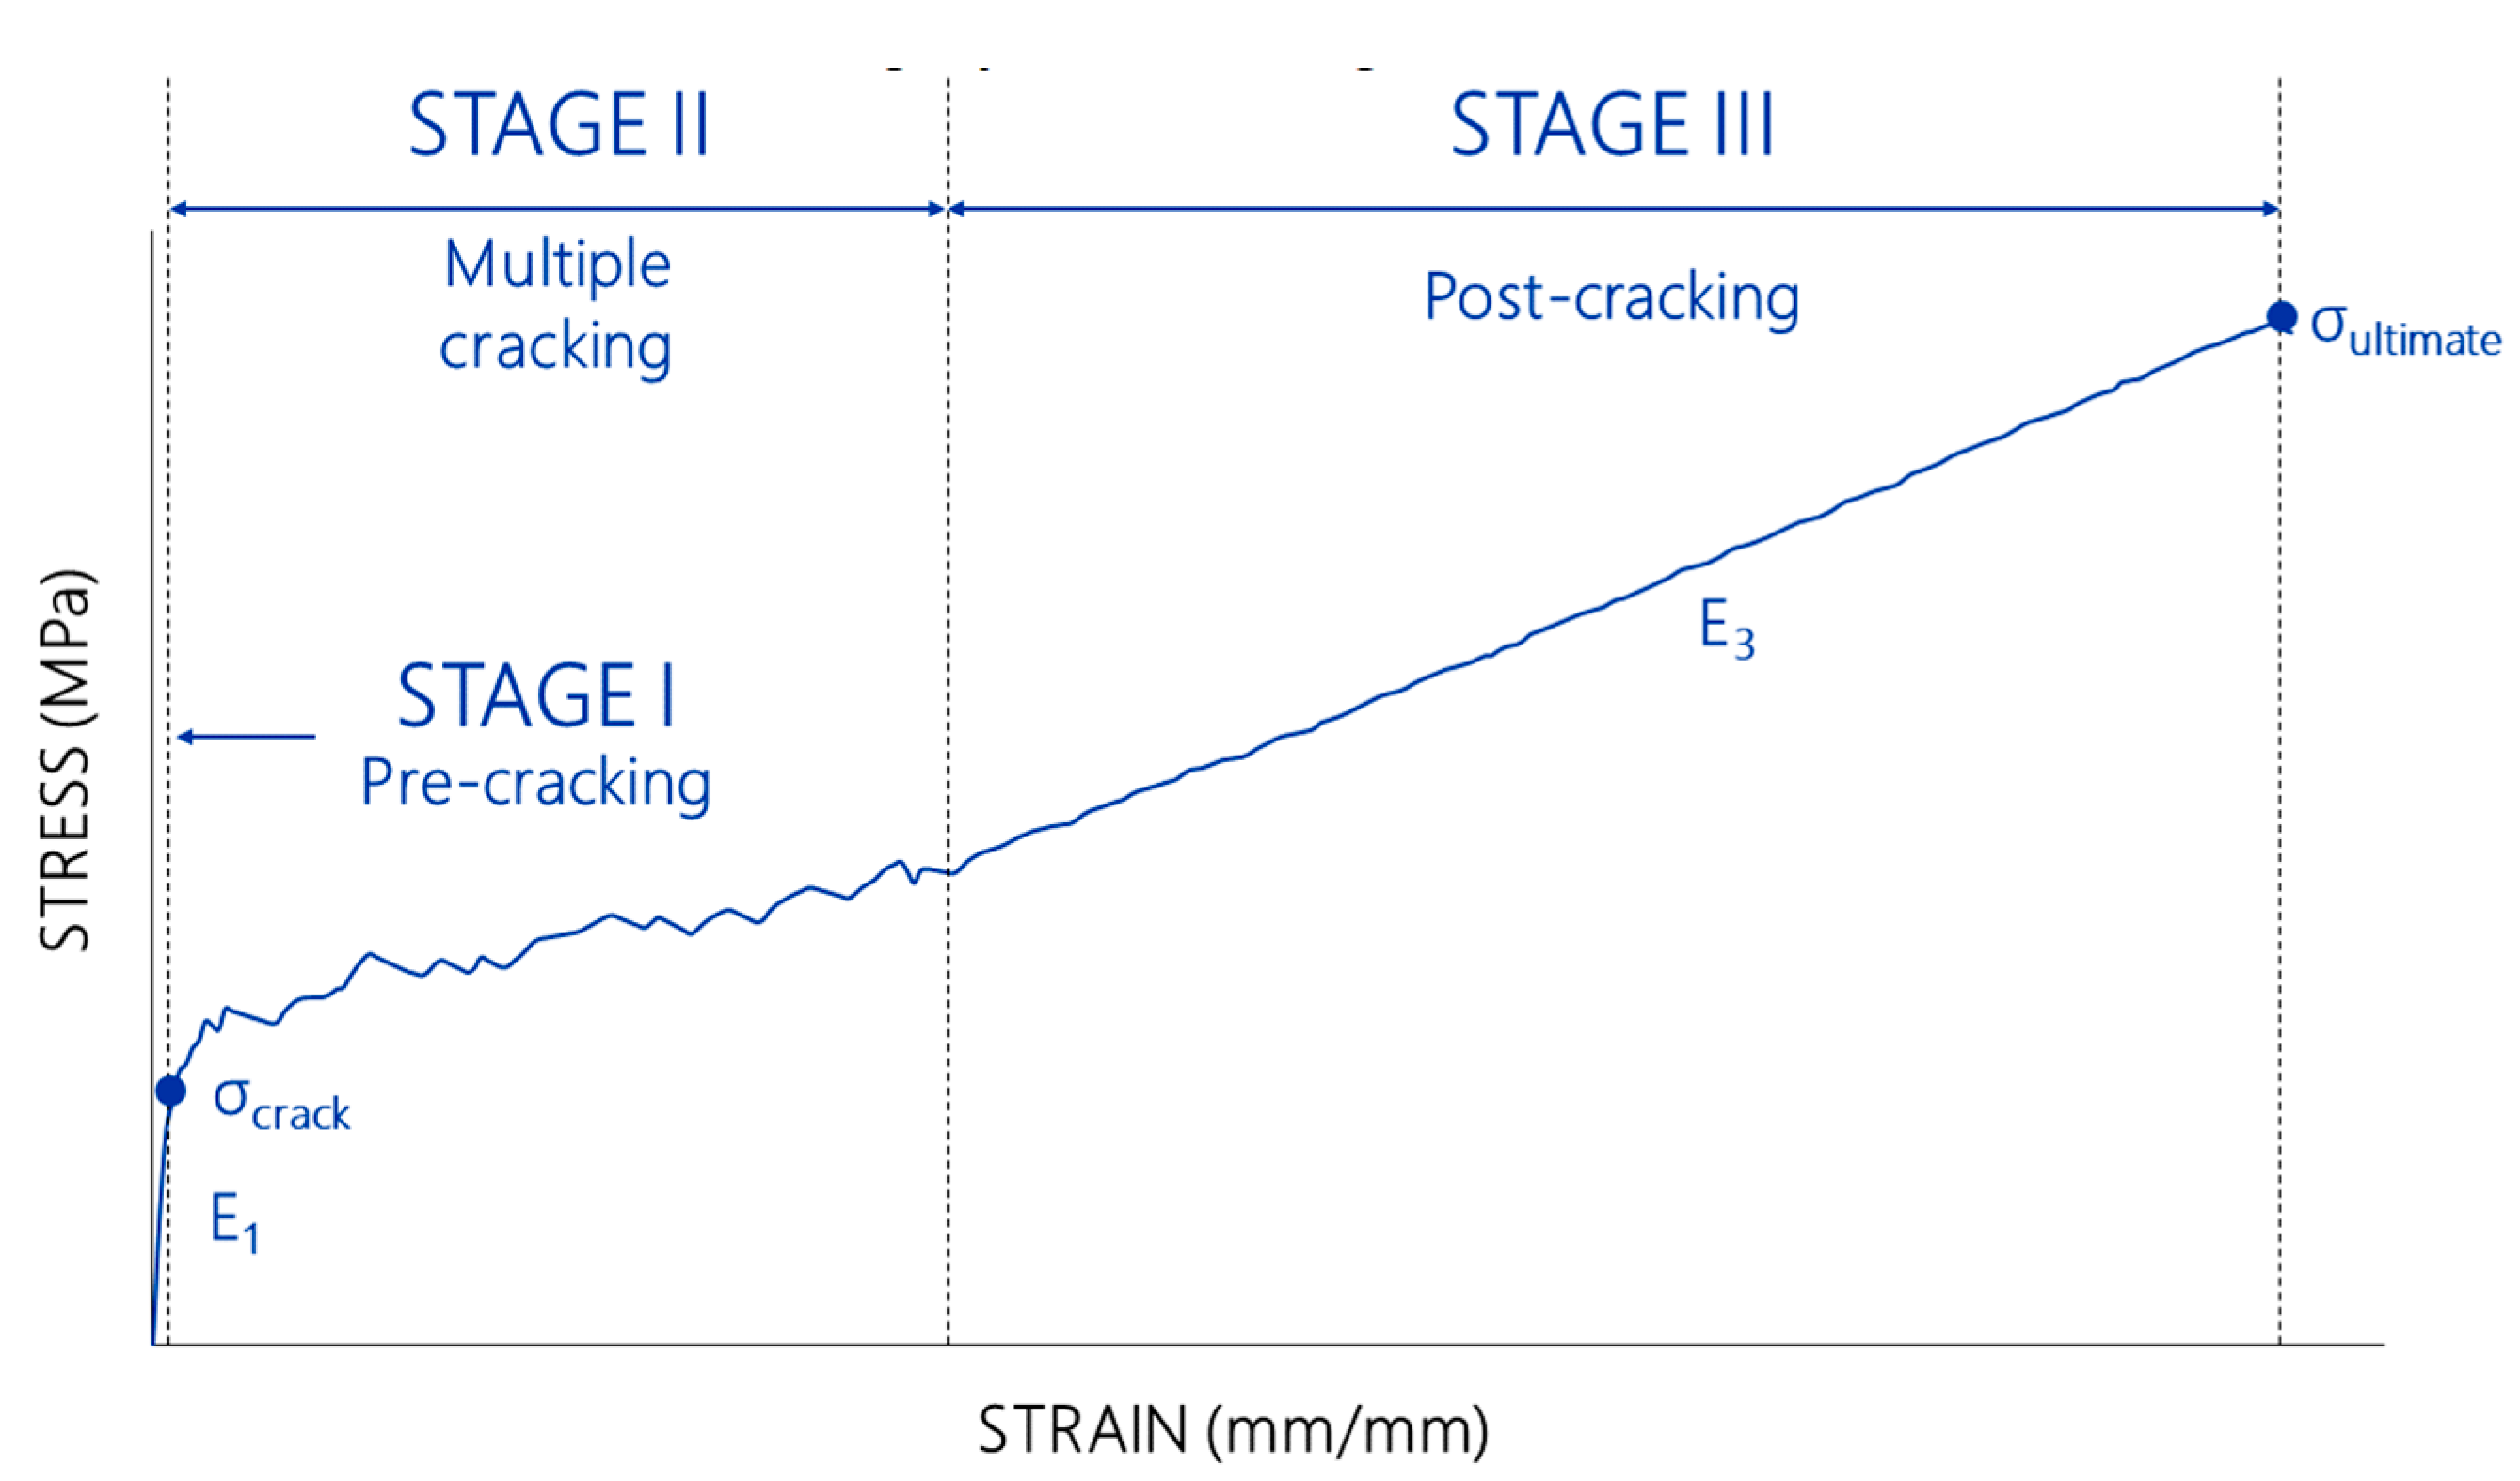
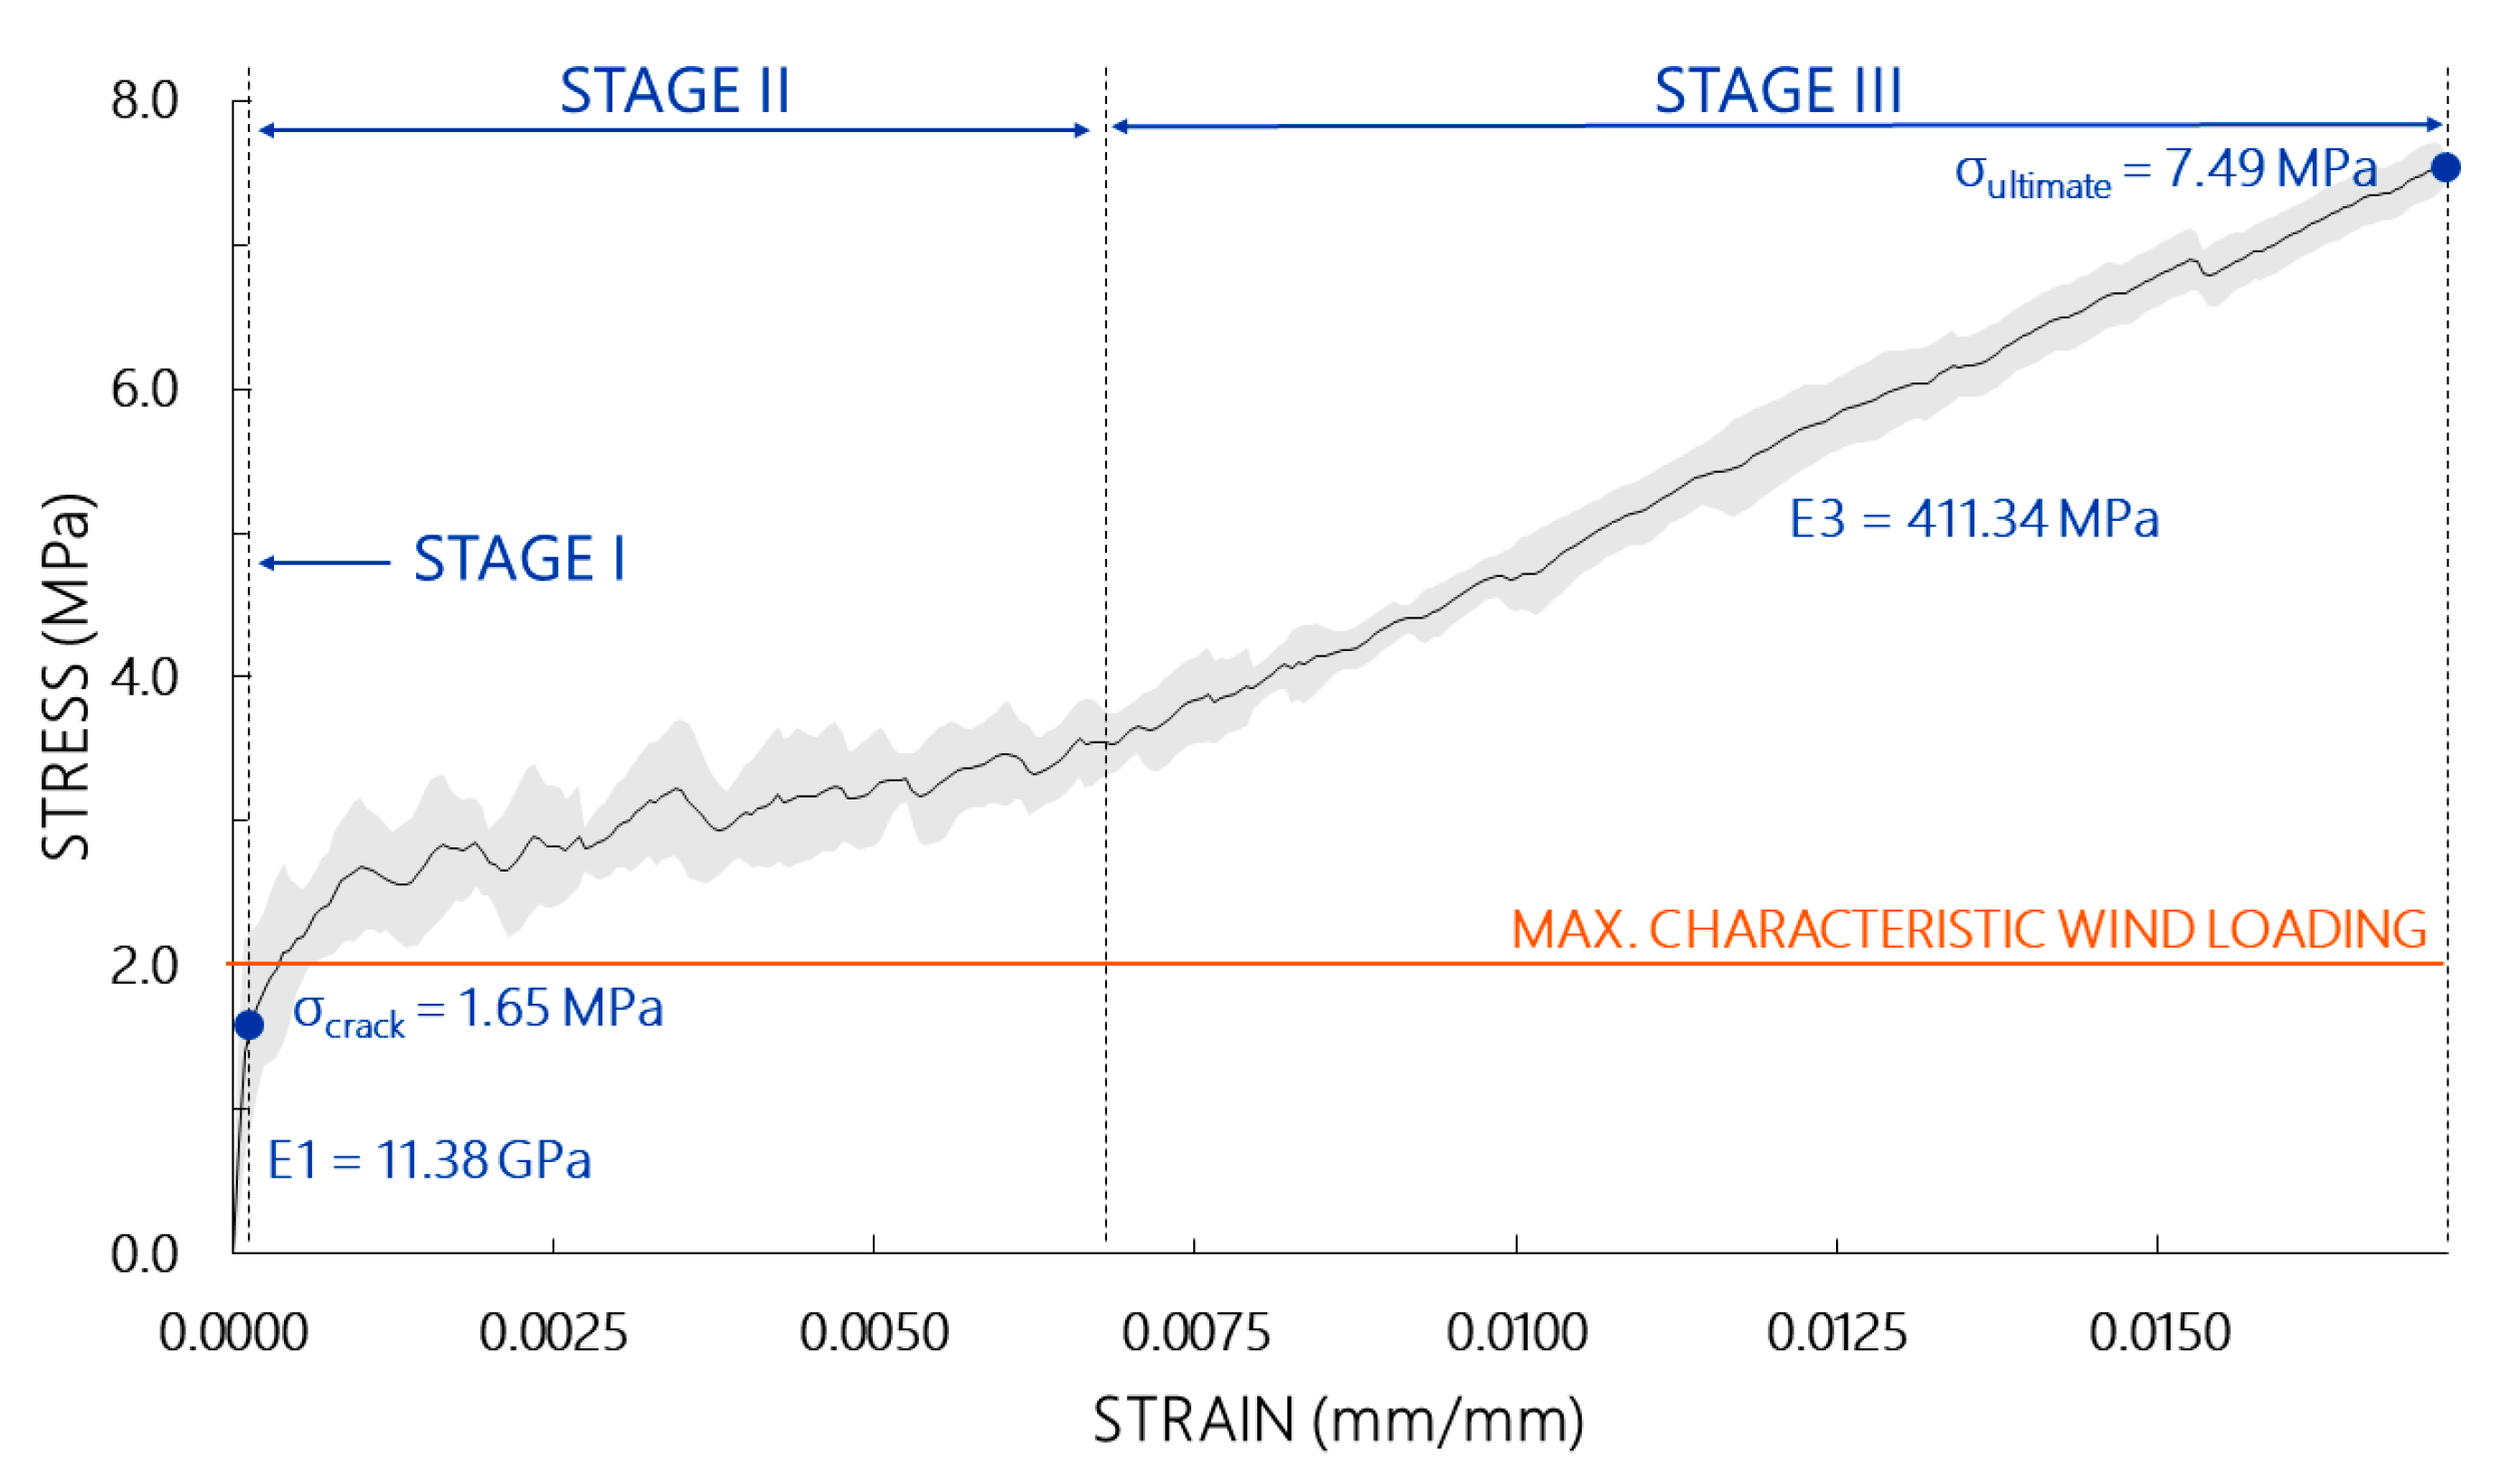
2.3.1. Uniaxial Tensile Tests

For the material level, uniaxial tensile tests on TRC coupons were preferred over bending tests, since they are more representative for the considered application: the thin faces of a sandwich panel subjected to bending are loaded under (nearly) uniform tension or compression. In the uniaxial test set-up, the load was introduced via bolt through aluminum end-plates, which were glued to the TRC coupons with a two-component glue. Stress concentrations were avoided by tapering the end-plates (Figure 5). The specimens were loaded by a servo-hydraulic actuator with a capacity of 25 kN, using a 10 kN load cell. The static tests were displacement-controlled with a rate of 1 mm/min. The cyclic loading was load controlled at a frequency of 10 Hz. Displacements were measured with a dynamic extensometer at one side and digital image correlation (DIC) at the other side.

2.3.2. Four-Point Bending Tests

To assess the fatigue behavior on the element level, sandwich beams were both statically and cyclically loaded using a four-point bending test set-up. The distance between the roller supports was 2200 mm. The load was induced by means of a 500 mm span dividing beam, connected through a 10 kN load cell to a servo-hydraulic actuator with a capacity of 25 kN (Figure 6). The static tests were displacement-controlled with a rate of 1 mm/min. The cyclic loading was load-controlled at a frequency of 2 Hz. To avoid local stress concentrations, aluminum distribution plates were placed at the supports and at the loading areas. Mid-span displacements were monitored with an LVDT (Linear Variable Differential Transducer). DIC was used to monitor the cracking behavior of the tensile face partly in the zone of the constant moment.

2.3.3. Digital Image Correlation

To measure strains and displacements and to visualize cracks, digital image correlation (DIC) was used. It is an optical, non-contacting method to measure displacement- and strain-fields of a specimen. The measurement is based on the comparison of a reference image (generally unloaded condition) with images taken at different load steps. The settings of the DIC systems are specified in Table 3. The features of the used cameras are listed in Table 4. For the static tests, images were acquired at a frequency of 0.3 1/s. During the cyclic tests, one image every 10 cycles was taken during the first 100 cycles. Further, one image was acquired every 100 cycles up to cycle 1000 and every 1000 cycles up to cycle 100,000. A more extensive description of the working principle of DIC can be found in the literature [32].

3. Results and Discussion

3.1. Investigations on TRC Coupons

In total 27 specimens were tested. First, the reference behavior (TRC REF) was characterized by testing nine specimens in a quasi-static way. The stresses were calculated using the nominal dimensions, strains were measured using DIC over a length of 320 mm. The average stress–strain curve was determined from the different curves; the standard deviation is presented as the shaded area (Figure 6). In the first linear stage, the modulus E1 was 11.38 GPa. A modulus E3 of 411.34 MPa was determined in the third stage. On average, the first crack appeared at a stress equal to 1.65 MPa.
As mentioned before, building elements, such as façade panels, will be prone to repeated loading conditions originating from the wind. Under characteristic wind loading, the stress level in the faces will not exceed 2 MPa (Figure 7). To have a clear insight on the influence of such loading conditions, three series of six specimens were cyclically loaded up to three different stress levels; 0.5 MPa, 1.0 Mpa, and 2.0 MPa. These series were nominated as: TRC CYCL 0.5 MPa, TRC CYCL 1.0 Mpa, and TRC CYCL 2.0 MPa.
All specimens were loaded 100,000 cycles up to the specific stress level and unloaded to a stress level above 0 MPa to avoid loading the specimens in compression. To compare the different series, focus was put on the evolution of some distinctive fatigue parameters during the cyclic loading: the cycle modulus and the dissipative energy. The modulus per cycle was determined from the hysteresis curve by linear regression and expressed relatively compared to the modulus of the first cycle. The dissipative energy was calculated as the area enclosed by the loading–unloading curve of each cycle. As for the modulus, this was expressed relatively compared to the energy dissipation of the first cycle. The evolution of these different fatigue parameters was observed to be strongly related to the formation of cracks. Without the occurrence of cracks, both the modulus and the dissipative energy remained more or less constant (Figure 8a). Regardless of the applied maximum cycle stress (1.0 MPa or 2.0 MPa), each formation of a crack led to a decrease of the modulus, together with an increase in the dissipative energy (Figure 8b).
Using DIC enabled tracking and visualizing the crack patterns during the repeated loading tests. The crack widths or crack openings were calculated using the displacement fields measured by the DIC. The formation of cracks was related to the maximum cycle stress. The higher the maximum cycle stress the higher the probability of forming cracks. TRC CYCL 0.5 MPa remained uncracked for all six tested coupons. This stress level did not come near the cracking stress of the TRC equal to the average reference cracking stress of 1.65 MPa, which was observed during the static tests. The cracking phenomena of TRC have a very stochastic nature, resulting in a large variation on the first cracking strength. A standard deviation of 0.54 MPa was determined, leading to a smeared range of 1.11 MPa and 2.19 MPa. TRC CYCL 1.0 MPa and TRC CYCL 2.0 MPa were loaded closer to this range which explains the larger probability of the occurrence of cracks. Two specimens of TRC CYCL 1.0 MPa and one specimen of TRC CYCL 2.0 MPa remained uncracked (Table 5). Overall, more cracks were observed for TRC CYCL 2.0 MPa. The outlier is specimen A of TRC CYCL 1.0 MPa, in which 22 cracks were observed after the cyclic preloading. No clear explanation could be found for this; damage caused during manufacturing is the most probable cause for this distorted behavior.
Once a crack was formed, its width tended to stabilize. Both for TRC CYCL. 1.0 MPa as for TRC CYCL. 2.0 MPa, the crack width increased during the first hundred cycles but stabilized afterwards. As an example, the evolution of the crack width was shown for a sample subjected to a maximum cycle stress of 1.0 MPa (Figure 9).
After passing all loading cycles, a static test as described in Section 2.3.1 was performed to determine the residual capacity of the TRC coupons. The stresses were calculated using the nominal dimensions of the coupons, the strains were measured using DIC over a length of 320 mm. The obtained stress–strain curves were grouped per series. In Figure 10 one can see that the residual behavior was only slightly affected for series TRC CYCL 0.5 MPa. As shown in Table 5 no cracks were induced during the cyclic loading. The formation of cracks was found as the only degradation fatigue mechanism, leading directly to the explanation of the observed residual behavior: both the modulus, as the strength were comparable to the reference behavior (Table 6). The only difference between the residual curves and the reference one was found in the multiple cracking stage. As can be seen in Table 6, more cracks were formed for TRC CYCL 0.5 MPa samples compared to REF, which could explain the limited stress increase during the multiple cracking stage, and, thus, the shifted stress–strain curves.
As the maximum stress to which the TRC coupons were cyclically loaded was increased for series TRC CYCL 1.0 MPa and TRC CYCL 2.0 MPa, so did the probability to the formation of cracks. Once a crack was formed, this directly resulted in a decrease of E1 measured in the residual stress–strain behavior. The more cracks are formed, the lower E1. Since this initial modulus was very dependent on the occurrence of cracks, a large scatter exists on the results and the average value of E1 was not representative and, therefore, not displayed in Table 7 and Table 8. A specimen fully saturated with cracks showed a linear behavior in the static tests, for example, specimen A in Figure 11 and specimen E in Figure 12. For these specimens, few extra cracks were formed during the static tests and the residual behavior was characterized with a modulus equal to E3 (Table 7 and Table 8). The cyclic preloading did not affect the modulus in the last branch, E3 (Table 7 and Table 8). Overall, the ultimate strength was lowered after subjection to loading cycles up to 1.0 MPa (Table 7) and 2.0 MPa (Table 8). However, no clear link was found between the number of cracks and the ultimate strength.
Monitoring the static tests up to failure with DIC measurements enabled to map cracking patterns and measure crack widths and spacings. The average, maximum and total crack widths were calculated from the measured displacement fields for each specimen separately at different stress levels. In addition to the crack spacing itself, the cumulative frequency was also determined to quantify the degree of saturation, i.e., the ratio of actually formed cracks to the total number of cracks at failure. To compare the different series to the reference behavior, the average per series was calculated out of the average and total crack width, the crack spacing and the cumulative frequency. For the maximum crack width, the absolute maximum crack width observed over all specimens within one series was determined. The maximum crack width is an important parameter for designing concrete building elements regarding durability measures, decisive for the ingress of aggressive materials.
Looking at the cumulative frequency one could observe that more cracks were formed at lower stress levels for TRC CYCL 0.5 MPa, TRC CYCL 1.0 Mpa, and TRC CYCL 2.0 MPa., while for TRC REF 20% of the total amount of cracks were still formed at stress levels above 4.0 MPa (Figure 13a). The crack spacing showed a discrepancy between TRC REF and TRC CYCL 0.5 MPa versus TRC CYCL 1.0 MPa and TRC CYCL 2.0 MPa (Figure 13b) again. For TRC CYCL 1.0 MPa and TRC CYCL 2.0 MPa cracks originated at lower stress levels leading to a diminished crack spacing. As observed for the cumulative frequency, the crack patterns of the cyclically preloaded series were nearly complete at the stress level of 2.5 MPa. At all stress levels, the crack spacing of these series was lower compared to TRC REF, leading to the conclusion that more cracks were formed for TRC CYCL 0.5 MPa, TRC CYCL 1.0 Mpa, and TRC CYCL 2.0 MPa.
Other than for TRC REF and TRC CYCL 0.5 MPa, TRC CYCL 1.0 Mpa, and TRC CYCL 2.0 MPa showed cracks already at stress levels lower than 1.0 MPa (Figure 14), as a consequence of the fact that cracks were already formed during the cyclic preloading. This is displayed for all studied parameters. Looking at the average crack width, a discrepancy was observed for stress levels below 2.0 MPa and above 2.0 MPa: at lower stress levels, TRC CYCL 1.0 MPa and TRC CYCL 2.0 MPa had a higher average crack width, while for higher stress levels, wider cracks were measured for TRC REF and TRC CYCL. 0.5 MPa (Figure 14a). The same tendency was seen for the maximum crack width but less pronounced (Figure 14b). Since this maximum crack width was strongly related to the durability requirements, one could state that the impact of repeated loading on durability measurements is little. The lowest total crack width was observed for TRC REF and this at all stress levels. (Figure 14c).

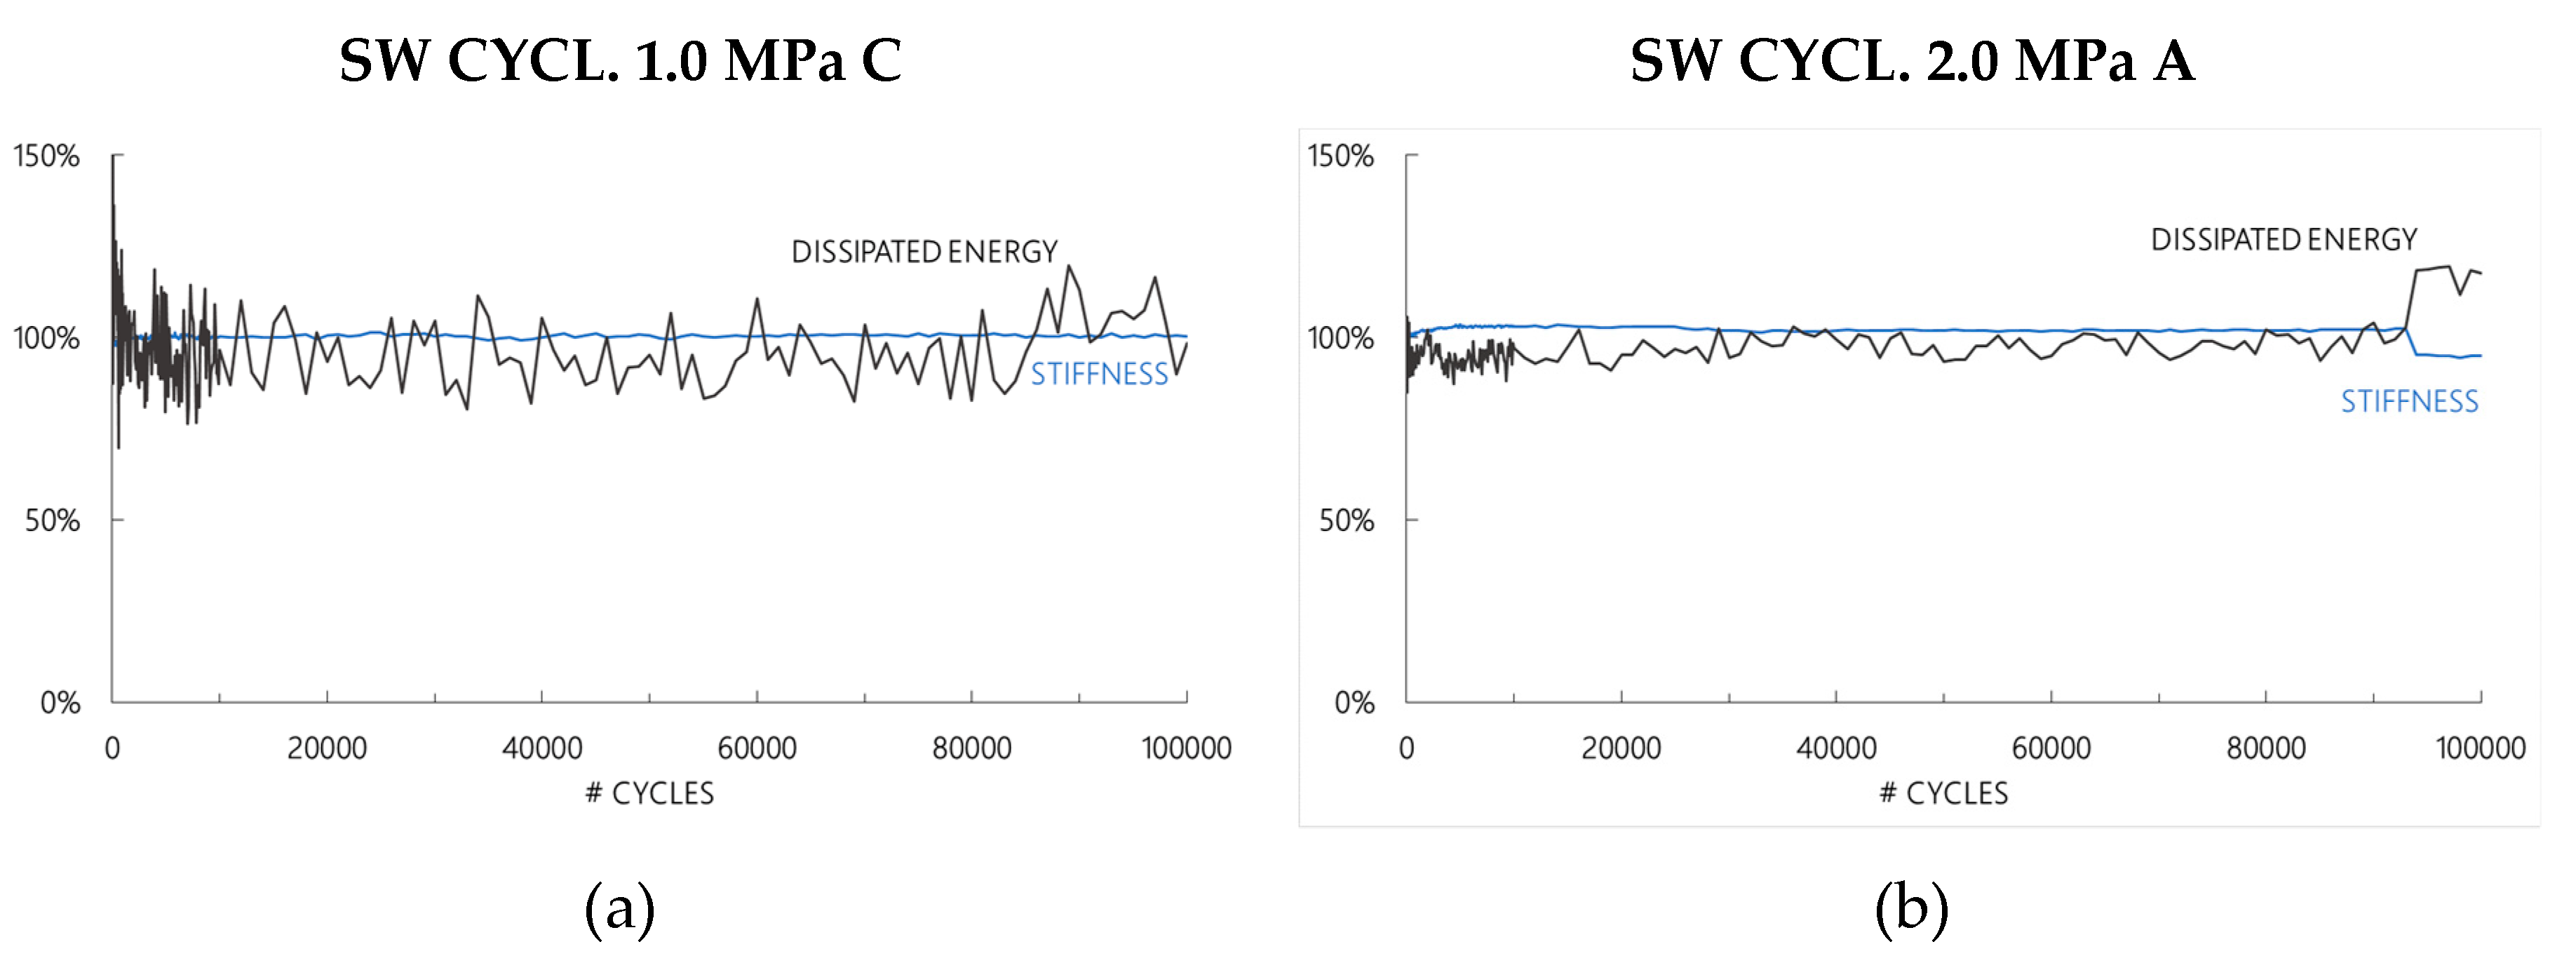
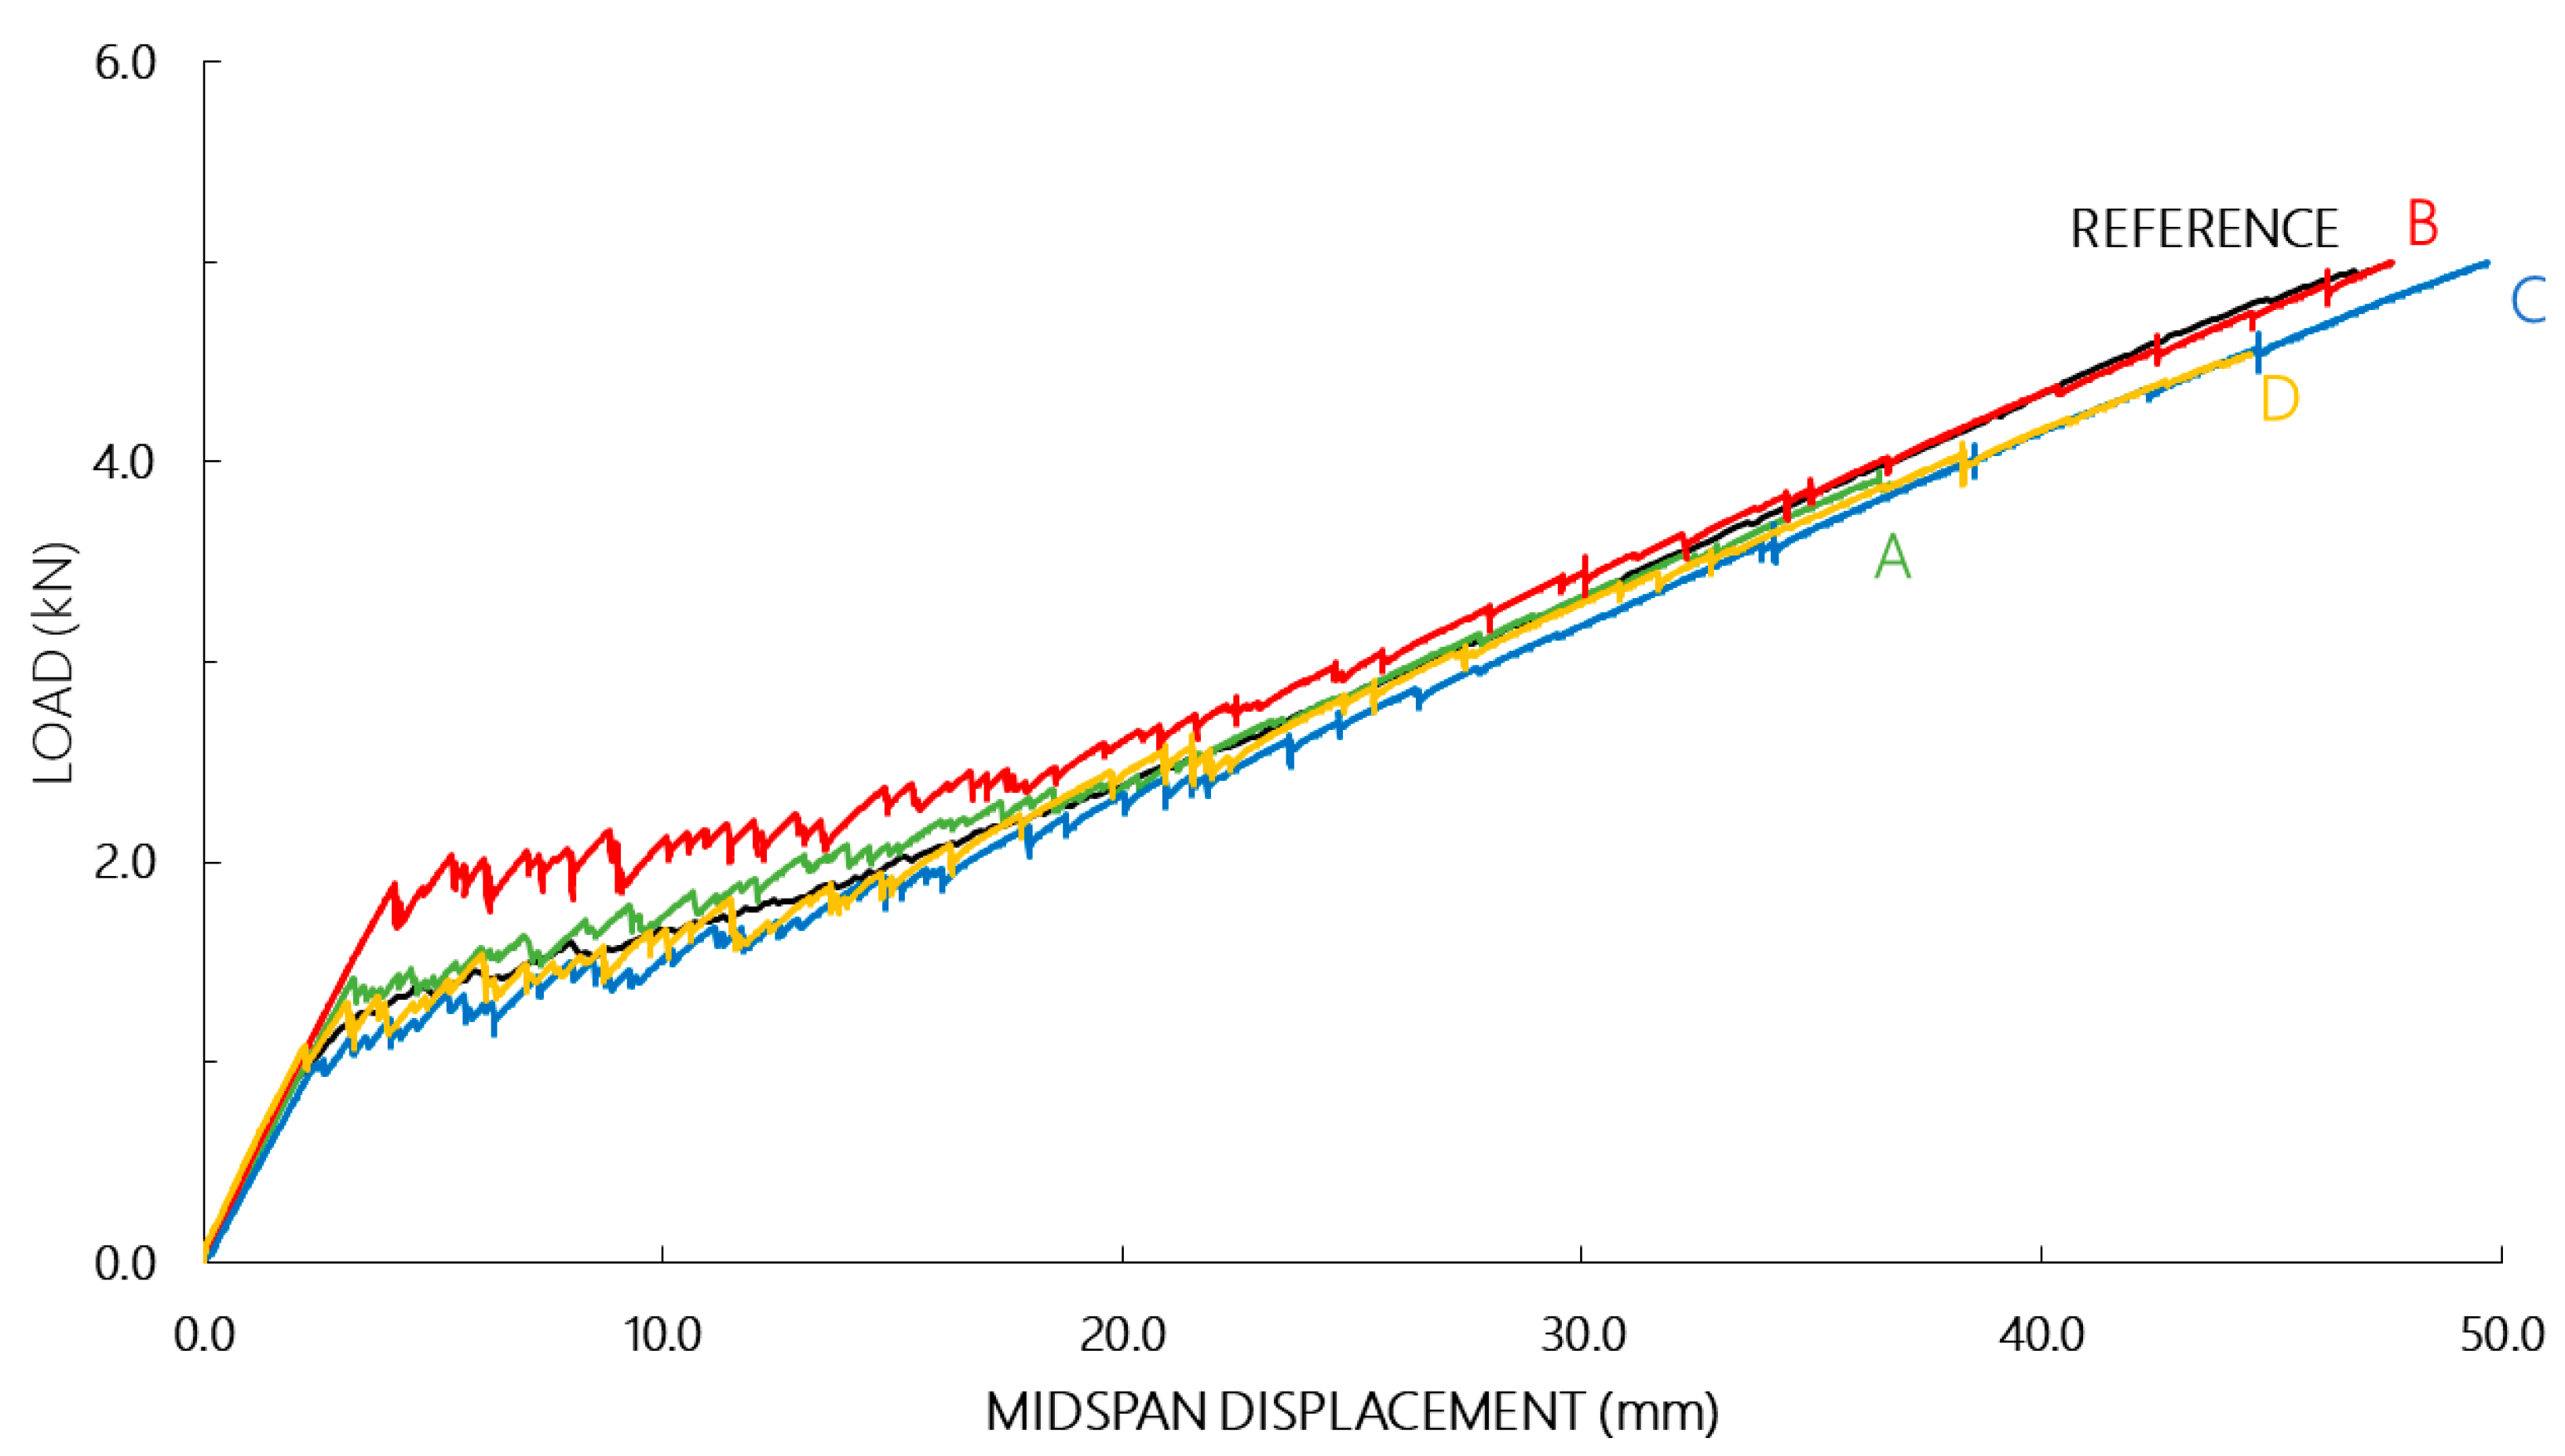
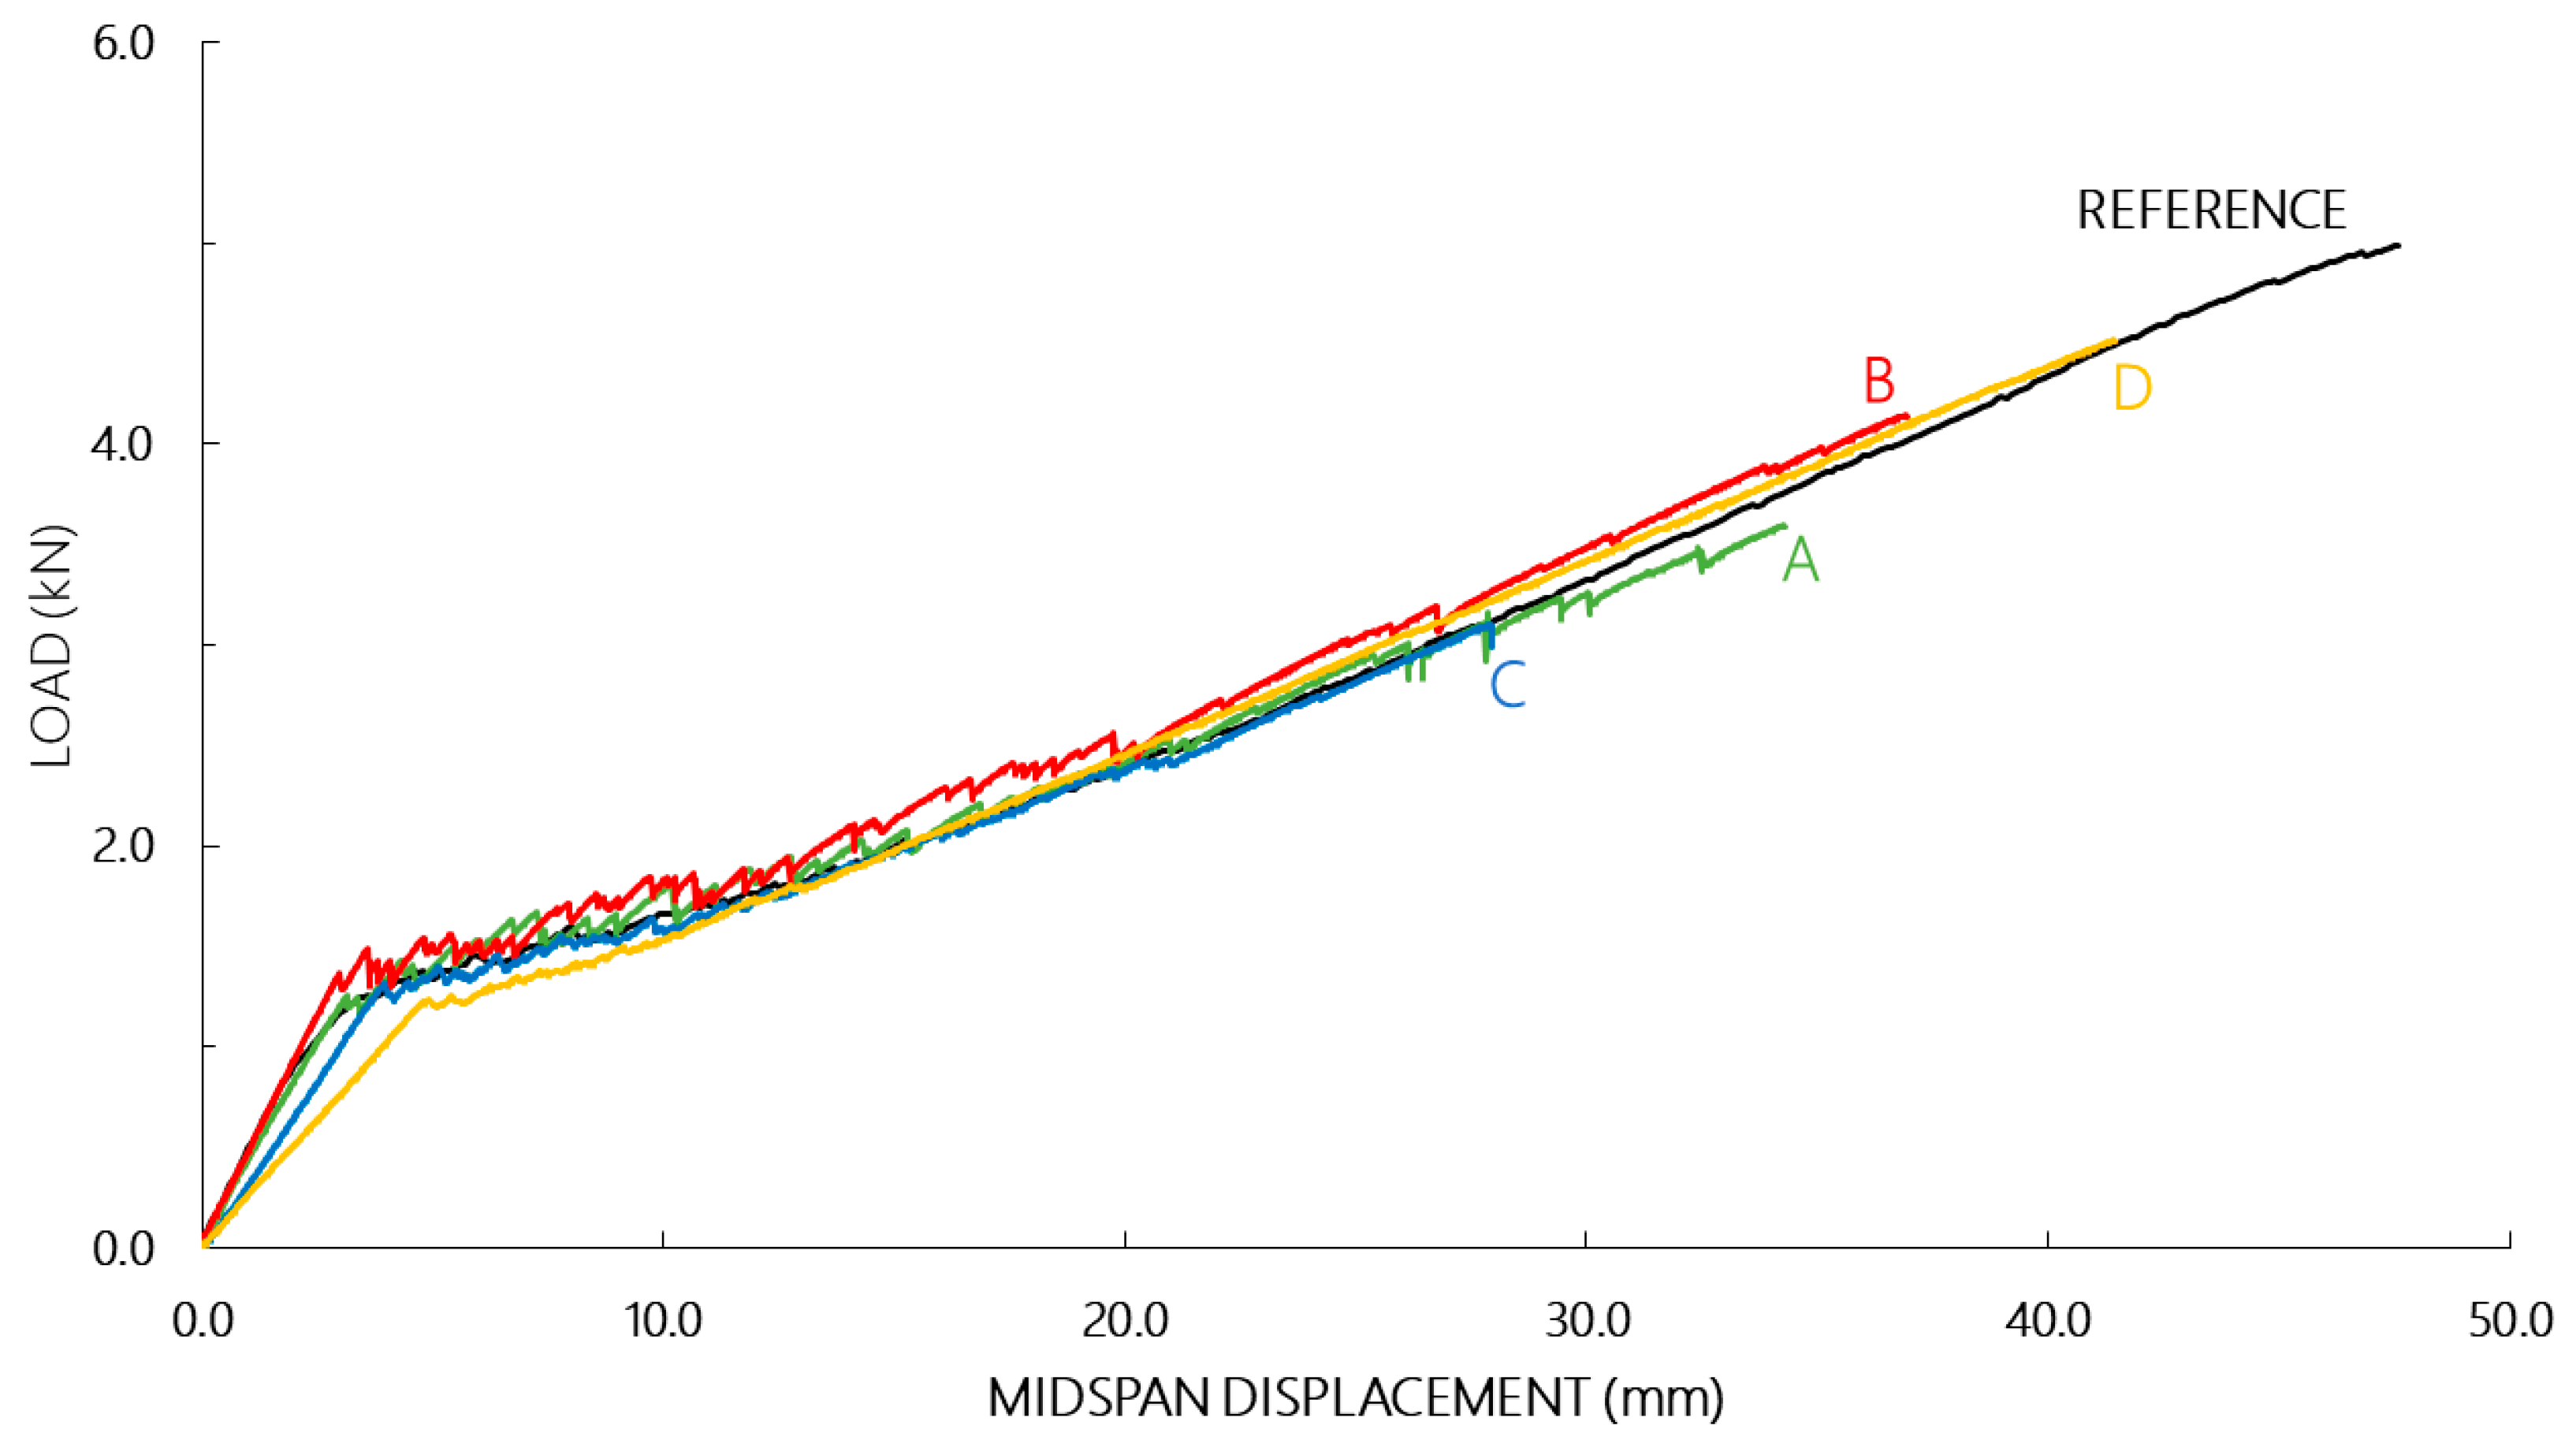
3.2. Investigations on Sandwich Beams

In addition to the fatigue behavior of TRC coupons under tensile loading, the fatigue behavior in bending of sandwich (SW) beams with TRC faces was investigated. In total 13 beams were tested. To determine the virgin, reference behavior of the panels (SW REF), five samples were tested with a quasi-static four-point bending test, as described in Section 2.3.2. The other beams were subjected to a cyclic preloading, divided into two different series analogous to the experiments on the TRC coupons. Since no influence was observed for a cyclic preloading of the coupons up to 0.5 MPa this was excluded from further experiments. The stress levels of 1.0 MPa and 2.0 Mpa, respectively, in the tensile face were converted to equivalent loads for the sandwich beams using a validated numerical model [33], respectively, 0.5 kN and 1.0 kN. These beams will be referred to as SW CYCL 1.0 MPa and SW CYCL 2.0 MPa. Similar to the coupons, the typical hysteresis curve was analyzed by comparing some fatigue parameters. The cycle stiffness and the dissipated energy were calculated similarly as explained in Section 3.1.
The evolution of the stiffness and the dissipated energy show the same trends as for the coupons. The stiffness and the dissipated energy evolved in the opposite direction and directly linked to the formation of cracks. For uncracked specimens, they remained constant (Figure 15a). The occurrence of a crack was accompanied by a drop in stiffness and a jump in dissipated energy, as was seen for sample SW CYCL. 2.0 MPa A at cycle 93.000 in Figure 15b.
Overall, fewer cracks were observed for the sandwich bending tests (Table 9) compared to the coupon uniaxial tensile tests. A possible reason for this was the different anchorage length in the different configurations. When applied in the sandwich beam, the textile was embedded over a longer length in the matrix, leading to a better anchorage. In addition, the presence of the insulating core could have had a beneficial effect, the bond between the EPS-core and the TRC faces restricted the crack widths.
Similar to the TRC coupons, once a crack was formed in the tensile face of the sandwich beam, its width increased during the first subsequent thousand cycles but stabilized gradually afterwards (Figure 16). The occurrence of cracks was the only observed damage mechanism, the core and the face-core interface were not affected. The fatigue behavior of the sandwich beams was dependent on the behavior of the TRC faces.
After the loading–unloading cycles, the residual static behavior was quantified by means of a quasi-static four-point bending test. As for the TRC coupons, the only observed degradation phenomenon was the formation of cracks. For SW CYCL 1.0 MPa no cracks were observed during the cyclic loading and, thus, the residual behavior was very similar to the behavior of SW REF (Figure 17). As can be seen in Table 10 both the stiffness and strength of SW REF and SW CYCL. 1.0 MPa were situated in the same range.
All specimens of SW CYCL 2.0 MPa showed cracks after subjection to the loading cycles (Table 11). However, the occurrence of cracks had a smaller impact on the initial stiffness S1 compared to cracked TRC coupons. The stiffness in the last branch S3 was not affected by the cyclic preloading. The average ultimate capacity was 23% lower for the SW CYCL sandwich beams compared to the SW REF beams (Figure 18).
As shown in Figure 5, a part of the tensile face was monitored using DIC. An analysis of the cracks was performed as for the TRC coupons. However, due to the narrow area of interest of the DIC a limited amount of the cracks was captured, and, thus, only the maximum crack width was looked at. The evolution of the maximum crack width of SW REF and SW CYCL 1.0 MPa was very similar (Figure 19). SW CYCL 2.0 MPa showed larger crack widths for all load levels, which could be attributed to the occurrence of cracks during the cyclic preloading and the inherent debonding between fibers and matrix. This observation did not match the results of the TRC coupons, no increase of the maximum crack width was seen for TRC CYCL. 2.0 MPa. For the moment no clear reasoning could be made regarding this particular discrepancy between TRC coupons and SW beams.

4. Conclusions

This paper investigated the fatigue behavior of TRC and of sandwich panels with faces made of TRC. Uniaxial tests were performed on rectangular TRC coupons, in total 27 specimens were fabricated and tested, divided into four series: one reference series and three series which were cyclically preloaded up to different stress levels (0.5 MPa, 1.0 Mpa, and 2.0 MPa). In addition, 13 sandwich beams were tested by means of a four-point bending test. Three different series were considered: one reference series and two series cyclically preloaded up to the corresponding stress level (1.0 MPa and 2.0 MPa) in the tensile face of the sandwich beam. Afterwards, all specimens (incl. the reference specimens) were loaded up to failure. All tests, both cyclic and static, were monitored with DIC to map the cracking patterns and to measure the actual crack widths.
A large similarity was observed between the experiments on the material level and the experiments on the element level. One could conclude that the fatigue behavior of the sandwich panels was strongly dependent on the fatigue behavior of the TRC faces. No degradation was observed in the core, nor in the interface between core and faces. The sandwich beams were less sensitive to the formation of cracks and degradation of the mechanical behavior compared to the TRC coupons. Possible reasons could be found in the different anchorage length of the textiles and in the presence of EPS-core; the bond between EPS and TRC restricted the crack widths.
Fatigue parameters as cycle modulus and dissipative energy were investigated. All of them were related to the occurrence of cracks, which was the only observed damage mechanism: if no cracks were formed during the loading–unloading cycles, the parameters remained constant. In the presence of cracks, a decrease of the modulus and an increase of the dissipative energy and residual accumulative strains was observed. The modulus/stiffness and dissipative energy evolved in the opposite direction. Once a crack originated during the cyclic loading, its width grew during the first subsequent cycles but evolved asymptotically. The formation of cracks was governed by the maximum cycle stress. The higher the latter, the larger the probability of the occurrence of cracks.
The residual capacity of the cyclically preloaded specimens was compared to a virgin reference behavior, obtained with identical experimental set-ups. Samples which remained uncracked after being subjected to the repeated loading conditions had a residual behavior equal to the reference behavior. The presence of cracks was reflected in the residual behavior by a lower initial modulus/stiffness. After being fully saturated with cracks, the remaining modulus is only dependent on the modulus of the fibers. This modulus remained unaffected leading to the conclusion that the fibers were not degraded by the cyclic preloading. The ultimate capacity was degraded little after subjection to repeated loading conditions. No clear relation was observed between the occurrence and number of cracks and the loss of ultimate capacity.

Author Contributions

Conceptualization, M.D.M, T.T. and O.R.; methodology, M.D.M., J.W. and T.T.; formal analysis, M.D.M.; investigation, M.D.M.; writing—original draft preparation, M.D.M.; writing—review and editing, T.T., J.W., J.V.; M.E.K.; P.K.; visualization, J.V.; supervision, T.T., J.W. and O.R.; project administration, M.D.M. and T.T.; funding acquisition, M.D.M, T.T. and O.R.

Funding

This research was funded by Agentschap voor Innovatie en Ondernemen (VLAIO) and CRH Structural Cngrant number 150251.

Acknowledgments

The authors gratefully acknowledge Agentschap voor Innovatie en Ondernemen (VLAIO) and CRH Structural Concrete Belgium nv for funding the research of the first author through a Baekeland mandate.

Conflicts of Interest

The authors declare no conflict of interest.

References

  1. Davies, J.M. Lighweight Sandwich Construction; John Wiley and Sons Ltd.: Hoboken, NJ, USA, 2001. [Google Scholar]
  2. Larbi, A.S.; Contamine, R.; Ferrier, E.; Hamelin, P. Shear strengthening of RC beams with textile reinforced concrete (TRC) plate. Constr. Build. Mater. 2010, 24, 1928–1936. [Google Scholar] [CrossRef]
  3. Verbruggen, S.; Tysmans, T.; Wastiels, J. TRC or CFRP strengthening for reinforced concrete beams: An experimental study of the cracking behaviour. Eng. Struct. 2014, 77, 49–56. [Google Scholar] [CrossRef]
  4. Papanicolaou, C.G.; Triantafillou, T.C.; Papathanasiou, M.; Karlos, K. Textile reinforced mortar (TRM) versus FRP as strengthening material of URM walls: Out-of-plane cyclic loading. Mater. Struct. Constr. 2008, 41, 143–157. [Google Scholar] [CrossRef]
  5. Parisi, F.; Lignola, G.P.; Augenti, N.; Prota, A.; Manfredi, G. Rocking response assessment of in-plane laterally-loaded masonry walls with openings. Eng. Struct. 2013, 56, 1234–1248. [Google Scholar] [CrossRef]
  6. Hegger, J.; Voss, S. Investigations on the bearing behaviour and application potential of textile reinforced concrete. Eng. Struct. 2008, 30, 2050–2056. [Google Scholar] [CrossRef]
  7. Nguyen, V.A.; Jesse, F.; Curbach, M. Experiments about load bearing behaviour of lightweight sandwich beams using textile reinforced and expanded polystyrene concrete. Struct. Concr. 2015, 17, 760–767. [Google Scholar] [CrossRef]
  8. Colombo, I.G.; Colombo, M.; Prisco, M. Bending behaviour of Textile Reinforced Concrete sandwich beams. Constr. Build. Mater. 2015, 95, 675–685. [Google Scholar] [CrossRef]
  9. Portal, N.W.; Flansbjer, M.; Zandi, K.; Wlasak, L.; Malaga, K. Bending behaviour of novel Textile Reinforced Concrete-foamed concrete (TRC-FC) sandwich elements. Compos. Struct. 2017, 177, 104–118. [Google Scholar] [CrossRef]
  10. Cuypers, H.; Wastiels, J. Analysis and verification of the performance of sandwich panels with textile reinforced concrete faces. J. Sandw. Struct. Mater. 2011, 3, 589–603. [Google Scholar] [CrossRef]
  11. Junes, A.; Larbi, A.S. An indirect non-linear approach for the analysis of sandwich panels with TRC facings. Constr. Build. Mater. 2016, 112, 406–415. [Google Scholar] [CrossRef]
  12. Shams, A.; Hegger, J.; Horstmann, M. An analytical model for sandwich panels made of textile-reinforced concrete. Constr. Build. Mater. 2014, 64, 451–459. [Google Scholar] [CrossRef]
  13. Finzel, J.; Häussler-Combe, U. Textile reinforced concrete sandwich panels: Bending tests and numerical analyses. In Proceedings of the Euro-C 2010, Schladming, Austria, 15–18 March 2010; pp. 789–795. [Google Scholar]
  14. Miccoli, L.; Fontana, P. Numerical modelling of UHPC and TRC sandwich elements for building envelopes Façade element components. Int. Assoc. Bridge Struct. Eng. 2015, 105, 1–9. [Google Scholar]
  15. Djamai, Z.I.; Bahrar, M.; Salvatore, F.; Larbi, A.S.; El Mankibi, M. Textile reinforced concrete multiscale mechanical modelling: Application to TRC sandwich panels. Finite Elem. Anal. Des. 2017, 135, 22–35. [Google Scholar] [CrossRef]
  16. Contamine, R.; Larbi, A.S.; Hamelin, P. Contribution to direct tensile testing of textile reinforced concrete (TRC) composites. Mater. Sci. Eng. A 2011, 528, 8589–8598. [Google Scholar] [CrossRef]
  17. De Andrade Silva, F.; Butler, M.; Mechtcherine, V.; Zhu, D.; Mobasher, B. Strain rate effect on the tensile behaviour of textile-reinforced concrete under static and dynamic loading. Mater. Sci. Eng. A 2011, 528, 1727–1734. [Google Scholar] [CrossRef]
  18. Barhum, R.; Mechtcherine, V. Effect of short, dispersed glass and carbon fibres on the behaviour of textile-reinforced concrete under tensile loading. Eng. Fract. Mech. 2012, 92, 56–71. [Google Scholar] [CrossRef]
  19. Hartig, J.; Jesse, F.; Schicktanz, K.; Häußler-Combe, U. Influence of experimental setups on the apparent uniaxial tensile load-bearing capacity of Textile Reinforced Concrete specimens. Mater. Struct. Constr. 2012, 45, 433–446. [Google Scholar] [CrossRef]
  20. Hegger, J.; Will, N.; Curbach, M.; Jesse, F. Tragverhalten von textilbewehrtem Beton: Verbund, Ribbildung und Tragverhalten. Beton-Und Stahlbetonbau 2004, 99, 452–455. [Google Scholar] [CrossRef]
  21. El Kadi, M.; Tysmans, T.; Verbruggen, S.; Vervloet, J.; de Munck, M.; Wastiels, J.; van Hemelrijck, D. A layered-wise, composite modelling approach for fibre textile reinforced cementitious composites. Cem. Concr. Compos. 2018, 94, 107–115. [Google Scholar] [CrossRef]
  22. Bertolesi, E.; Carozzi, F.G.; Milani, G.; Poggi, C. Numerical modeling of Fabric Reinforce Cementitious Matrix composites (FRCM) in tension. Constr. Build. Mater. 2014, 70, 531–548. [Google Scholar] [CrossRef]
  23. Promis, G.; Gabor, A.; Hamelin, P. Analytical modeling of the bending behavior of textile reinforced mineral matrix composite beams. Compos. Struct. 2011, 93, 792–801. [Google Scholar] [CrossRef]
  24. Tysmans, T.; Wozniak, M.; Remy, O.; Vantomme, J. Finite element modelling of the biaxial behaviour of high-performance fi bre-reinforced cement composites (HPFRCC) using Concrete Damaged Plasticity. Finite Elem. Anal. Des. 2015, 100, 47–53. [Google Scholar] [CrossRef]
  25. Cuypers, H. Analysis and Design of Sandwich Panels with Brittle Matrix Composite Faces for Building Applications. Ph.D. Thesis, Vrije Universiteit Brussel, Brussels, Belgium, 2002. [Google Scholar]
  26. Mesticou, Z.; Bui, L.; Junes, A.; Larbi, A.S. Experimental investigation of tensile fatigue behaviour of Textile-Reinforced Concrete (TRC): Effect of fatigue load and strain rate. Compos. Struct. 2017, 160, 1136–1146. [Google Scholar] [CrossRef]
  27. Remy, O. Lightweight Stay Formwork: A Concept for Future Building Applications. Ph.D. Thesis, Vrije Universiteit Brussel, Brussels, Belgium, 2012. [Google Scholar]
  28. Cuypers, H.; Gu, J.; Croes, K.; Dumortier, S.; Wastiels, J. Evaluation of fatigue and durability properties of E-glass fibre reinforced phosphate cementitious composite. Int. Symp. Brittle Matrix Compos. 2000, 6, 127–136. [Google Scholar]
  29. Belgian Bureau for Standardisation (NBN). NBN EN 196-1:2016 Methods of Testing Cement-Part 1: Determination of Strength; Belgian Bureau for Standardisation (NBN): Brussels, Belgium, 2016. [Google Scholar]
  30. Knauf. Gitex, Glasvezelwapening Technische Fiche. 2018. Available online: http://www.knauf.be/nl/product/gitex-glasvezelwapening (accessed on 18 January 2018).
  31. Kemisol. Technische Documentatie EPS. 2004. Available online: http://www.kemisol.be/ (accessed on 15 March 2018).
  32. Sutton, M.A.; Orteu, J.J.; Schreier, H. Image Correlation for Shape, Motion and Deformation Measurements; Springer: New York, NY, USA, 2009. [Google Scholar]
  33. De Munck, M.; Vervloet, J.; El Kadi, M.; Verbruggen, S.; Wastiels, J.; Remy, O.; Tysmans, T. Modelling and experimental verification of flexural behaviour of textile reinforced cementitious composite sandwich renovation panels. In Proceedings of the 12th fib International PhD Symposium in Civil Engineering, Prague, Czech Republic, 29–31 August 2018; pp. 179–186. [Google Scholar]
Figure 1. Characteristic tensile behavior of textile reinforced cementitious composite (TRC).
Applsci 09 01293 g001
Figure 2. An alkali-resistant (AR) glass textile with a mesh size of 6 mm used.
Applsci 09 01293 g002
Figure 3. Stacking sequence TRC coupons.
Applsci 09 01293 g003
Figure 4. A hand lay-up technique was used for the preparation of the specimens: (a) TRC coupons and (b) sandwich beams with TRC faces.
Applsci 09 01293 g004
Figure 5. Uniaxial test set-up and dimensions.
Applsci 09 01293 g005
Figure 6. Four-point bending test set-up.
Applsci 09 01293 g006
Figure 7. Reference behavior of TRC coupons.
Applsci 09 01293 g007
Figure 8. The evolution of the modulus and the dissipated energy of representative TRC coupons during the loading–unloading cycles: (a) an uncracked sample and (b) a cracked sample.
Applsci 09 01293 g008
Figure 9. Evolution of the crack width of some representative cracks formed during cyclic loading of TRC coupons.
Applsci 09 01293 g009
Figure 10. Residual behavior of TRC CYCL. 0.5 MPa.
Applsci 09 01293 g010
Figure 11. Residual behavior of TRC CYCL. 1.0 MPa.
Applsci 09 01293 g011
Figure 12. Residual behavior of TRC CYCL. 2.0 MPa.
Applsci 09 01293 g012
Figure 13. The number of cracks present in the different samples was used to compare: (a) the average cumulative frequency and (b) the average crack spacing.
Applsci 09 01293 g013
Figure 14. The cracking patterns of the different series were compared using the: (a) the average crack width, (b) the maximum crack width and (c) the total crack width.
Applsci 09 01293 g014
Figure 15. The evolution of the stiffness and the dissipated energy of sandwich beams during the loading–unloading cycles: (a) an uncracked sample and (b) a cracked sample.
Applsci 09 01293 g015
Figure 16. Evolution of the crack width of some representative cracks formed during cyclic loading of sandwich beams.
Applsci 09 01293 g016
Figure 17. Residual behavior of SW CYCL. 1.0 MPa.
Applsci 09 01293 g017
Figure 18. Residual behavior of SW CYCL. 2.0 MPa.
Applsci 09 01293 g018
Figure 19. The maximum crack width observed in the sandwich beams per series.
Applsci 09 01293 g019
Table 1. Mechanical properties of the used mortar.
fct,f
MPa
fcc
MPa
Average6.3523.17
Standard Deviation0.451.59
Table 2. Properties expanded polystyrene (EPS) 200 [31].
Density
kg/m3
E-Modulus
MPa
Bending Strength
kPa
2010250
Table 3. Settings digital image correlation (DIC) analysis.
TRC CouponsSandwich Beams
subset21 pxs21 pxs
step7 pxs7 pxs
filter size1111
area of interest250 × 45 mm250 × 190 mm
Table 4. Camera features.
Type of CameraCCD
lenses size8 mm
resolution2546 × 2048 pxs
Table 5. Number of cracks formed during cyclic preloading of the TRC coupons.
SpecimenTRC CYCL
0.5 MPa
TRC CYCL
1.0 MPa
TRC CYCL
2.0 MPa
A0227
B0812
C0010
D000
E0516
F011
Table 6. Quantitative comparison of some distinctive parameters of the static tensile stress–strain curve: the average reference versus the specimens cyclically preloaded to 0.5 MPa.
SpecimenE1
GPa
E3
GPa
σcrack
MPa
σultimate
MPa
# Cracks
After Cyclic PreloadingAt Failure
REFavg11.380.411.657.49-13
st dev1.940.0180.540.52-2
CYCL.
0.5 MPa
A8.990.452.196.44014
B15.320.491.857.22011
C11.740.371.496.43019
D14.600.431.387.40019
E9.220.481.967.07014
F12.640.432.307.32017
avg12.080.441.866.98-16
st dev2.420.0380.340.40-3
Table 7. Quantitative comparison of some distinctive parameters of the static tensile stress–strain curve: the average reference versus the specimens cyclically preloaded to 1.0 MPa.
SpecimenE1
GPa
E3
GPa
σcrack
MPa
σultimate
MPa
# Cracks
After Cyclic PreloadingAt Failure
REFavg11.380.411.657.49-13
st dev1.940.0180.540.52-2
CYCL.
1.0 MPa
A0.480.48-5.552224
B0.920.492.415.92814
C8.370.391.535.49022
D12.270.451.637.20014
E0.910.411.708.25529
F2.590.411.207.41128
avg-0.441.696.64-22
st dev-0.0370.401.04-6
Table 8. Quantitative comparison of some distinctive parameters of the static tensile stress–strain curve: the average reference versus the specimens cyclically preloaded to 2.0 MPa.
SpecimenE1
GPa
E3
GPa
σcrack
MPa
σultimate
MPa
# Cracks
After Cyclic PreloadingAt Failure
REFavg11.380.411.657.49-13
st dev1.940.0180.540.52-2
CYCL.
2.0 MPa
A0.840.422.306.74722
B0.650.482.136.481219
C0.810.432.415.651020
D13.060.472.665.88010
E0.480.422.426.681624
F4.760.482.247.13111
avg-0.452.366.43-18
st dev-0.0290.170.51-5
Table 9. Number of cracks formed during cyclic preloading of the sandwich beams.
SpecimenSW CYCL
1.0 MPa
SW CYCL
2.0 MPa
A02
B01
C02
D06
Table 10. Quantitive comparison of some distinctive parameters of the static load-displacement curve: the average reference versus the beams cyclically preloaded to 1.0 MPa.
SpecimenS1
kN/mm
S3
kN/mm
Pcrack
kN
Pultimate
kN
# Cracks
After CyclicPreloadingAt Failure
REFavg0.4510.0981.124.99-17
st dev0.0090.0020.270.45-4
SW CYCL.
1.0 MPa
A0.4370.0911.423.95012
B0.4740.0901.895.14013
C0.4180.0910.985.35013
D0.4880.0901.044.62013
avg0.4540.0901.344.76-13
st dev0.0280.0000.360.54-0
Table 11. Quantitive comparison of some distinctive parameters of the static load-displacement curve: the average reference versus the beams cyclically preloaded to 2.0 MPa.
SpecimenS1
kN/mm
S3
kN/mm
Pcrack
kN
Pultimate
kN
# Cracks
After CyclicPreloadingAt Failure
REFavg0.4510.0981.124.99-17
st dev0.0090.0020.270.45-4
SW CYCL.
2.0 MPa
A0.4120.0821.253.6029
B0.4550.0971.364.15110
C0.3360.0861.323.11215
D0.2540.0961.224.52624
avg-0.0901.293.84-15
st dev-0.0060.0550.54-6

