A Resource-Based View of Competitiveness in the Wind Energy Sector: The Case of Gran Canaria and Tenerife


Abstract
:1. Introduction
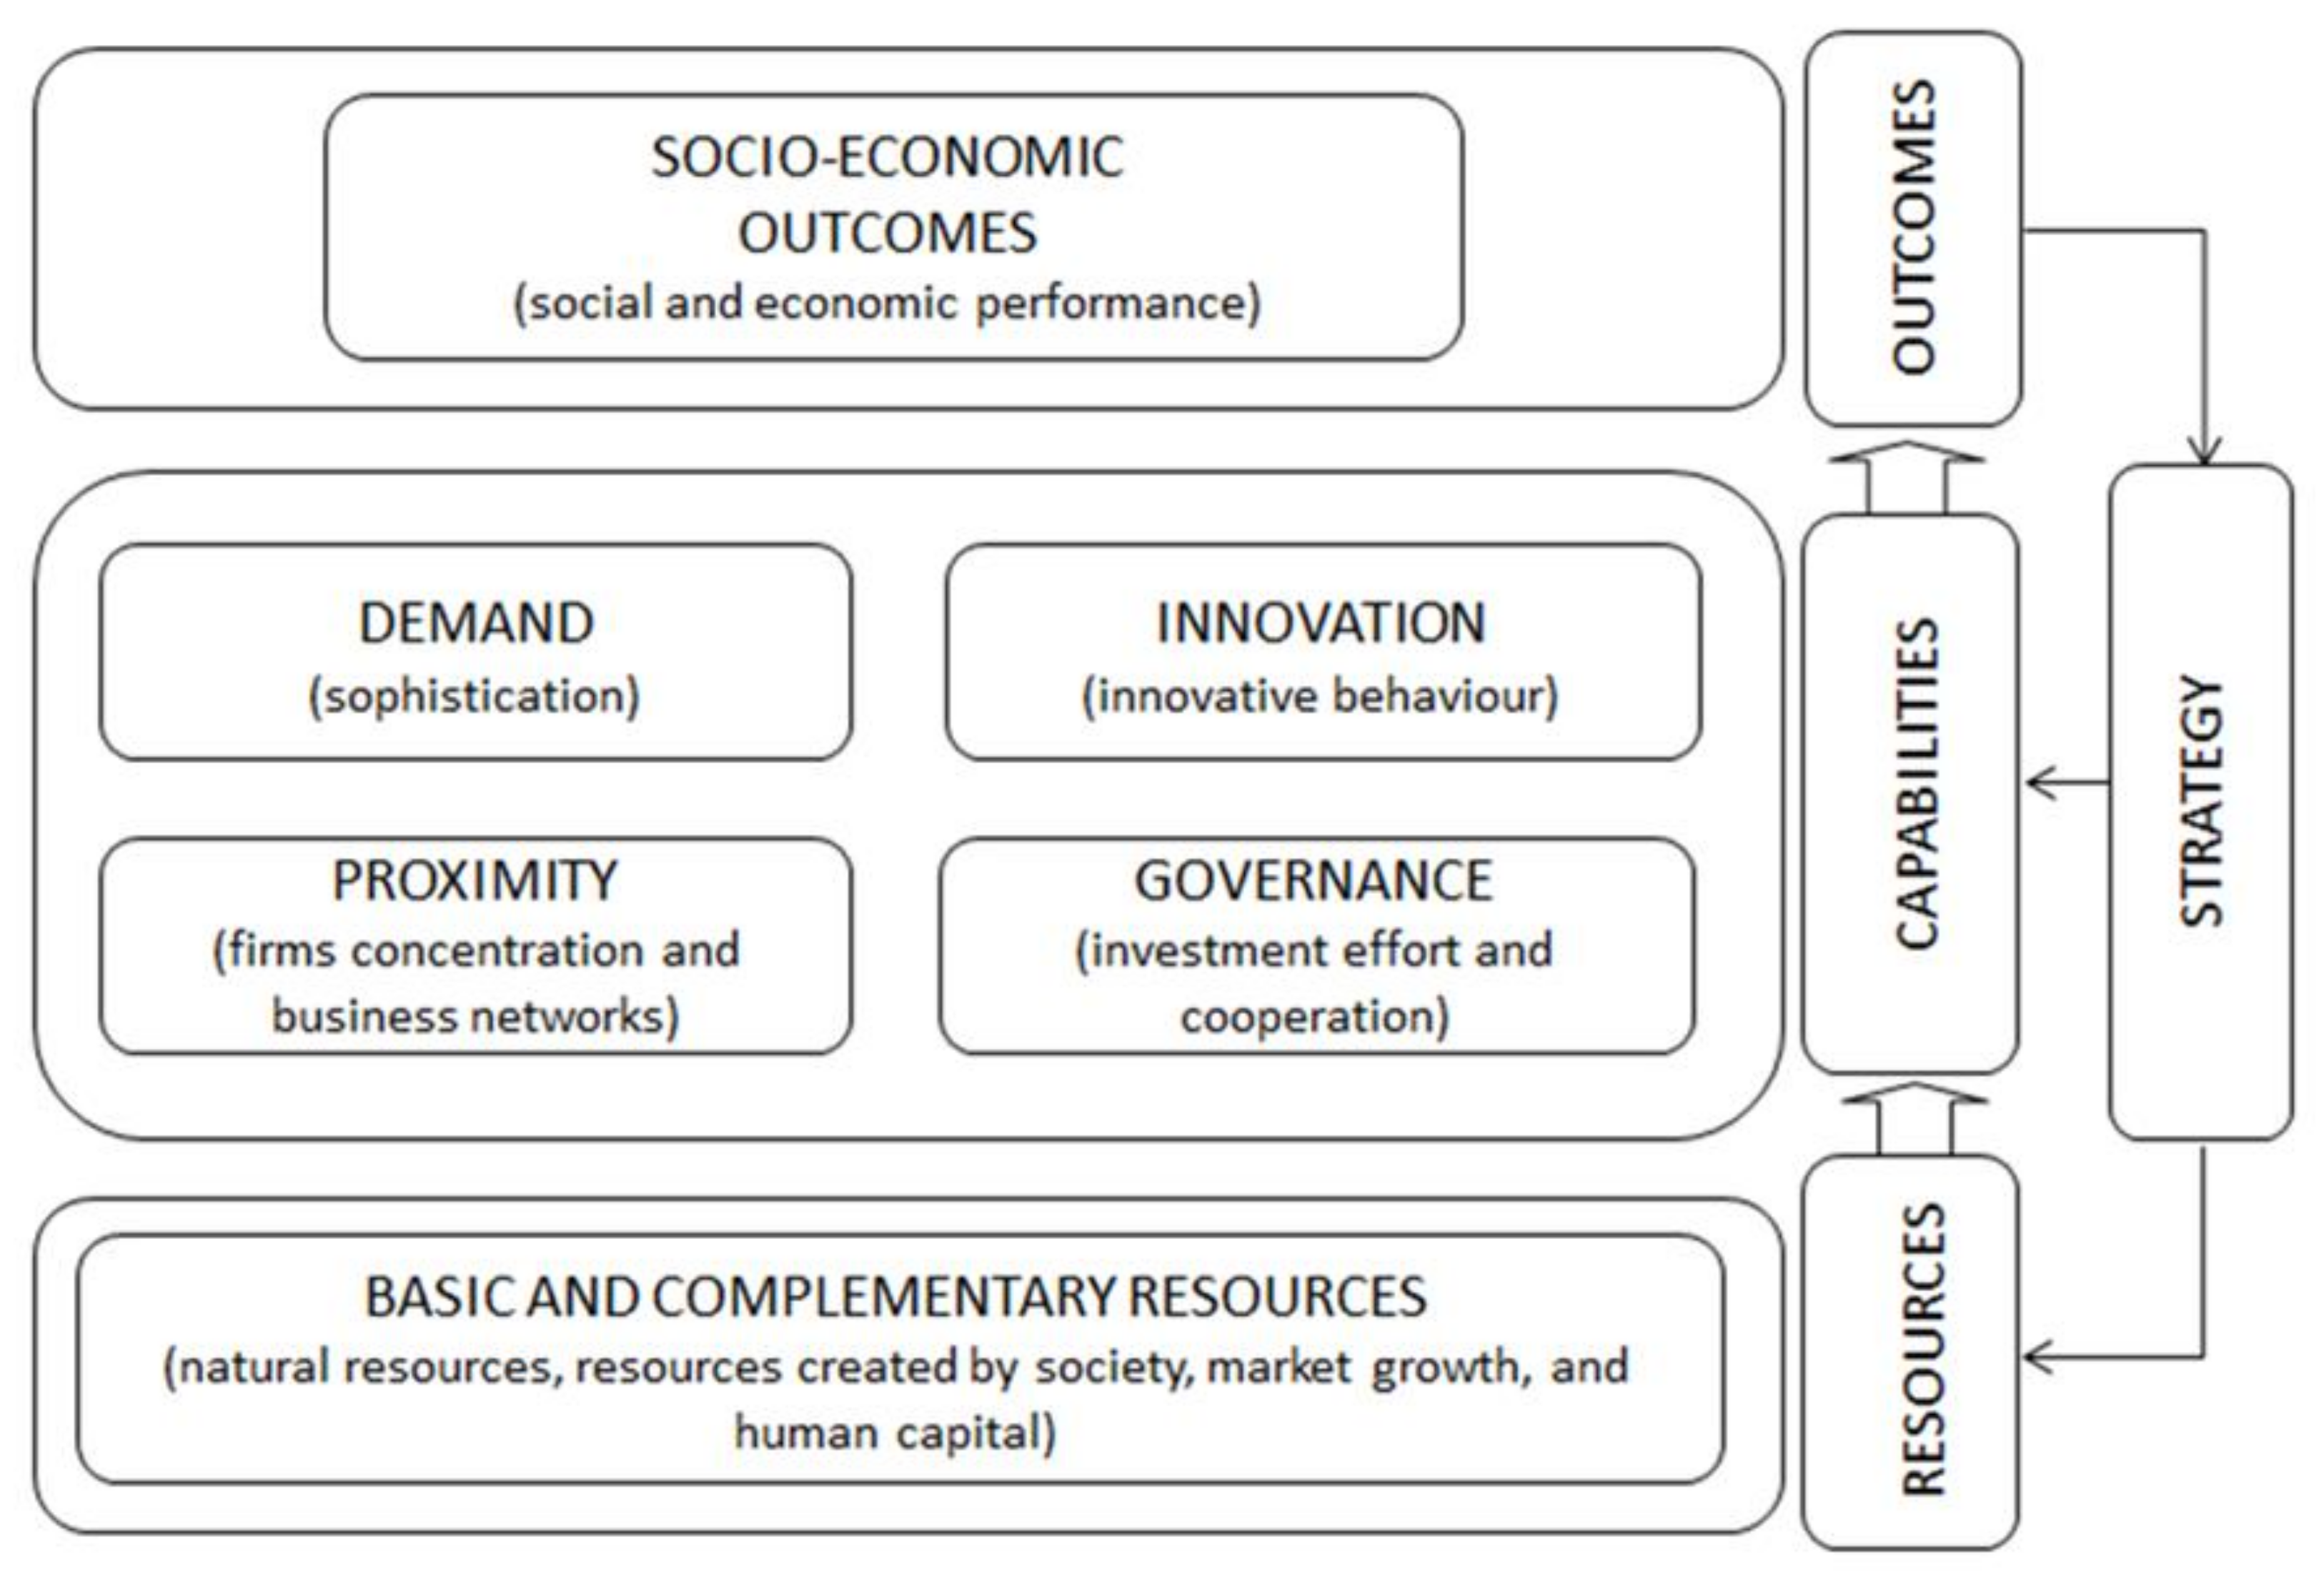
2. Conceptual Framework
3. Proposed Model of Territory Competitiveness in Wind Energy and Research Methodology
3.1. Research Context
3.2. Data and Variables
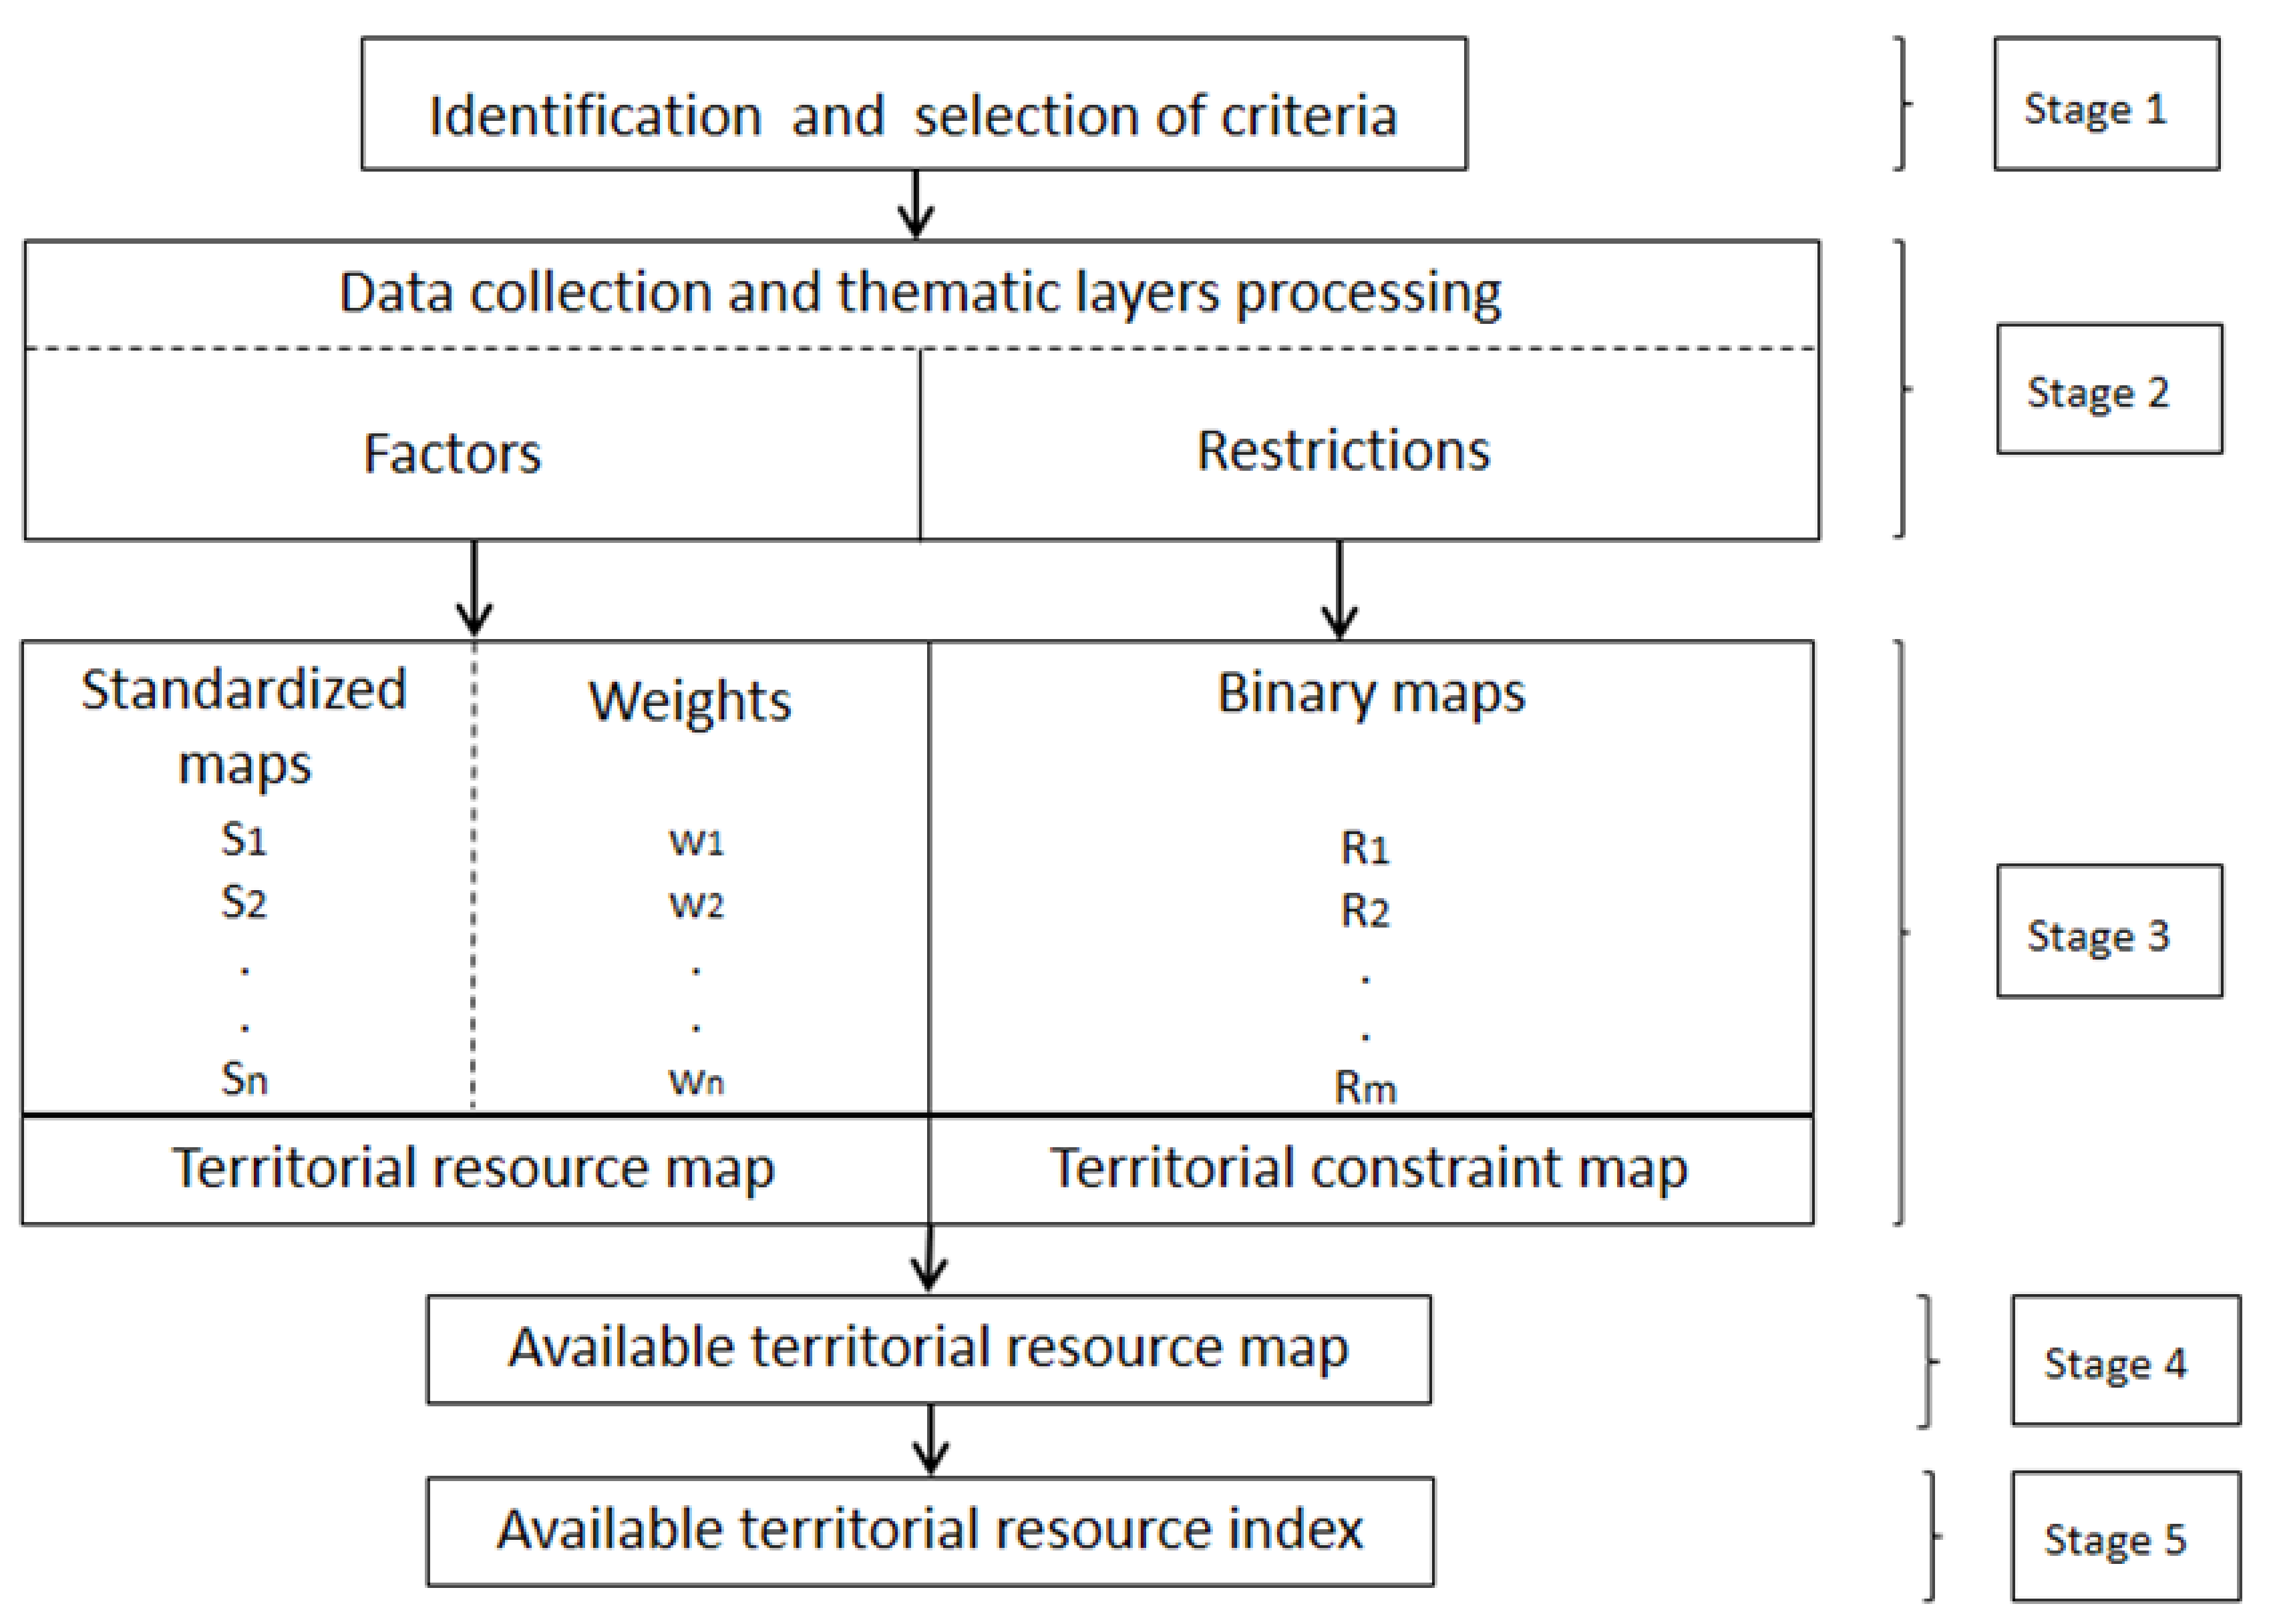
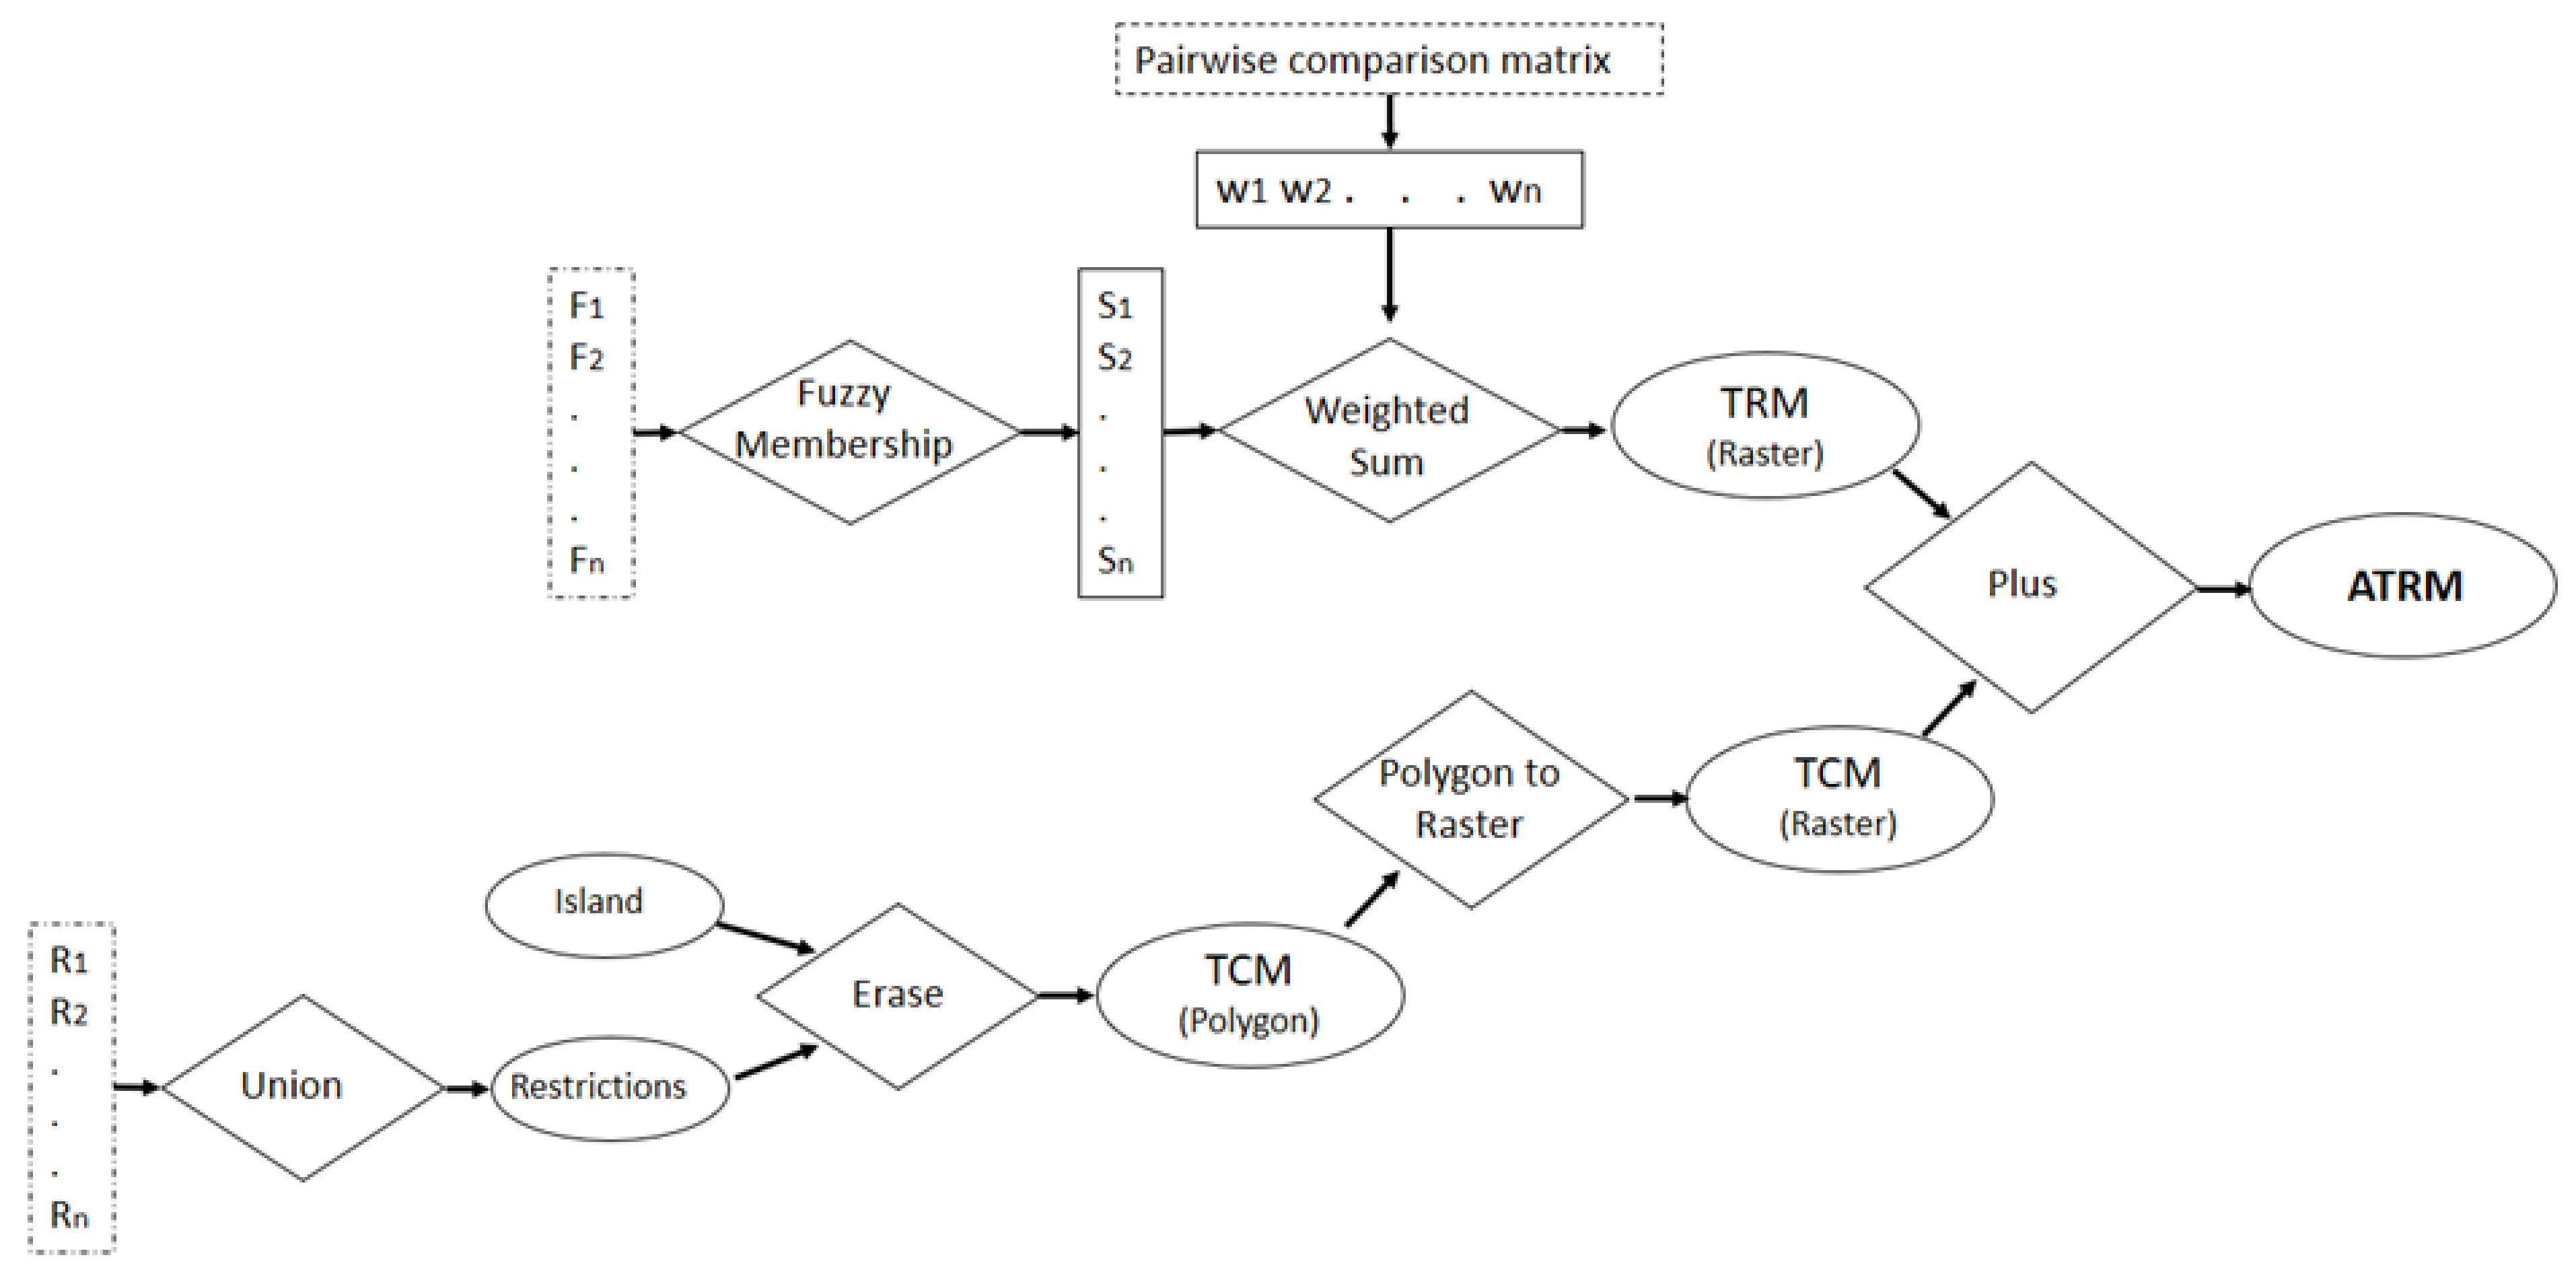
3.2.1. Basic Resources
3.2.2. Complementary Resources
3.2.3. Capabilities
Demand
Innovation
Proximity
Governance
3.2.4. Socio-Economic Outcomes
4. Results
5. Discussion and Conclusions
Author Contributions
Funding
Conflicts of Interest
Appendix A. Sources of Information and Raw Values
| Variables | Indicators | Sources |
| Basic resources | ||
| Available territorial resource (ATR) | The available territorial resource index |
|
| Complementary resources | ||
| Market growth | Annual growth of electrical energy production (%) from 2000 to 2011 | Energy data (Government of the Canary Islands) |
| Human capital1 | University students of engineering degrees associated with wind energy (%) from 2005 to 2009 | Annual reports of the universities (ULL and ULPGC) |
| Human capital2 | Workers in wind energy companies in 2011 |
|
| Capabilities | ||
| Demand | ||
| Sophisticated demand1 | The ratio between the amount of electrical energy produced by renewables sources and the total amount of electrical energy from 2000 to 2011 | Energy data (Government of the Canary Islands) |
| Sophisticated demand2 | High school university graduates (%) from 2001 to 2007 |
|
| Sophisticated demand3 | Homes that separate their rubbish (%) from 2001 to 2007 | Canary Statistics Institute |
| Innovation | ||
| Innovative behaviour1 | Patents for the sector from 2001 to 2009 | Spanish Agency of Patents Trademarks |
| Innovative behaviour2 | Final degree works associated with wind energy from 2003 to 2010 | Annual reports of the universities (ULL and ULPGC) |
| Innovative behaviour3 | Publications in scientific journals associated with wind energy from 2003 to 2009 |
|
| Proximity | ||
| Firms’ concentration | Location index |
|
| Business networks | Network effect | Questionnaire |
| Governance | ||
| Investment effort | Public investment planned in each island in comparison with the whole for the Canary Islands (%) from 2006 to 2015 | Energy Plan of the Canary Islands 2006–2015 |
| Cooperation1 | Coordination between public institutions and wind energy sector firms (scale 1–5) | Questionnaire |
| Cooperation2 | Effectiveness of public institutions in the management of the wind energy sector (scale 1–5) | Questionnaire |
| Cooperation3 | Promotion of the sector by public institutions (scale 1–5) | Questionnaire |
| Outcomes | ||
| Productivity1 | Equivalent hours (kWh/kW) in 2008 | Energy data (Government of the Canary Islands) |
| Productivity2 | Tonnes of oil equivalent (toe) saved in 2008 | Energy data (Government of the Canary Islands) |
| Productivity3 | Wind energy produced with respect to total energy in 2008 | Energy data (Government of the Canary Islands) |
| Social outcomes1 | Reduction of CO2 emissions in 2008 | Energy data (Government of the Canary Islands) |
| Social outcomes2 | Company survival rate | Questionnaire |
| Industrial penetration1 | Wind energy firms (%) |
|
| Industrial penetration2 | Wind power installed per number of inhabitants (W/inhabitant) in 2014 | Energy Plan of the Canary Islands 2006–2015 |
References
- Calero, R.; Carta, J.A. Action plan for wind energy development in the Canary Islands. Energy Policy 2004, 32, 1185–1197. [Google Scholar] [CrossRef]
- Chen, F.; Duic, N.; Alves, L.M.; Carvalho, M.G. Renewislands—Renewable energy solutions for islands. Renew. Sustain. Energy Rev. 2007, 11, 1888–1902. [Google Scholar] [CrossRef]
- Del Río, P.; Burguillo, M. An empirical analysis of the impact of renewable energy deployment on local sustainability. Renew. Sustain. Energy Rev. 2009, 13, 1314–1325. [Google Scholar] [CrossRef]
- Lenzen, M. Sustainable island businesses: A case study of Norfolk Island. J. Clean. Prod. 2008, 16, 2018–2035. [Google Scholar] [CrossRef]
- Chua, K.J.; Yang, W.M.; Er, S.S.; Ho, C.A. Sustainable energy systems for a remote island community. Appl. Energy 2014, 113, 1752–1763. [Google Scholar] [CrossRef]
- Canary Islands Government. Anuario energético de Canarias 2014. Consejería de Economía, Industria, Comercio y Conocimiento. Gobierno de Canarias. Canarias, Spain. 2016. Available online: http://www.gobiernodecanarias.org/ceic/energia/temas/hidrocarburos/ (accessed on 26 December 2017).
- Data from EurObserv’ER. Year 2015. Available online: http://www.eurobserv-er.org (accessed on 15 January 2017).
- Armstrong, H.W.; Giordano, B.; Kizos, T.; Macleod, C.; Olsen, L.S.; Spilanis, I. The European Regional Development Fund and island regions: An evaluation of the 2000–06 and 2007–13 programs. Isl. Stud. J. 2012, 7, 177–198. [Google Scholar]
- Godenau, D. An institutional approach to bordering in islands: The Canary Islands on the African-European migration routes. Isl. Stud. J. 2012, 7, 3–18. [Google Scholar]
- Budd, L. Territorial competition and globalisation: Scylla and Charbydis of European cities. Urban Stud. 1998, 35, 663–686. [Google Scholar] [CrossRef]
- Munda, G.; Saisana, M. Methodological considerations on regional sustainability assessment based on multicriteria and sensitivity analysis. Reg. Stud. 2011, 45, 261–276. [Google Scholar] [CrossRef]
- Rutkauskas, A.V. On the sustainability of regional competitiveness development considering risk. Technol. Econ. Dev. Econ. 2008, 14, 89–99. [Google Scholar] [CrossRef]
- Gallardo, R.; Garrido, D.; Haro, T.; Pedraza Ramos, E.; Ramos, F.; Sánchez, P. Desarrollo Rural Territorial: Metodología y Aplicación Para el Estudio de Casos; Ministerio de Medio Ambiente y Medio Rural y Marino: Madrid, Spain, 2011.
- Colletis-Wahl, K.; Pecqueur, B. Territories, development and specific resources: What analytical framework? Reg. Stud. 2001, 35, 449–459. [Google Scholar] [CrossRef]
- Deas, I.; Giordano, B. Conceptualising and measuring urban competitiveness in major English cities: An exploratory approach. Environ. Plan. A 2001, 33, 1411–1429. [Google Scholar] [CrossRef]
- Dögl, C.; Holtbrügge, D. Competitive advantage of German renewable energy firms in Russia. An empirical study based on Porter’s diamond. J. East Eur. Manag. Stud. 2010, 15, 34–58. [Google Scholar] [CrossRef]
- Dögl, C.; Holtbrügge, D.; Schuster, T. Competitive advantage of German renewable energy firms in India and China. An empirical study based on Porter’s diamond. Int. J. Emerg. Mark. 2012, 7, 191–214. [Google Scholar] [CrossRef]
- Huggins, R. Creating a U.K. competitiveness index: Regional and local benchmarking. Reg. Stud. 2003, 37, 89–96. [Google Scholar] [CrossRef]
- Moon, H.C.; Rugman, A.M.; Verbeke, A. A generalized double diamond approach to the global competitiveness of Korea and Singapore. Int. Bus. Rev. 1998, 7, 135–150. [Google Scholar] [CrossRef]
- Budd, L.; Hirmis, A. Conceptual framework for regional competitiveness. Reg. Stud. 2004, 3, 1015–1028. [Google Scholar] [CrossRef]
- Farrell, G.; Thirion, S.; Soto, P. La competitividad territorial: Construir una estrategia de desarrollo territorial con base en la experiencia de Leader; Observatorio Europeo: Munich, Germany, 1999; Volume 6. [Google Scholar]
- West, G.P., III; Bamford, C.E.; Marsden, J.W. Contrasting entrepreneurial economic development in emerging Latin American economies: Applications and extensions of resource-based theory. Entrep. Theory Pract. 2008, 32, 15–36. [Google Scholar] [CrossRef]
- Sánchez, A.; Melián, A.; García, J. Intellectual capital and sustainable development on islands: An application to the case of Gran Canaria. Reg. Stud. 2007, 41, 473–487. [Google Scholar] [CrossRef]
- West, G.P., III; Bamford, C.E. Creating a technology-based entrepreneurial economy: A resource based theory perspective. J. Technol. Transf. 2005, 30, 433–451. [Google Scholar] [CrossRef]
- Auerswald, P.D.; Branscomb, L.M. Valleys of death and Darwinian seas: Financing the invention to innovation transition in the United States. J. Technol. Transf. 2003, 28, 227–239. [Google Scholar] [CrossRef]
- Harmaakorpi, V. Regional Development Platform Method (RDPM. as a tool for regional innovation policy. Eur. Plan. Stud. 2006, 14, 1085–1104. [Google Scholar] [CrossRef]
- Silva, I. Desarrollo económico local y competitividad territorial en América Latina. Rev. CEPAL 2005, 85, 81–100. [Google Scholar] [CrossRef]
- Azena, L. Competitiveness as facilitator of territorial development. Econ. Sci. Rural Dev. Prim. Second. Prod. Consum. 2009, 19, 220–226. [Google Scholar]
- Kitson, M.; Martin, R.; Tyler, P. Regional competitiveness: An elusive yet key concept? Reg. Stud. 2004, 38, 991–999. [Google Scholar] [CrossRef]
- Jansson, J.; Waxell, A. Quality and regional competitiveness. Environ. Plan. A 2011, 43, 2237–2252. [Google Scholar] [CrossRef]
- Venkataraman, S. Regional transformation through technological entrepreneurship. J. Bus. Ventur. 2004, 19, 153–167. [Google Scholar] [CrossRef]
- Porter, M.E. The Competitive Advantage of Nations; The Free Press: New York, NY, USA, 1990. [Google Scholar]
- Gardiner, B.; Martin, R.; Tyler, P. Competitiveness, productivity and economic growth across the European regions. Reg. Stud. 2004, 38, 1045–1067. [Google Scholar] [CrossRef]
- Porter, M.E.; Ketels, C. Competitiveness: Moving to the Next Stage; Department of Trade and Industry: London, UK, 2003. [Google Scholar]
- Porter, M.E.; Delgado, M.; Ketels, C.; Stern, S. Moving to a new global competitiveness index. In The Global Competitiveness Report 2008–2009; Schwab, K., Porter, M.E., Eds.; World Economic Forum: Geneva, Switzerland, 2008; pp. 43–63. [Google Scholar]
- Rolínek, L.; Řehoř, P. Strategic management and measurement of competitiveness of regions on example of countries EU. J. Cent. Eur. Agric. 2008, 9, 17–22. [Google Scholar]
- Sala-i-Martin, X.; Blanke, J.; Drzeniek, M.; Geiger, T.; Mia, I.; Paua, F. The global competitiveness index: Prioritizing the economic policy agenda. In The Global Competitiveness Report 2008–2009; Schwab, K., Porter, M.E., Eds.; World Economic Forum: Geneva, Switzerland, 2008; pp. 3–42. [Google Scholar]
- Begg, I. Cities and competitiveness. Urban Stud. 1999, 36, 795–809. [Google Scholar] [CrossRef]
- Hobijn, B.; Franses, P.H. Are living standards converging? Struct. Chang. Econ. Dyn. 2001, 12, 171–200. [Google Scholar] [CrossRef]
- Nordhaus, W.D.; Tobin, J. Is Growth Obsolete? Columbia University Press: New York, NY, USA, 1972. [Google Scholar]
- Sen, A. Commodities and Capabilities; Elsevier Science: Amsterdam, The Netherlands, 1985; p. 6. [Google Scholar]
- Porter, M.E. On Competition; The Free Press: New York, NY, USA, 1998. [Google Scholar]
- Bakan, I.; Dogan, I.F. Competitiveness of the industries based on the Porter’s diamond model: An empirical study. Int. J. Res. Rev. Appl. Sci. 2012, 11, 2076–7366. [Google Scholar]
- Flores Ruiz, D. Factores de desarrollo turístico actual y futuro de los parques naturales andaluces de montaña. Rev. De Estud. Reg. 2010, 87, 157–185. [Google Scholar]
- Martin, R. A Study on the Factors of Regional Competitiveness: A Draft Final Report for the European Commission Directorate-General Regional Policy; University of Cambridge: Cambridge, UK, 2003; Available online: http://ec.europa.eu/regional_policy/ sources/docgener/studies/pdf/3cr/competitiveness.pdf (accessed on 26 December 2017).
- Bueno, C.; Carta, J.A. Wind powered pumped hydro storage systems, a means of increasing the penetration of renewable energy in the Canary Islands. Renew. Sustain. Energy Rev. 2006, 10, 312–340. [Google Scholar] [CrossRef]
- Aydin, N.Y.; Kentel, E.; Duzgun, S. GIS-based environmental assessment of wind energy systems for spatial planning: A case study from Western Turkey. Renew. Sustain. Energy Rev. 2010, 14, 364–373. [Google Scholar] [CrossRef]
- Aydin, N.Y.; Kentel, E.; Duzgun, S. GIS-based site selection methodology for hybrid renewable energy systems: A case study from Western Turkey. Energy Convers. Manag. 2013, 70, 90–106. [Google Scholar] [CrossRef]
- Belmonte, S.; Núñez, V.; Viramonte, J.G.; Franco, J. Potential renewable energy resources of the Lerma Valley, Salta, Argentina for its strategic territorial planning. Renew. Sustain. Energy Rev. 2009, 13, 1475–1484. [Google Scholar] [CrossRef]
- Ramachandra, T.; Shruthi, B. Wind energy potential mapping in Karnataka, India, using GIS. Energy Convers. Manag. 2005, 46, 1561–1578. [Google Scholar] [CrossRef]
- Tegou, L.; Polatidis, H.; Haralambopoulos, D. Environmental management framework for wind farm siting: Methodology and case study. J. Environ. Manag. 2010, 91, 2134–2147. [Google Scholar] [CrossRef]
- Azizi, A.; Malekmohammadi, B.; Jafari, H.R.; Nasiri, H.; Parsa, V.A. Land suitability assessment for wind power plant site selection using ANP-DEMATEL in a GIS environment: Case study of Ardabil province, Iran. Environ. Monit. Assess. 2014, 186, 6695–6709. [Google Scholar] [CrossRef]
- Haaren, R.; Fthenakis, V. GIS-based wind farm site selection using spatial multi-criteria analysis (SMCA): Evaluating the case for New York State. Renew. Sustain. Energy Rev. 2011, 15, 3332–3340. [Google Scholar] [CrossRef]
- Gorsevski, P.; Cathcart, S.C.; Mirzaei, G.; Jamali, M.; Ye, X.; Gomezdelcampo, E. A group-based spatial decision support system for wind farm site selection in Northwest Ohio. Energy Policy 2013, 55, 374–385. [Google Scholar] [CrossRef]
- Latinopoulos, D.; Kechagia, K. A GIS-based multi-criteria evaluation for wind farm site selection. A regional scale application in Greece. Renew. Energy 2015, 78, 550–560. [Google Scholar] [CrossRef]
- Rezaian, S.; Jozi, S.A. Application of multi criteria decision-making technique in site selection of wind farm—A case study of Northwestern Iran. J. Indian Soc. Remote Sens. 2016, 44, 803–809. [Google Scholar] [CrossRef]
- Baban, S.; Parry, T. Developing and applying a GIS-assisted approach to locating wind farms in the UK. Renew. Energy 2001, 24, 59–71. [Google Scholar] [CrossRef]
- Yue, C.D.; Wang, S.S. GIS-based evaluation of multifarious local renewable energy sources: A case study of the Chigu Area of Southwestern Taiwan. Energy Policy 2006, 34, 730–742. [Google Scholar] [CrossRef]
- Yue, C.D.; Yang, M.H. Exploring the potential of wind energy for a coastal state. Energy Policy 2009, 37, 3925–3940. [Google Scholar] [CrossRef]
- Höfer, T.; Sunak, Y.; Siddique, H.; Madlener, R. Wind farm siting using a spatial Analytic Hierarchy Process approach: A case study of the Städteregion Aachen. Appl. Energy 2016, 163, 222–243. [Google Scholar] [CrossRef]
- Saaty, T. A scaling method for priorities in hierarchical structures. J. Math. Psychol. 1977, 15, 234–281. [Google Scholar] [CrossRef]
- Kablan, M.M. Decision support for energy conservation promotion: An analytic hierarchy process approach. Energy Policy. 2004, 32, 1151–1158. [Google Scholar] [CrossRef]
- Voogd, H. Multicriteria Evaluation for Urban and Regional Planning; Pion: London, UK, 1983. [Google Scholar]
- Nair, A.; Ahlstrom, D.; Filer, L. Localized advantage in a global economy: The case of Bangalore. Thunderbird Int. Bus. Rev. 2007, 49, 591–618. [Google Scholar] [CrossRef]
- Kutschke, A.; Rese, A.; Baier, D. The effects of locational factors on the performance of innovation networks in the German energy sector. Sustainability 2016, 8, 1281. [Google Scholar] [CrossRef]
- Sledge, S. Does Porter’s diamond hold in the global automotive industry? Adv. Compet. Res. 2005, 13, 22–32. [Google Scholar]
- Santos, D. Innovation and territory. Which strategies to promote regional innovation systems in Portugal. Eur. Urban Reg. Stud. 2000, 7, 147–157. [Google Scholar] [CrossRef]
- Clarkson, M.; Fink, M.; Kraus, S. Industrial clusters as a factor for innovative drive—In regions of transformation and structural change: A comparative analysis of East Germany and Poland. J. East Eur. Manag. Stud. 2007, 12, 340–364. [Google Scholar] [CrossRef]
- Anselin, L.; Varga, A.; Acs, Z.J. Local geographic spillovers between university research and high technology innovations. J. Urban Econ. 1997, 42, 422–448. [Google Scholar] [CrossRef]
- Audretsch, D.B.; Hülsbeck, M.; Lehmann, E. Regional competitiveness, university spillovers, and entrepreneurial activity. Small Bus. Econ. 2012, 39, 587–601. [Google Scholar] [CrossRef]
- Corsatea, T.D. Localised knowledge, local policies and regional innovation activity for renewable energy technologies: Evidence from Italy. Pap. Reg. Sci. 2016, 95, 443–466. [Google Scholar] [CrossRef]
- Trullén, J.; Callejón, M. Las agrupaciones de empresas innovadoras. Mediterráneo Económico 2008, 13, 459–479. [Google Scholar]
- Schmitz, H. Global competition and local cooperation: Success and failure in the Sinos Valley, Brazil. World Dev. 1999, 27, 1627–1650. [Google Scholar] [CrossRef]
- Kirat, T.; Lung, Y. Innovation and proximity. Territories as loci of collective learning processes. Eur. Urban Reg. Stud. 1999, 6, 27–38. [Google Scholar] [CrossRef]
- Eisingerich, A.B.; Bell, S.; Tracey, P. How can clusters sustain performance? The role of network strength, network openness, and environmental uncertainty. Res. Policy 2010, 39, 239–253. [Google Scholar] [CrossRef]
- Ghisi, F.A.; Martinelli, D.P. Systemic view of interorganisational relationships: An analysis of business networks. Syst. Pract. Action Res. 2006, 19, 461–473. [Google Scholar] [CrossRef]
- O’Donnell, A.; Gilmore, A.; Cummins, D.; Carson, D. The network construct in entrepreneurship research: A review and critique. Manag. Decis. 2001, 39, 749–760. [Google Scholar] [CrossRef]
- Mitchell, A. The ESRI Guide to GIS Analysis: Spatial Measurements & Statistics; ESRI Press: Redlands, CA, USA, 2005. [Google Scholar]
- Beise, M.; Rennings, K. Lead markets and regulation: A framework for analyzing the international diffusion of environmental innovations. Ecol. Econ. 2005, 52, 5–17. [Google Scholar] [CrossRef]
- Wüstenhagen, R.; Bilharz, M. Green energy market development in Germany: Effective public policy and emerging customer demand. Energy Policy 2006, 34, 1681–1696. [Google Scholar] [CrossRef]
- Canary Islands Government. Revisión PECAN 2006–2015. Consejería de Empleo, Industria y Comercio. Gobierno de Canarias. Canarias, Spain. 2012. Available online: http://www.gobcan.es/ceic/energia/pecan/DOCUMENTO_REVISION_PECAN2006.pdf (accessed on 26 December 2017).
- Oikonomou, E.K.; Kilias, V.; Goumas, A.; Rigopoulos, A.; Karakatsani, E.; Damasiotis, M.; Papastefanakis, D.; Marini, N. Renewable energy sources (RES. projects and their barriers on a regional scale: The case study of wind parks in the Dodecanese islands Greece. Energy Policy 2009, 37, 4874–4883. [Google Scholar] [CrossRef]
- Perez, Y.; Ramos Real, F.J. How to make a European integrated market in small and isolated electricity systems? The case of the Canary Islands. Energy Policy 2008, 36, 4159–4167. [Google Scholar] [CrossRef]
- Veigas, M.; Iglesias, G. Potential of a hybrid offshore farm for the island of Fuerteventura. Energy Convers. Manag. 2014, 86, 300–308. [Google Scholar] [CrossRef]
- Praene, J.P.; David, M.; Sinama, F.; Morau, D.; Marc, O. Renewable energy: Progressing towards a net zero energy island, the case of Reunion Island. Renew. Sustain. Energy Rev. 2012, 16, 426–442. [Google Scholar] [CrossRef]


| Factors | ||
|---|---|---|
| Wind speed | Less than 4 m/s = 0 | More than 10 m/s = 1 |
| Slopes | More than 60% = 0 | Less than 10% = 1 |
| Visual impact | Visible from more than 4 villages = 0 | Visible from 0 villages = 1 |
| Proximity to electricity lines | More than 2000 m = 0 | Less than 300 m = 1 |
| Land use | Incompatible area = 0 | Compatible area = 1 |
| Proximity to urban areas | More than 5000 m = 0 | Less than 1000 = 1 |
| Proximity to road access | More than 2000 m = 0 | Less than 300 m = 1 |
| Constraints | ||
| Protected areas | Perimeter | |
| Water reservoirs | Perimeter | |
| Airports | Perimeter | |
| Roads | Width | |
| Ravines | 5 m from public water domain | |
| Remote housing | A perimeter of the built-up areas | |
| Population area | Perimeter | |
| Main roads | 20 m from the center axis | |
| Sea–land limits | 100 m inland from the shore | |
| Military areas | Perimeter | |
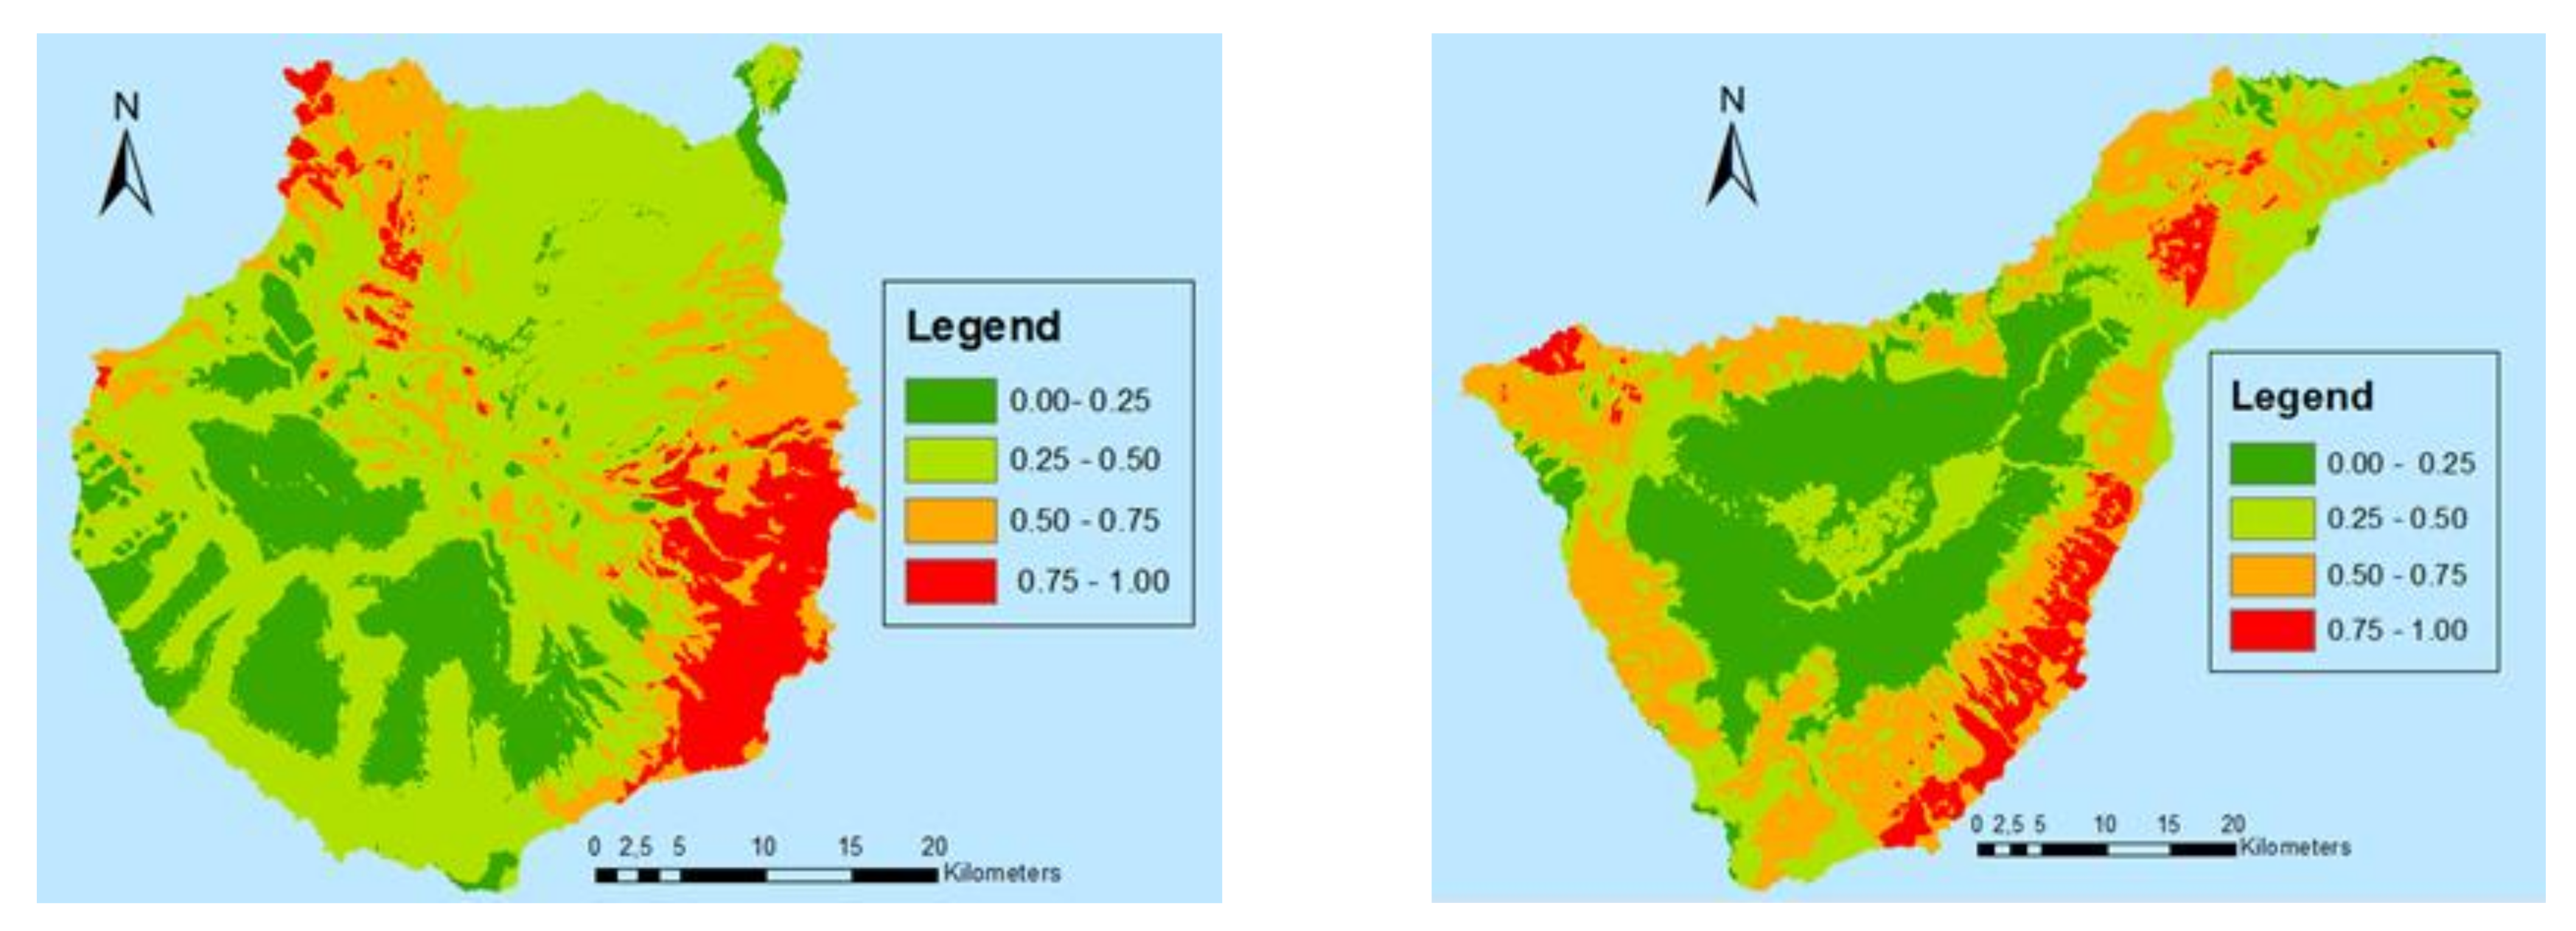
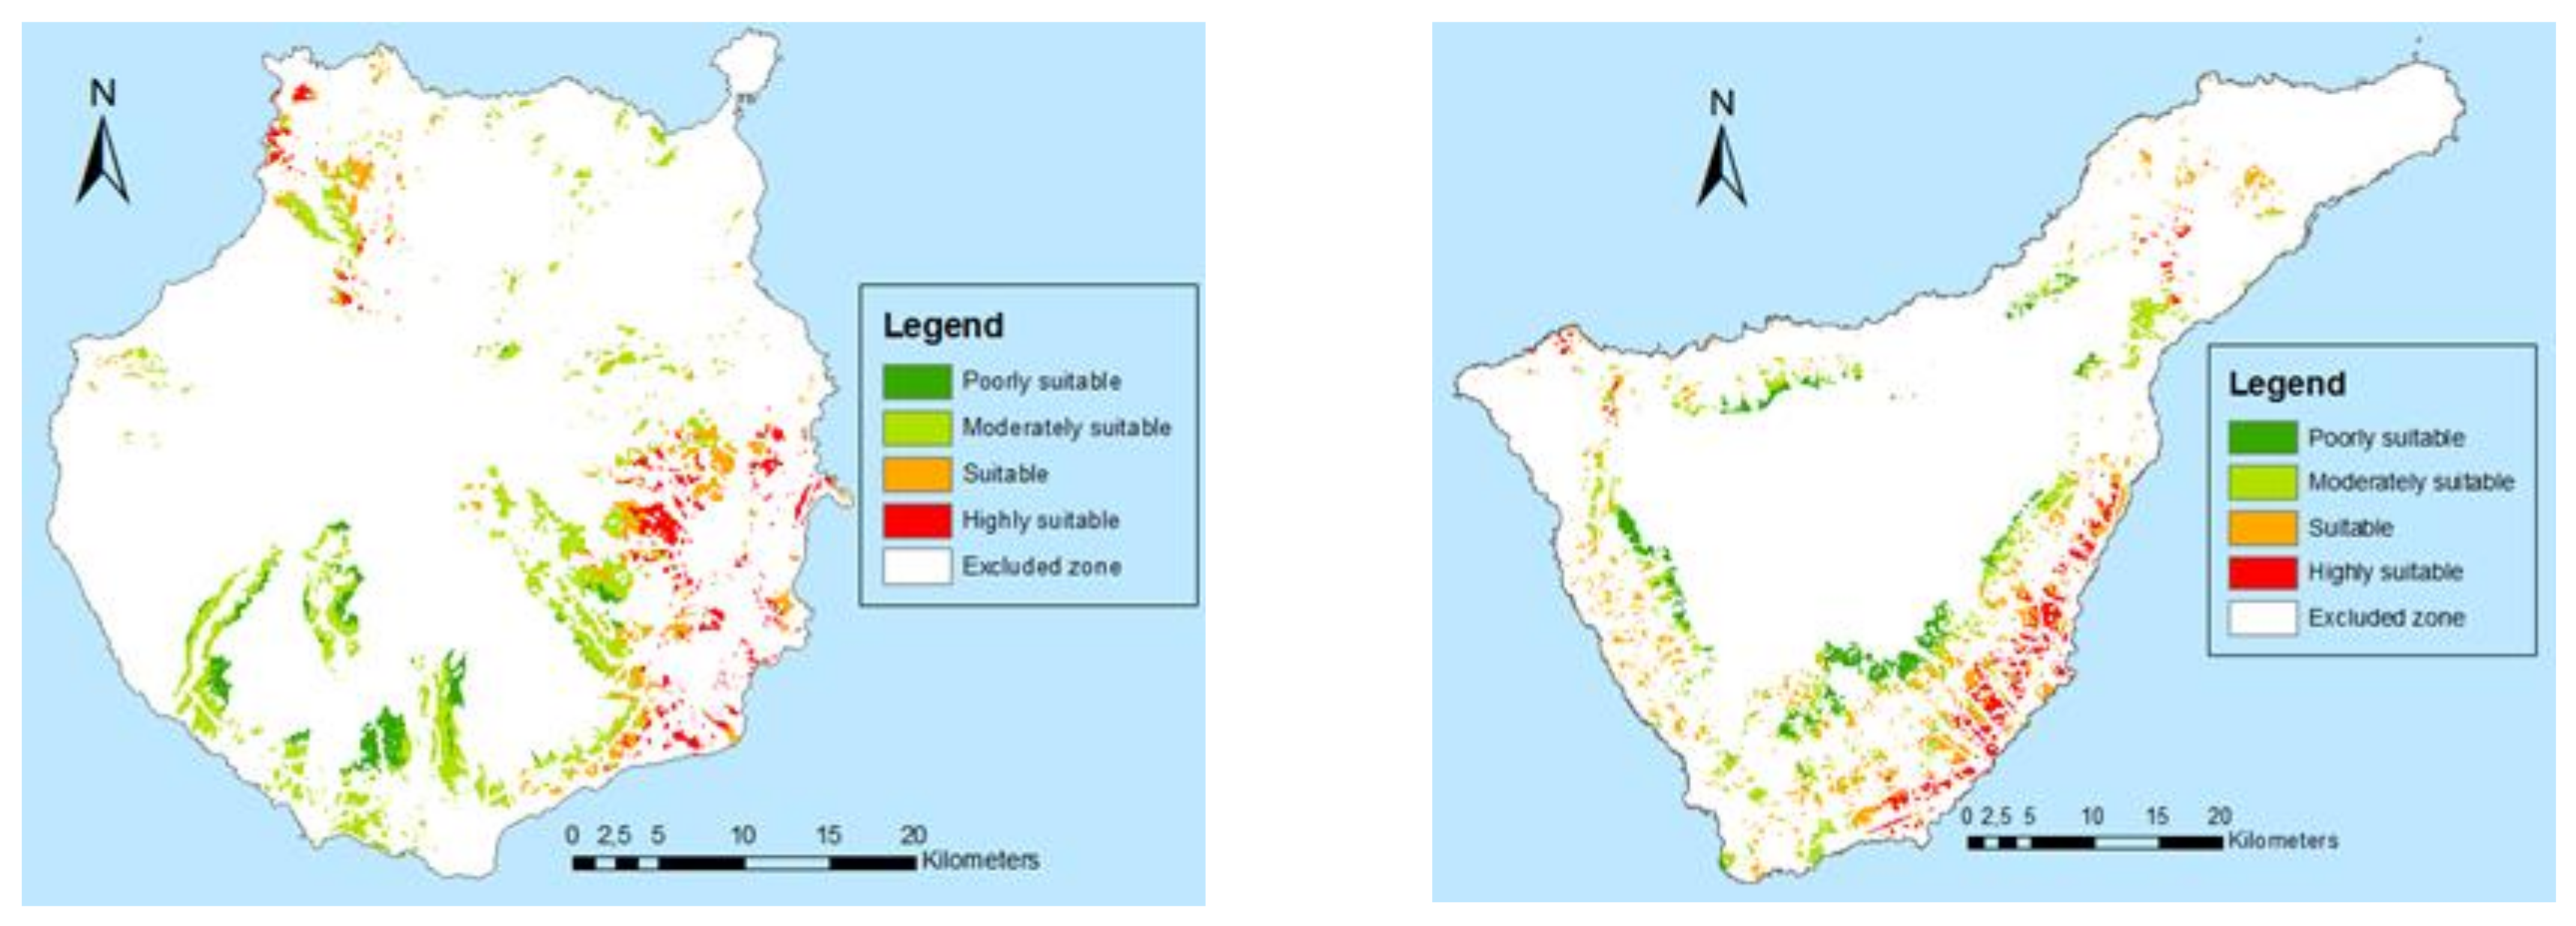
| GC | TF | ||||
|---|---|---|---|---|---|
| Suitability | Pixel value | Area (ha) | (%) | Area (ha) | (%) |
| Poorly suitable | 0.00–0.25 | 1751.13 | 11.80 | 3365.23 | 22.68 |
| Moderately suitable | 0.25–0.50 | 8320.31 | 56.08 | 5912.66 | 32.12 |
| Suitable | 0.50–0.75 | 2851.07 | 19.22 | 6421.49 | 34.88 |
| Highly suitable | 0.75–1.00 | 1914.55 | 12.90 | 2710.34 | 14.72 |
| Total | 14,837.06 | 100.00 | 18,409.72 | 100.00 | |
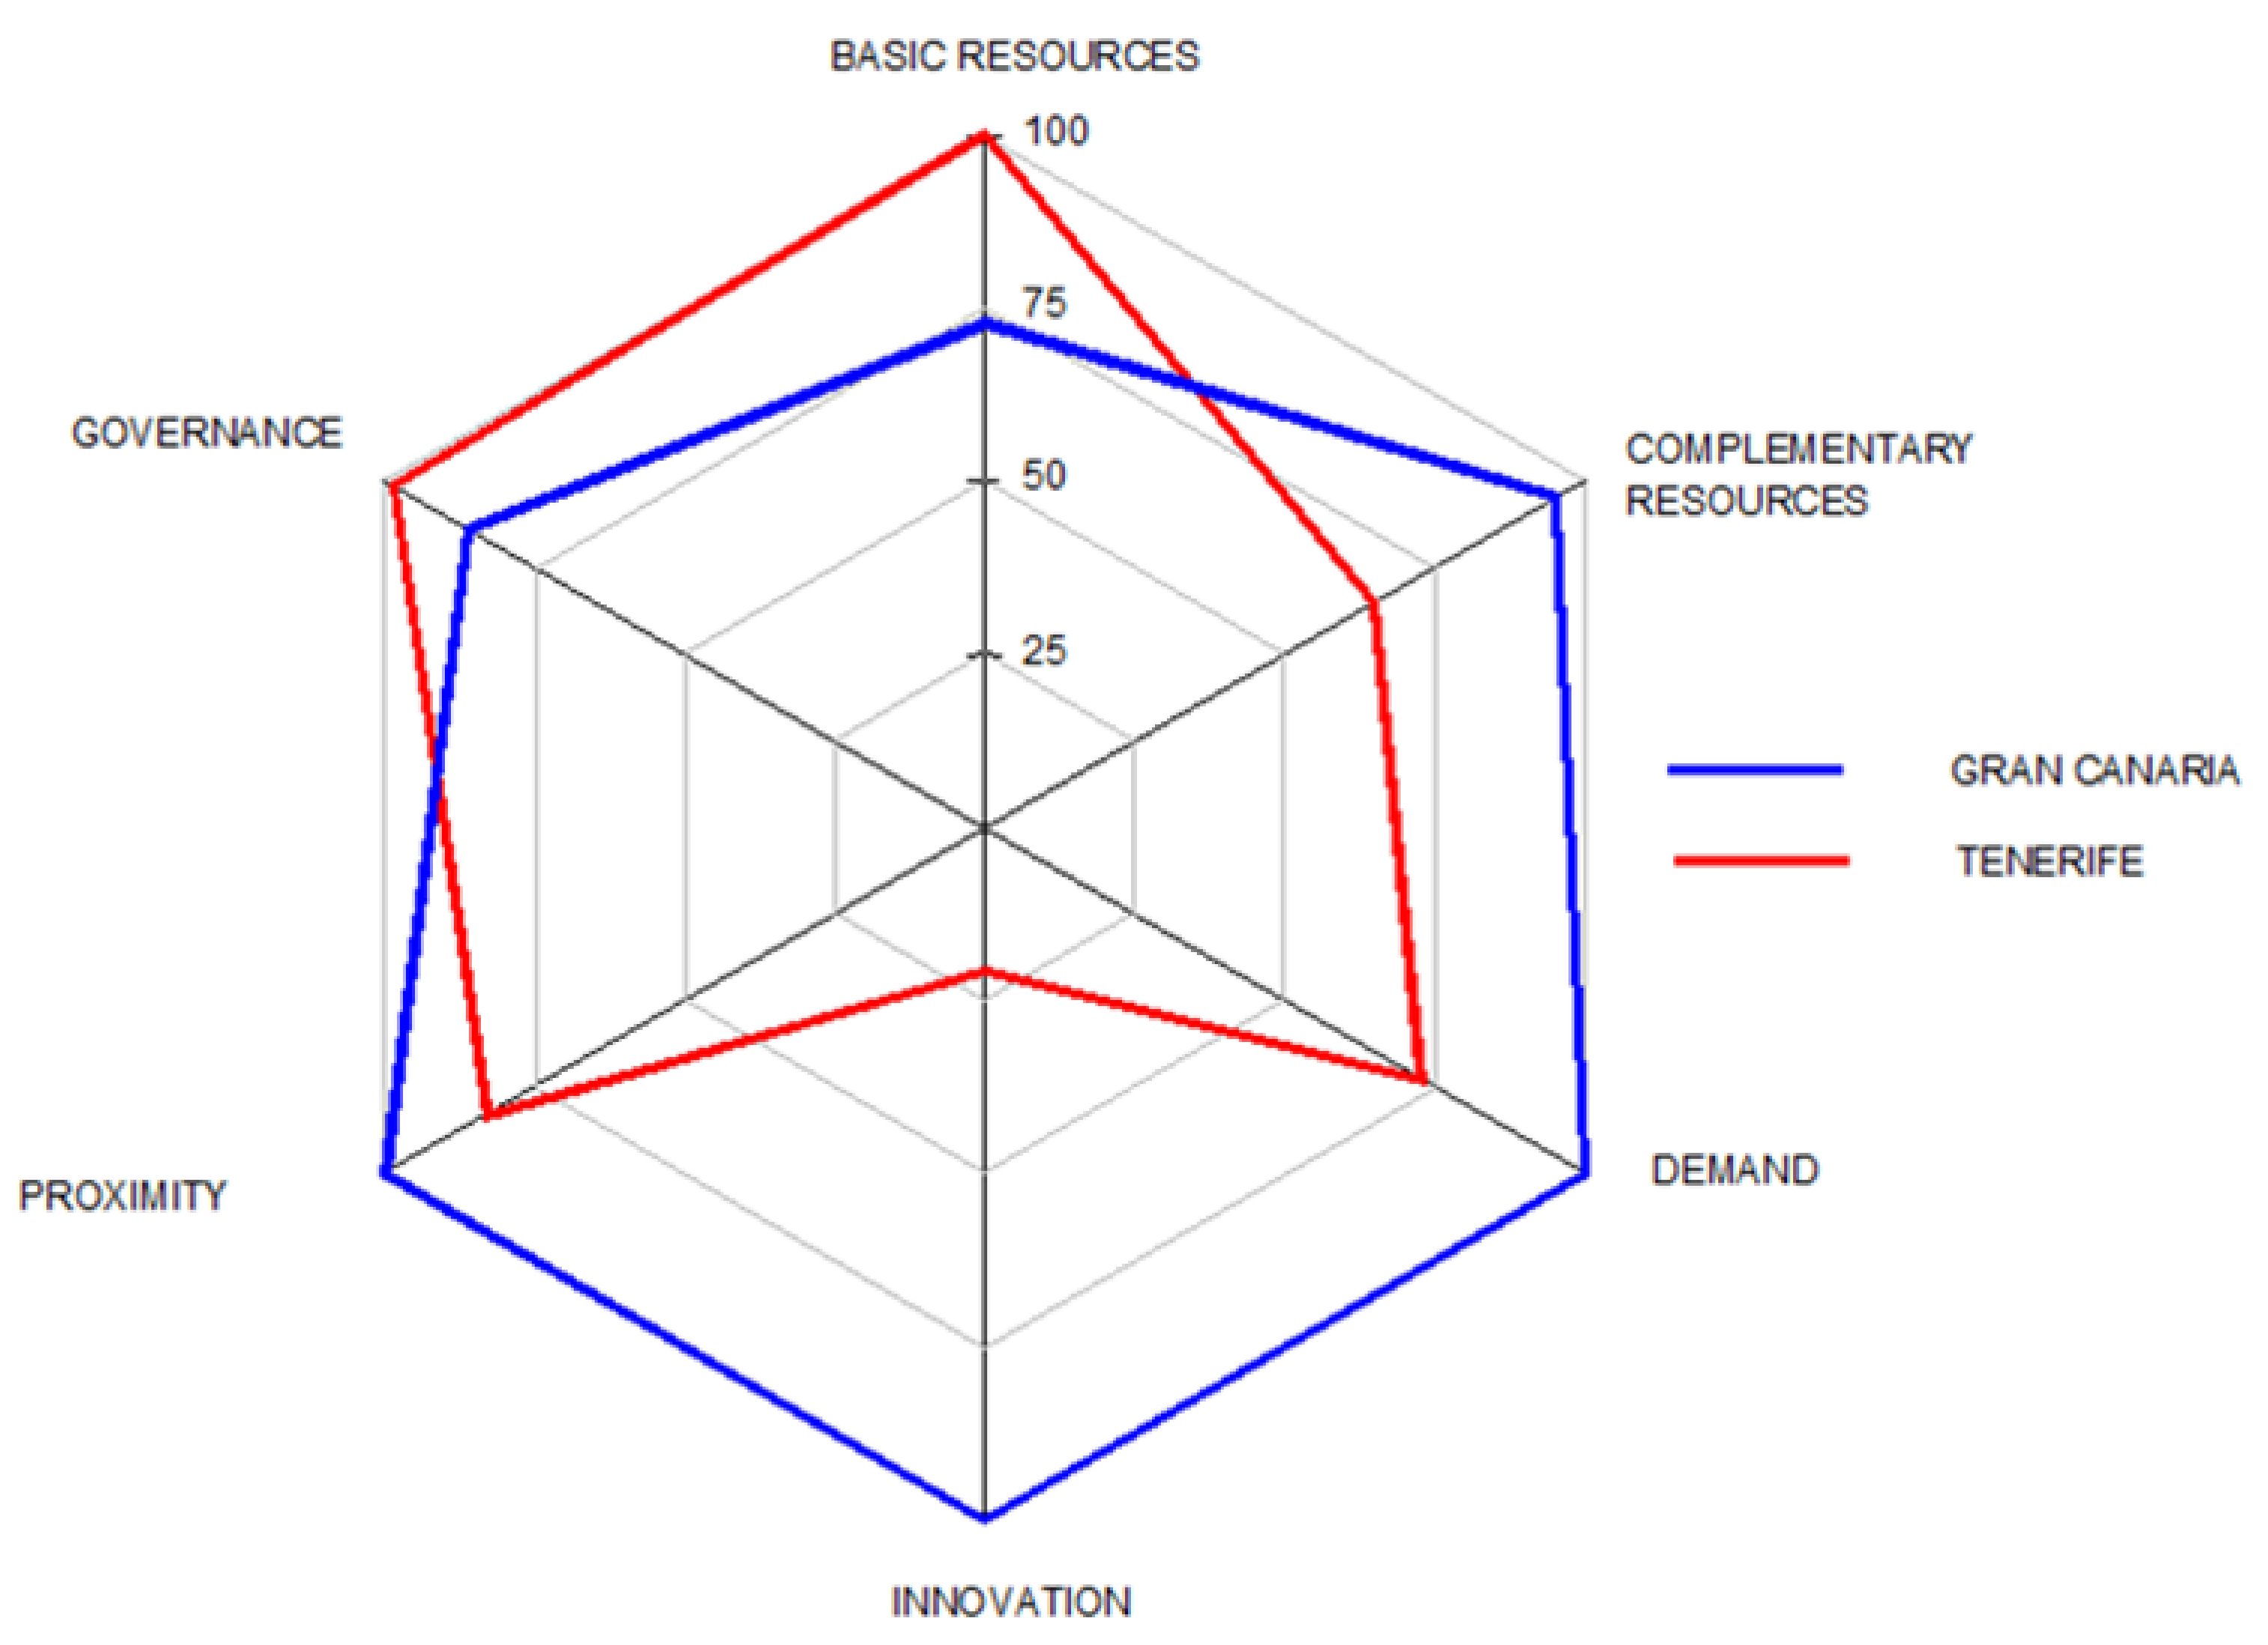
| Variables | GC | TF | GC | TF | Weights (%) | GC | TF |
|---|---|---|---|---|---|---|---|
| Basic resources | |||||||
| ATR | 6473 | 8853 | 73.11 | 100.00 | 100 | 73.11 | 100.00 |
| Complementary resources | |||||||
| Market growth | 3.44 | 4.95 | 69.49 | 100.00 | 15 | 95.42 | 64.84 |
| Human capital1 | 30.9 | 19.3 | 100.00 | 62.46 | 25 | ||
| Human capital2 | 312 | 178 | 100.00 | 57.05 | 60 | ||
| Potential of resources: | 168.53 | 164.84 | |||||
| Capabilities | |||||||
| Demand | |||||||
| Sophisticated demand1 | 6.64 | 3.86 | 100.00 | 58.13 | 60 | 100.00 | 72.84 |
| Sophisticated demand2 | 33.5 | 32.7 | 100.00 | 97.61 | 30 | ||
| Sophisticated demand3 | 61.12 | 53.06 | 100.00 | 86.81 | 10 | ||
| Innovation | |||||||
| Innovative behaviour1 | 8 | 1 | 100.00 | 12.50 | 55 | 100.00 | 20.62 |
| Innovative behaviour2 | 18 | 3 | 100.00 | 16.67 | 15 | ||
| Innovative behaviour3 | 16 | 6 | 100.00 | 37.50 | 30 | ||
| Proximity | |||||||
| Firms’ concentration | 1.86 | 1.33 | 100.00 | 71.29 | 30 | 100.00 | 82.74 |
| Business networks | 3.32 | 2.91 | 100.00 | 87.65 | 70 | ||
| Governance | |||||||
| Investment effort | 30.01 | 38.09 | 78.79 | 100.00 | 60 | 86.07 | 98.58 |
| Cooperation1 | 1.82 | 2.00 | 91.00 | 100.00 | 40 | ||
| Cooperation2 | 2.00 | 1.90 | 100.00 | 95.00 | |||
| Cooperation3 | 2.12 | 2.00 | 100.00 | 94.34 | |||
| Potential of capabilities: | 386.07 | 274.78 | |||||
| Total potential: | 554.60 | 439.62 | |||||
| GC = Gran Canaria; TF = Tenerife | 100 | 79.26 | |||||
| GC | TF | GC | TF | |
|---|---|---|---|---|
| Polygon area | 22,245.3 | 14,040.4 | 100 | 63.12 |
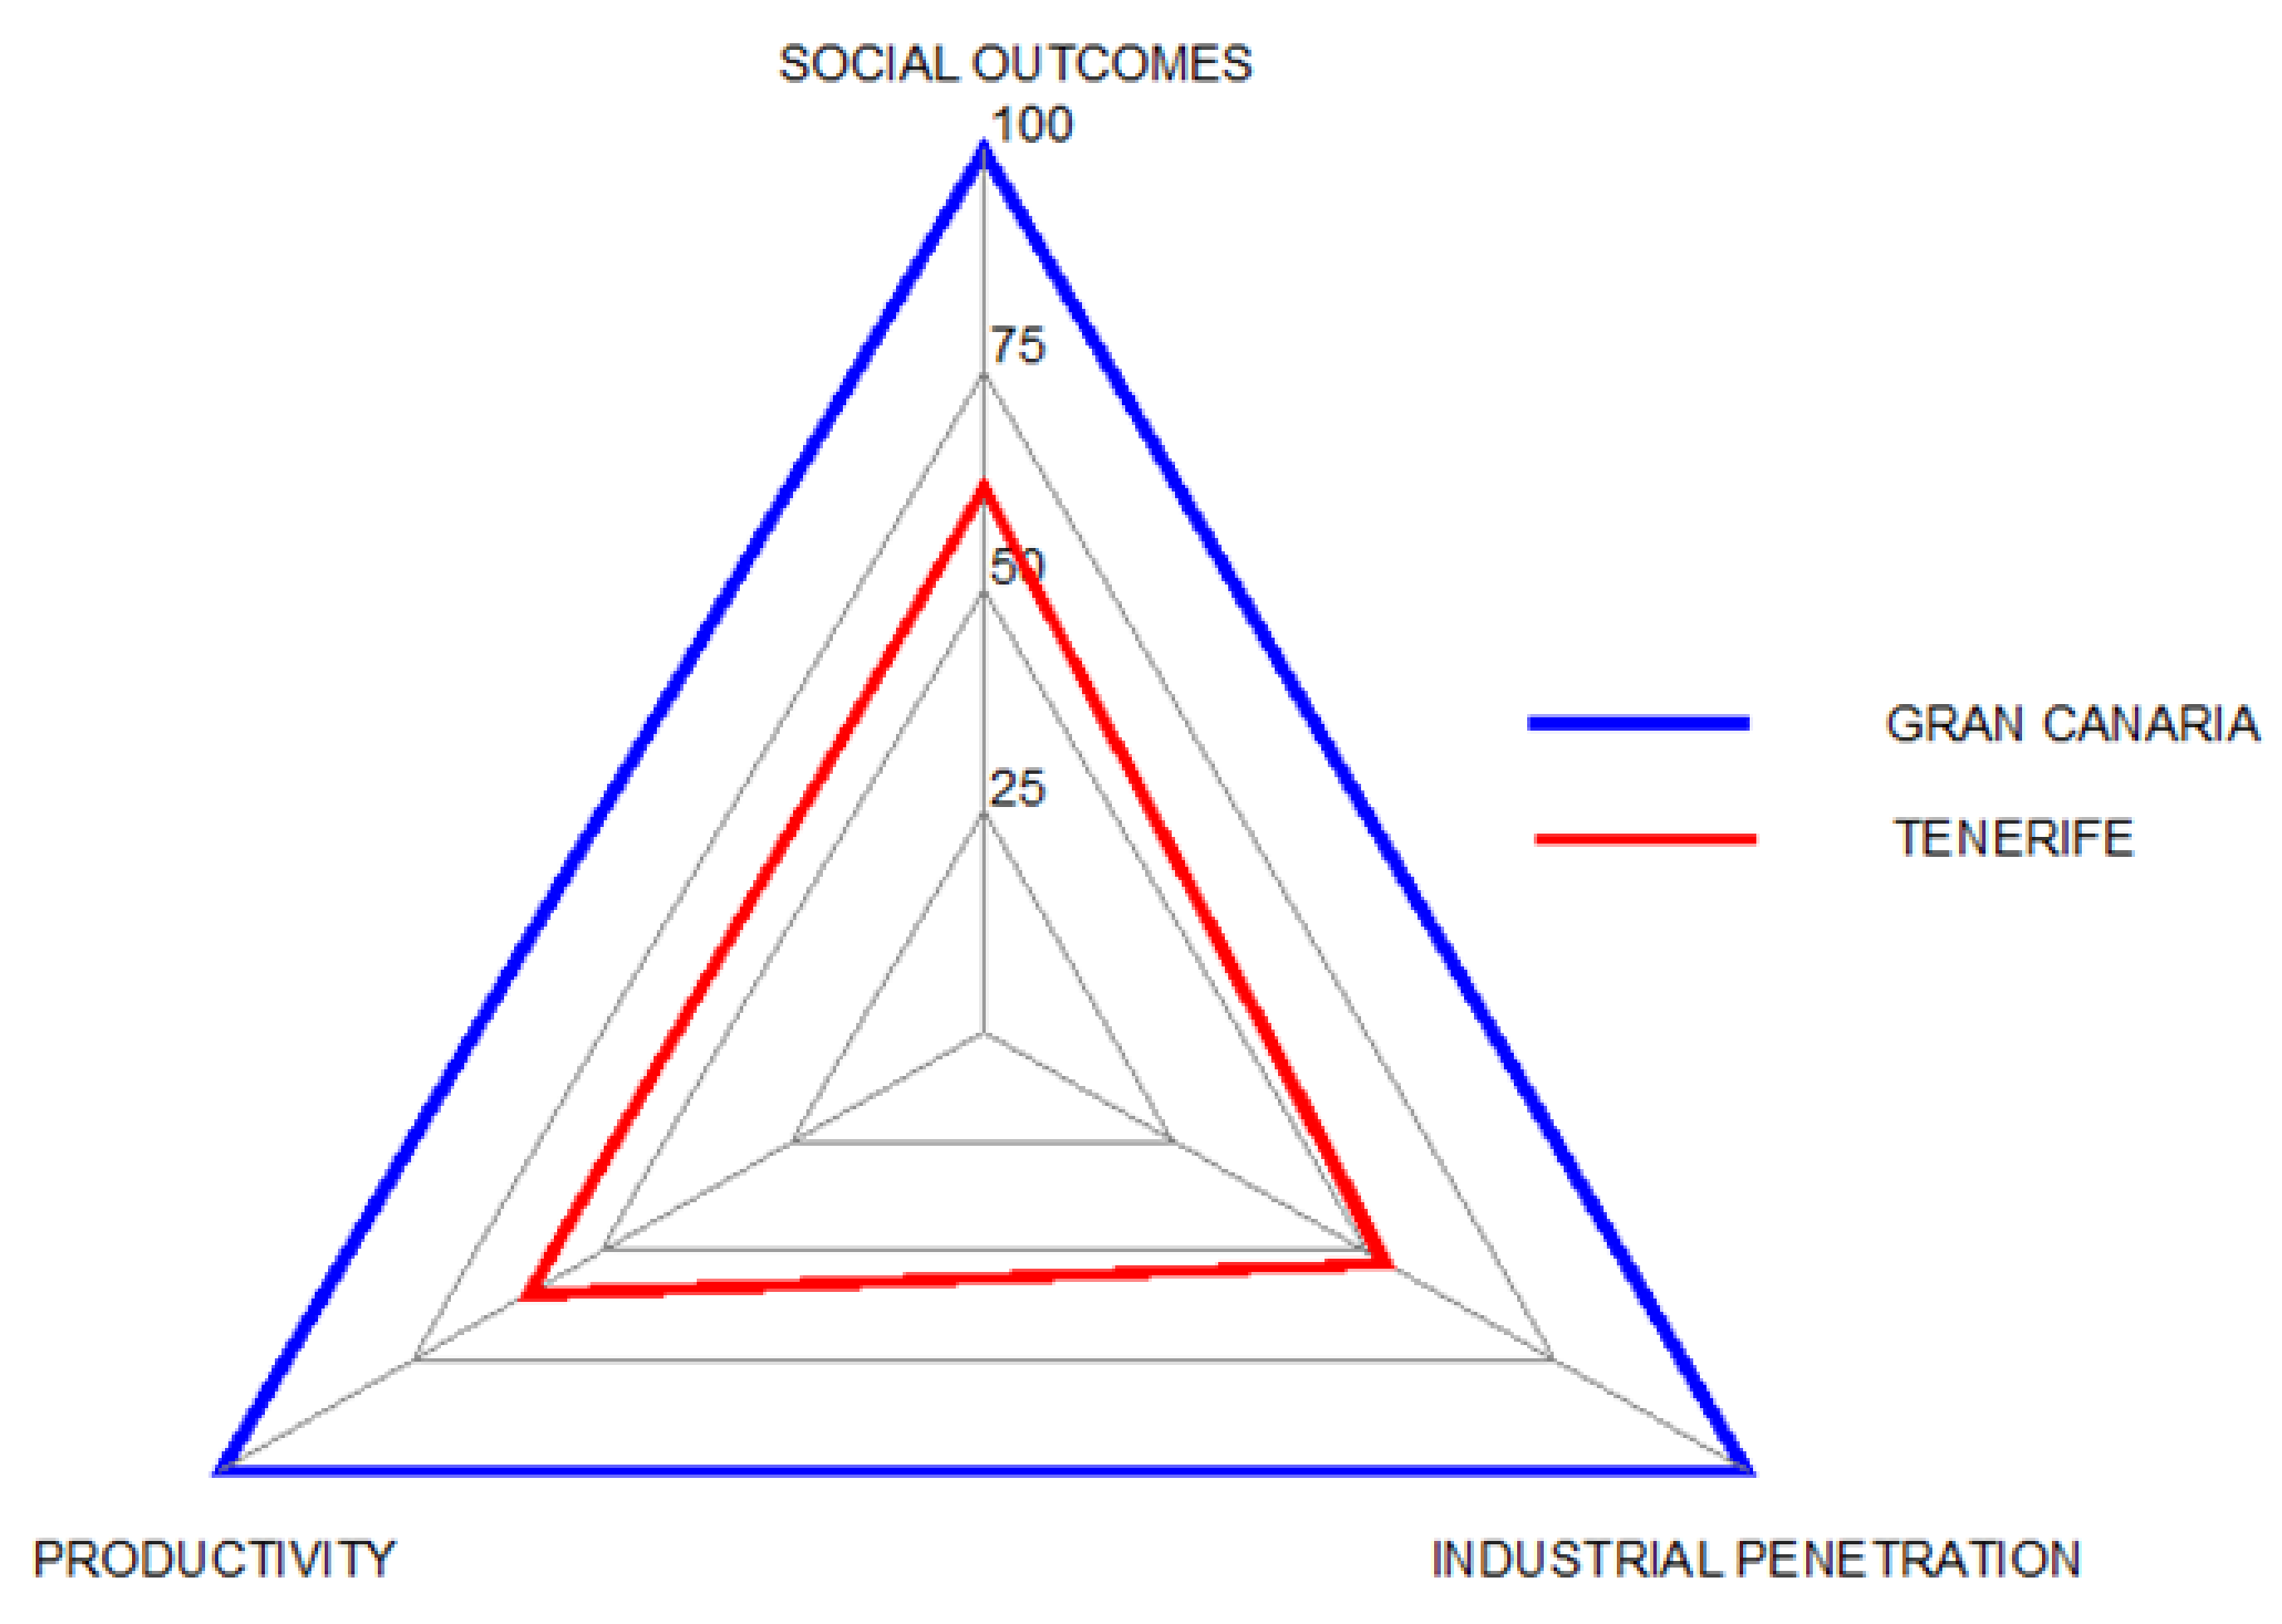
| Variables | GC | TF | GC | TF | Weights (%) | GC | TF |
|---|---|---|---|---|---|---|---|
| Productivity1 | 2.52 | 2.10 | 100.00 | 83.26 | 50 | 100.00 | 59.67 |
| Productivity2 | 18.29 | 6.61 | 100.00 | 36.11 | 20 | ||
| Productivity3 | 5.74 | 2.07 | 100.00 | 36.06 | 30 | ||
| Social outcomes1 | 167.21 | 60.39 | 100.00 | 36.11 | 60 | 100.00 | 61.67 |
| Social outcomes2 | 5 | 5 | 100.00 | 100.00 | 40 | ||
| Industrial penetration1 | 0.13 | 0.08 | 100.00 | 61.54 | 50 | 100.00 | 52.77 |
| Industrial penetration2 | 92.76 | 40.81 | 100.00 | 44.00 | 50 | ||
| Total outcomes | 300.00 | 174.11 | |||||
| GC = Gran Canaria; TF = Tenerife | 100.00 | 58.04 | |||||
| GC | TF | GC | TF | |
|---|---|---|---|---|
| Polygon area | 12,990.4 | 4366.1 | 100 | 33.61 |
© 2019 by the authors. Licensee MDPI, Basel, Switzerland. This article is an open access article distributed under the terms and conditions of the Creative Commons Attribution (CC BY) license (http://creativecommons.org/licenses/by/4.0/).
Share and Cite
Santana-Sarmiento, F.; Álamo-Vera, F.R.; De Saá-Pérez, P. A Resource-Based View of Competitiveness in the Wind Energy Sector: The Case of Gran Canaria and Tenerife. Appl. Sci. 2019, 9, 1263. https://doi.org/10.3390/app9061263
Santana-Sarmiento F, Álamo-Vera FR, De Saá-Pérez P. A Resource-Based View of Competitiveness in the Wind Energy Sector: The Case of Gran Canaria and Tenerife. Applied Sciences. 2019; 9(6):1263. https://doi.org/10.3390/app9061263
Chicago/Turabian StyleSantana-Sarmiento, Francisco, Francisca Rosa Álamo-Vera, and Petra De Saá-Pérez. 2019. "A Resource-Based View of Competitiveness in the Wind Energy Sector: The Case of Gran Canaria and Tenerife" Applied Sciences 9, no. 6: 1263. https://doi.org/10.3390/app9061263
APA StyleSantana-Sarmiento, F., Álamo-Vera, F. R., & De Saá-Pérez, P. (2019). A Resource-Based View of Competitiveness in the Wind Energy Sector: The Case of Gran Canaria and Tenerife. Applied Sciences, 9(6), 1263. https://doi.org/10.3390/app9061263